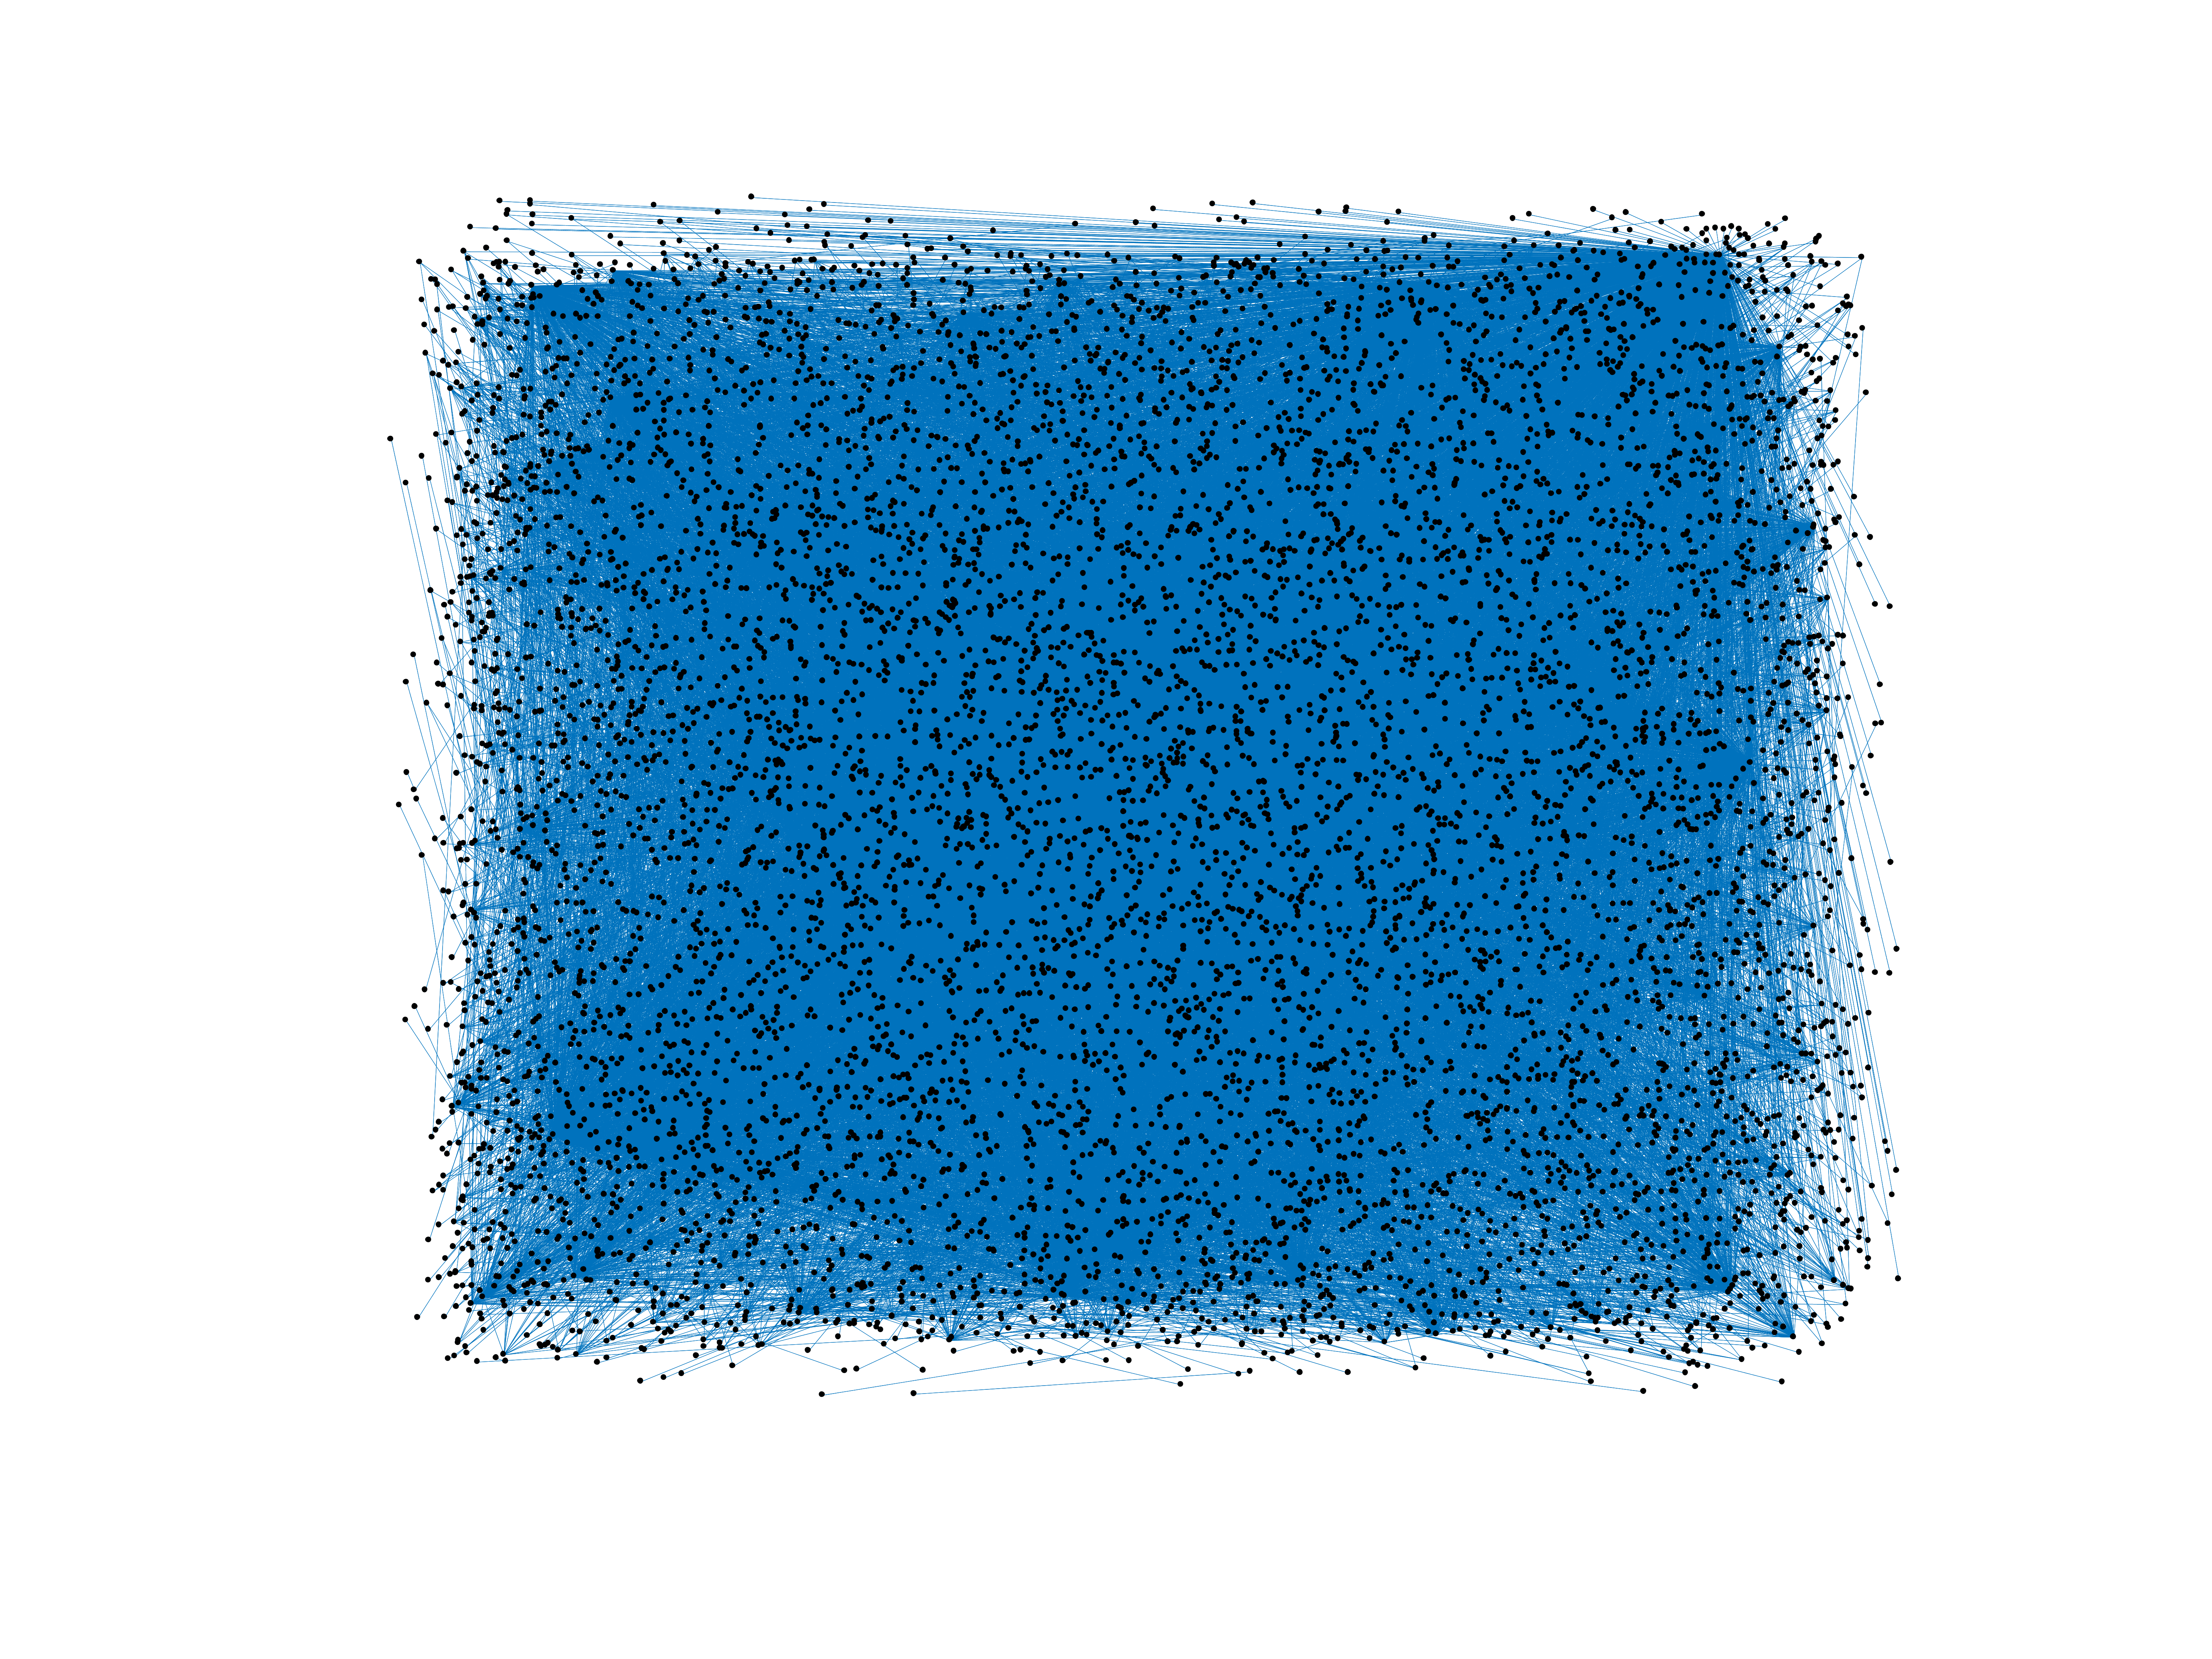
Wikipedia edits (lo)
This is the bipartite edit network of the Lao Wikipedia. It contains users and
pages from the Lao Wikipedia, connected by edit events. Each edge represents an
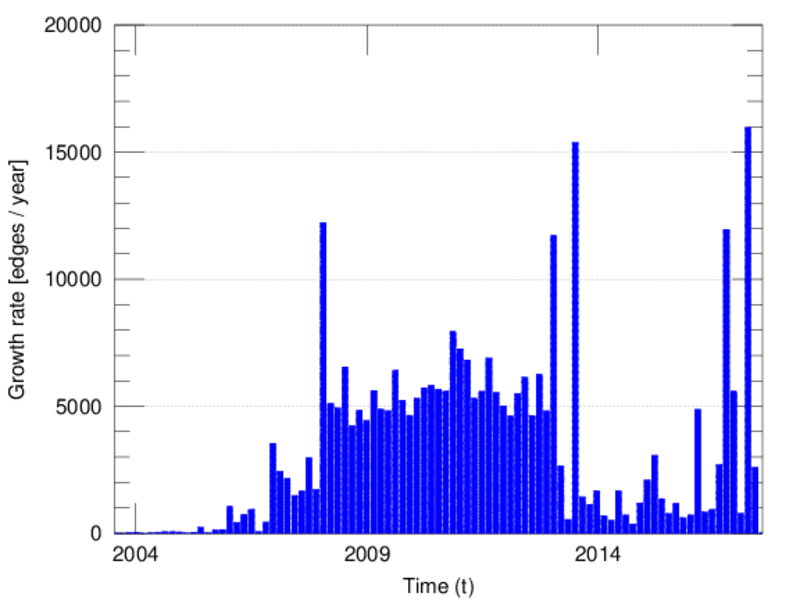
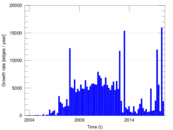
edit. The dataset includes the timestamp of each edit.
Metadata
Statistics
| Size | n = | 8,990
|
| Left size | n1 = | 1,075
|
| Right size | n2 = | 7,915
|
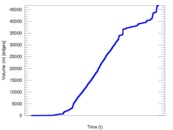
| Volume | m = | 46,786
|
| Unique edge count | m̿ = | 21,343
|
| Wedge count | s = | 5,439,642
|
| Claw count | z = | 2,036,746,001
|
| Cross count | x = | 795,013,871,684
|
| Square count | q = | 6,040,444
|
| 4-Tour count | T4 = | 70,134,222
|
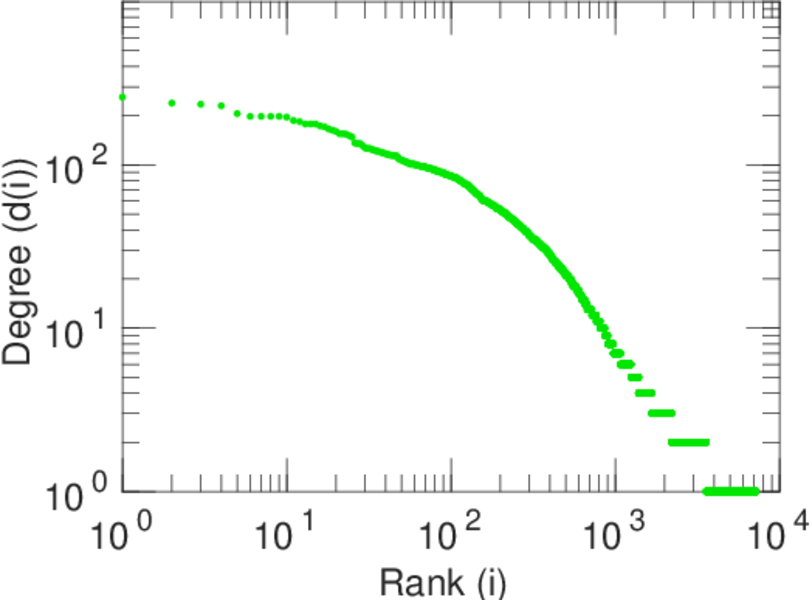
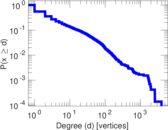
| Maximum degree | dmax = | 3,962
|
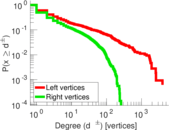
| Maximum left degree | d1max = | 3,962
|
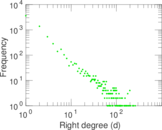
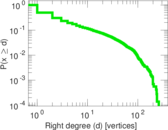
| Maximum right degree | d2max = | 260
|
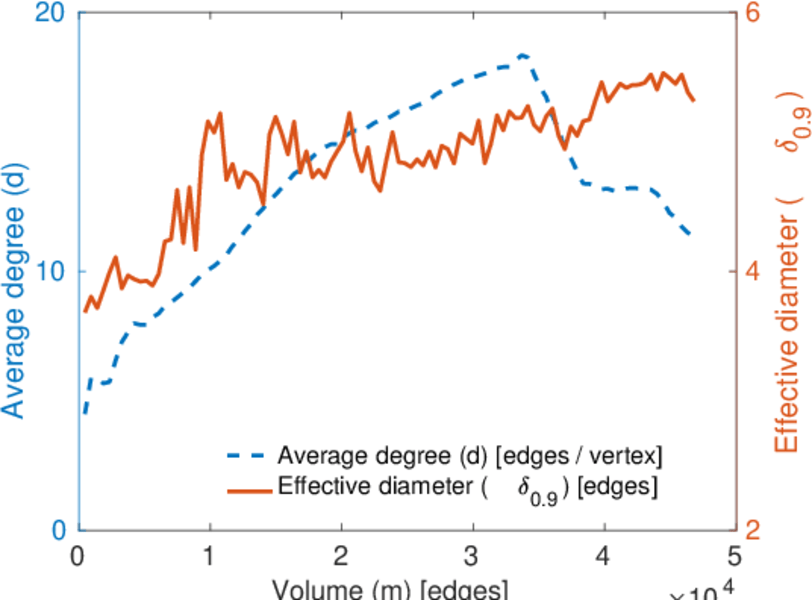
| Average degree | d = | 10.408 5
|
| Average left degree | d1 = | 43.521 9
|
| Average right degree | d2 = | 5.911 05
|
| Fill | p = | 0.002 508 40
|
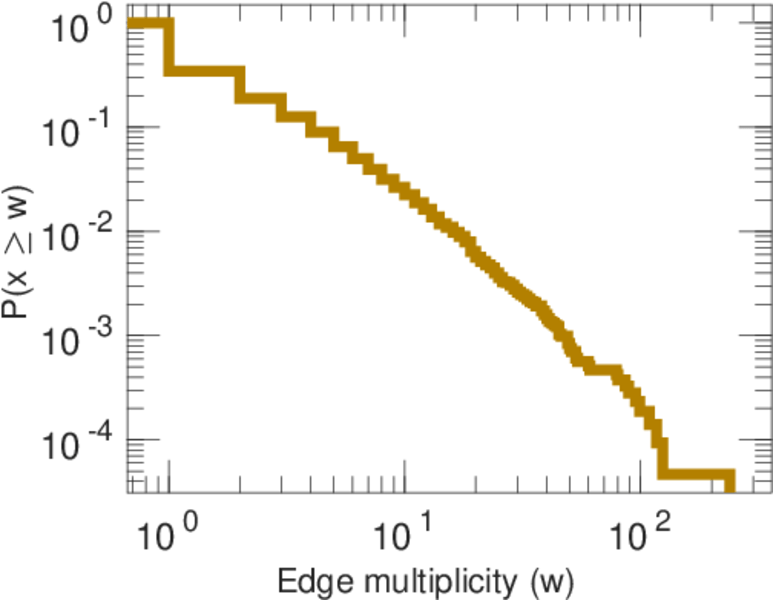
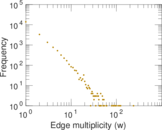
| Average edge multiplicity | m̃ = | 2.192 10
|
| Size of LCC | N = | 7,495
|
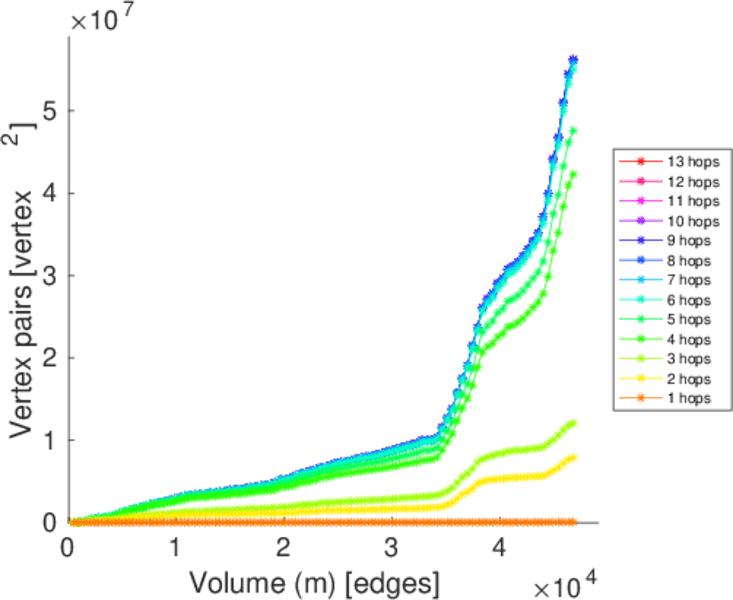
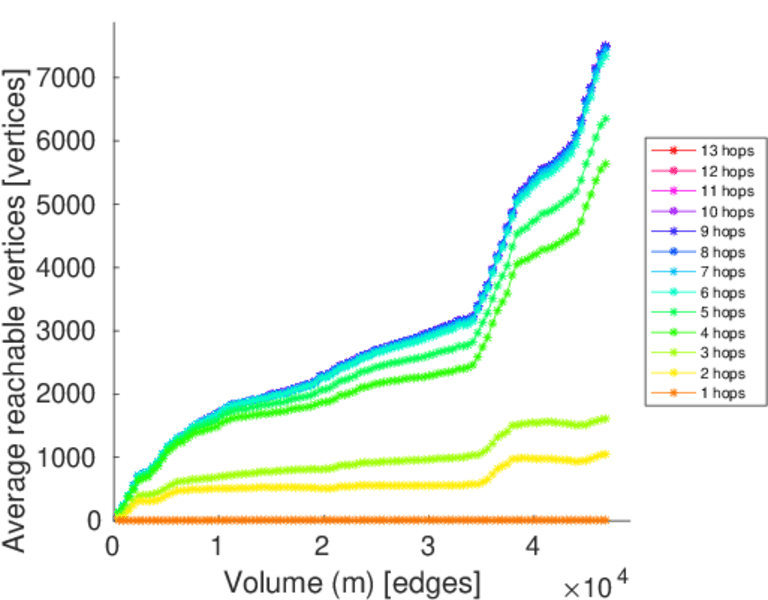
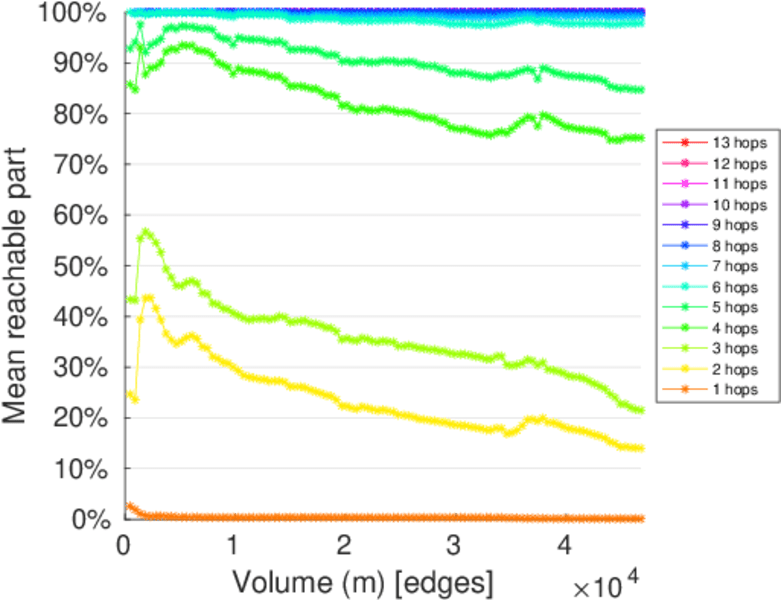
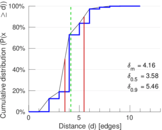
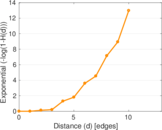
| Diameter | δ = | 13
|
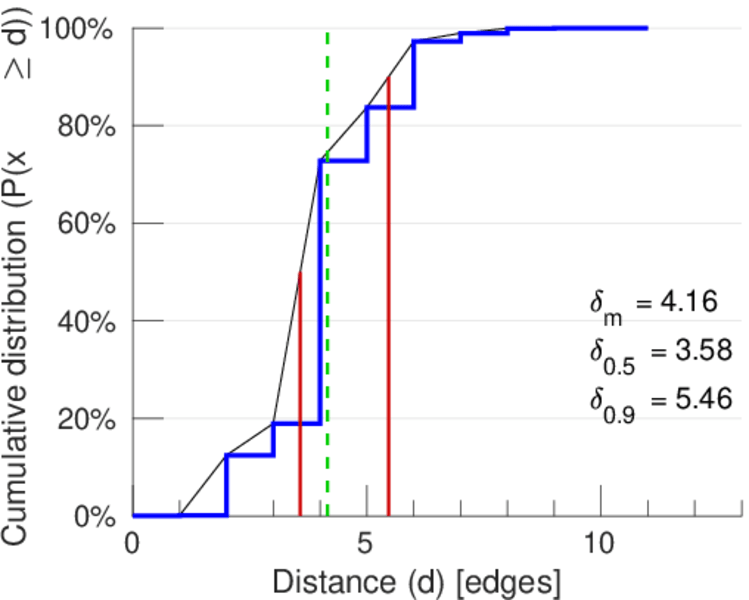
| 50-Percentile effective diameter | δ0.5 = | 3.576 64
|
| 90-Percentile effective diameter | δ0.9 = | 5.463 55
|
| Median distance | δM = | 4
|
| Mean distance | δm = | 4.159 14
|
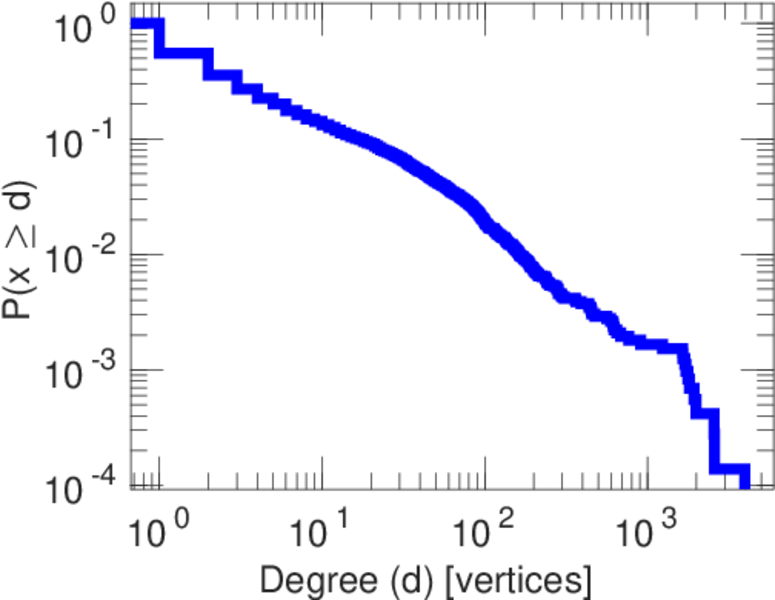
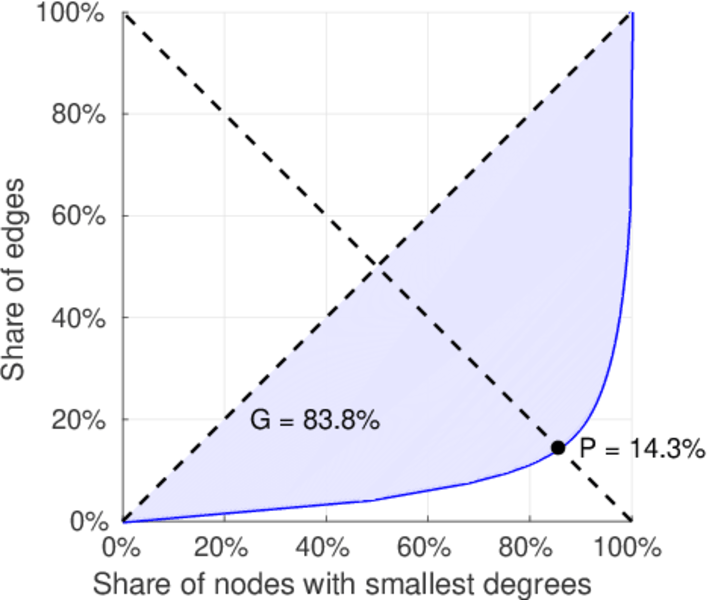
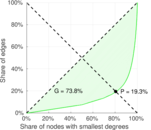
| Gini coefficient | G = | 0.845 247
|
| Balanced inequality ratio | P = | 0.137 402
|
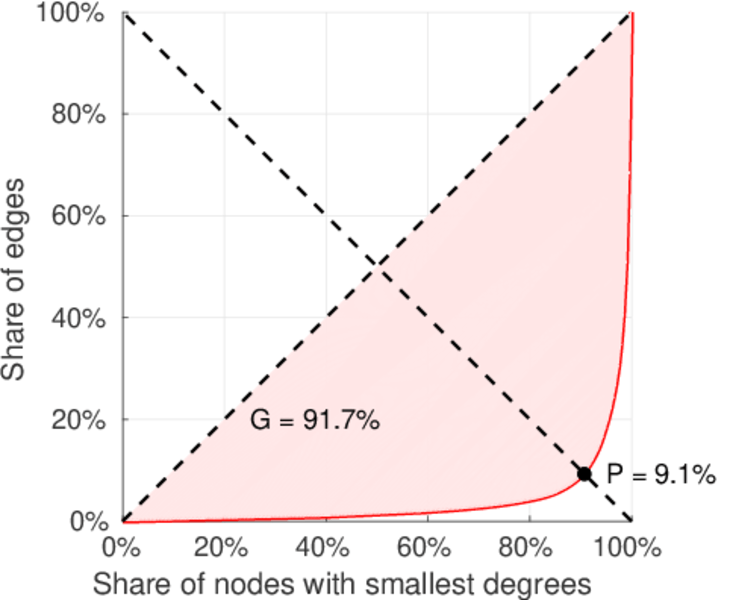
| Left balanced inequality ratio | P1 = | 0.091 288 0
|
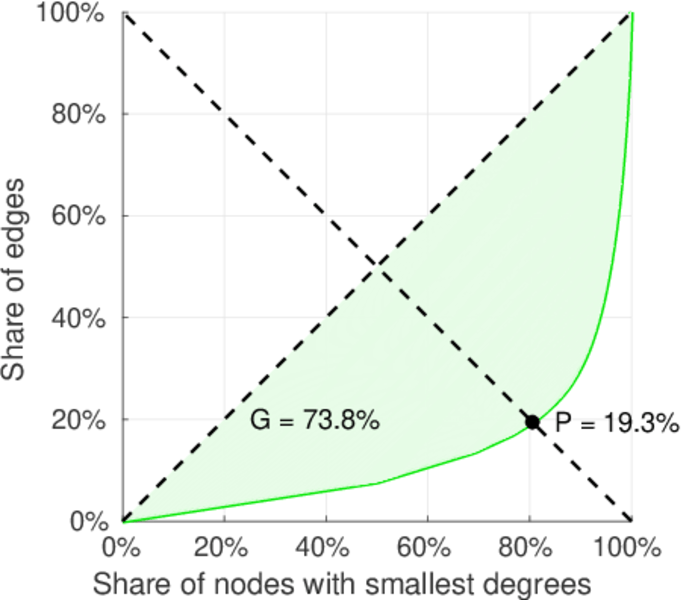
| Right balanced inequality ratio | P2 = | 0.193 135
|
| Relative edge distribution entropy | Her = | 0.782 025
|
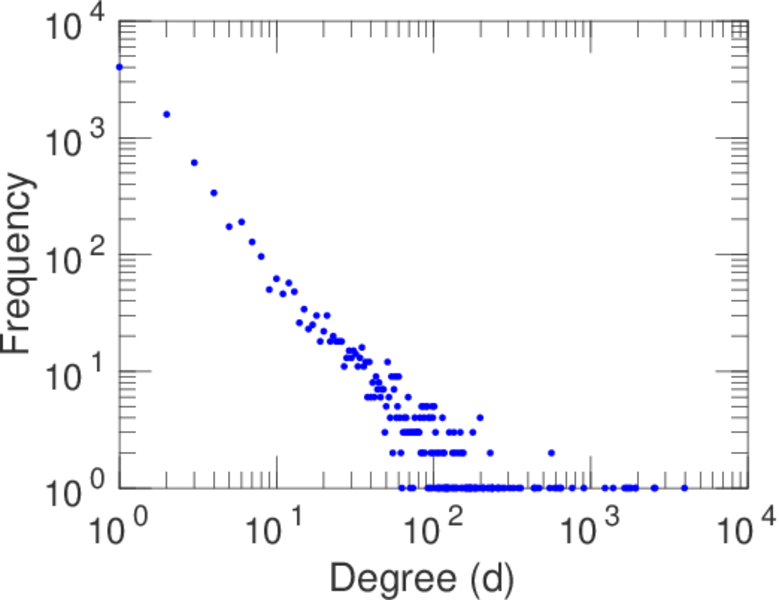
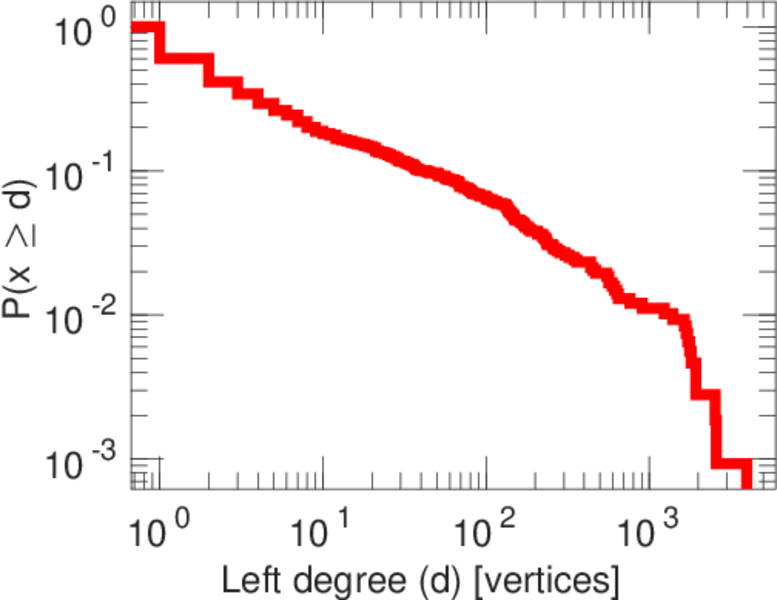
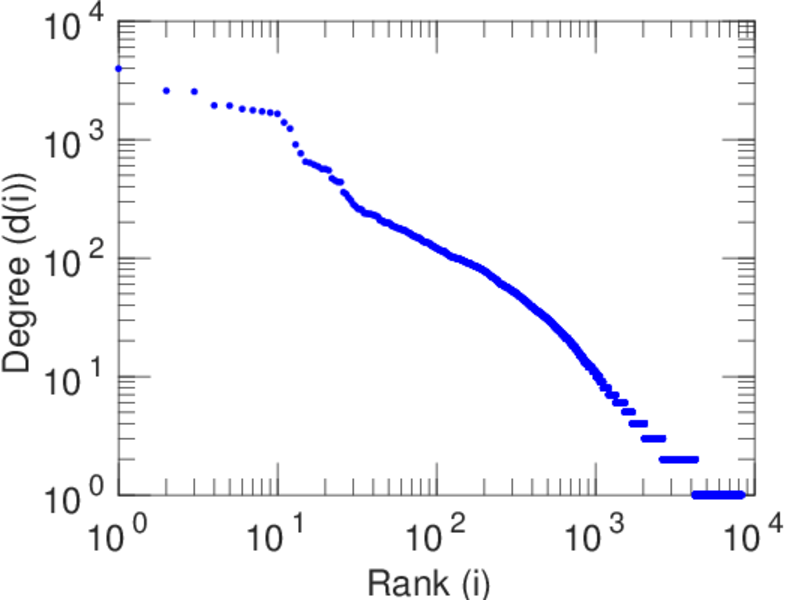
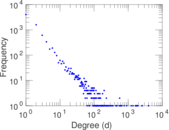
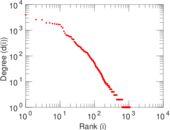
| Power law exponent | γ = | 2.861 14
|
| Tail power law exponent | γt = | 2.041 00
|
| Tail power law exponent with p | γ3 = | 2.041 00
|
| p-value | p = | 0.000 00
|
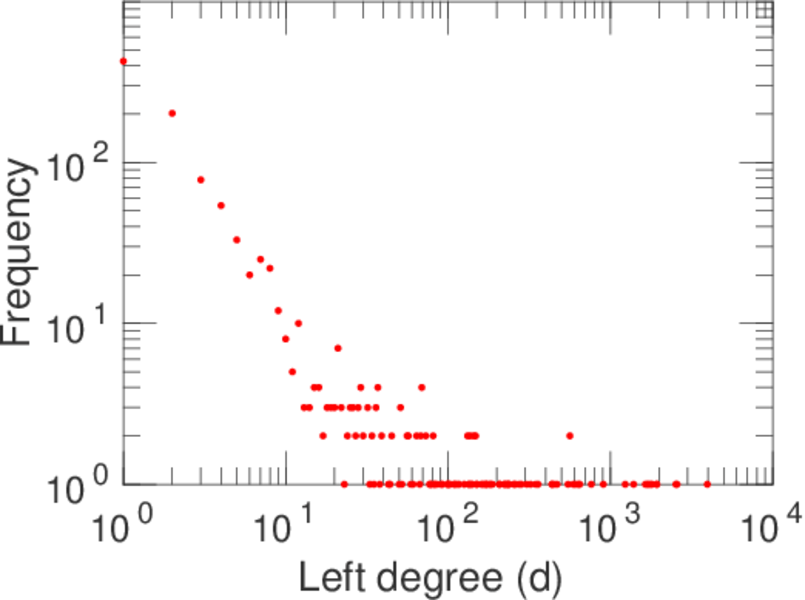
| Left tail power law exponent with p | γ3,1 = | 1.711 00
|
| Left p-value | p1 = | 0.000 00
|
| Right tail power law exponent with p | γ3,2 = | 2.121 00
|
| Right p-value | p2 = | 0.000 00
|
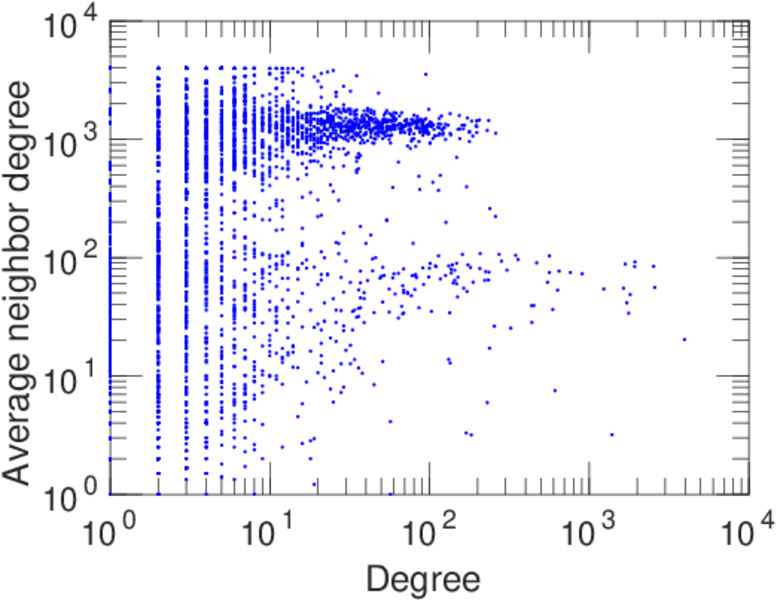
| Degree assortativity | ρ = | −0.321 104
|
| Degree assortativity p-value | pρ = | 0.000 00
|
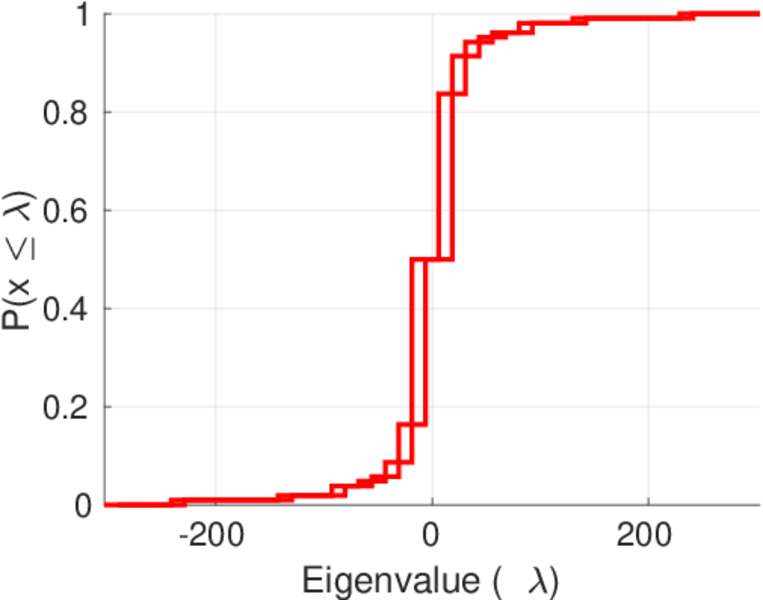
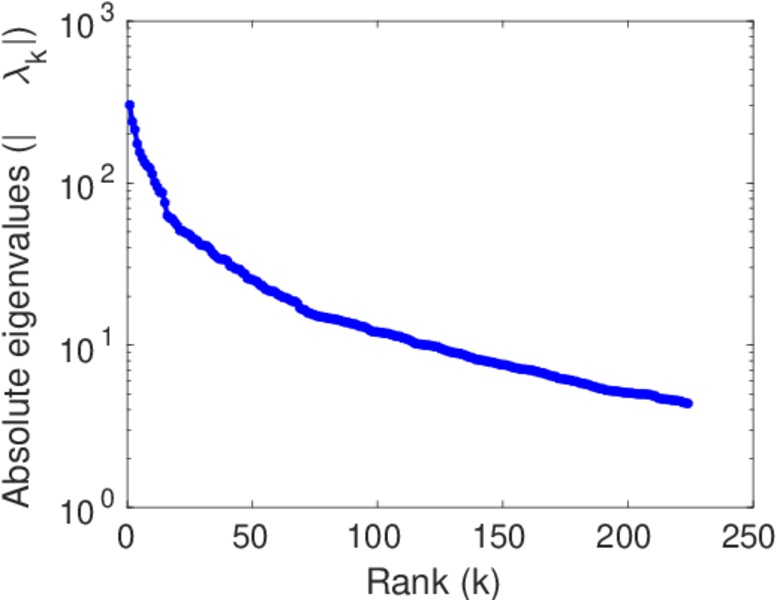
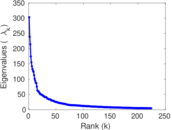
| Spectral norm | α = | 303.300
|
| Algebraic connectivity | a = | 0.024 863 8
|
| Spectral separation | |λ1[A] / λ2[A]| = | 1.268 08
|
| Controllability | C = | 6,254
|
| Relative controllability | Cr = | 0.757 051
|
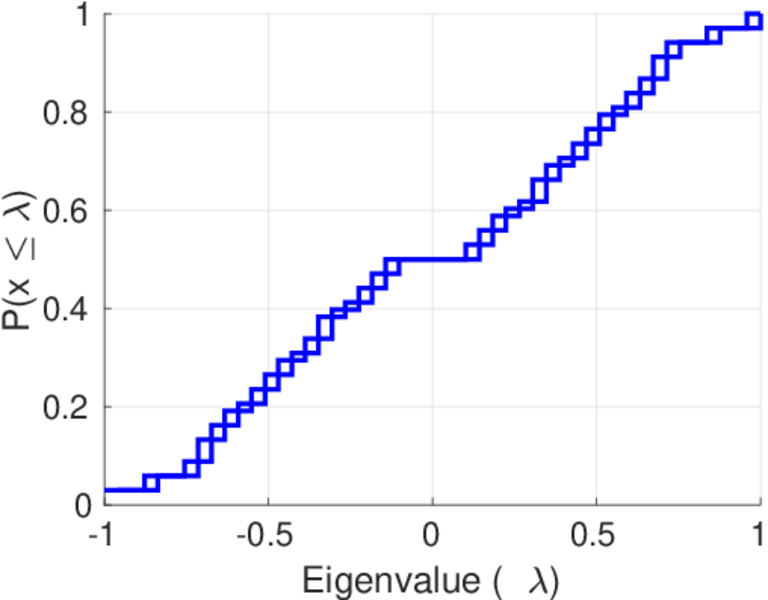
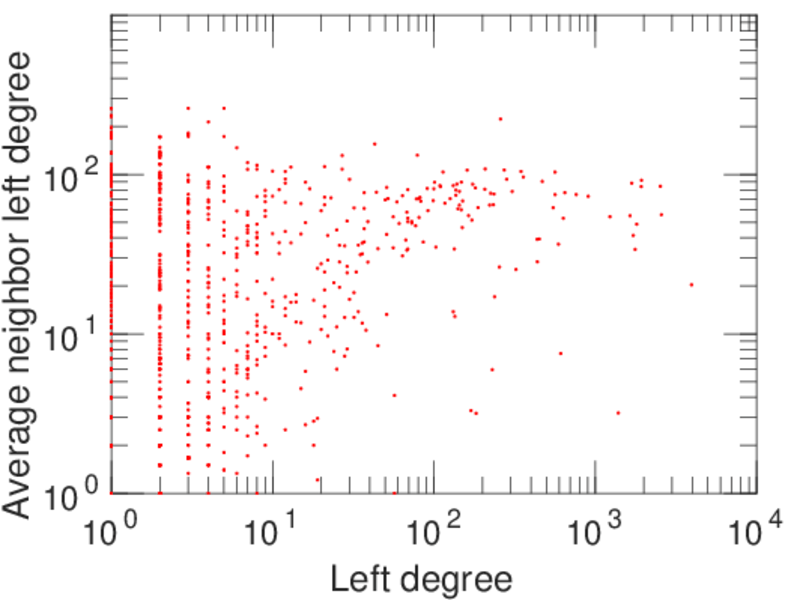
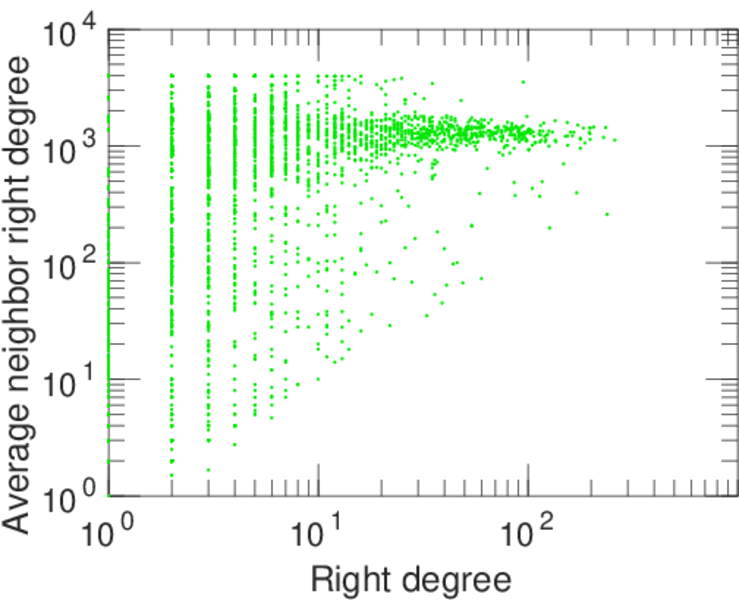
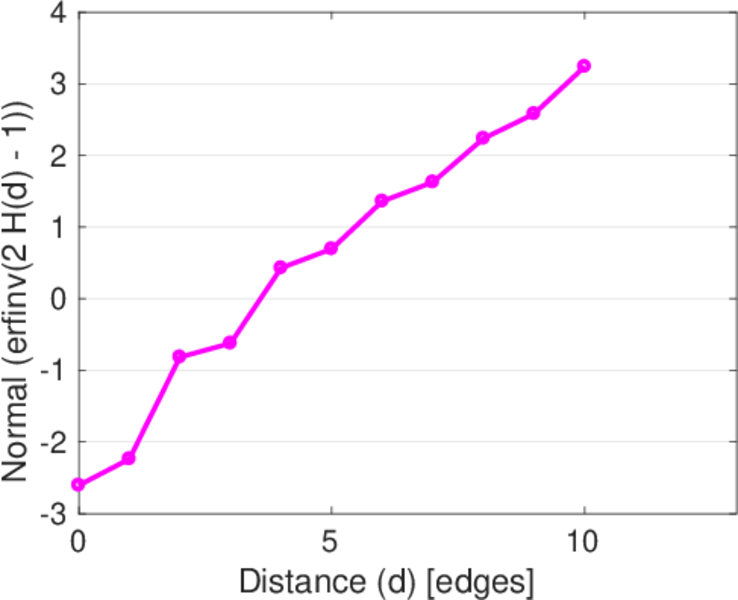
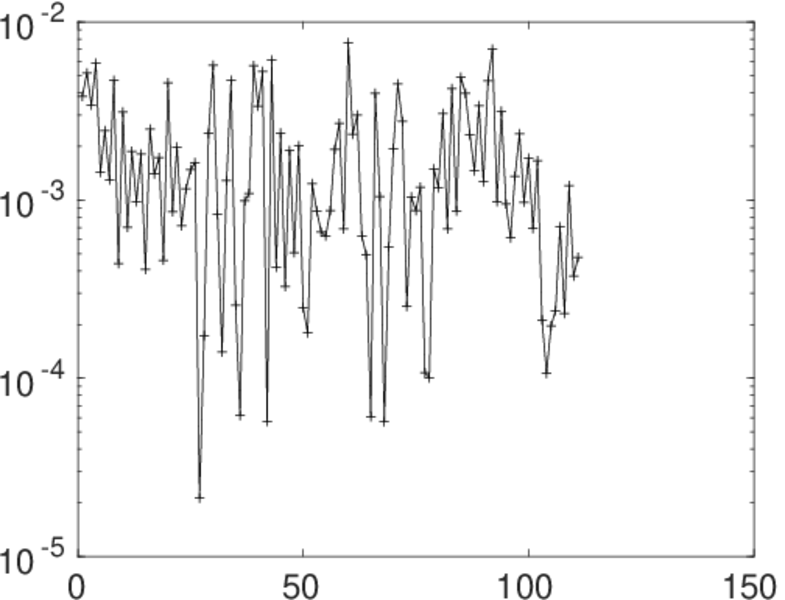
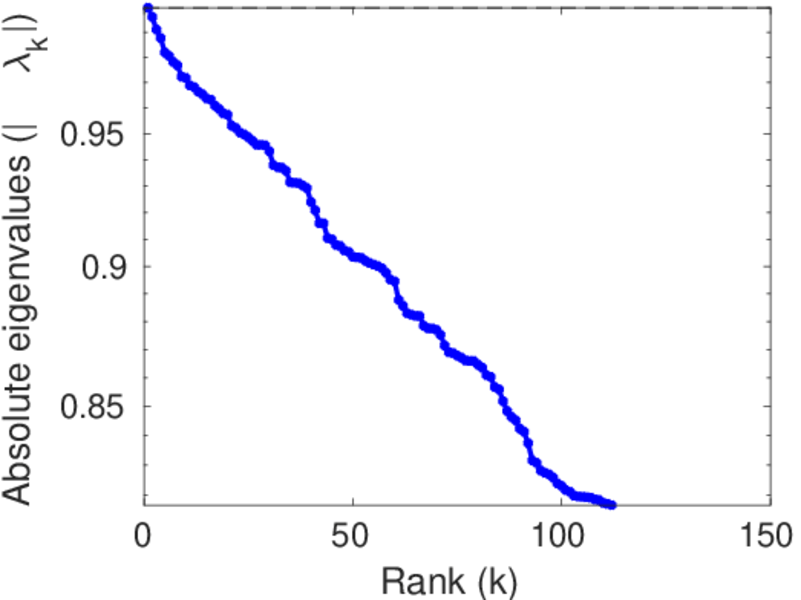
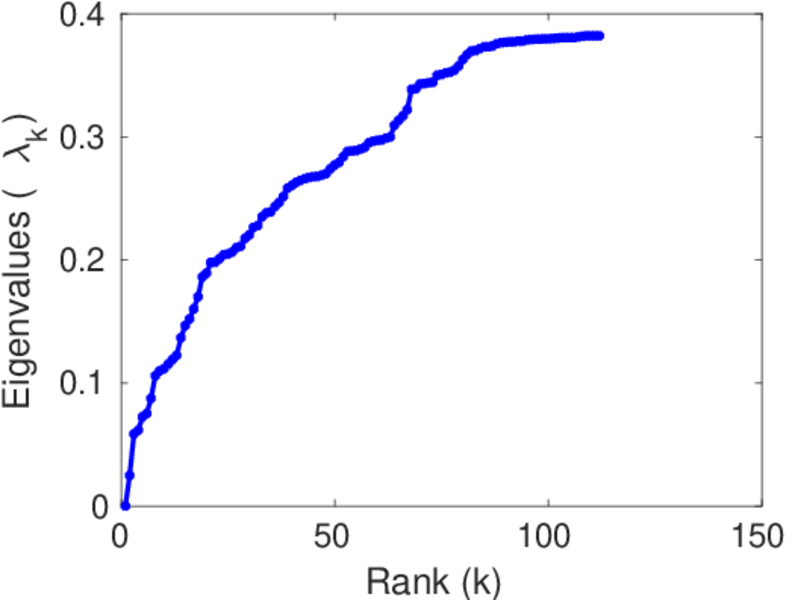
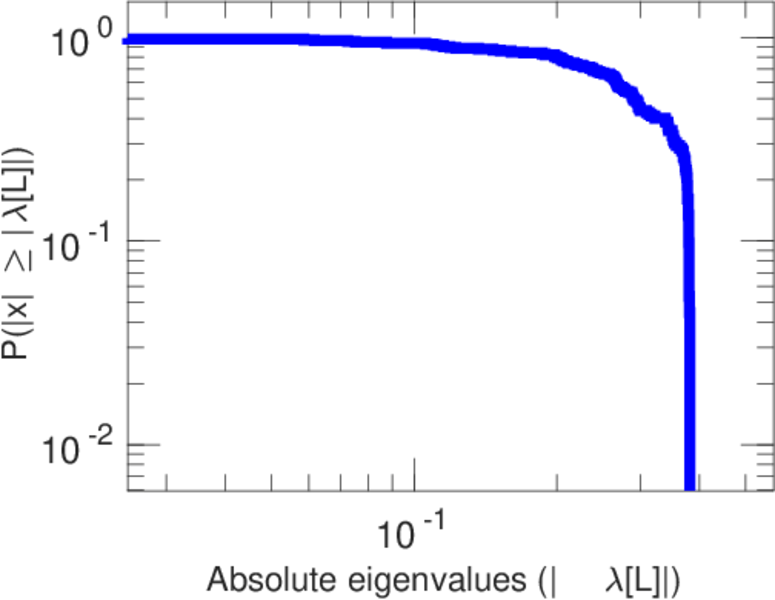
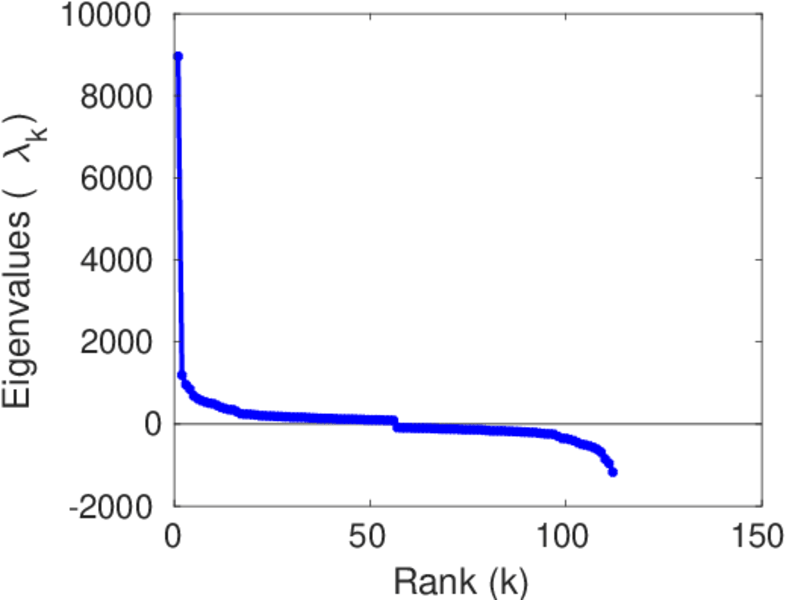
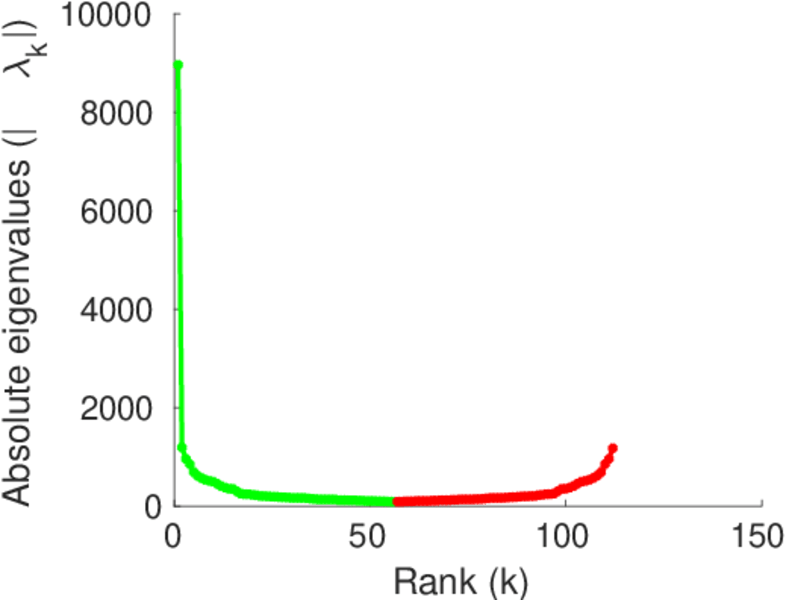
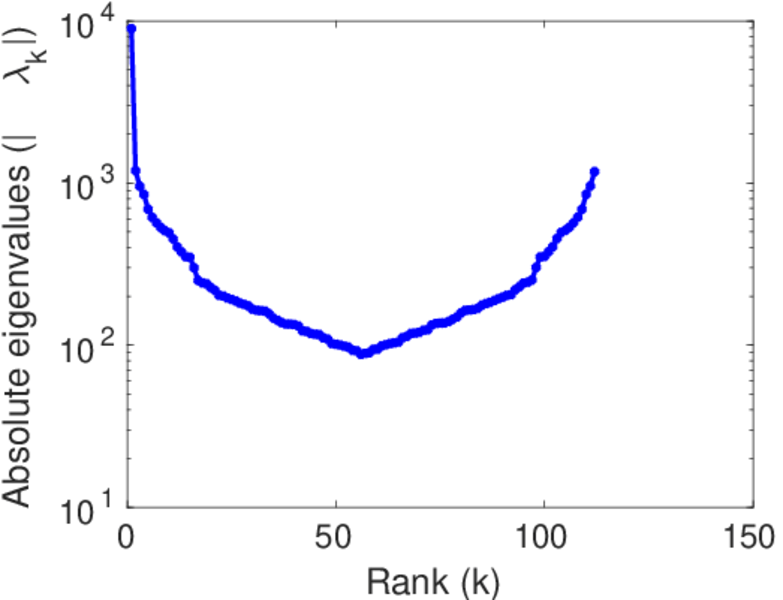
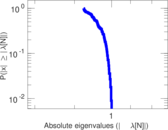
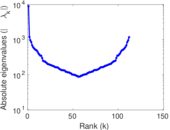
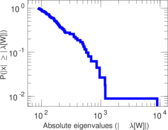
Plots


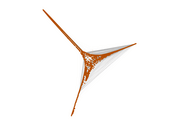
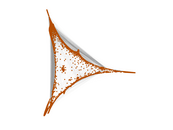


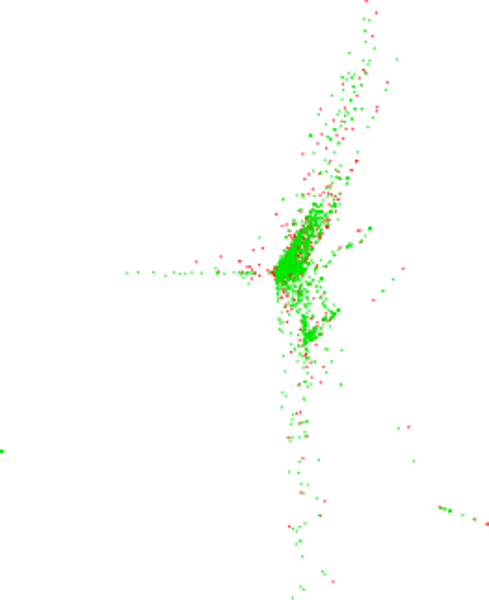
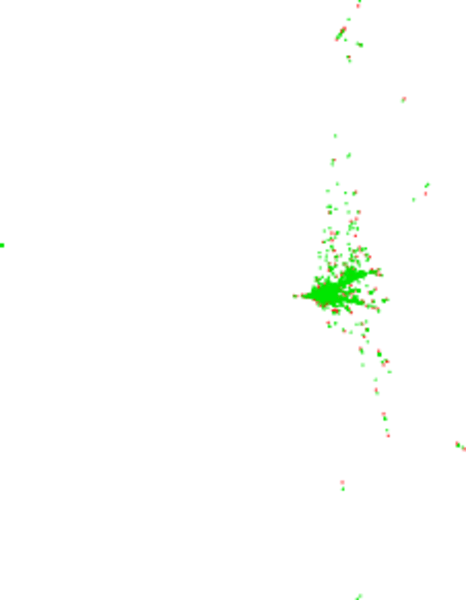
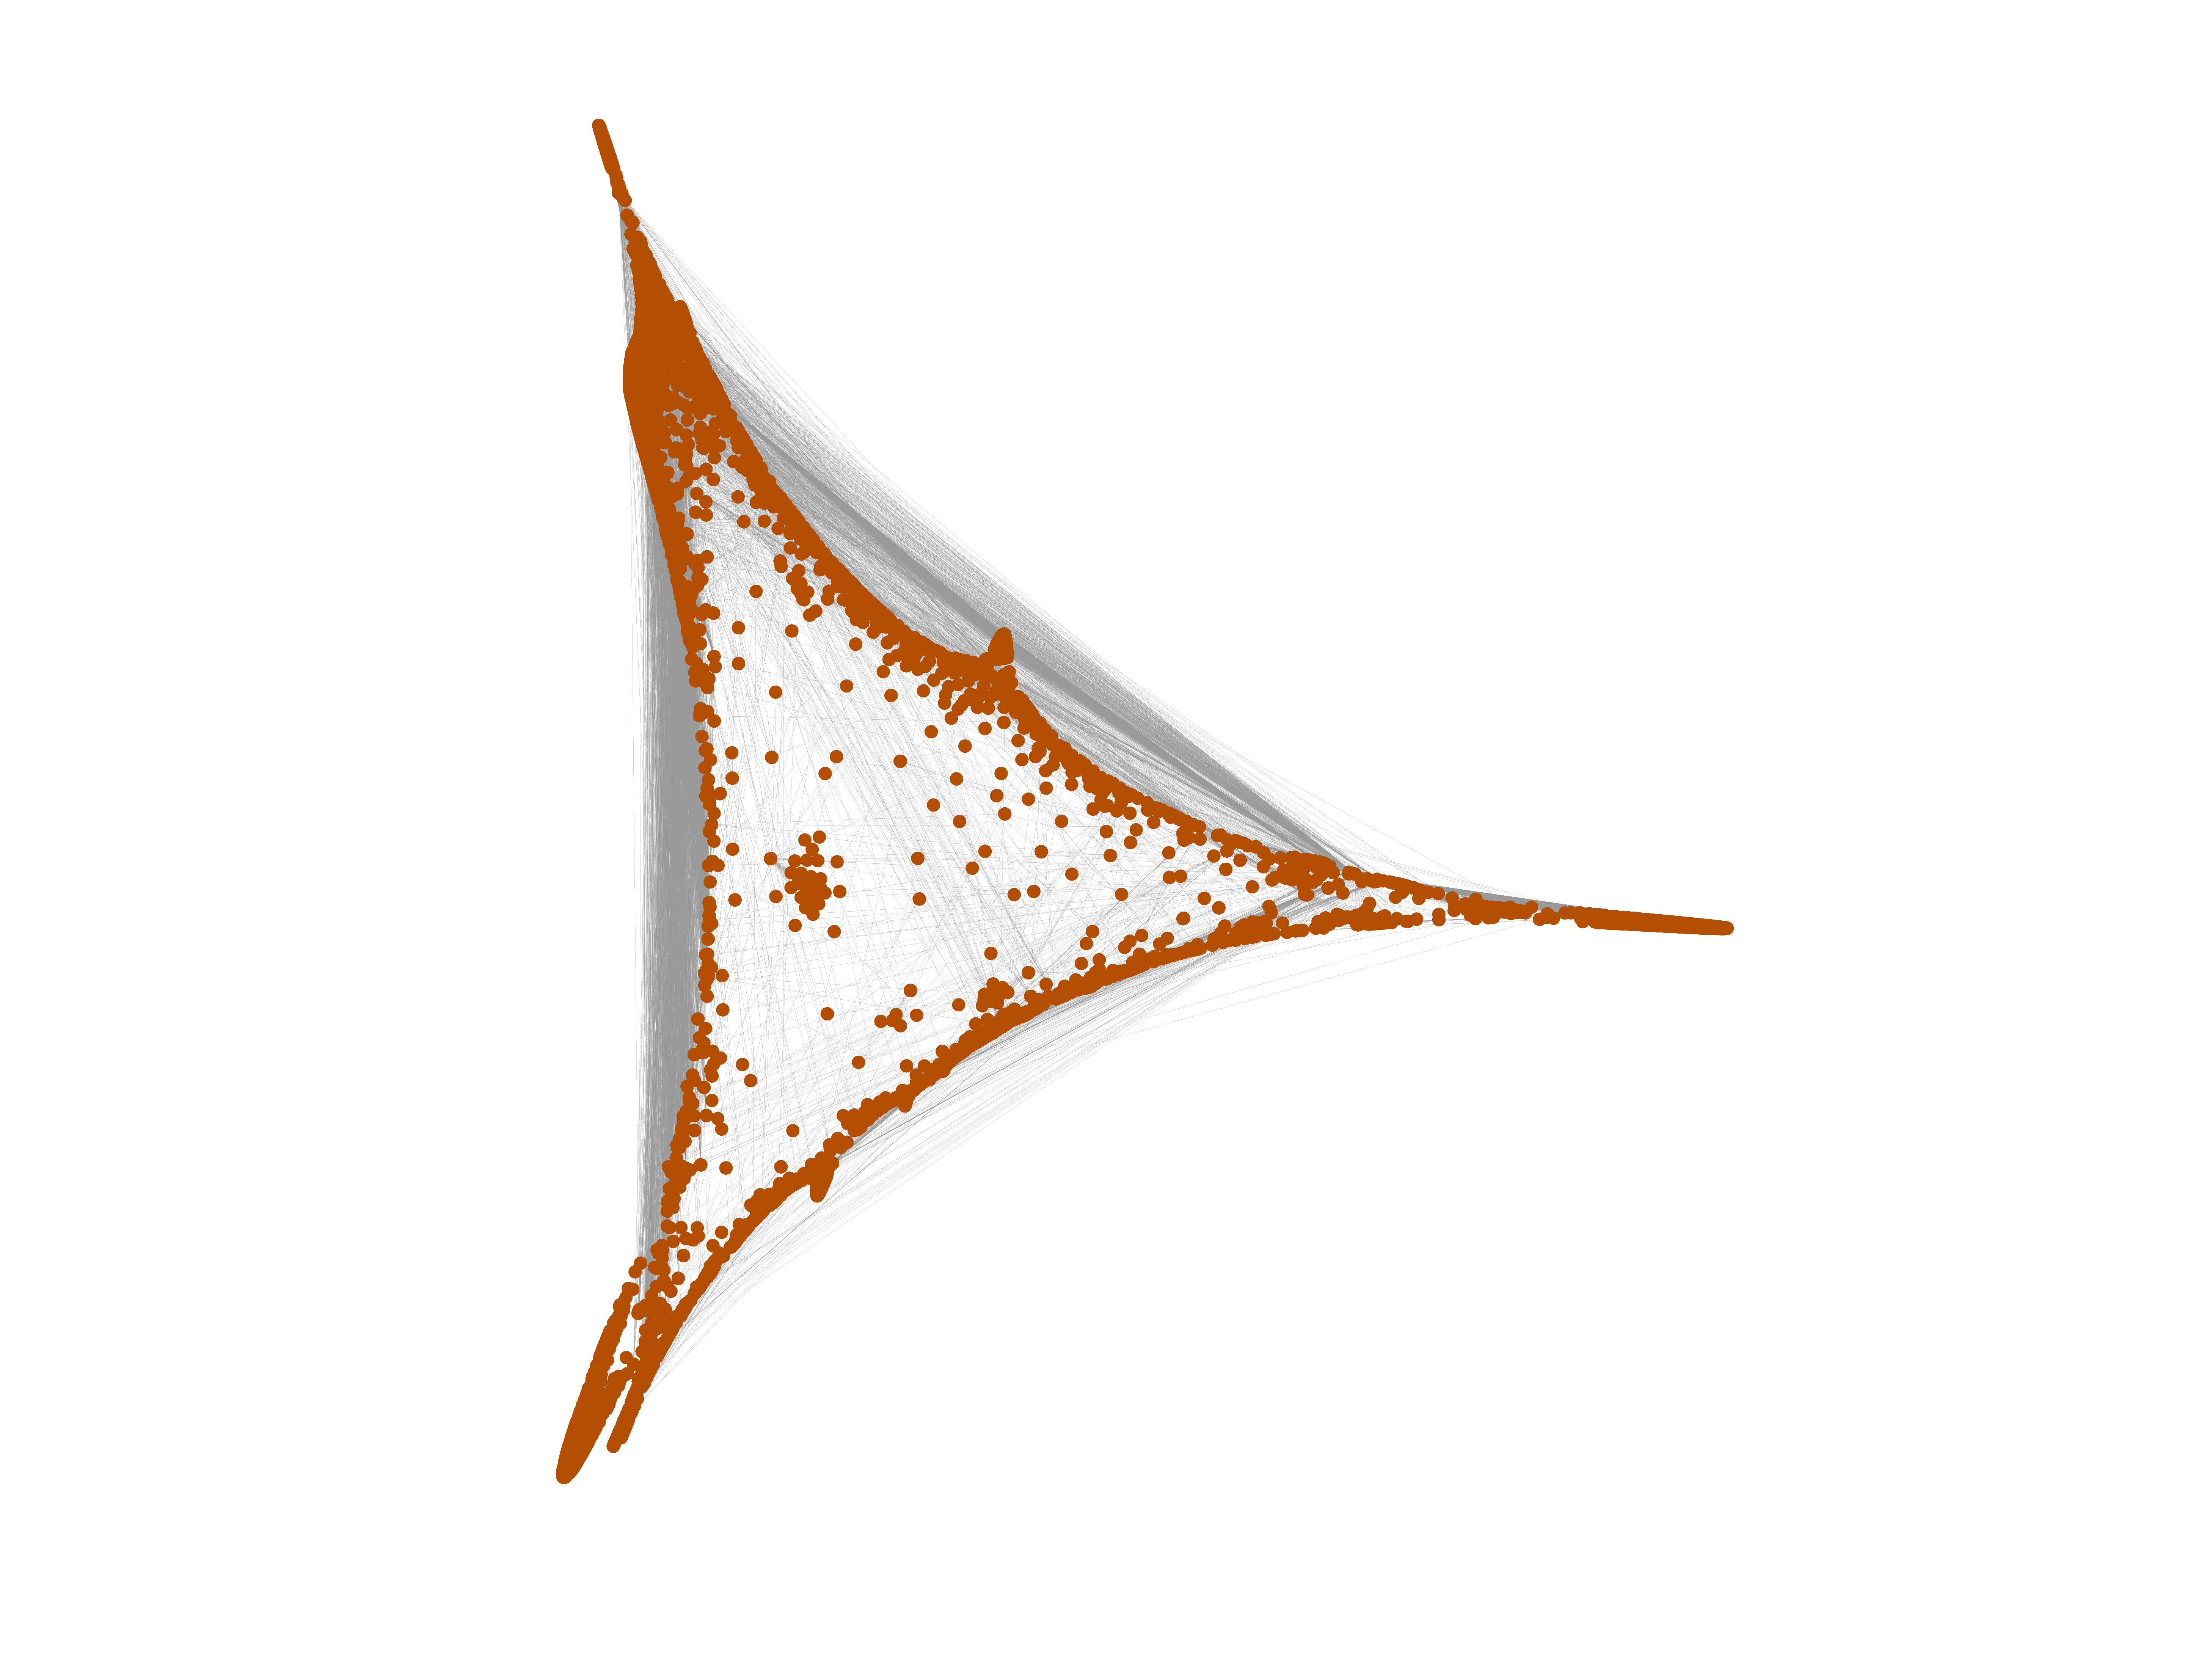
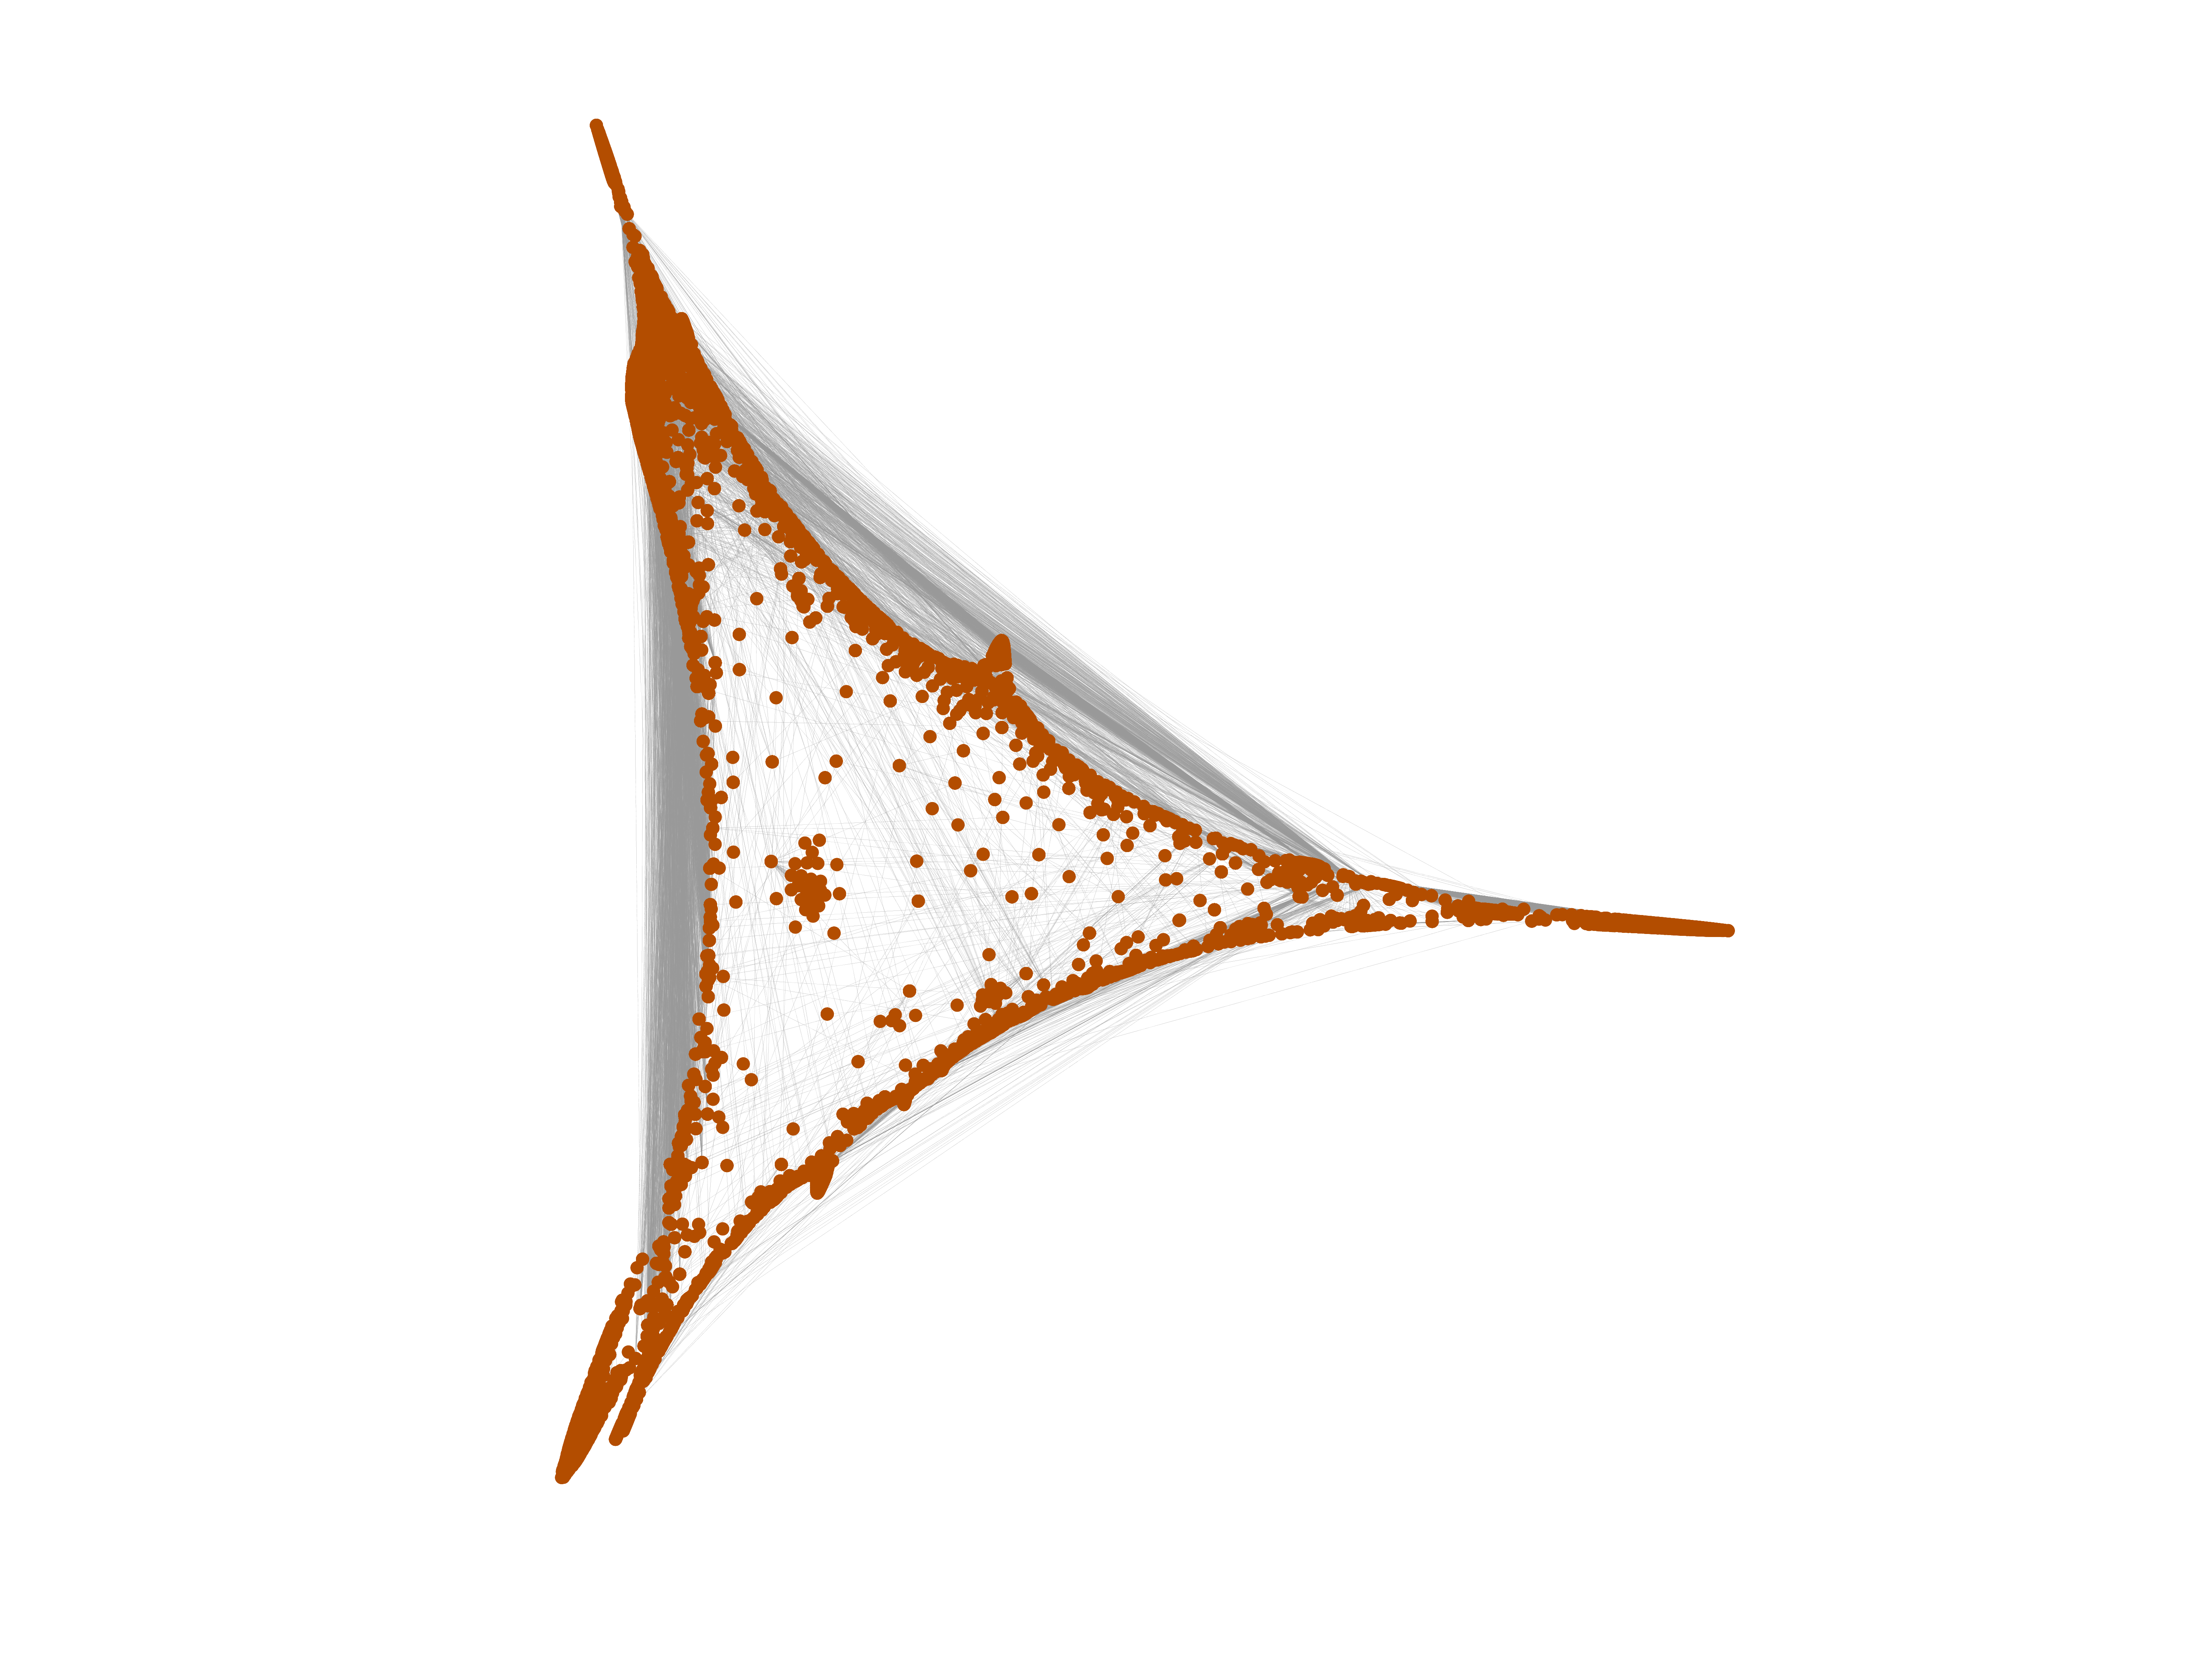
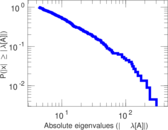
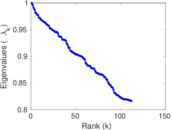
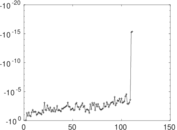
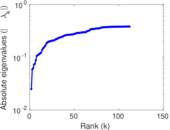
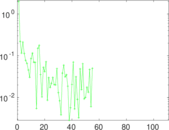
Matrix decompositions plots


Downloads
References
|
[1]
|
Jérôme Kunegis.
KONECT – The Koblenz Network Collection.
In Proc. Int. Conf. on World Wide Web Companion, pages
1343–1350, 2013.
[ http ]
|
|
[2]
|
Wikimedia Foundation.
Wikimedia downloads.
http://dumps.wikimedia.org/, January 2010.
|
 KONECT ‣ Networks ‣
Buy Me a Coffee
KONECT ‣ Networks ‣
Buy Me a Coffee