Wikipedia edits (lrc)
This is the bipartite edit network of the Northern Luri Wikipedia. It contains
users and pages from the Northern Luri Wikipedia, connected by edit events.
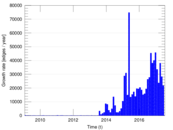
Each edge represents an edit. The dataset includes the timestamp of each edit.
Metadata
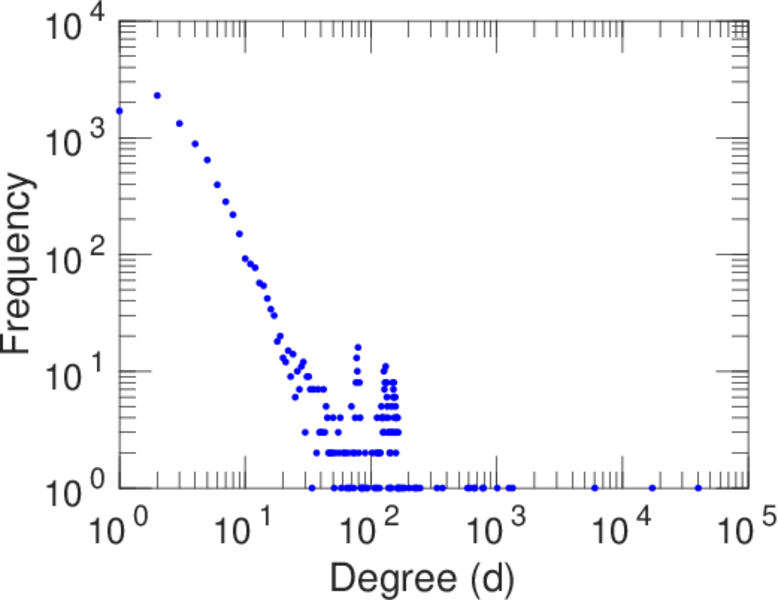
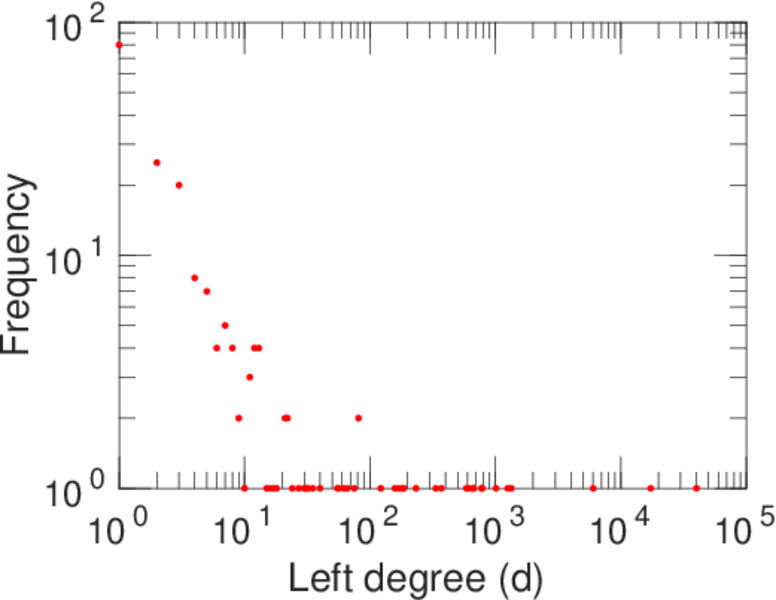
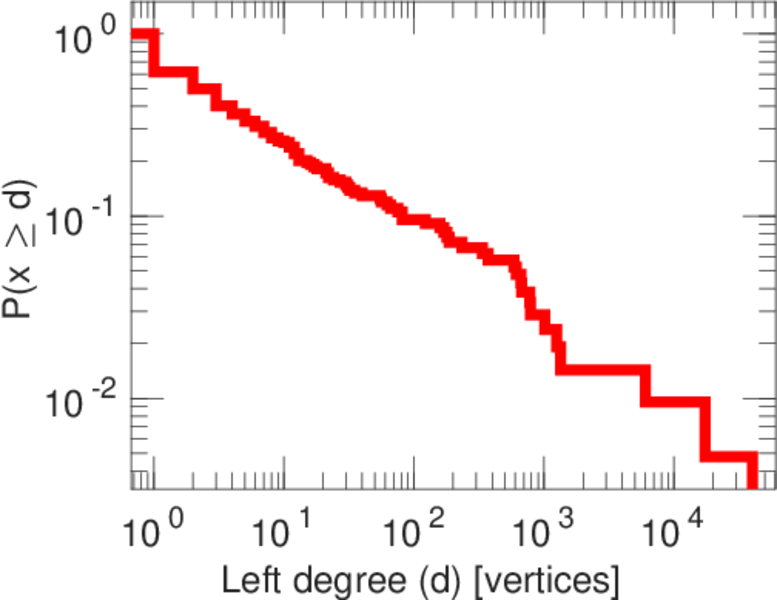
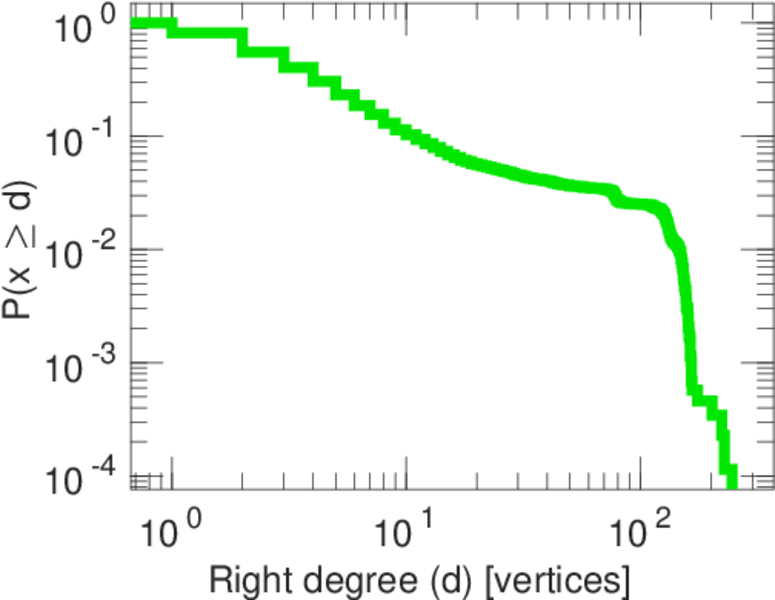
Statistics
| Size | n = | 8,945
|
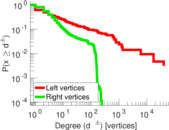
| Left size | n1 = | 209
|
| Right size | n2 = | 8,736
|
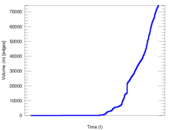
| Volume | m = | 74,313
|
| Unique edge count | m̿ = | 18,916
|
| Wedge count | s = | 51,304,282
|
| Claw count | z = | 123,028,967,468
|
| Cross count | x = | 229,591,127,493,032
|
| Square count | q = | 17,435,622
|
| 4-Tour count | T4 = | 344,763,776
|
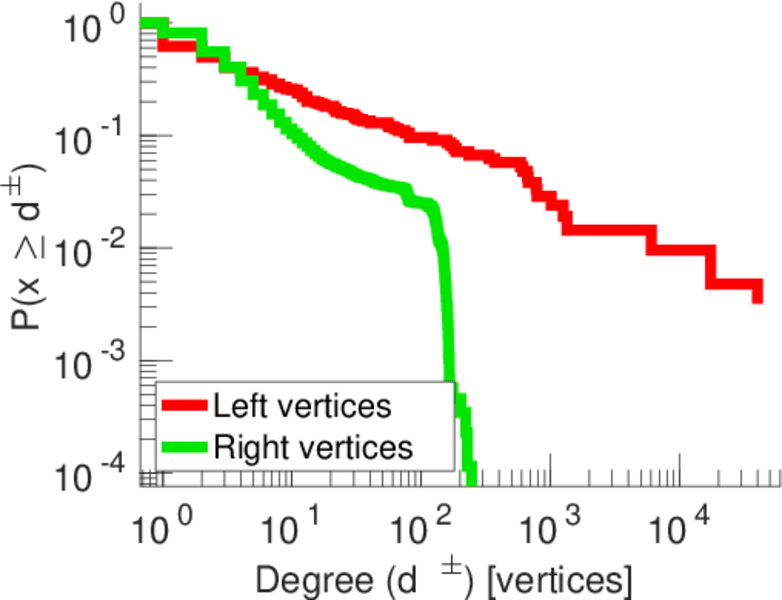
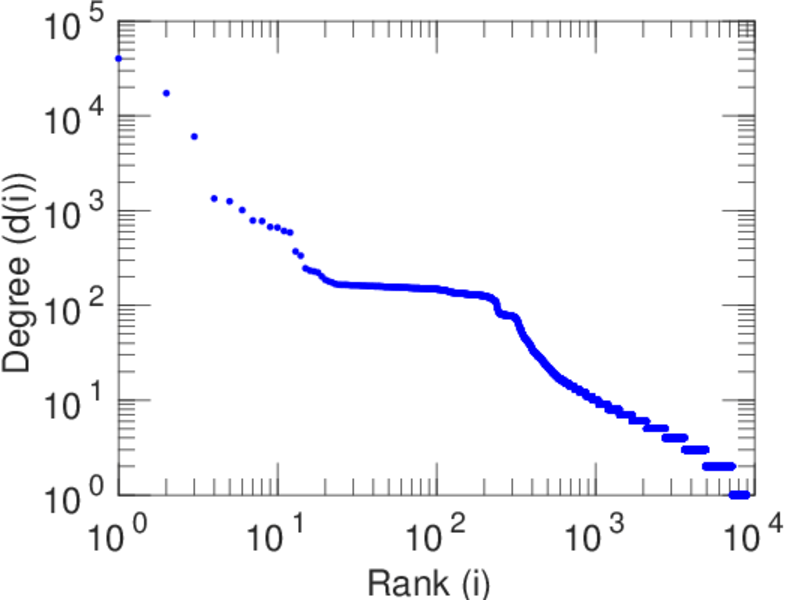
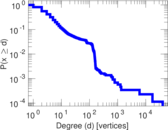
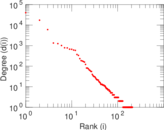
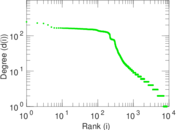
| Maximum degree | dmax = | 40,149
|
| Maximum left degree | d1max = | 40,149
|
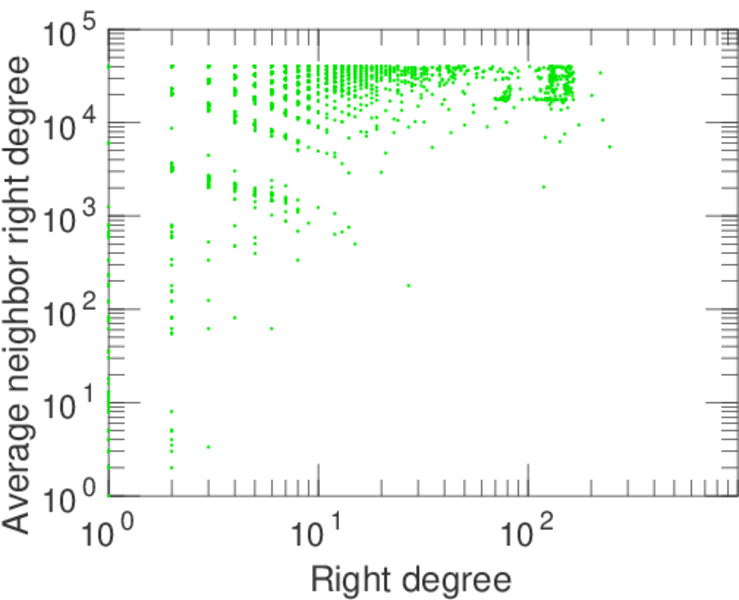
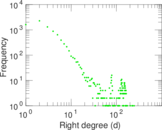
| Maximum right degree | d2max = | 246
|
| Average degree | d = | 16.615 5
|
| Average left degree | d1 = | 355.565
|
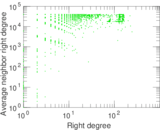
| Average right degree | d2 = | 8.506 52
|
| Fill | p = | 0.010 360 3
|
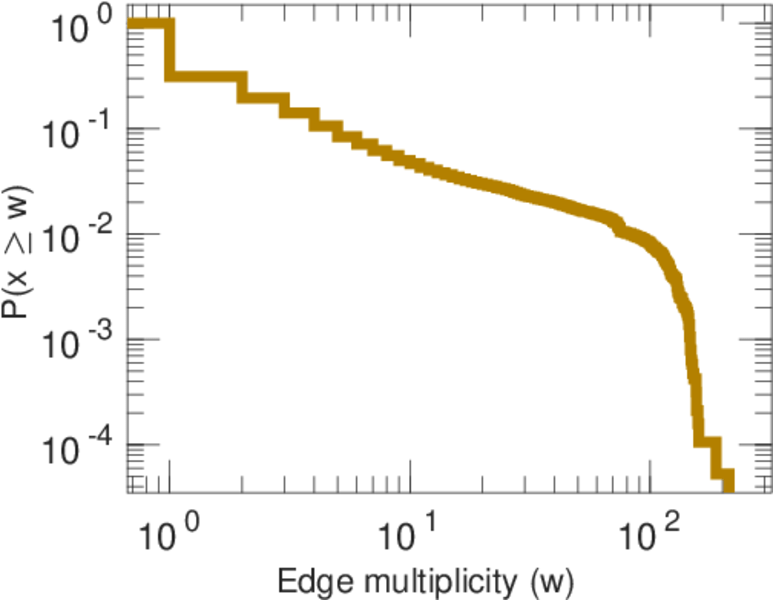
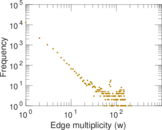
| Average edge multiplicity | m̃ = | 3.928 58
|
| Size of LCC | N = | 8,868
|
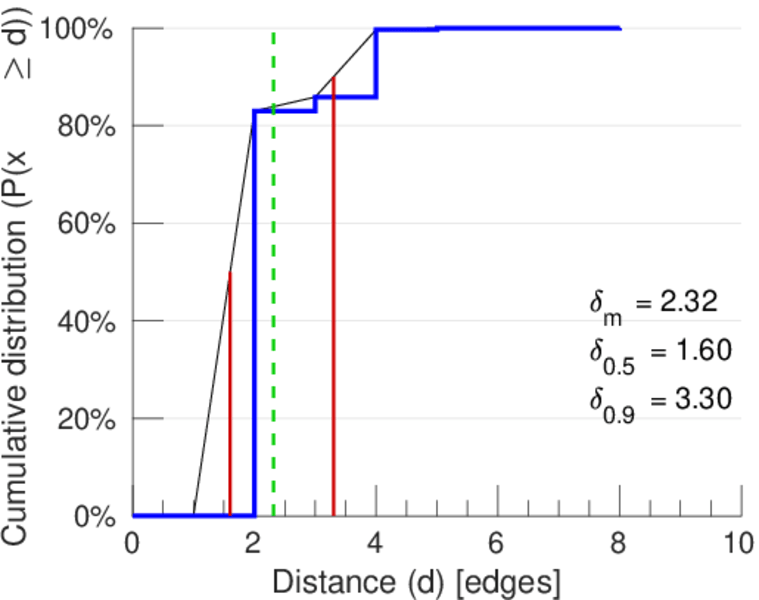
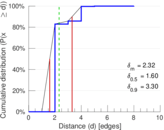
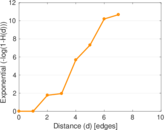
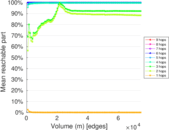
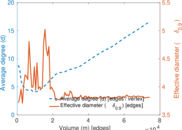
| Diameter | δ = | 8
|
| 50-Percentile effective diameter | δ0.5 = | 1.602 29
|
| 90-Percentile effective diameter | δ0.9 = | 3.300 87
|
| Median distance | δM = | 2
|
| Mean distance | δm = | 2.315 30
|
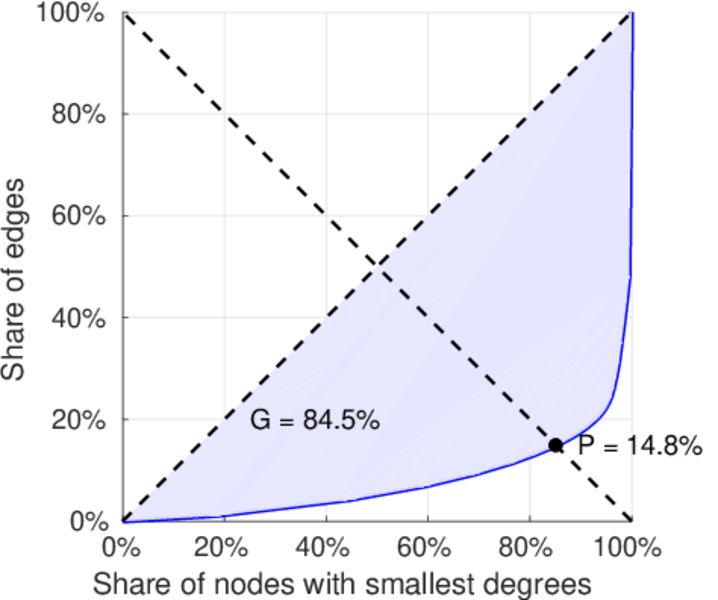
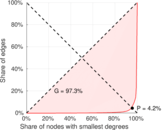
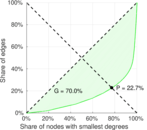
| Gini coefficient | G = | 0.845 400
|
| Balanced inequality ratio | P = | 0.147 774
|
| Left balanced inequality ratio | P1 = | 0.041 836 6
|
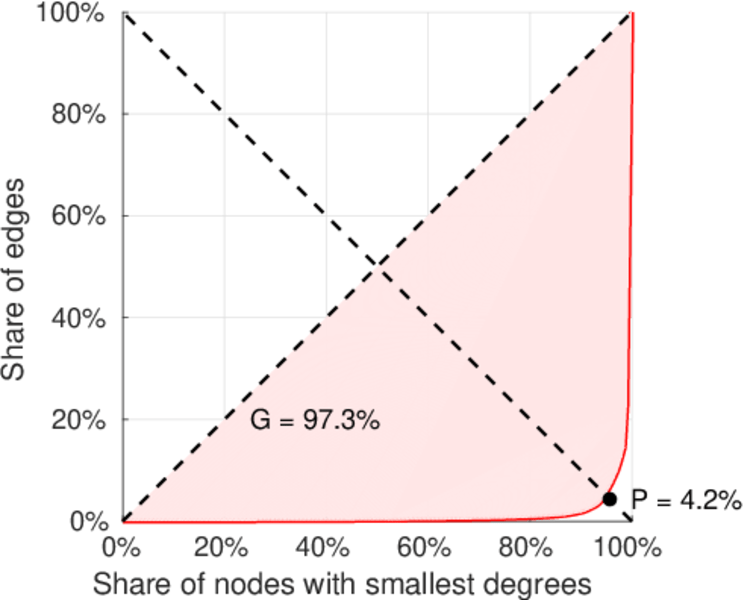
| Right balanced inequality ratio | P2 = | 0.226 865
|
| Relative edge distribution entropy | Her = | 0.672 701
|
| Power law exponent | γ = | 2.510 91
|
| Tail power law exponent | γt = | 3.731 00
|
| Tail power law exponent with p | γ3 = | 3.731 00
|
| p-value | p = | 0.000 00
|
| Left tail power law exponent with p | γ3,1 = | 1.551 00
|
| Left p-value | p1 = | 0.491 000
|
| Right tail power law exponent with p | γ3,2 = | 6.401 00
|
| Right p-value | p2 = | 0.597 000
|
| Degree assortativity | ρ = | −0.419 169
|
| Degree assortativity p-value | pρ = | 0.000 00
|
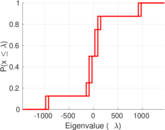
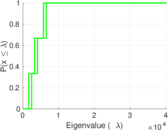
| Spectral norm | α = | 1,448.32
|
| Algebraic connectivity | a = | 0.190 294
|
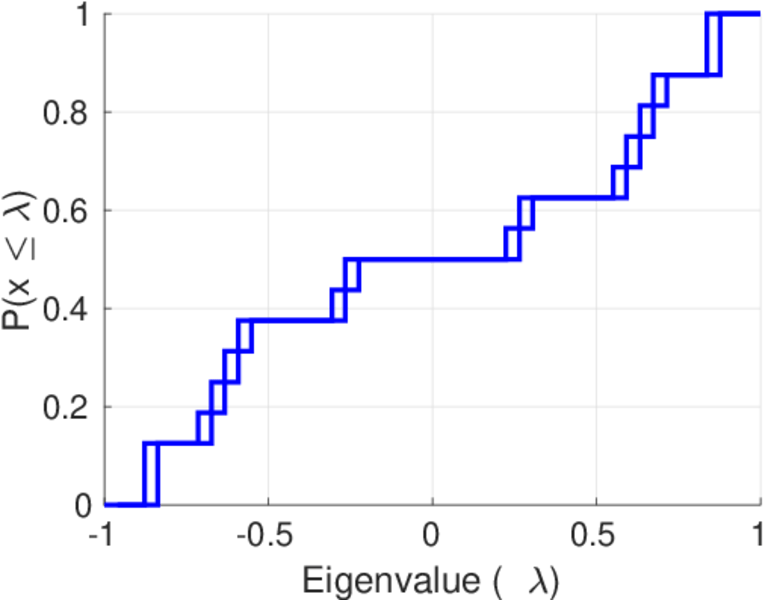
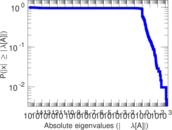
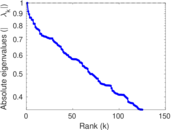
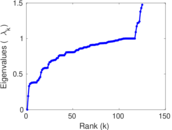
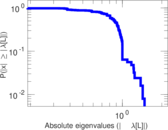
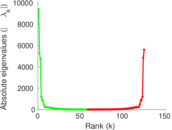
| Spectral separation | |λ1[A] / λ2[A]| = | 1.182 40
|
| Controllability | C = | 8,536
|
| Relative controllability | Cr = | 0.955 665
|
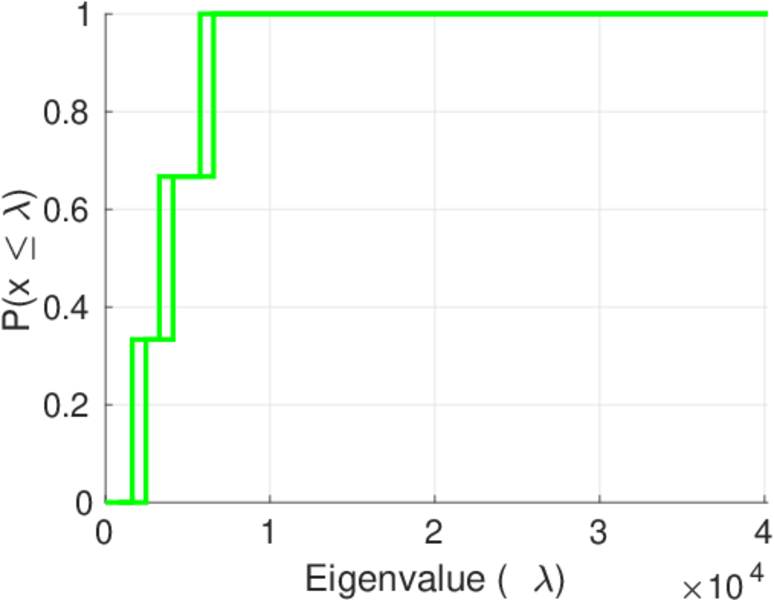
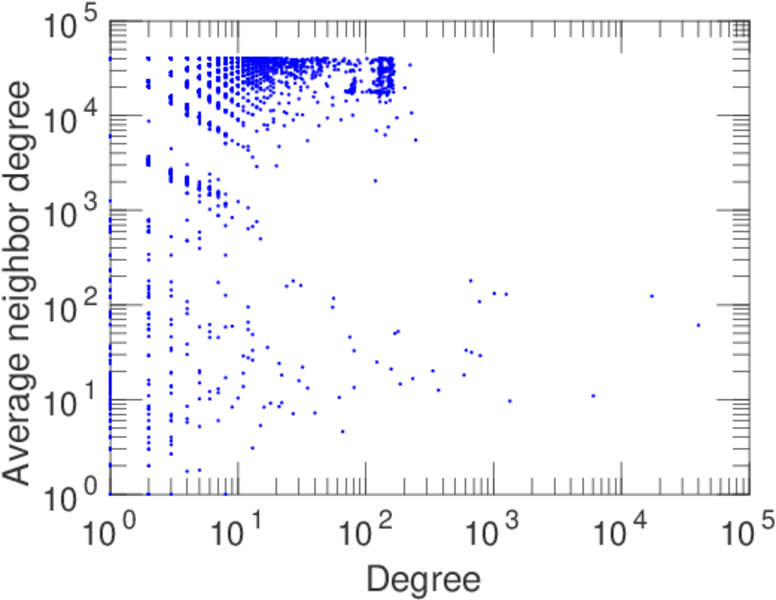
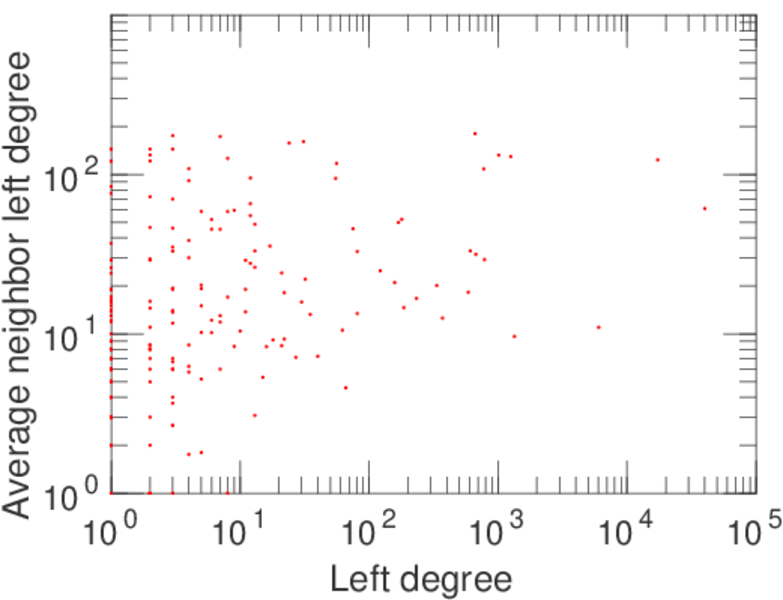
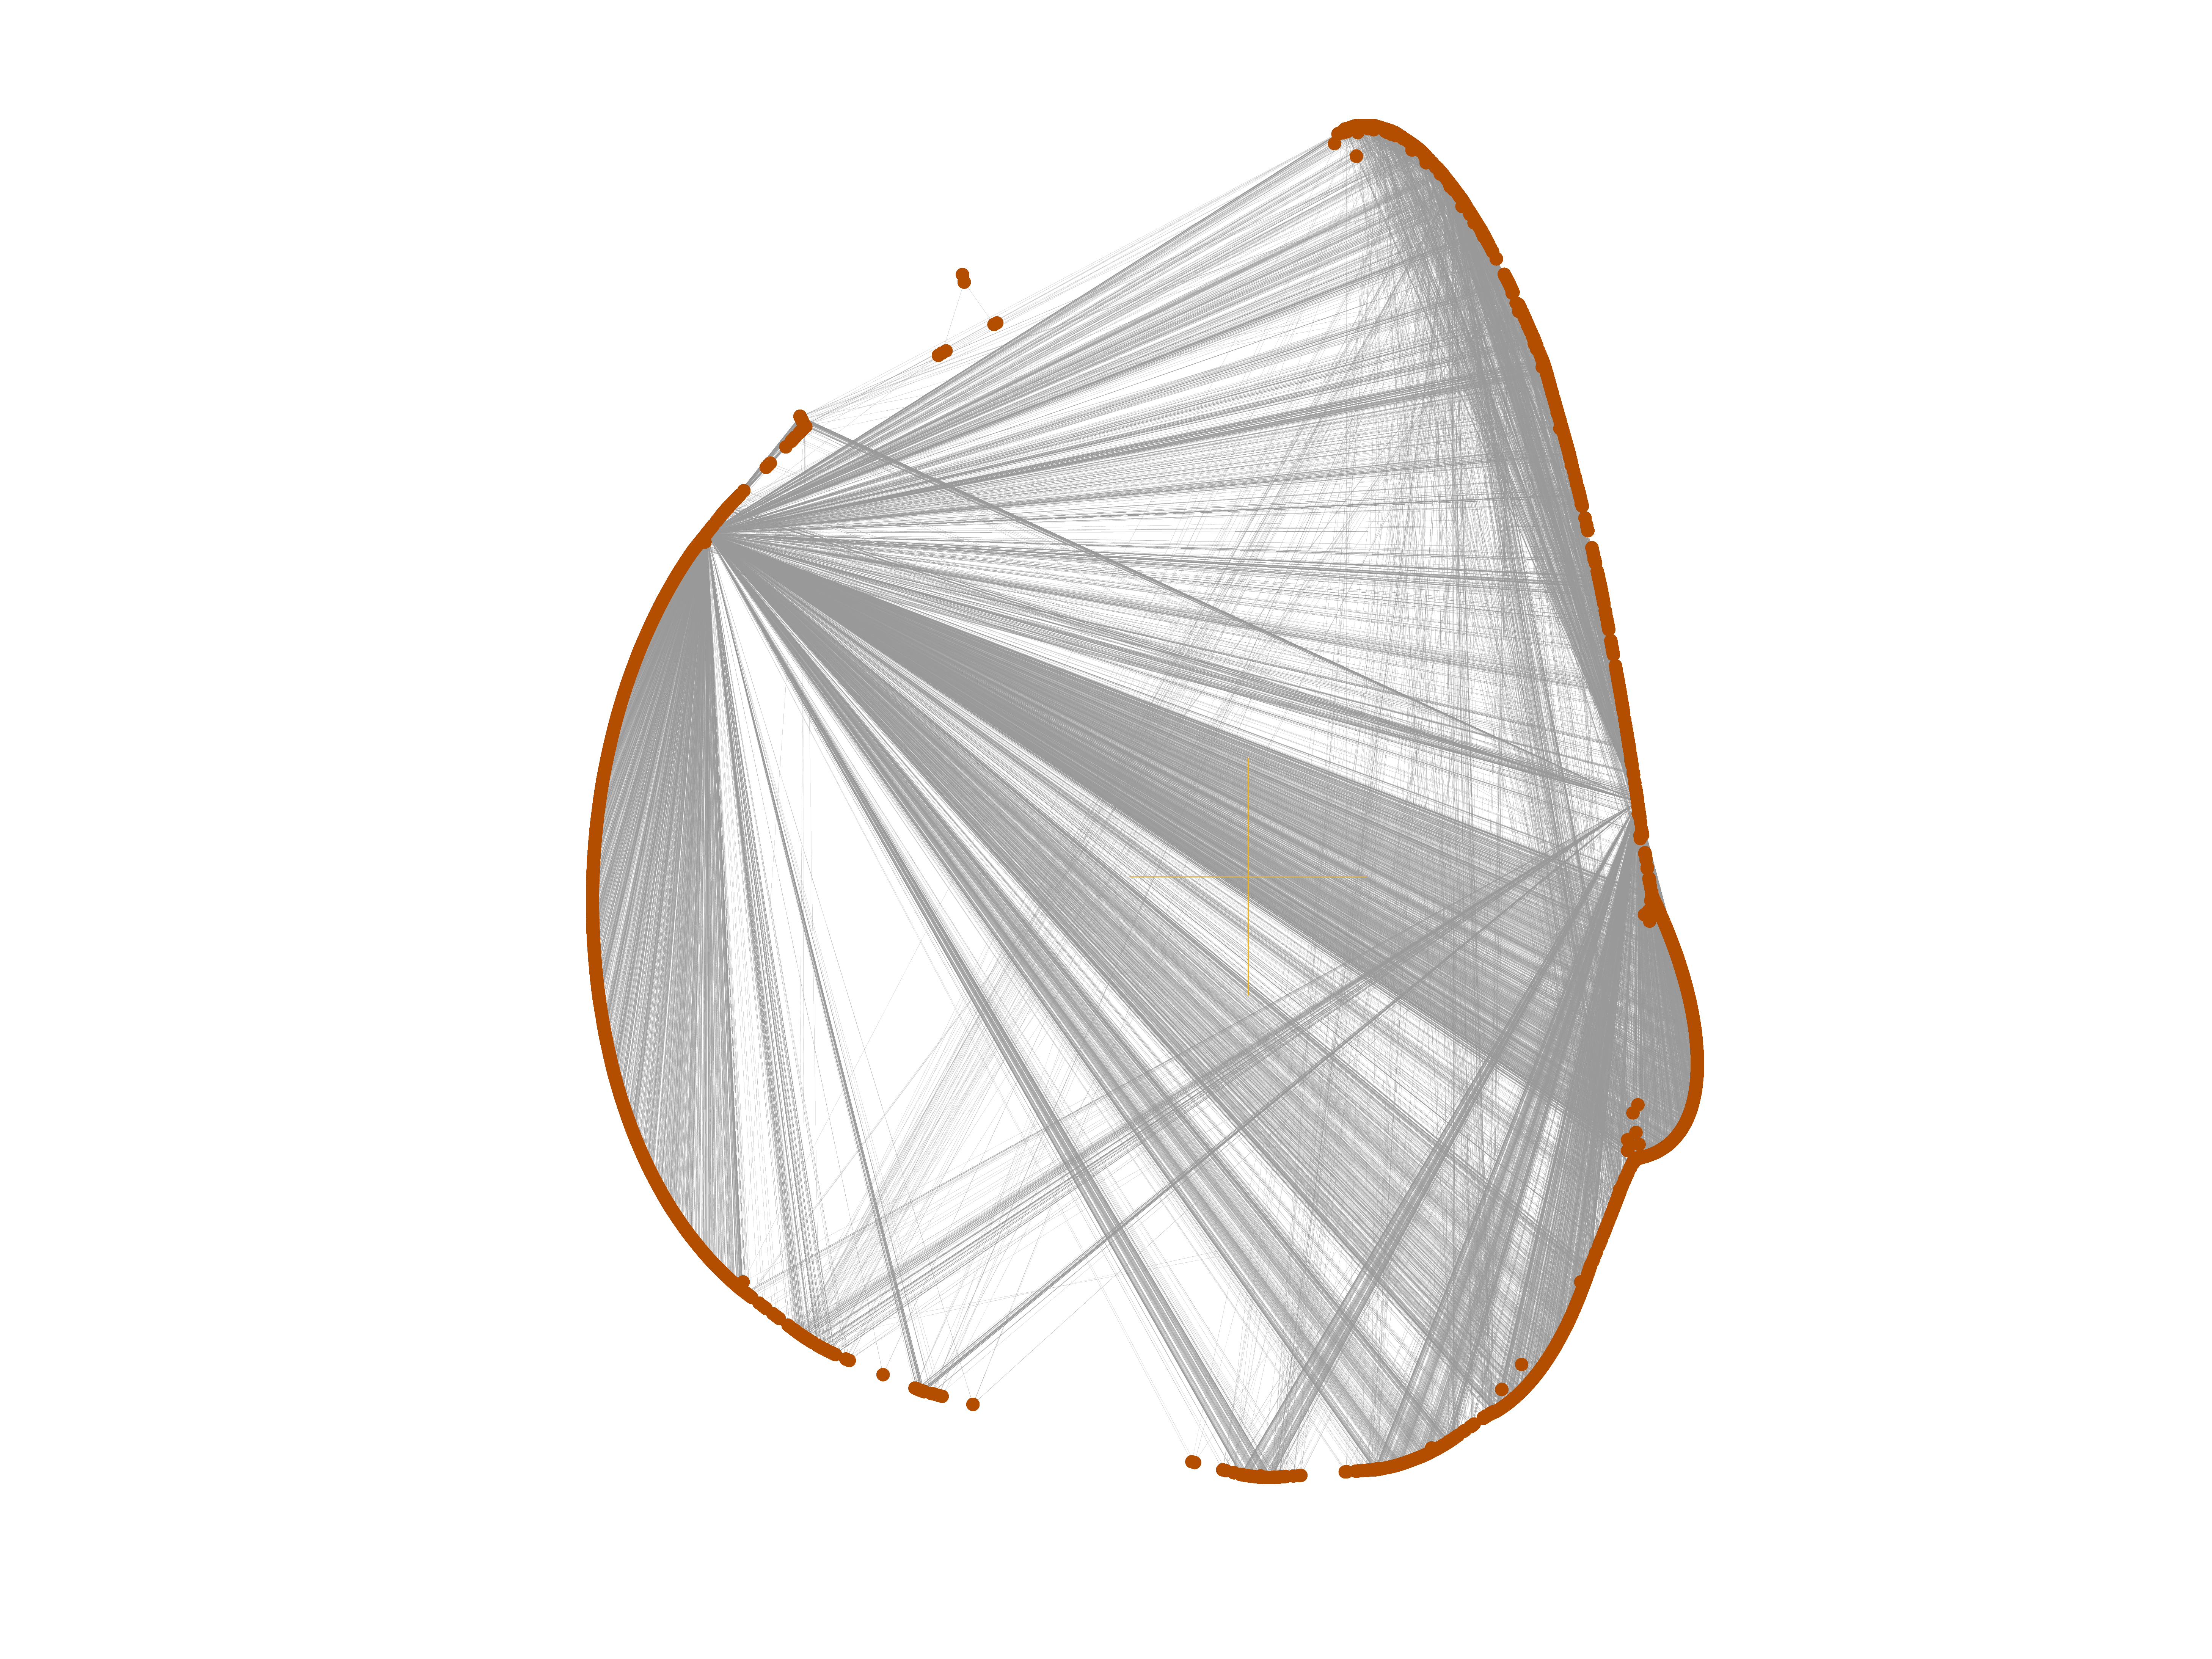
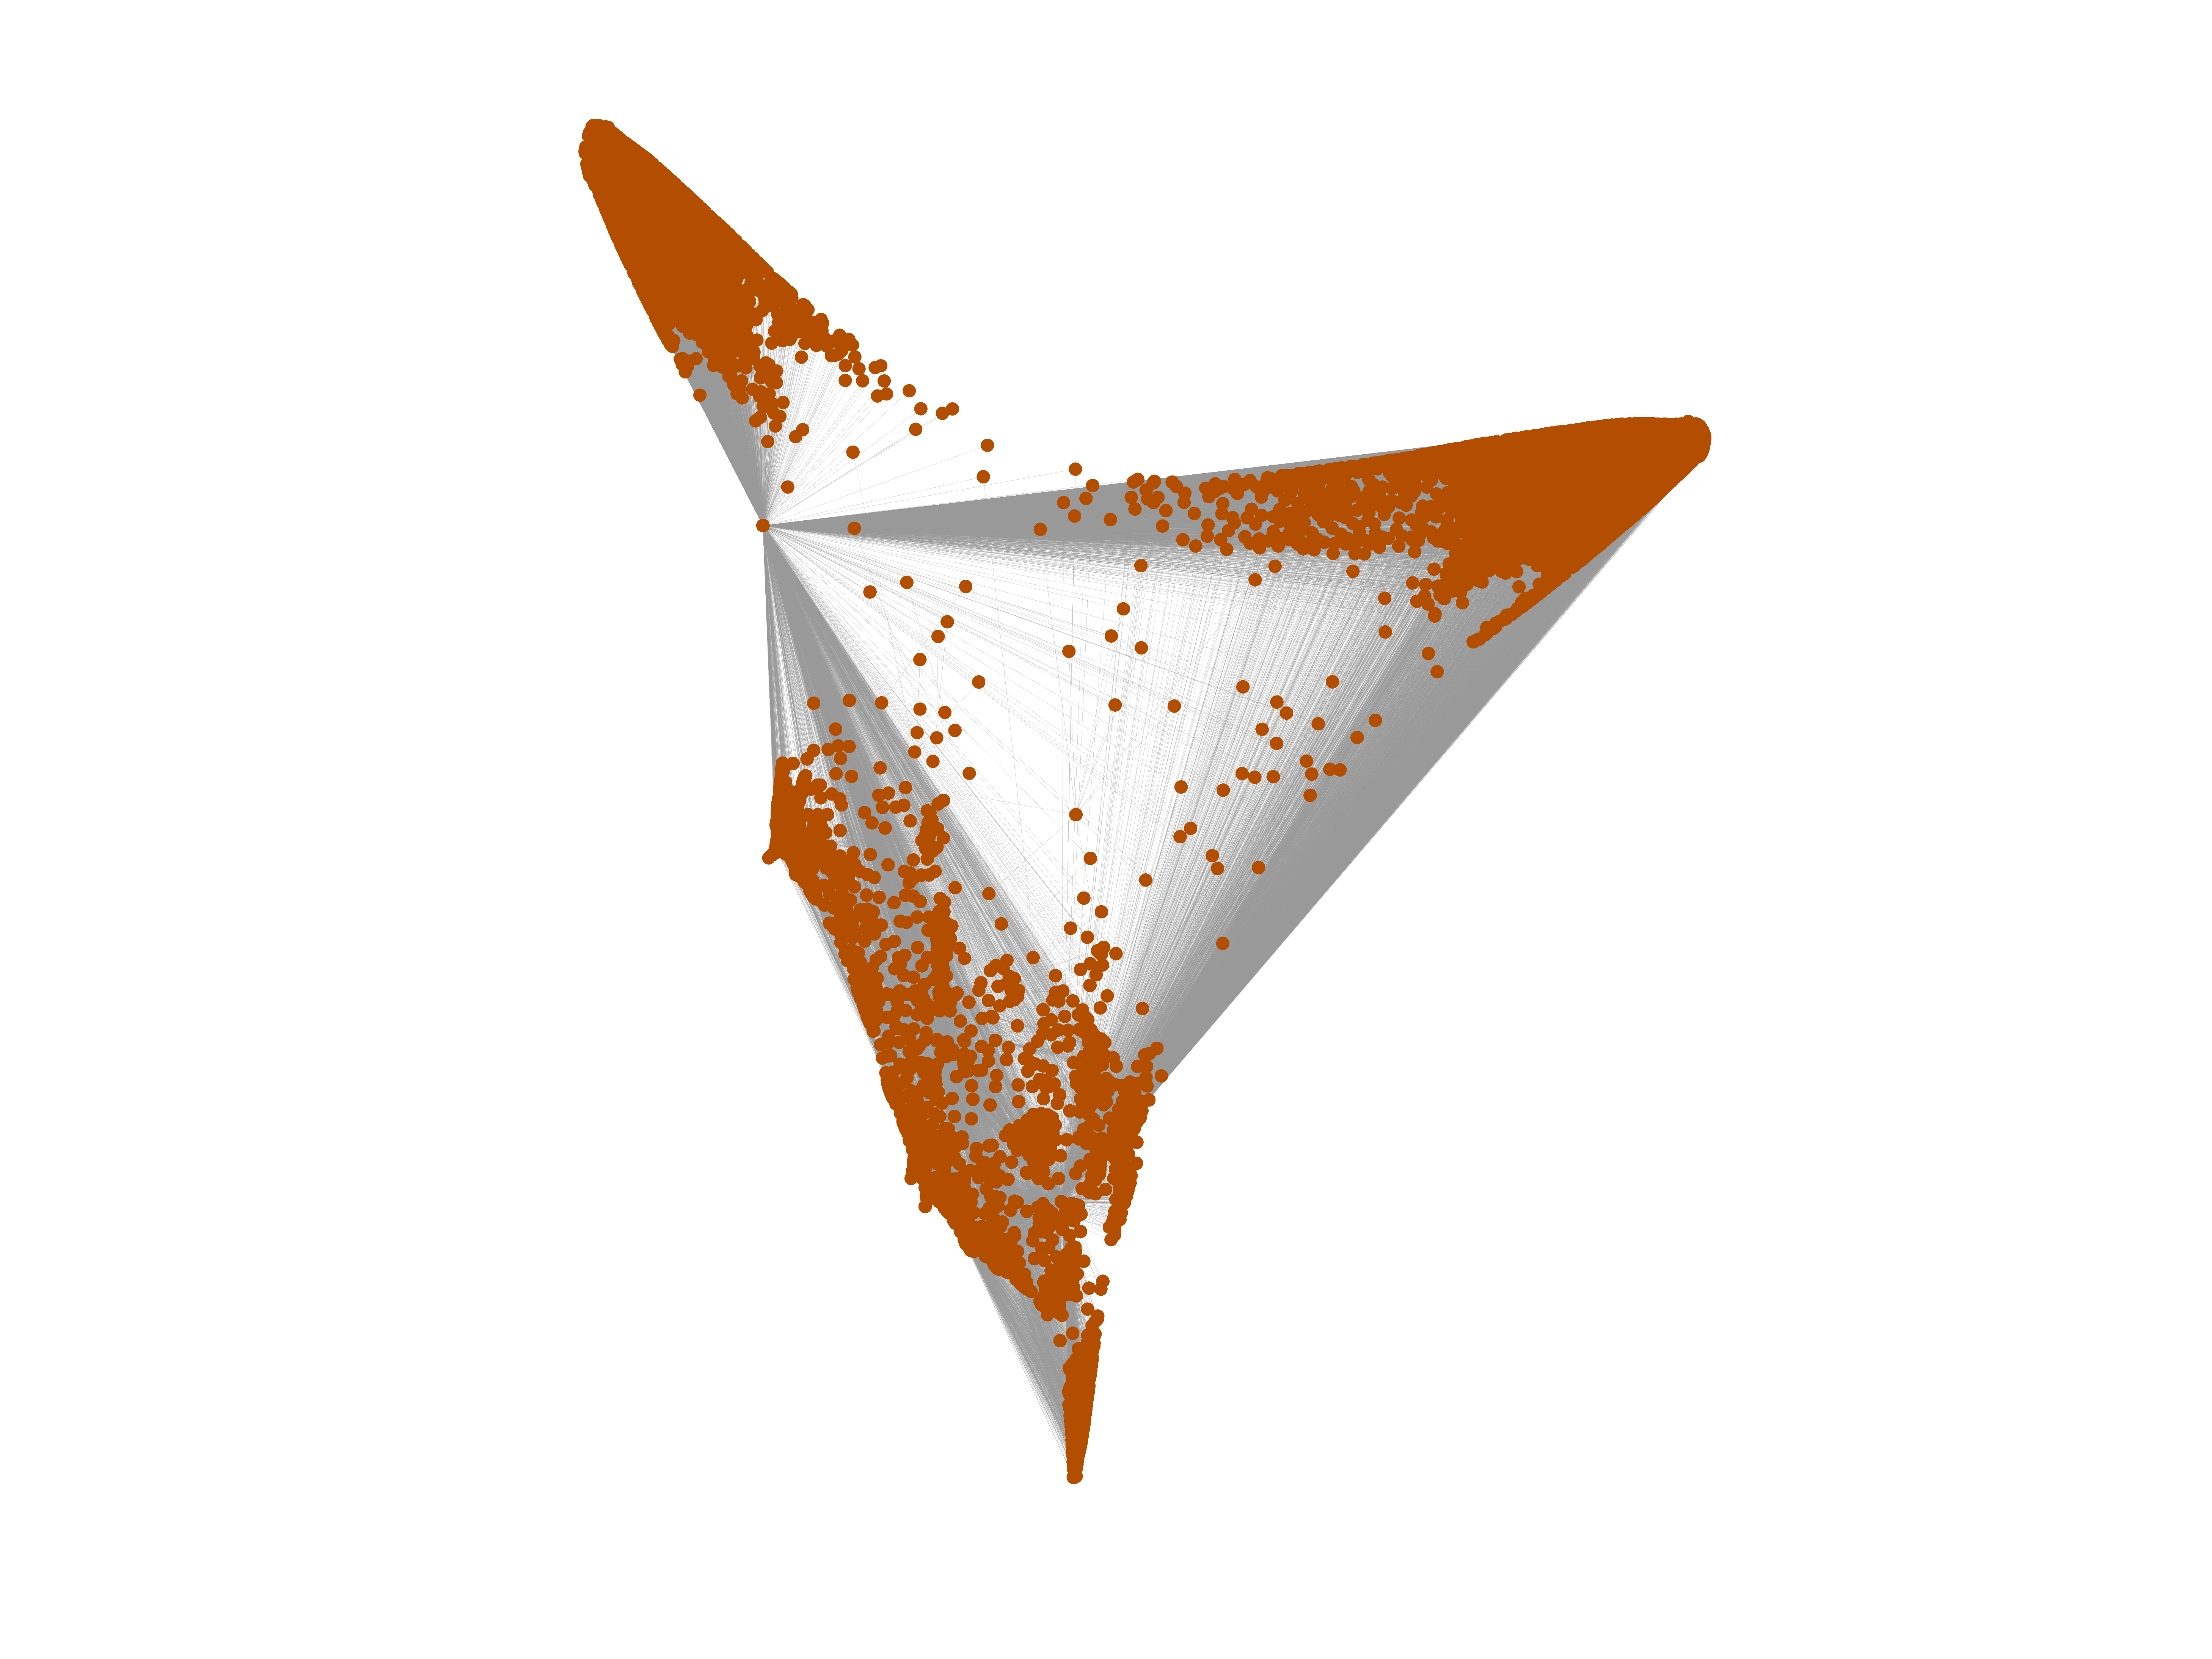
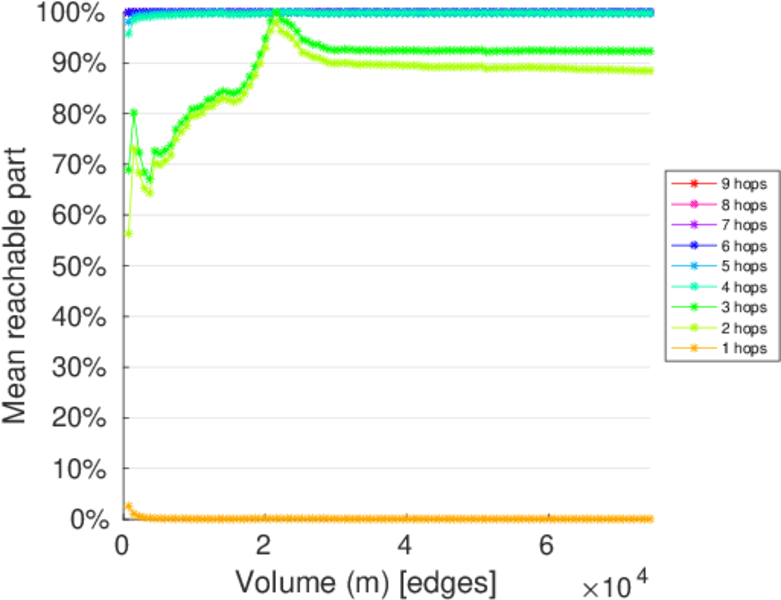
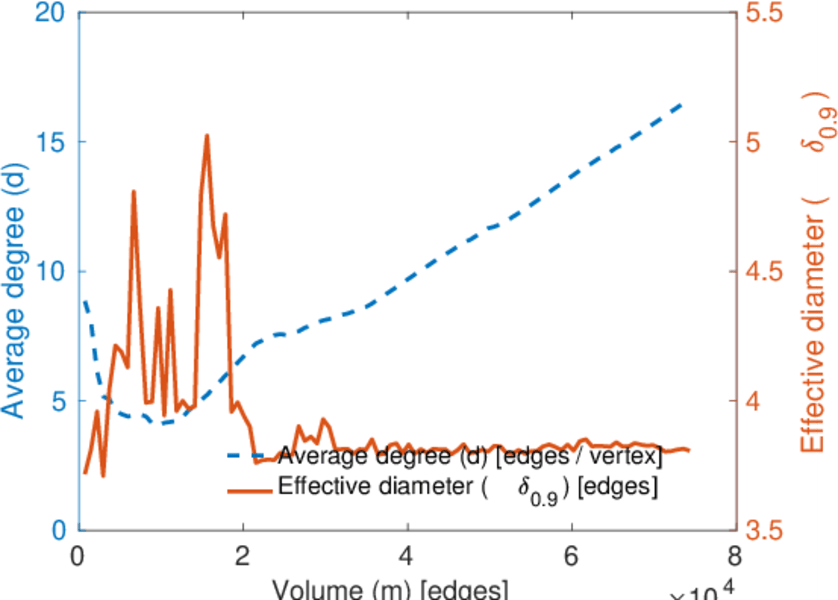
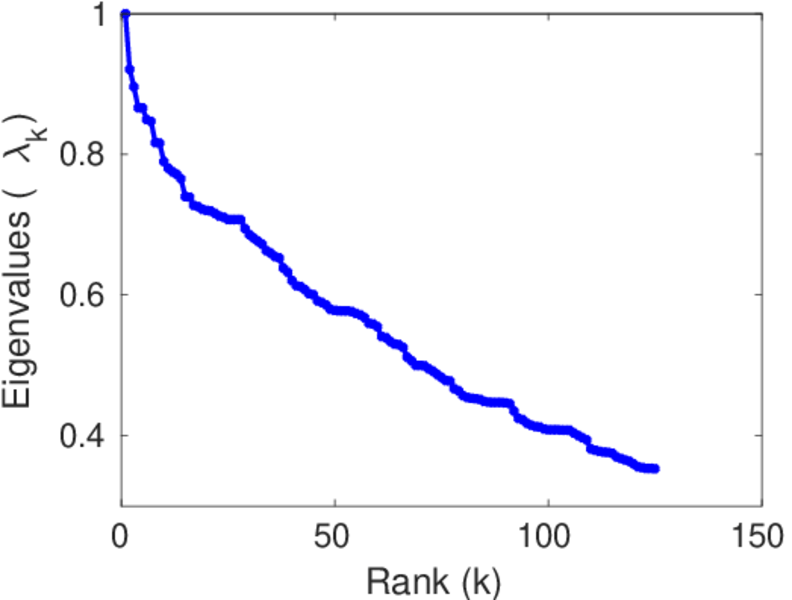
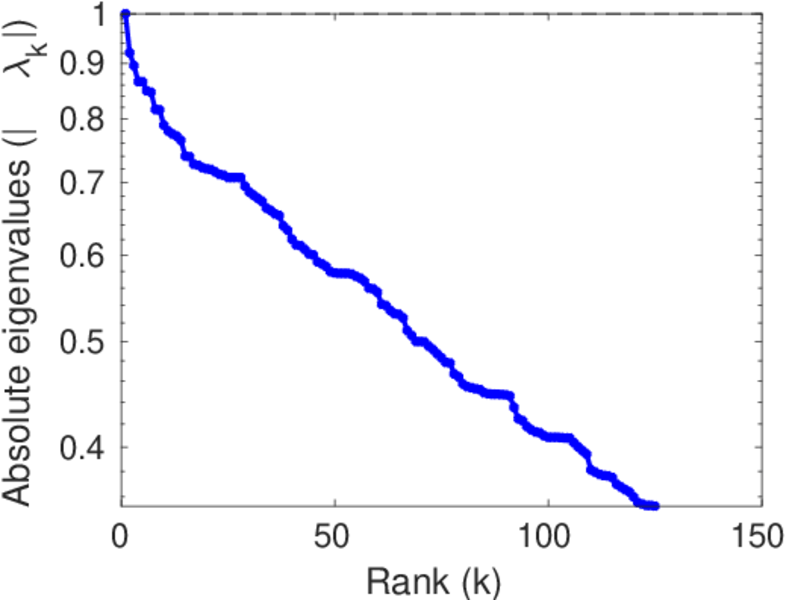
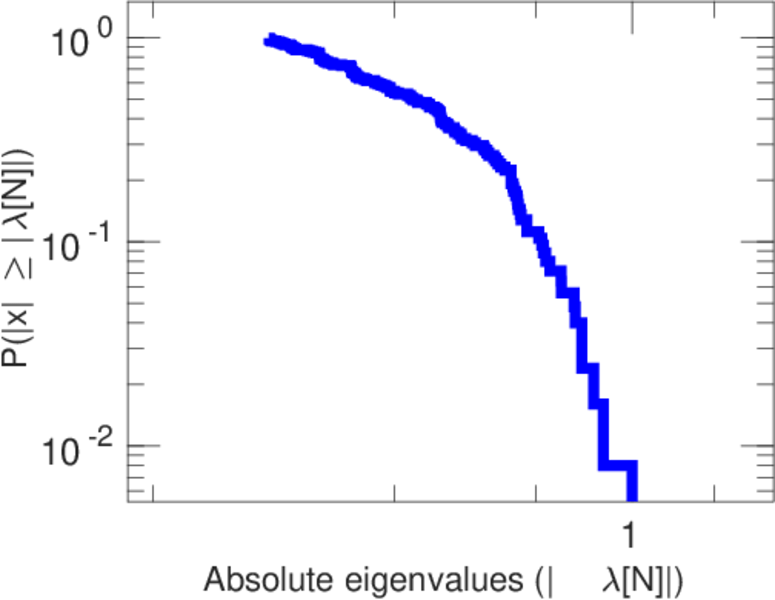
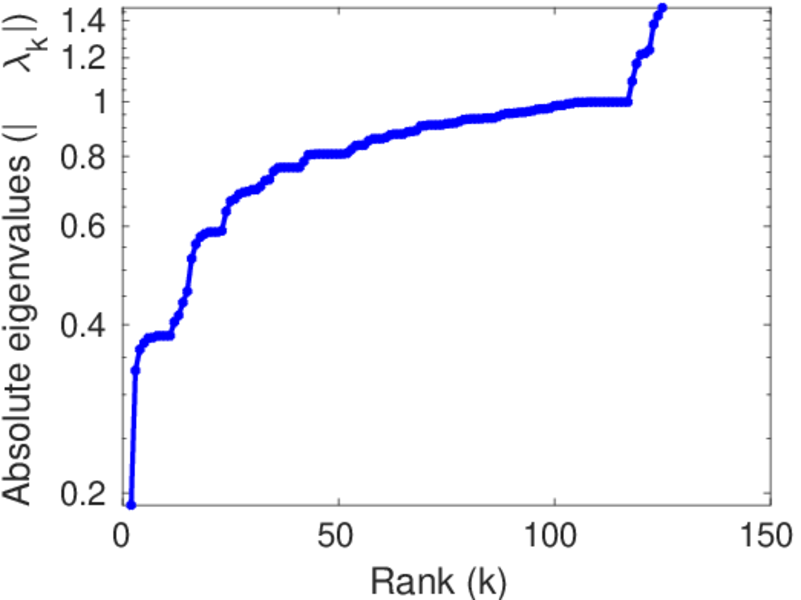
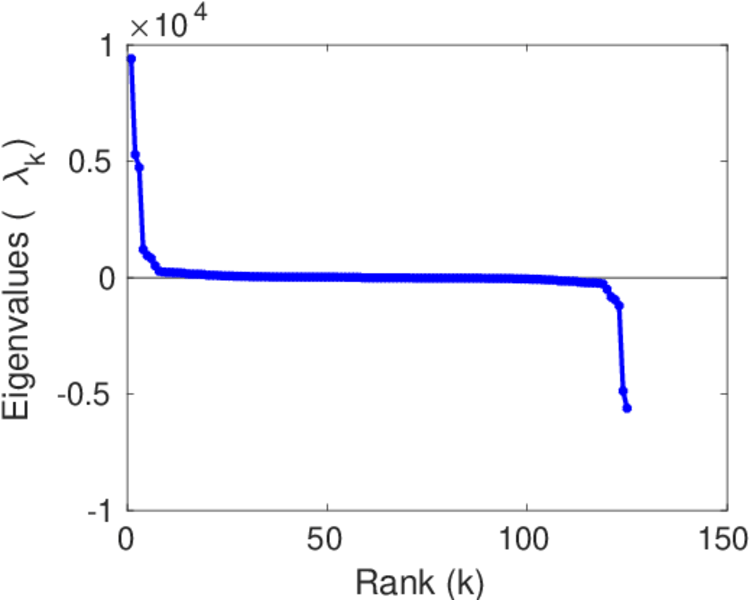
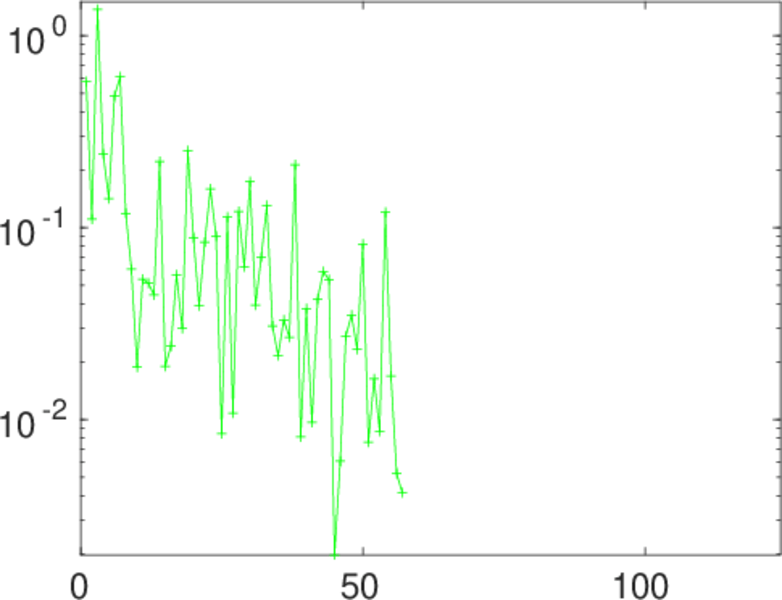
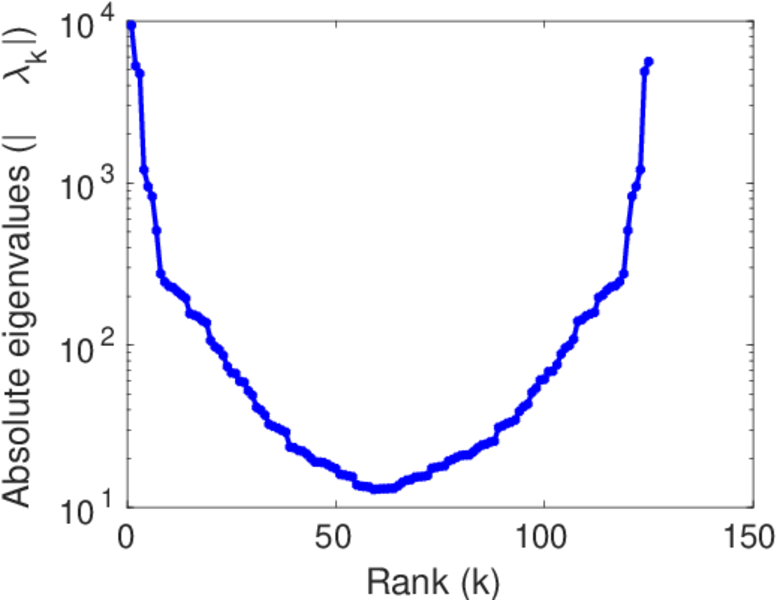
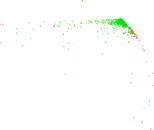
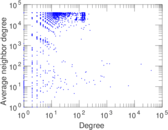
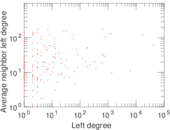
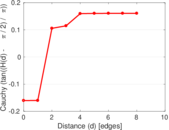
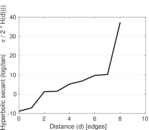
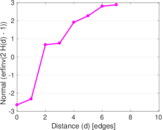
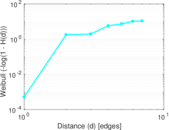
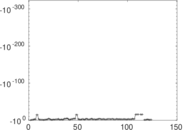
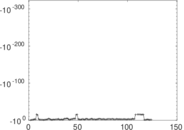
Plots


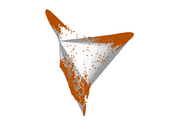


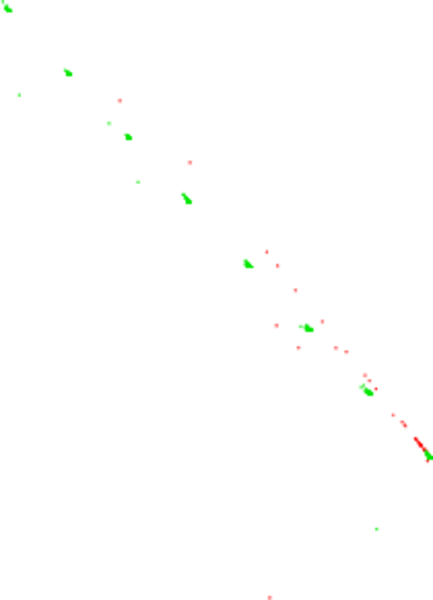
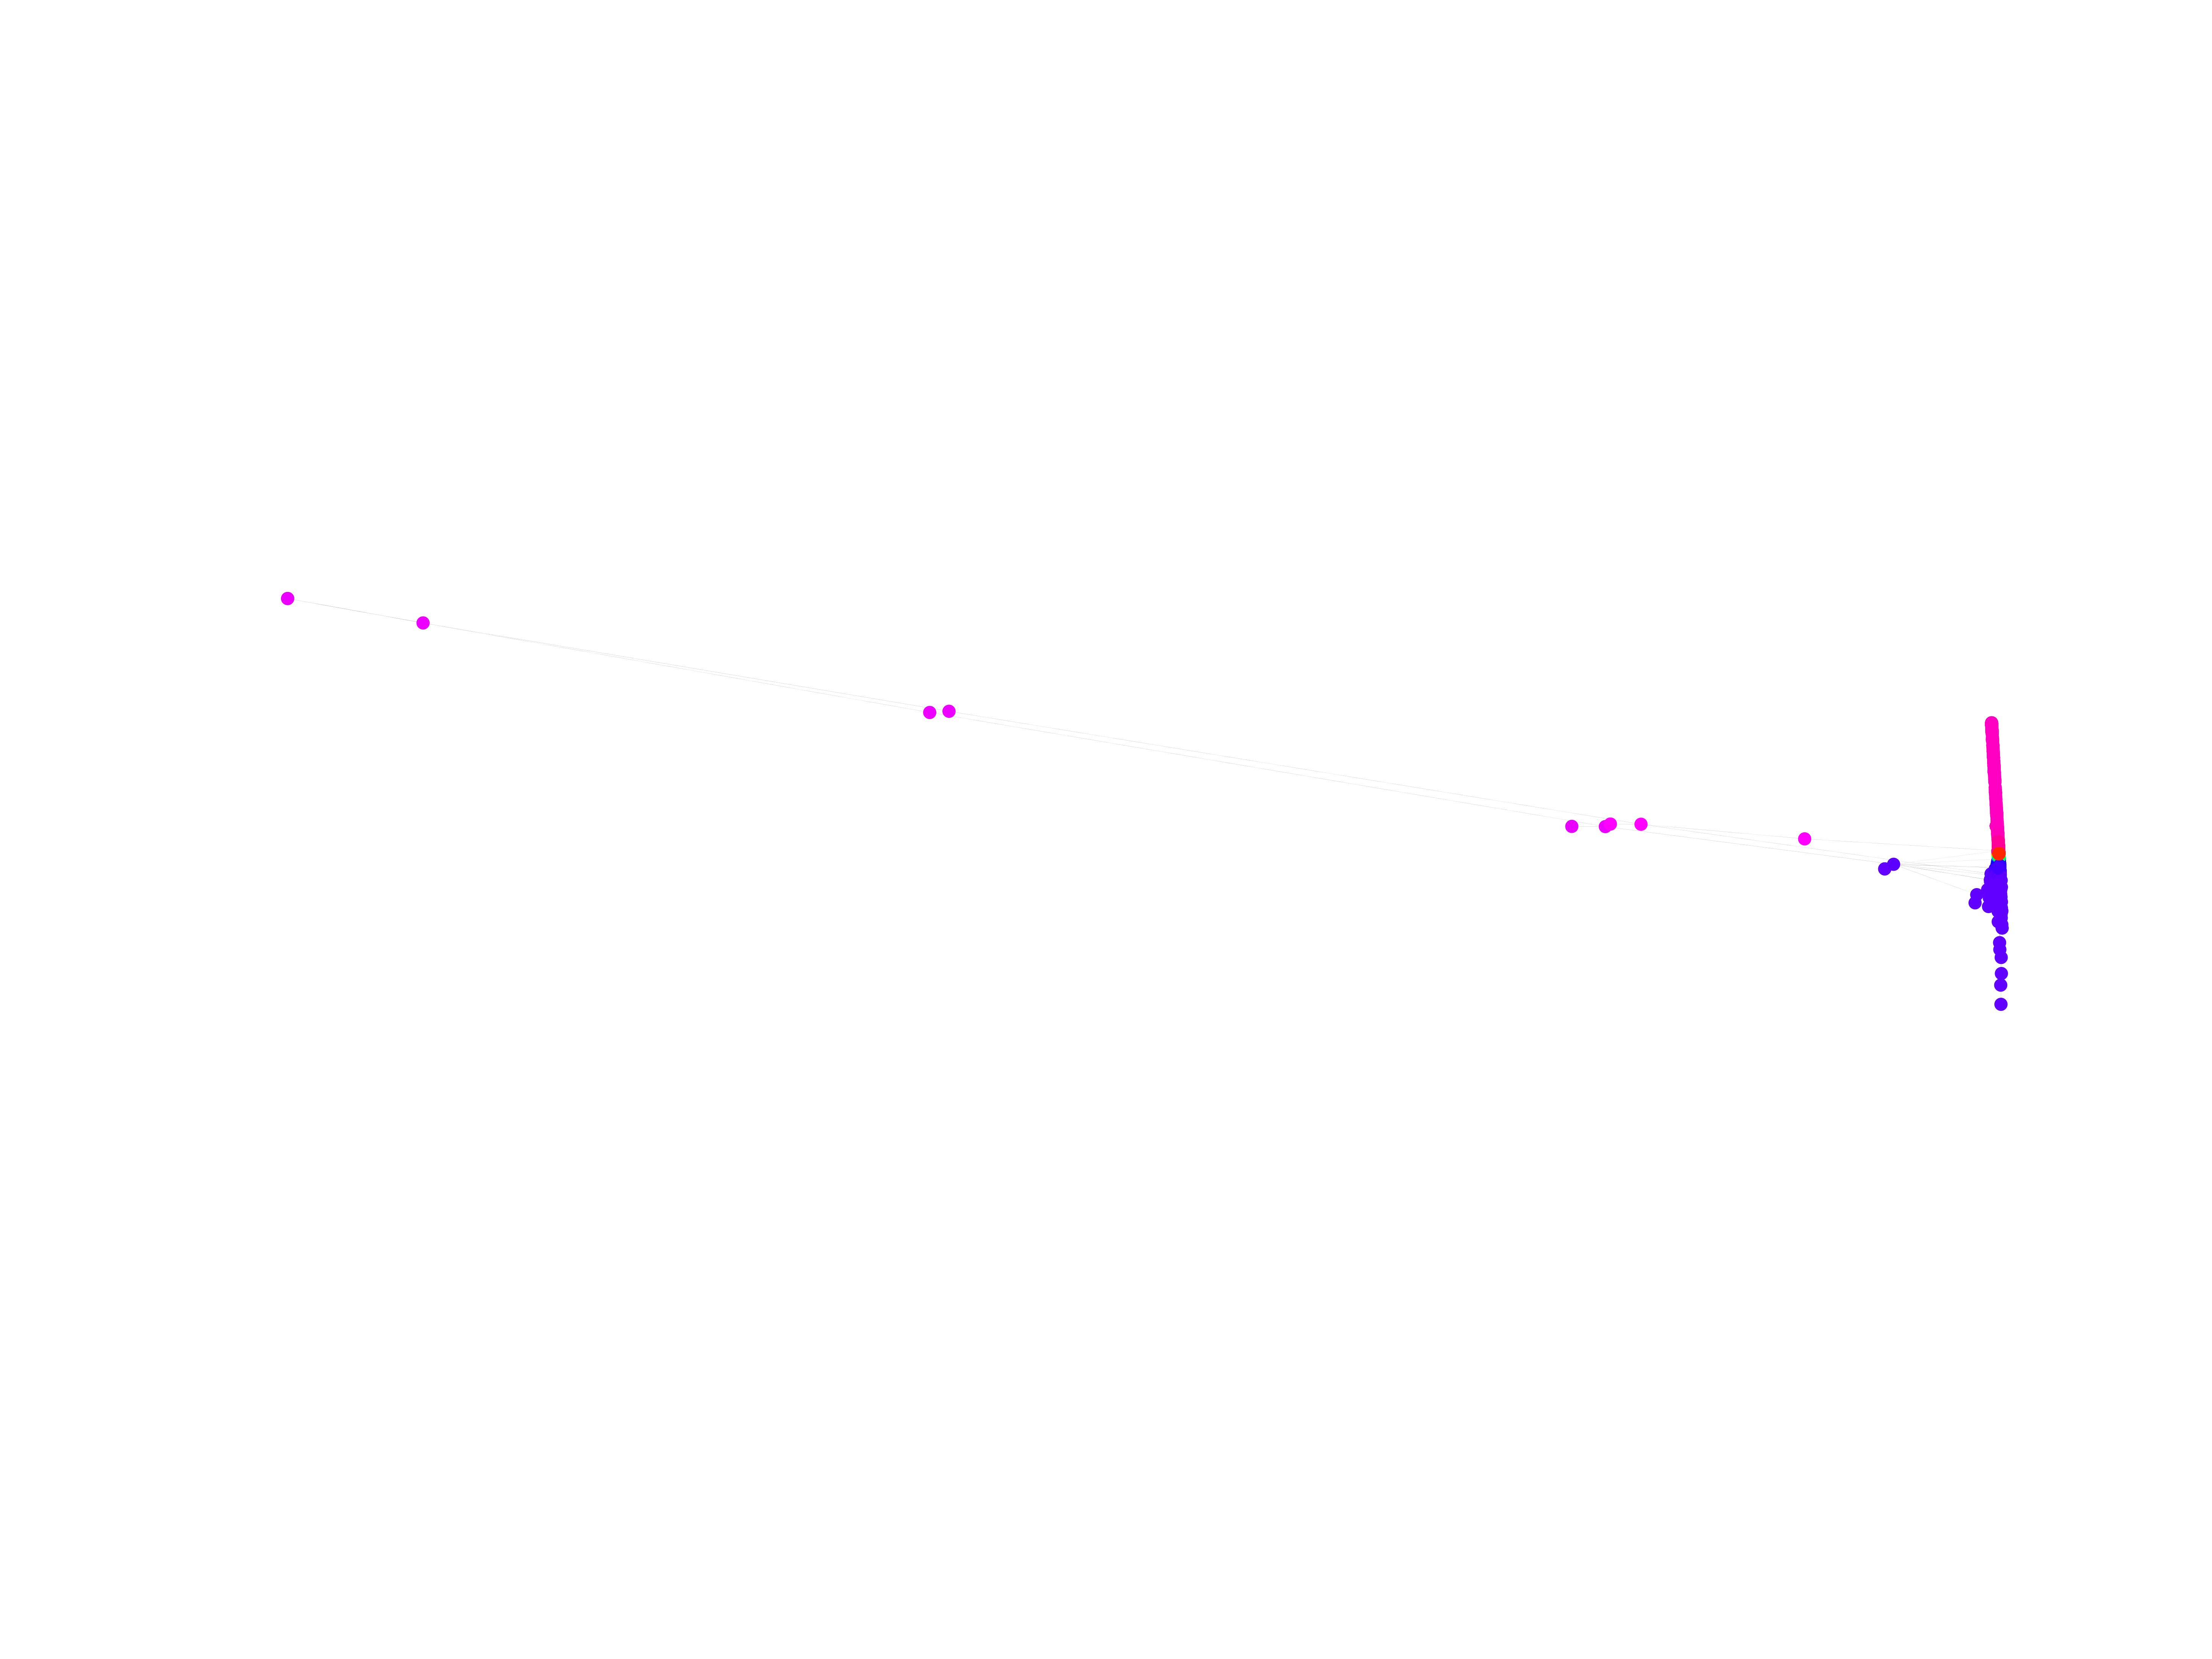
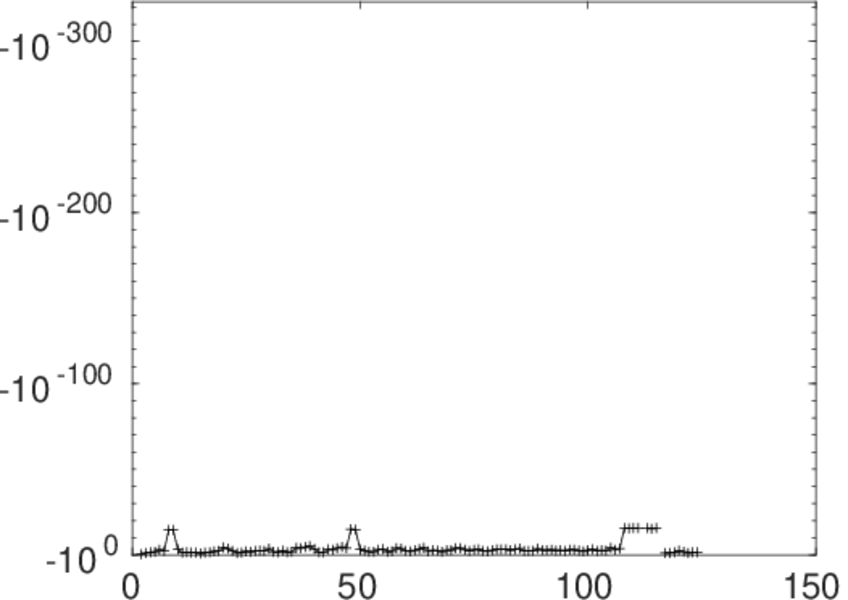
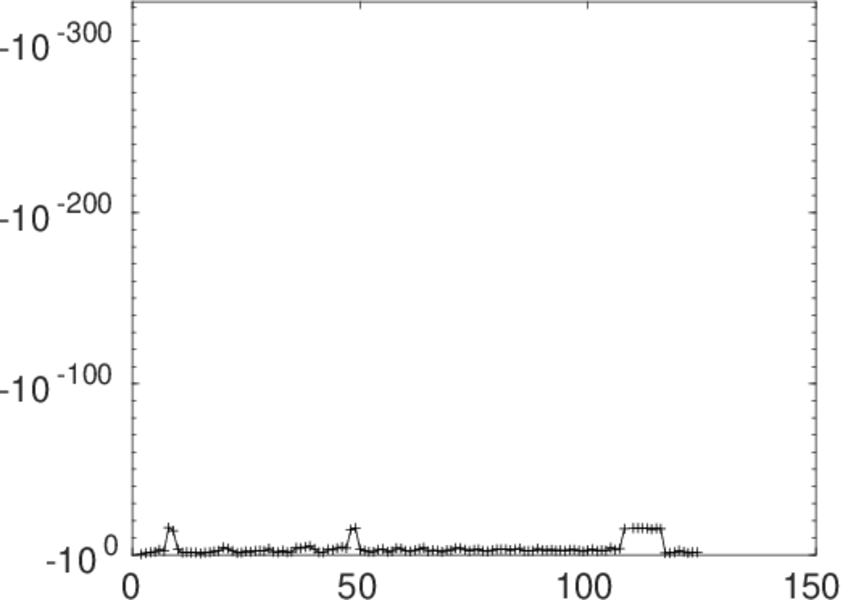
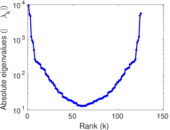
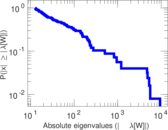
Matrix decompositions plots


Downloads
References
|
[1]
|
Jérôme Kunegis.
KONECT – The Koblenz Network Collection.
In Proc. Int. Conf. on World Wide Web Companion, pages
1343–1350, 2013.
[ http ]
|
|
[2]
|
Wikimedia Foundation.
Wikimedia downloads.
http://dumps.wikimedia.org/, January 2010.
|
 KONECT ‣ Networks ‣
Buy Me a Coffee
KONECT ‣ Networks ‣
Buy Me a Coffee