Wiktionary edits (lt)
This is the bipartite edit network of the Lithuanian Wiktionary. It contains
users and pages from the Lithuanian Wiktionary, connected by edit events. Each
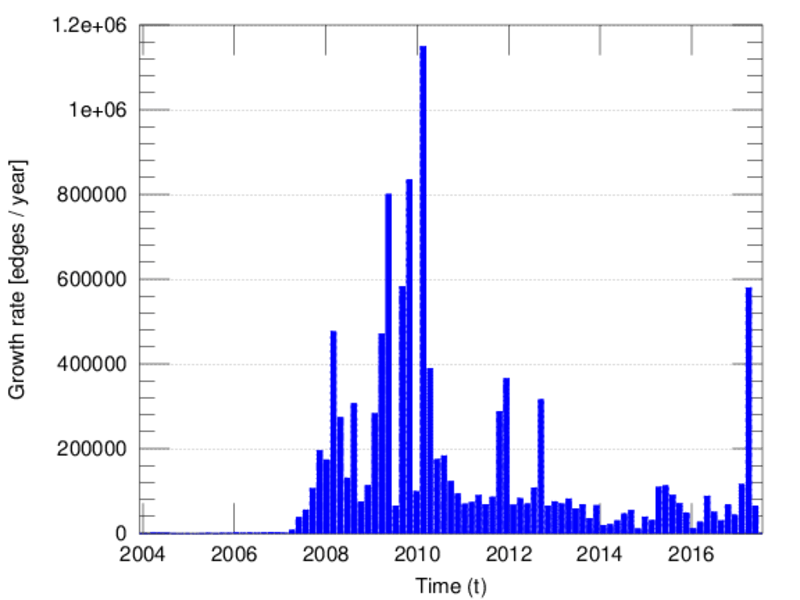
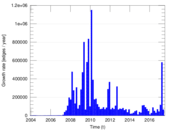
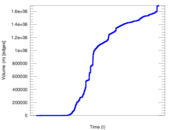
edge represents an edit. The dataset includes the timestamp of each edit.
Metadata
Statistics
| Size | n = | 689,678
|
| Left size | n1 = | 713
|
| Right size | n2 = | 688,965
|
| Volume | m = | 1,693,277
|
| Unique edge count | m̿ = | 1,127,170
|
| Wedge count | s = | 182,596,865,400
|
| Claw count | z = | 33,198,744,819,786,132
|
| Cross count | x = | 4.791 77 × 1021
|
| Square count | q = | 9,785,940,460
|
| 4-Tour count | T4 = | 808,677,240,208
|
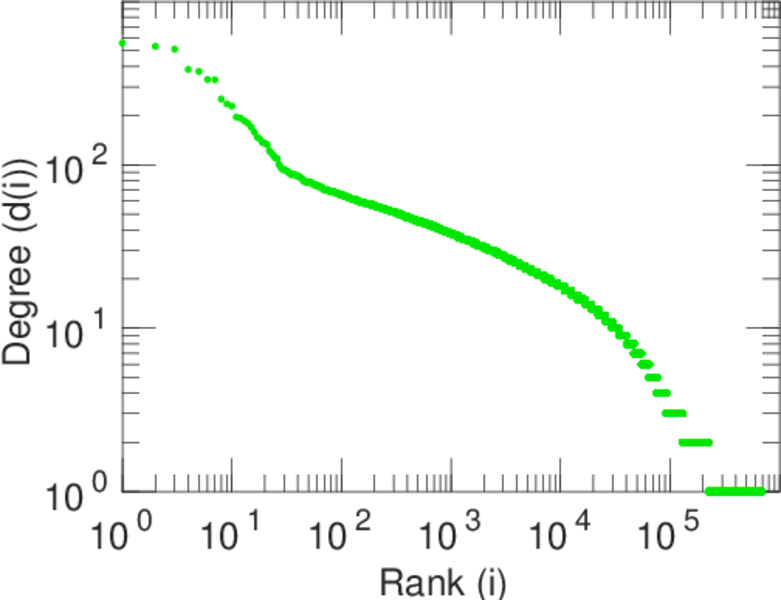
| Maximum degree | dmax = | 712,788
|
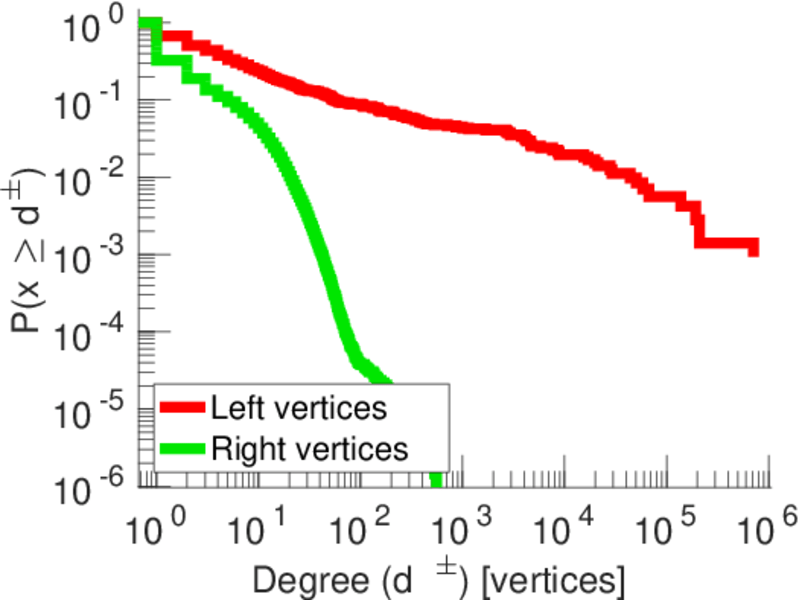
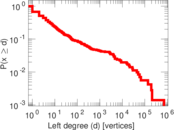
| Maximum left degree | d1max = | 712,788
|
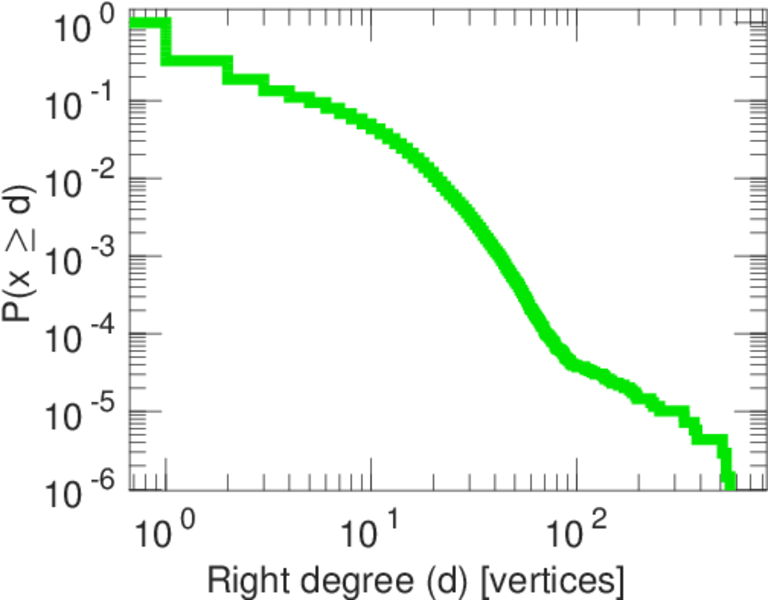
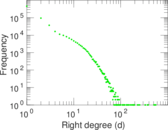
| Maximum right degree | d2max = | 557
|
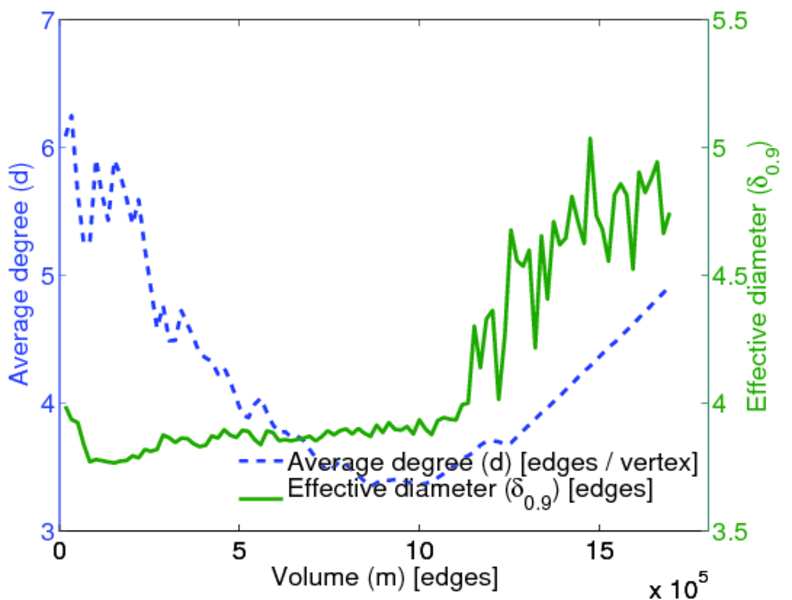
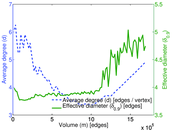
| Average degree | d = | 4.910 34
|
| Average left degree | d1 = | 2,374.86
|
| Average right degree | d2 = | 2.457 71
|
| Fill | p = | 0.002 294 58
|
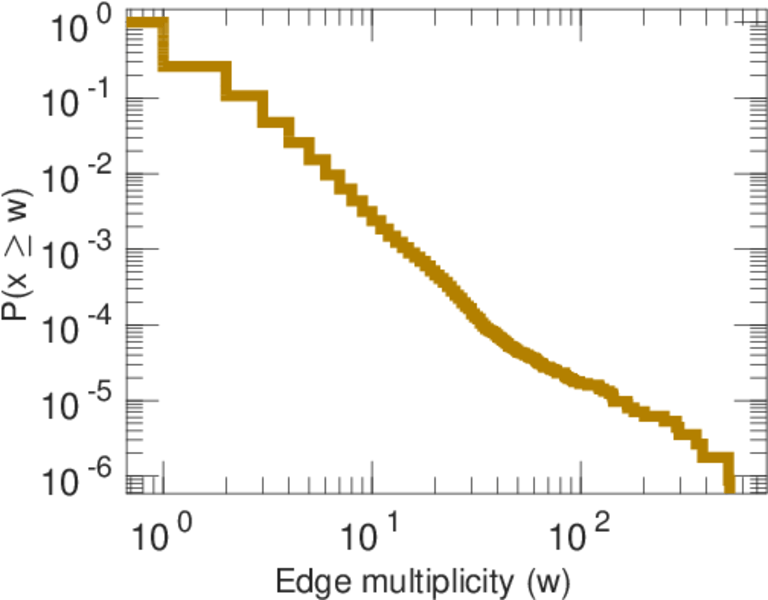
| Average edge multiplicity | m̃ = | 1.502 24
|
| Size of LCC | N = | 689,337
|
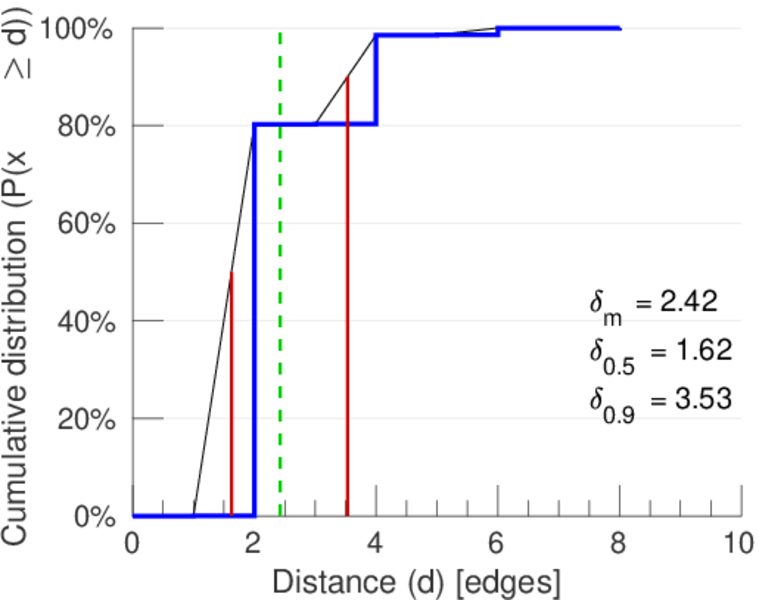
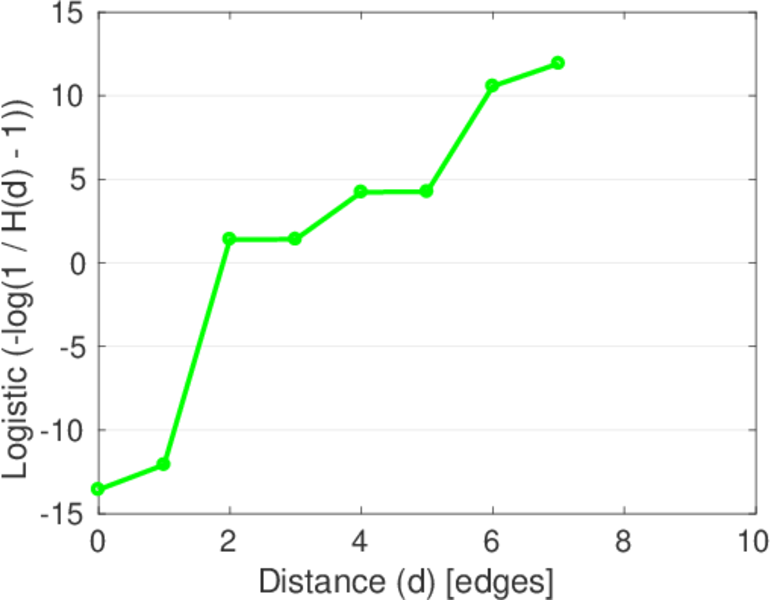
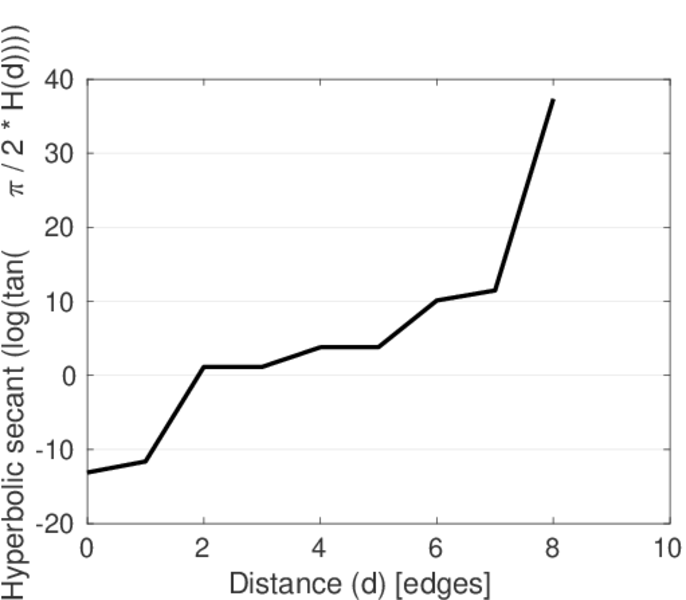
| Diameter | δ = | 10
|
| 50-Percentile effective diameter | δ0.5 = | 1.623 19
|
| 90-Percentile effective diameter | δ0.9 = | 3.530 72
|
| Median distance | δM = | 2
|
| Mean distance | δm = | 2.422 94
|
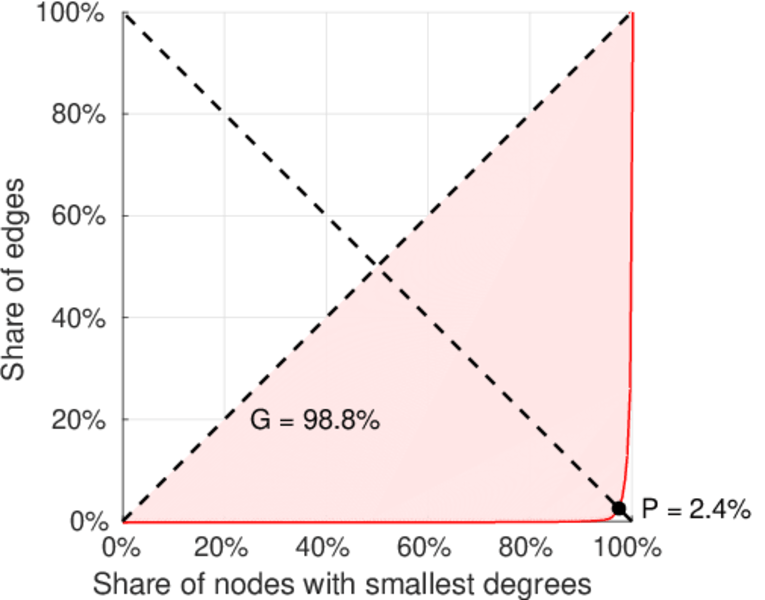
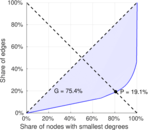
| Gini coefficient | G = | 0.754 514
|
| Balanced inequality ratio | P = | 0.190 694
|
| Left balanced inequality ratio | P1 = | 0.023 522 4
|
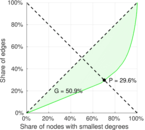
| Right balanced inequality ratio | P2 = | 0.295 796
|
| Relative edge distribution entropy | Her = | 0.616 847
|
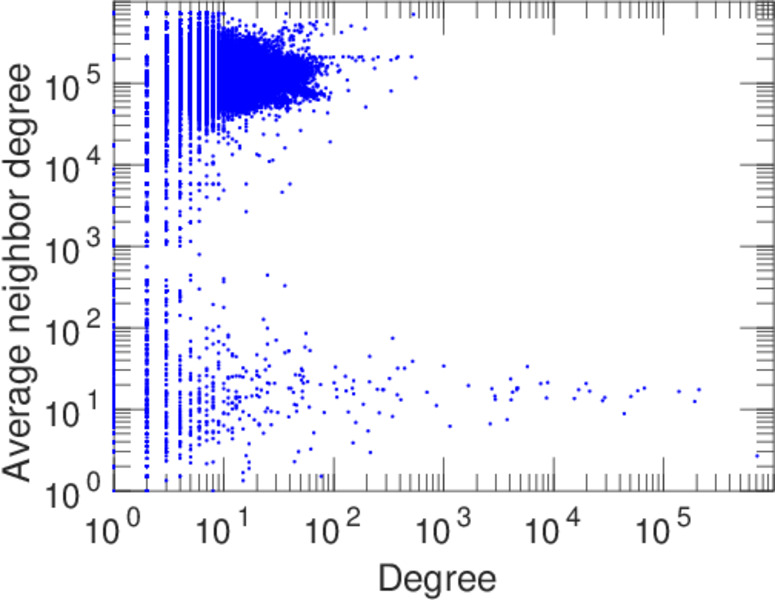
| Degree assortativity | ρ = | −0.693 128
|
| Degree assortativity p-value | pρ = | 0.000 00
|
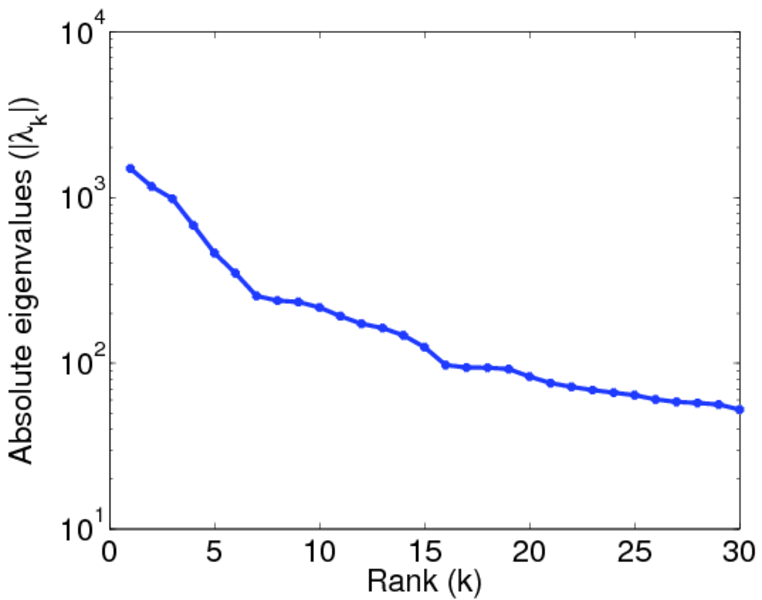
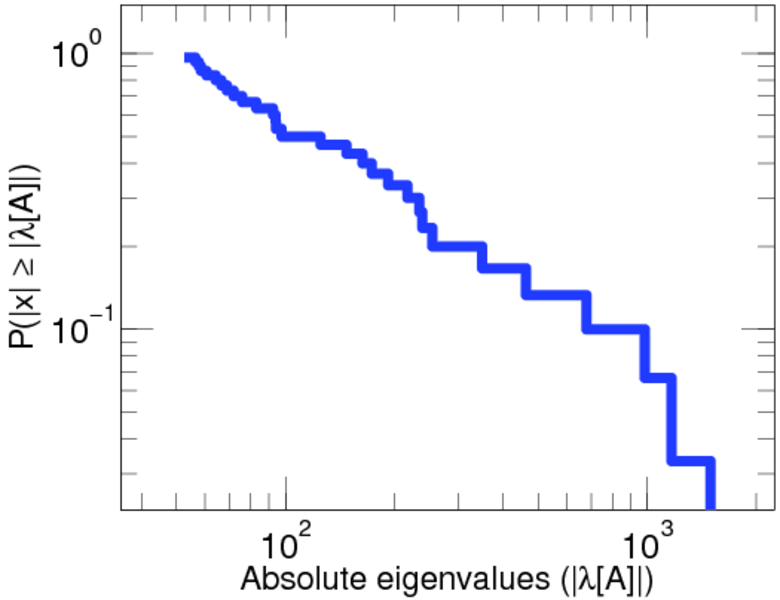
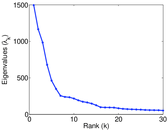
| Spectral norm | α = | 1,495.09
|
| Algebraic connectivity | a = | 0.012 506 7
|
| Spectral separation | |λ1[A] / λ2[A]| = | 1.282 52
|
| Controllability | C = | 688,175
|
| Relative controllability | Cr = | 0.997 967
|
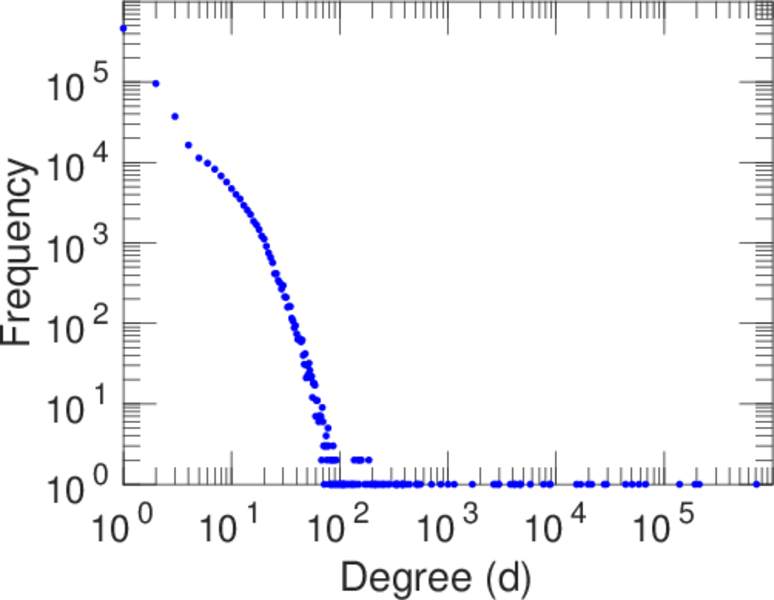
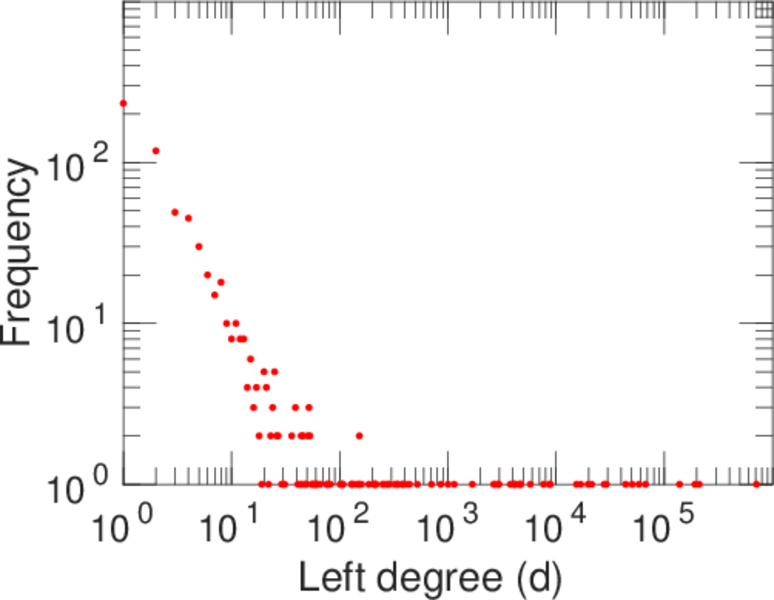
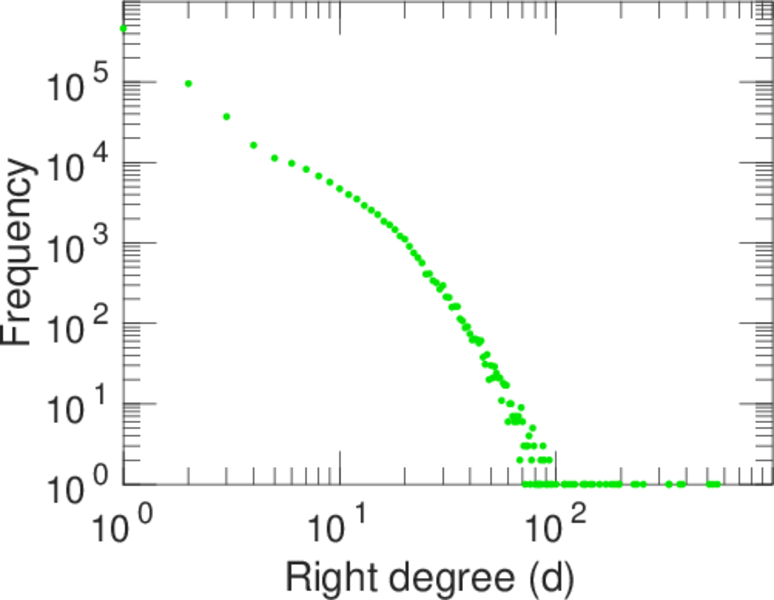
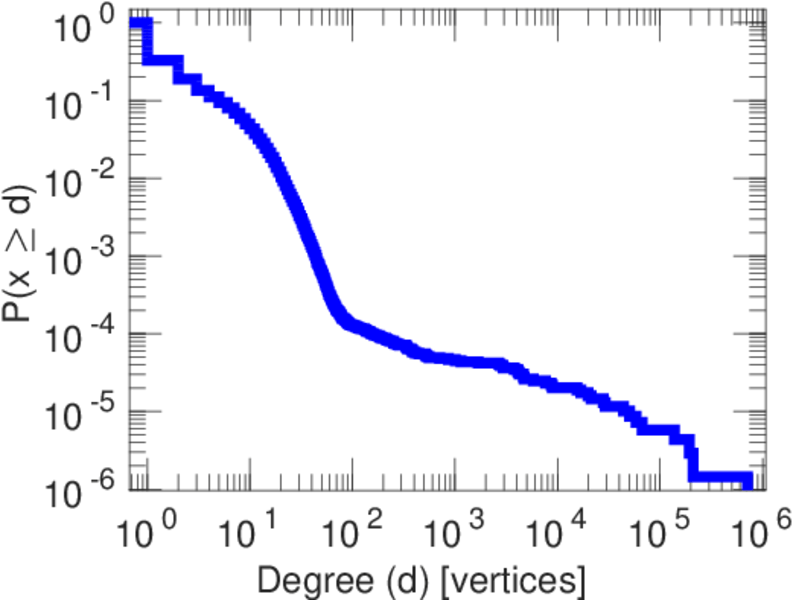
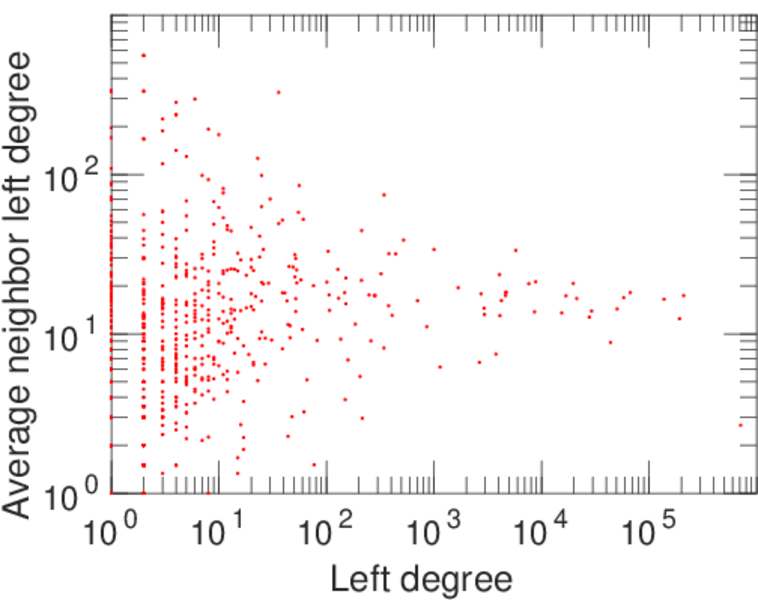
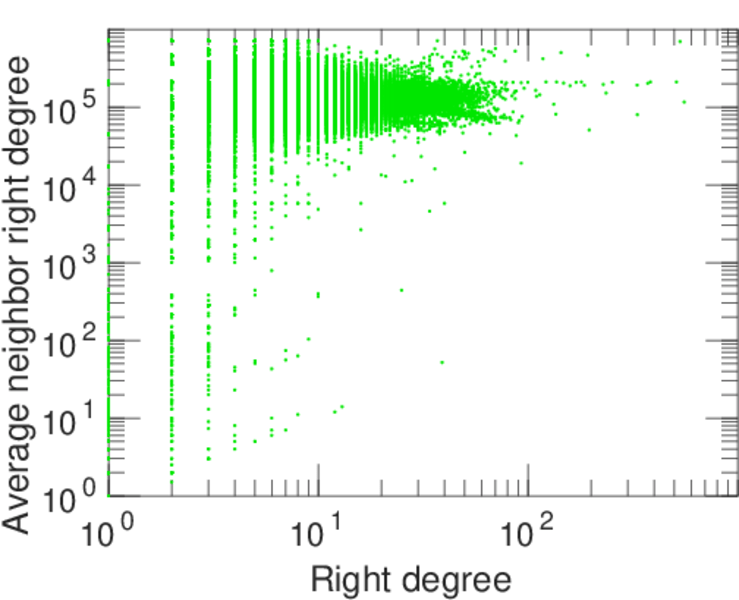
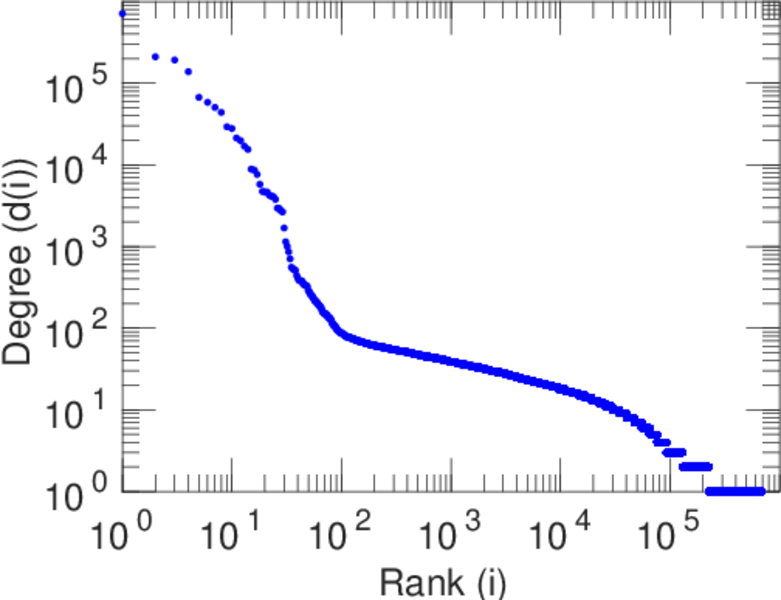
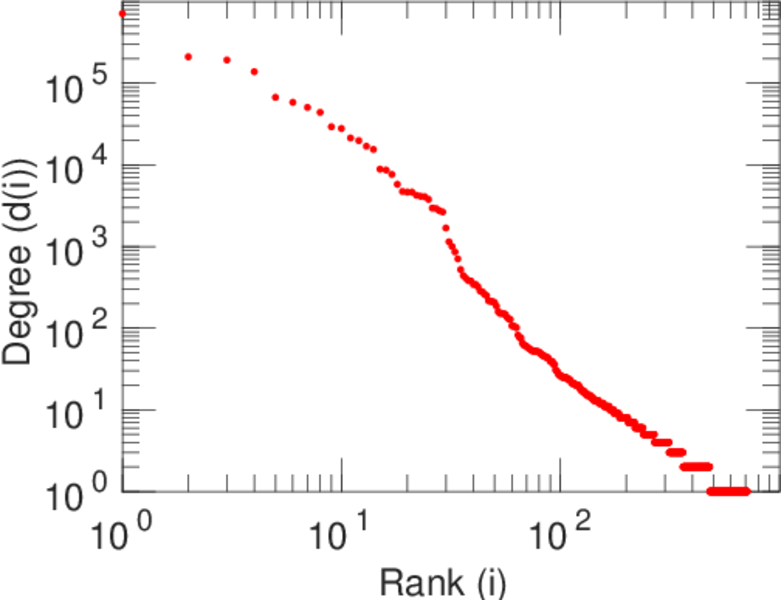
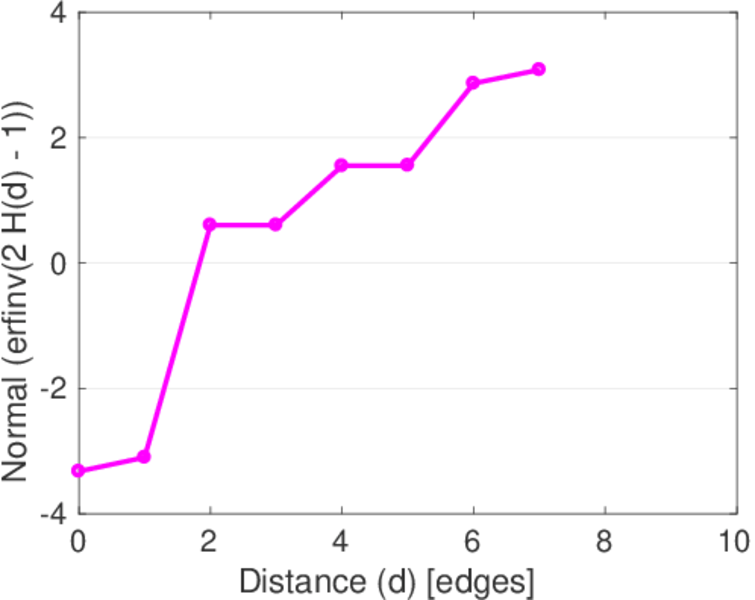
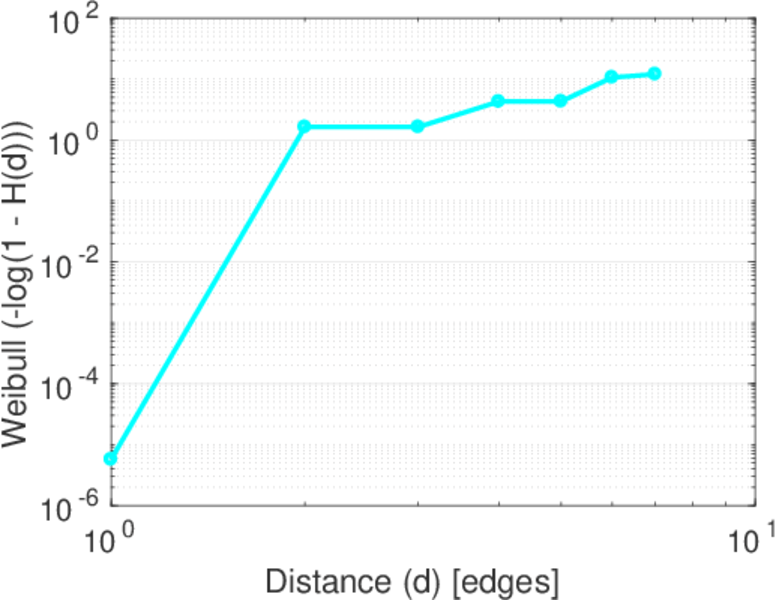
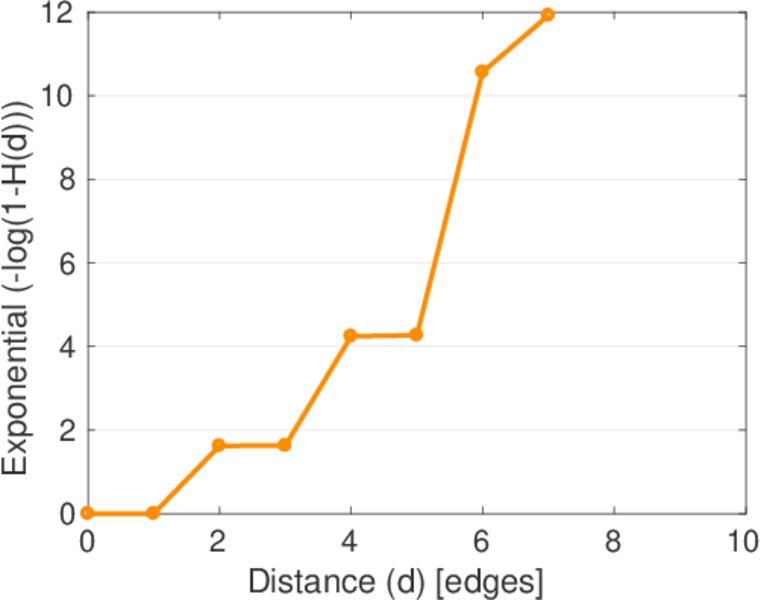
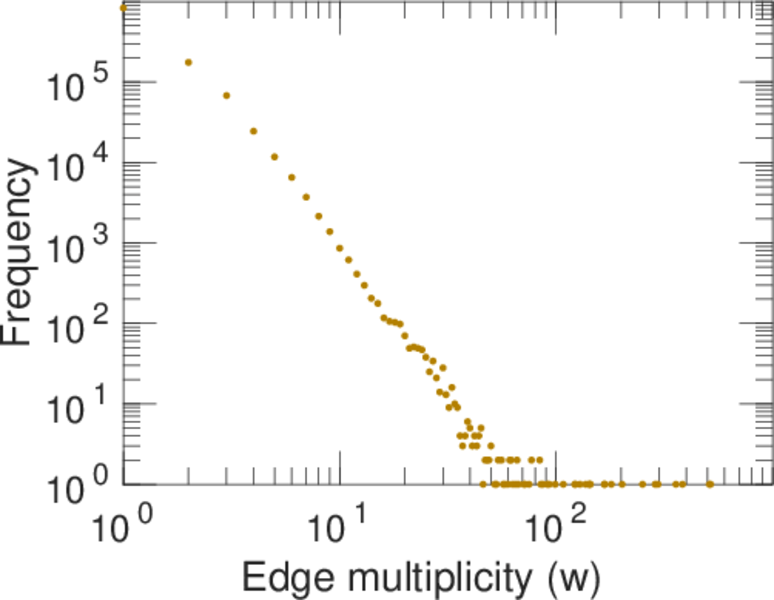
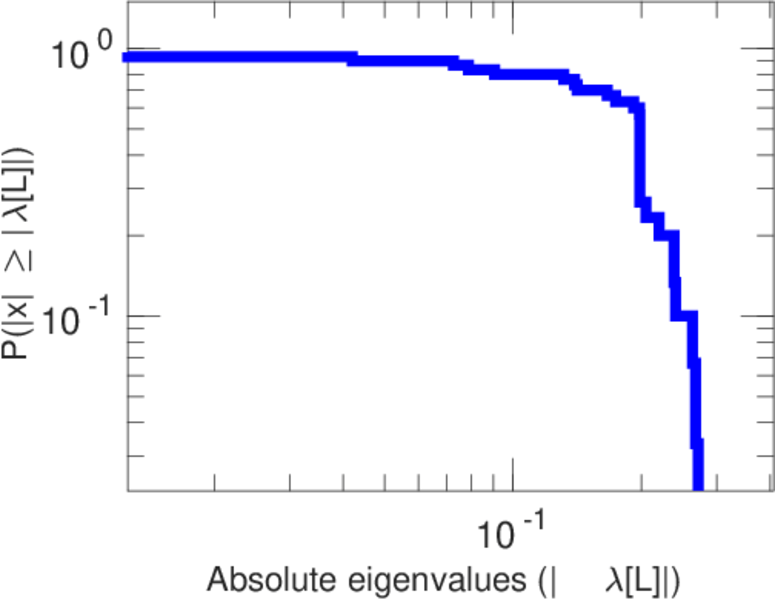
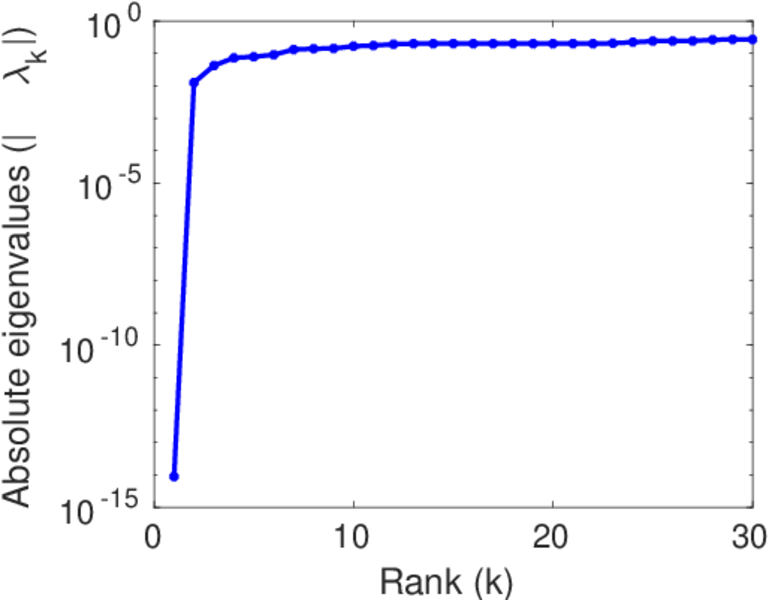
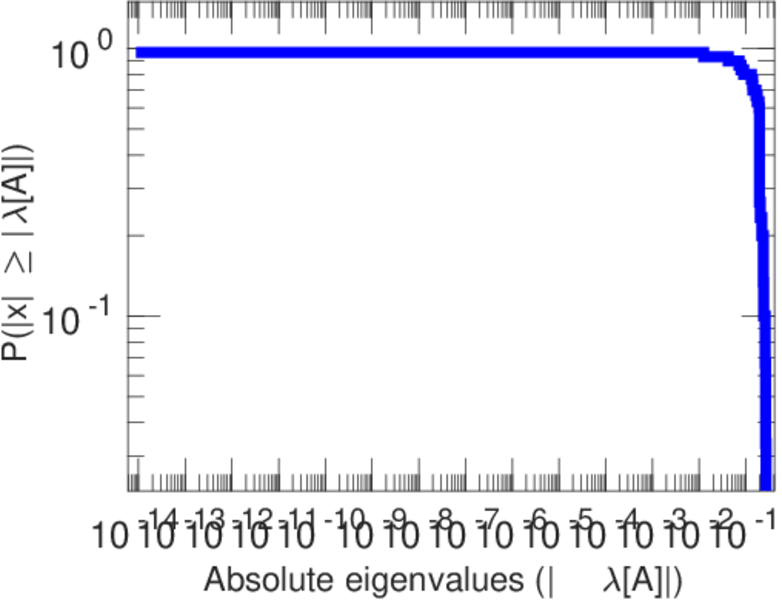
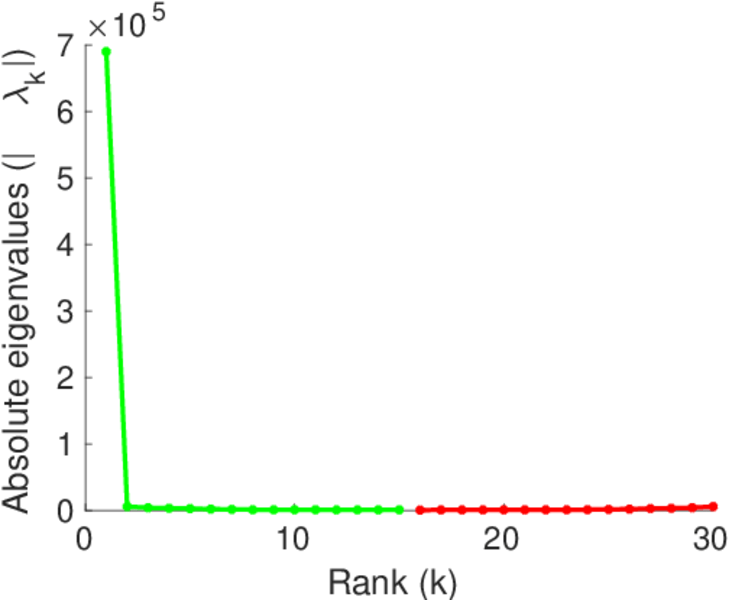
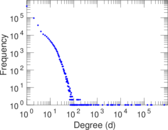
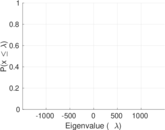
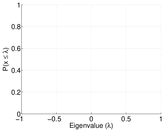
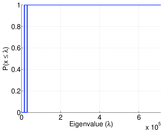
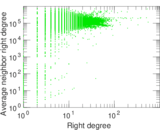
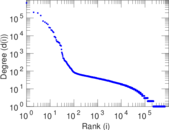
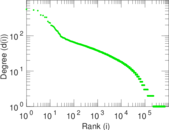
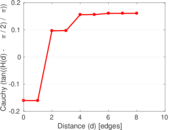
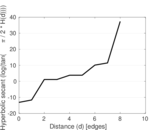
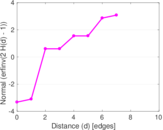
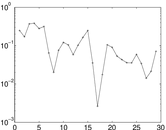
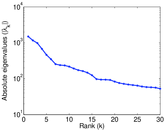
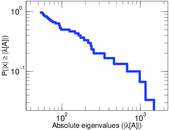
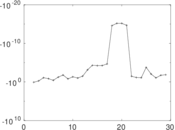
Plots


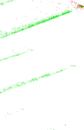


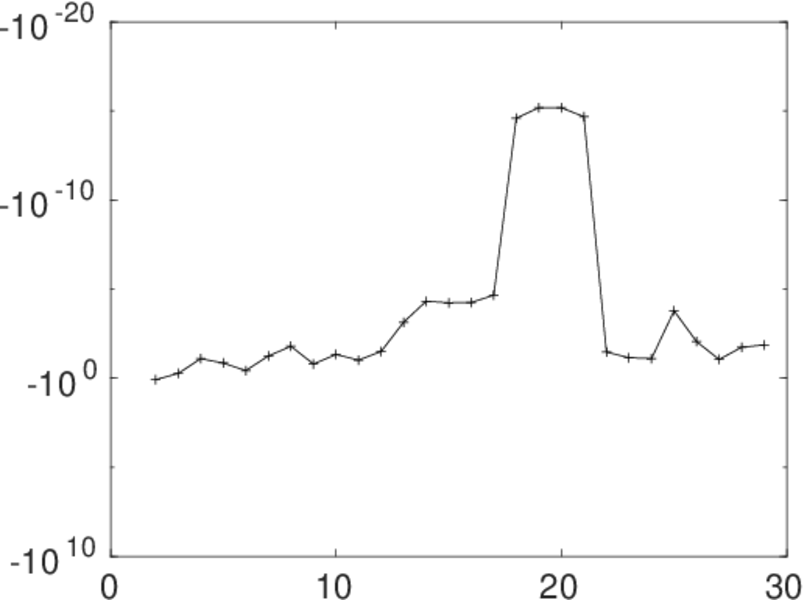
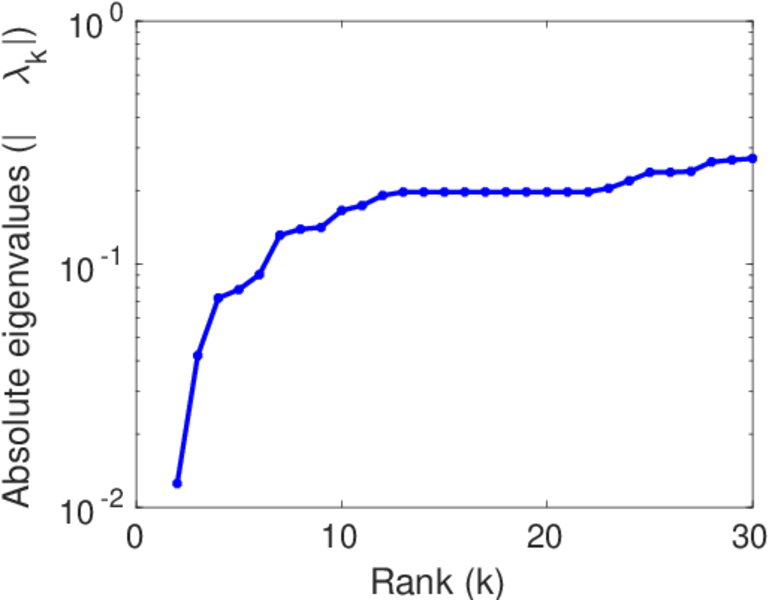
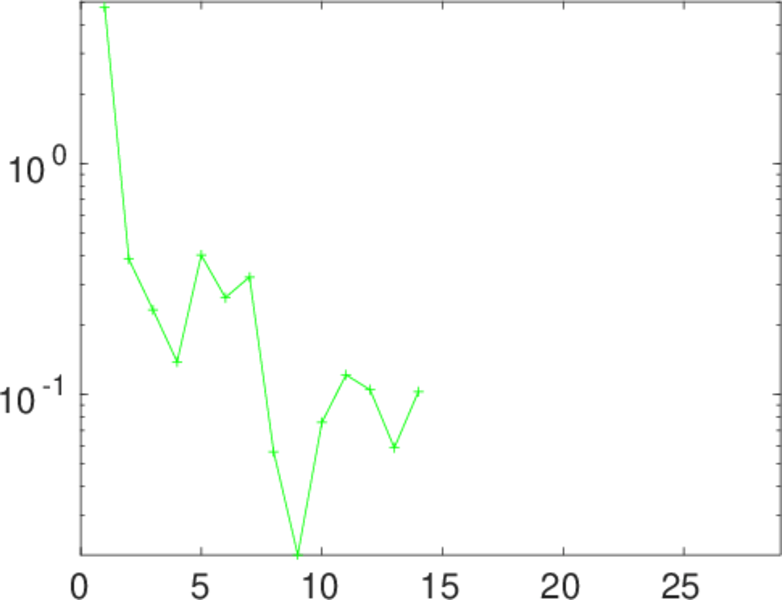
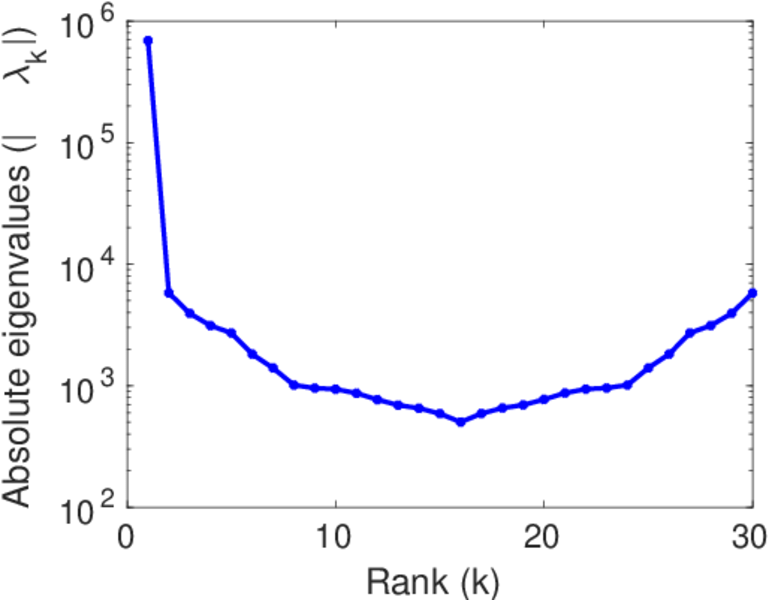
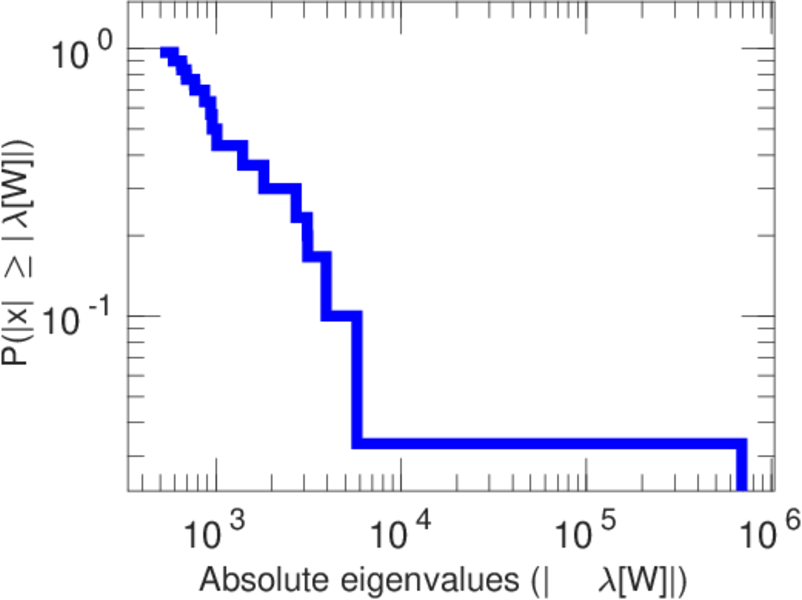
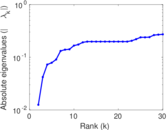
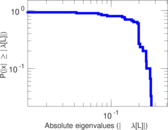
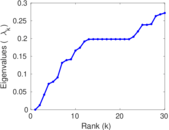
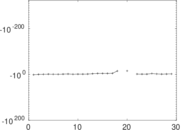
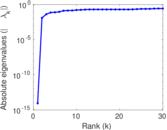
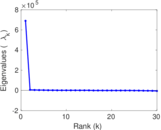
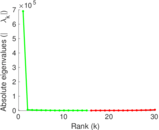
Matrix decompositions plots


Downloads
References
|
[1]
|
Jérôme Kunegis.
KONECT – The Koblenz Network Collection.
In Proc. Int. Conf. on World Wide Web Companion, pages
1343–1350, 2013.
[ http ]
|
|
[2]
|
Wikimedia Foundation.
Wikimedia downloads.
http://dumps.wikimedia.org/, January 2010.
|
 KONECT ‣ Networks ‣
Buy Me a Coffee
KONECT ‣ Networks ‣
Buy Me a Coffee