Wikipedia edits (lv)
This is the bipartite edit network of the Latvian Wikipedia. It contains users
and pages from the Latvian Wikipedia, connected by edit events. Each edge
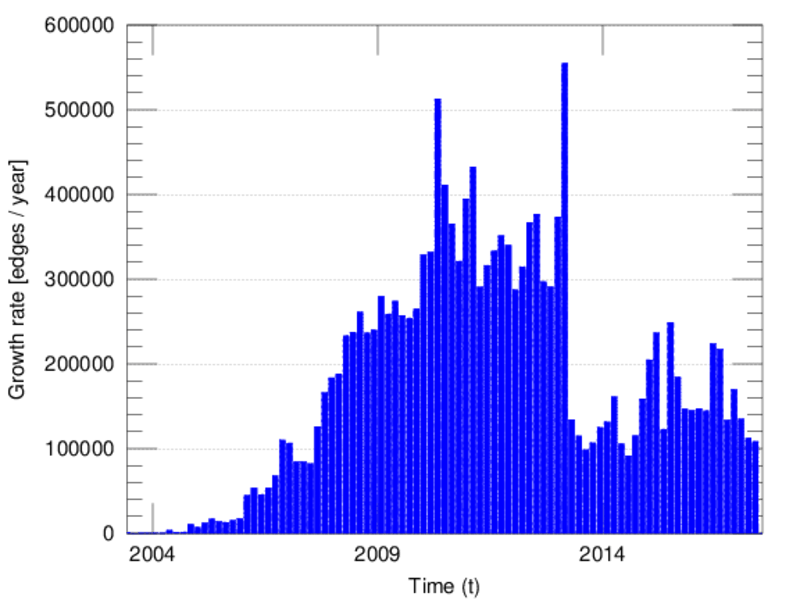
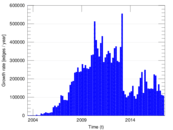
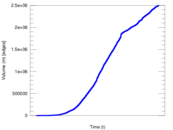
represents an edit. The dataset includes the timestamp of each edit.
Metadata
Statistics
| Size | n = | 327,280
|
| Left size | n1 = | 11,758
|
| Right size | n2 = | 315,522
|
| Volume | m = | 2,499,933
|
| Unique edge count | m̿ = | 1,242,525
|
| Wedge count | s = | 13,806,961,746
|
| Claw count | z = | 183,289,402,412,780
|
| Square count | q = | 18,278,081,647
|
| 4-Tour count | T4 = | 201,456,600,310
|
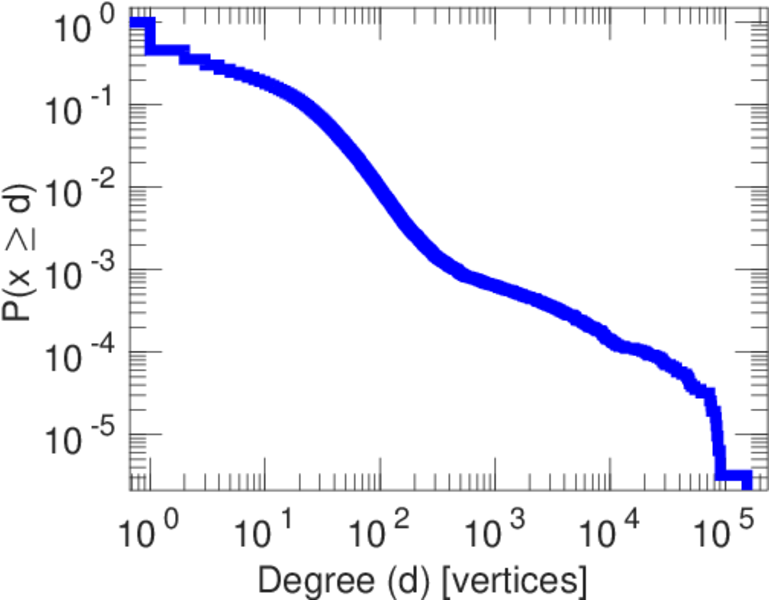
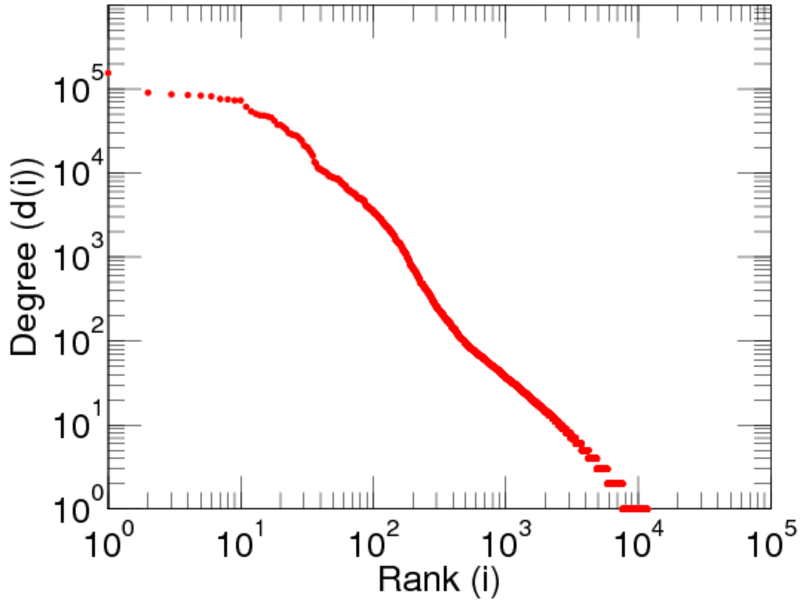
| Maximum degree | dmax = | 154,946
|
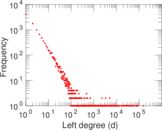
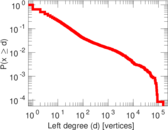
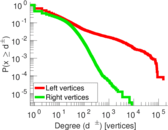
| Maximum left degree | d1max = | 154,946
|
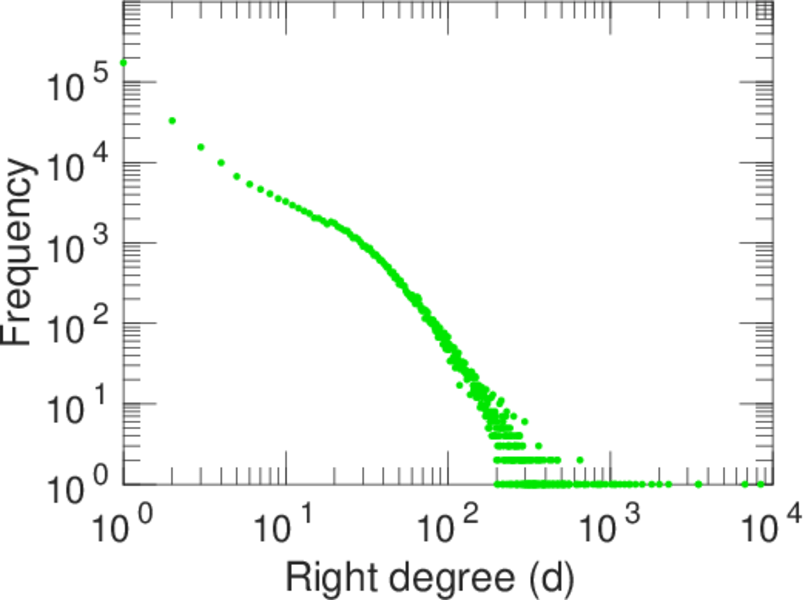
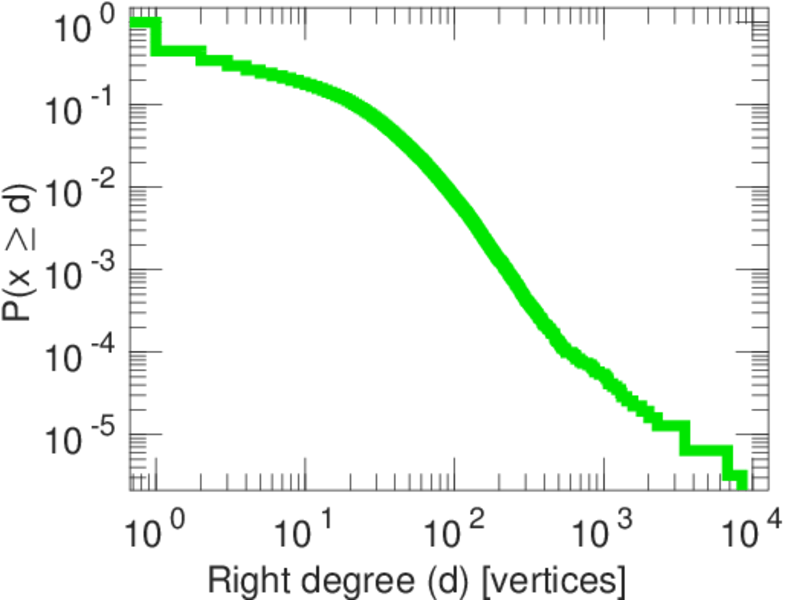
| Maximum right degree | d2max = | 8,450
|
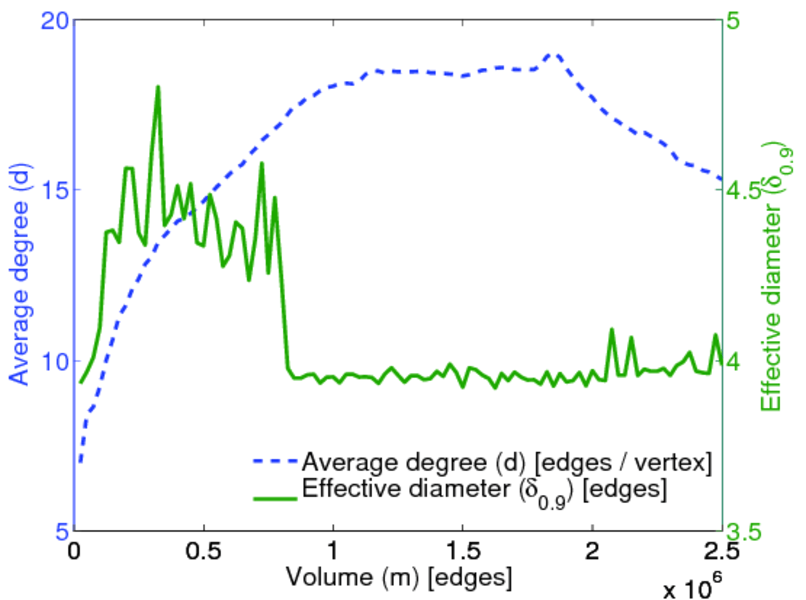
| Average degree | d = | 15.277 0
|
| Average left degree | d1 = | 212.615
|
| Average right degree | d2 = | 7.923 17
|
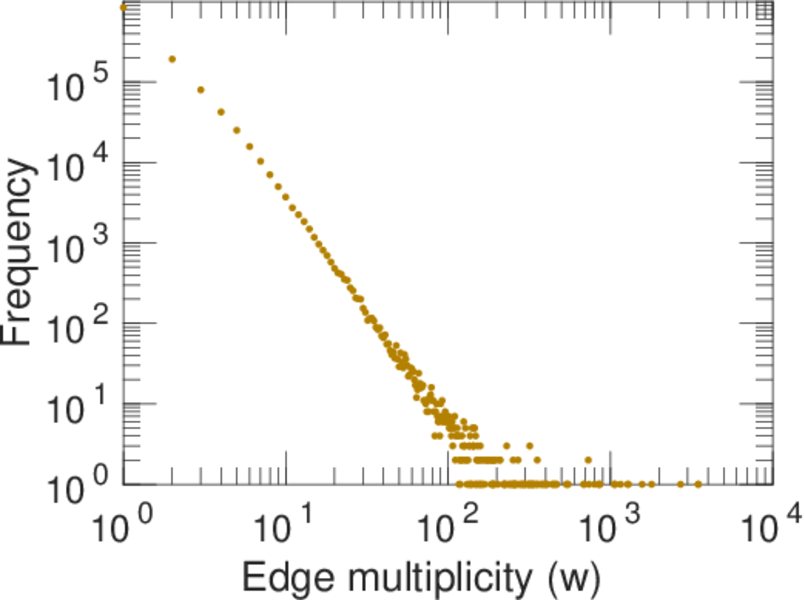
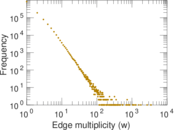
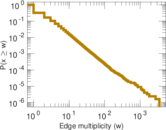
| Average edge multiplicity | m̃ = | 2.011 98
|
| Size of LCC | N = | 325,191
|
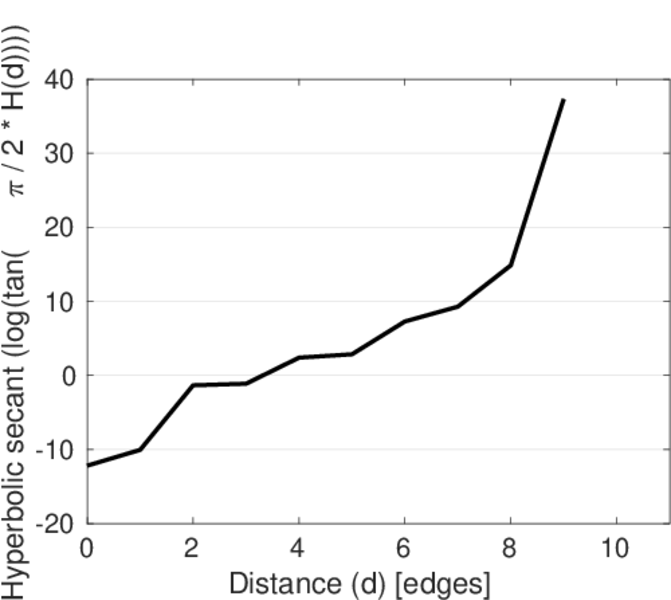
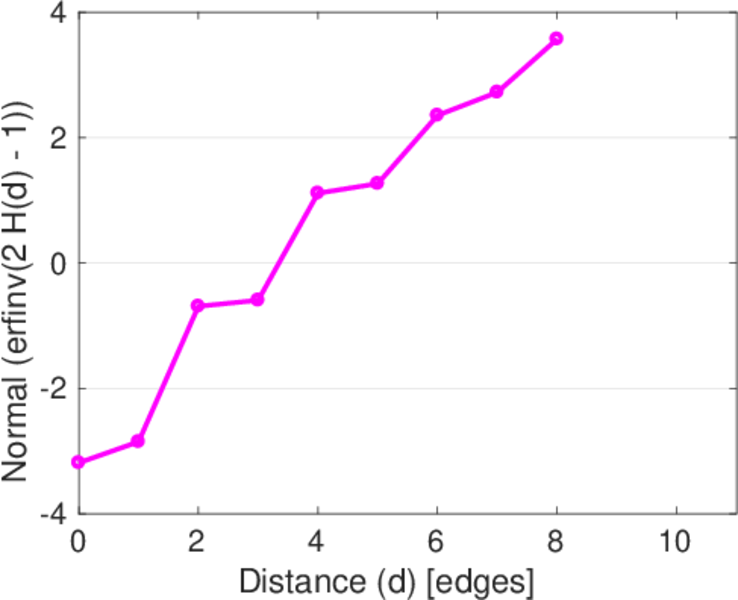
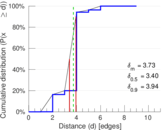
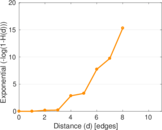
| Diameter | δ = | 11
|
| 50-Percentile effective diameter | δ0.5 = | 3.404 81
|
| 90-Percentile effective diameter | δ0.9 = | 3.943 51
|
| Median distance | δM = | 4
|
| Mean distance | δm = | 3.732 52
|
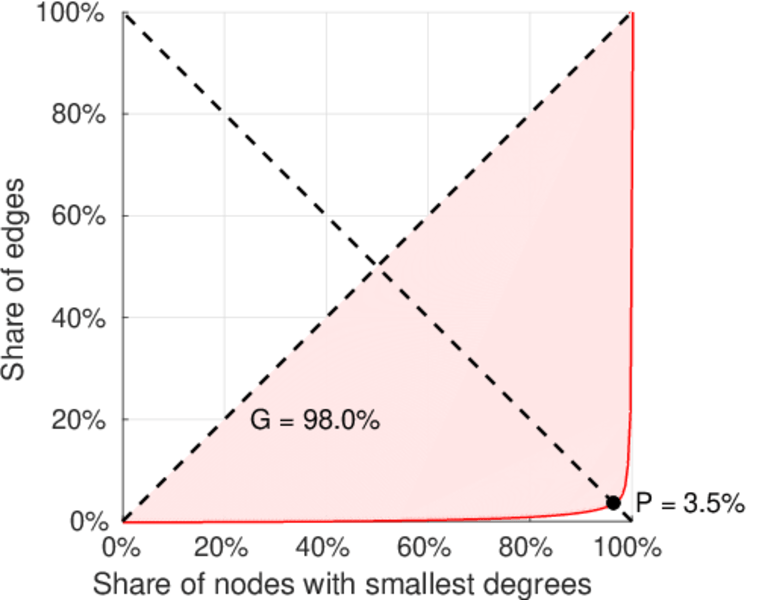
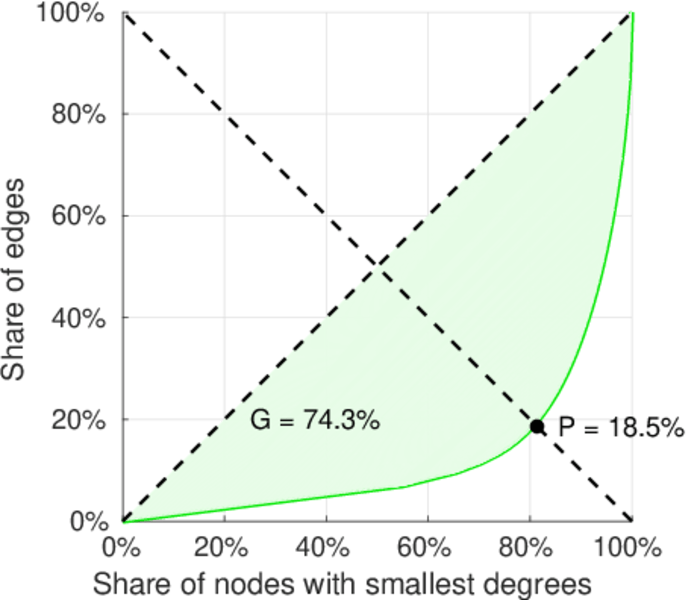
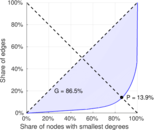
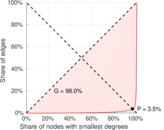
| Gini coefficient | G = | 0.867 715
|
| Balanced inequality ratio | P = | 0.136 861
|
| Left balanced inequality ratio | P1 = | 0.034 509 3
|
| Right balanced inequality ratio | P2 = | 0.184 753
|
| Relative edge distribution entropy | Her = | 0.711 391
|
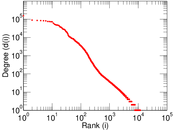
| Tail power law exponent | γt = | 1.891 00
|
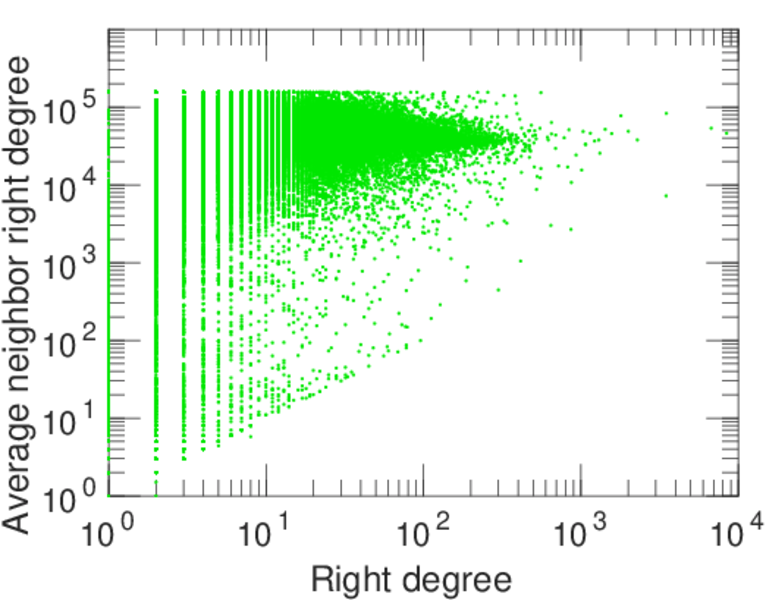
| Degree assortativity | ρ = | −0.260 832
|
| Degree assortativity p-value | pρ = | 0.000 00
|
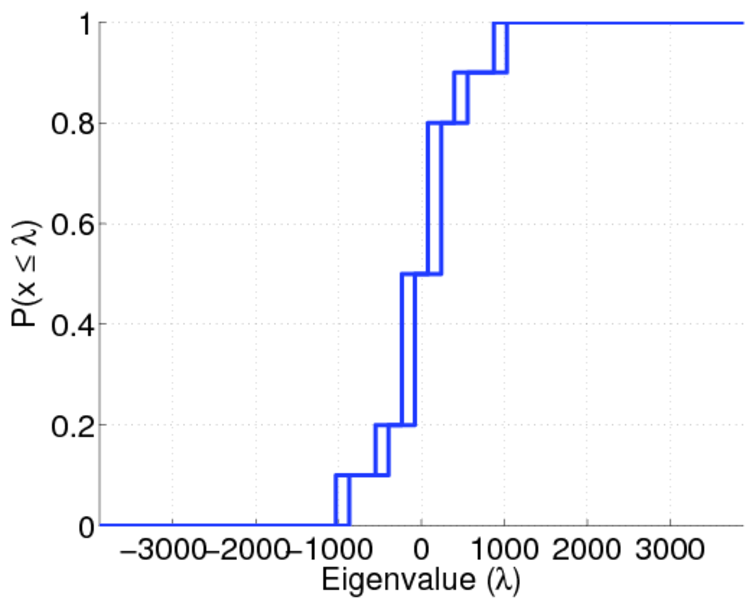
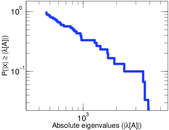
| Spectral norm | α = | 3,886.01
|
| Algebraic connectivity | a = | 0.007 826 71
|
| Spectral separation | |λ1[A] / λ2[A]| = | 1.074 79
|
| Controllability | C = | 305,430
|
| Relative controllability | Cr = | 0.935 052
|
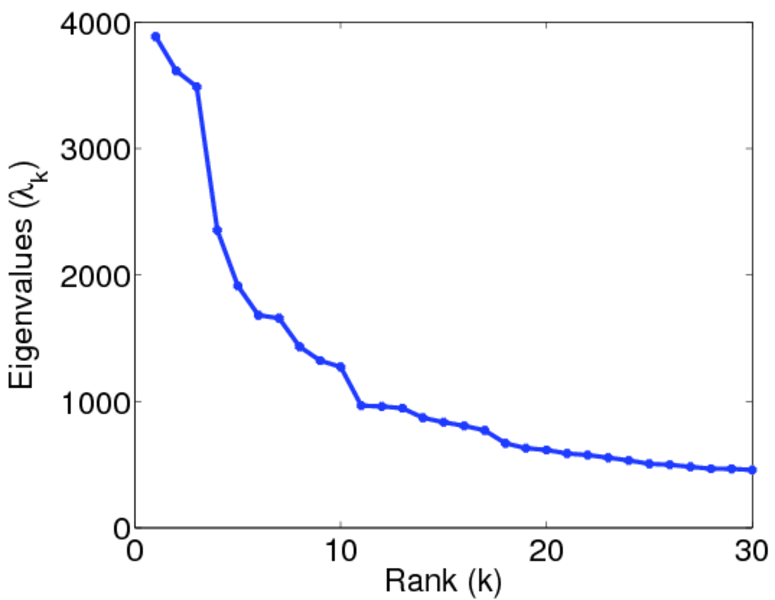
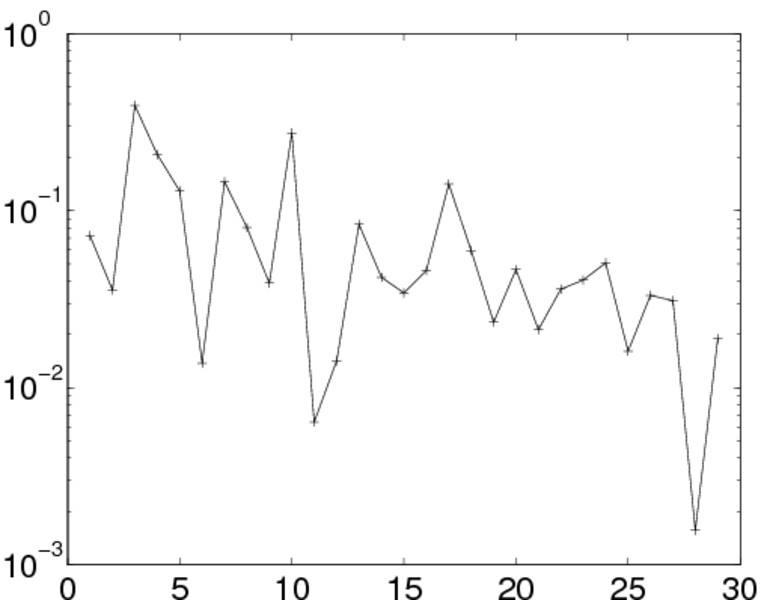
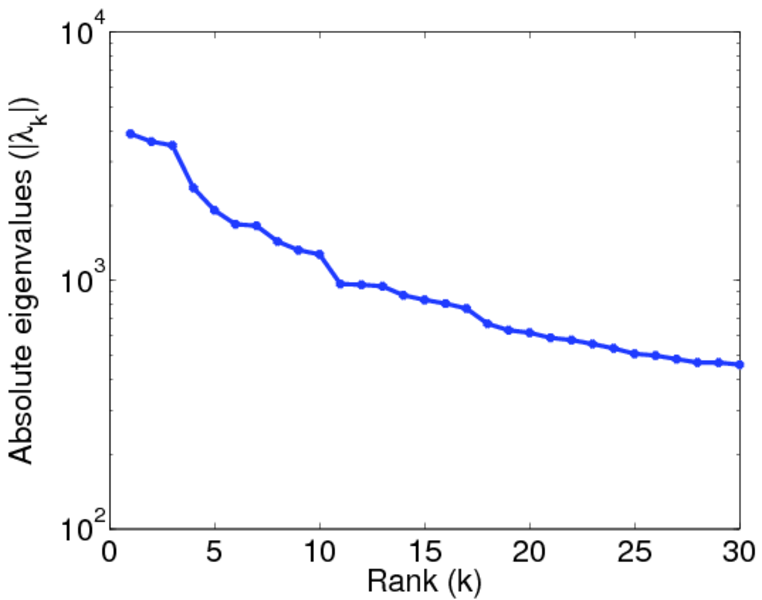
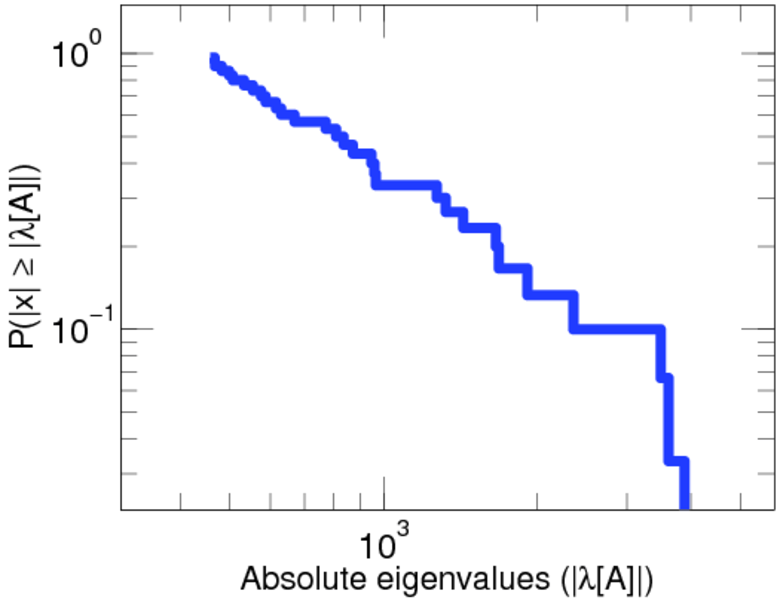
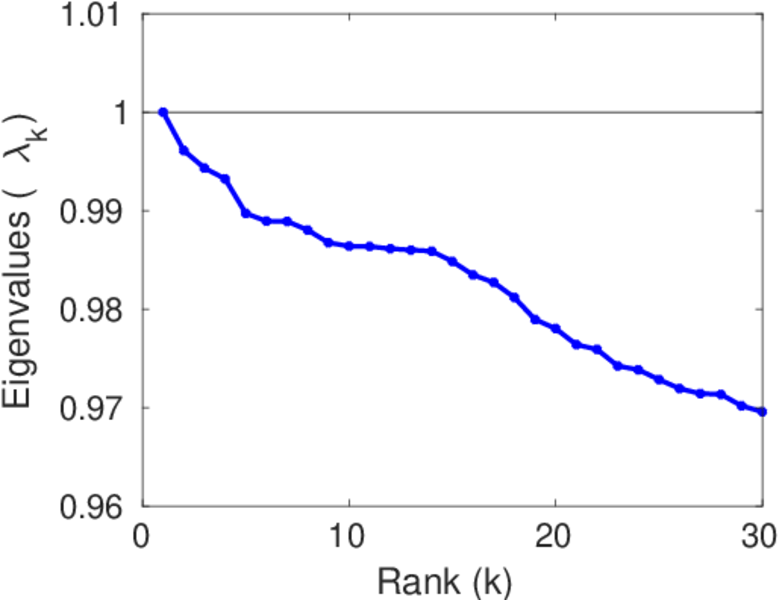
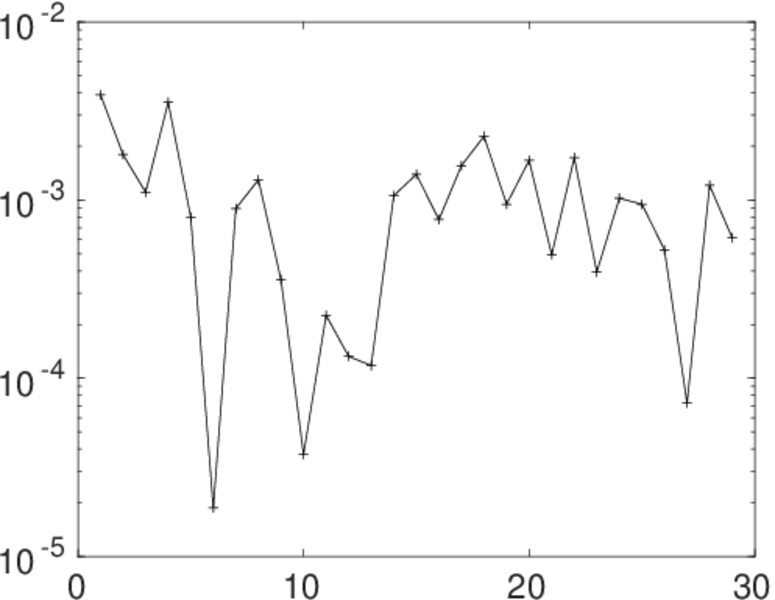
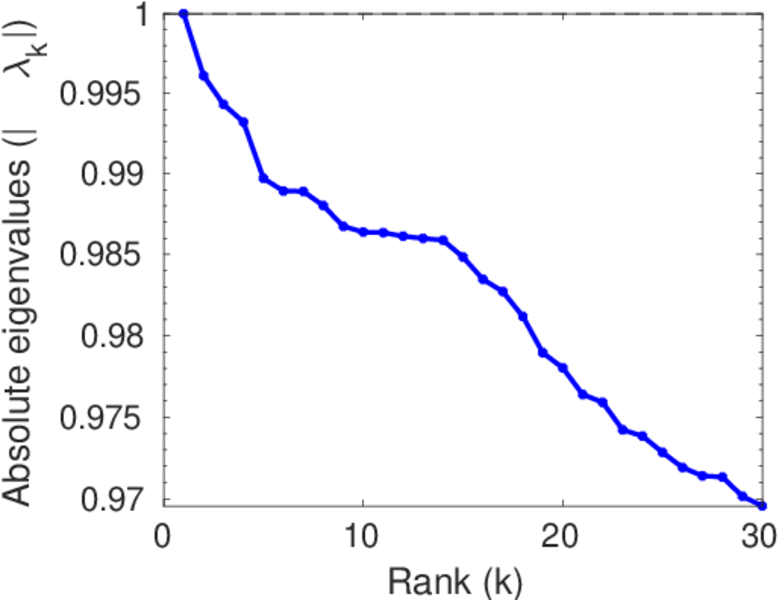
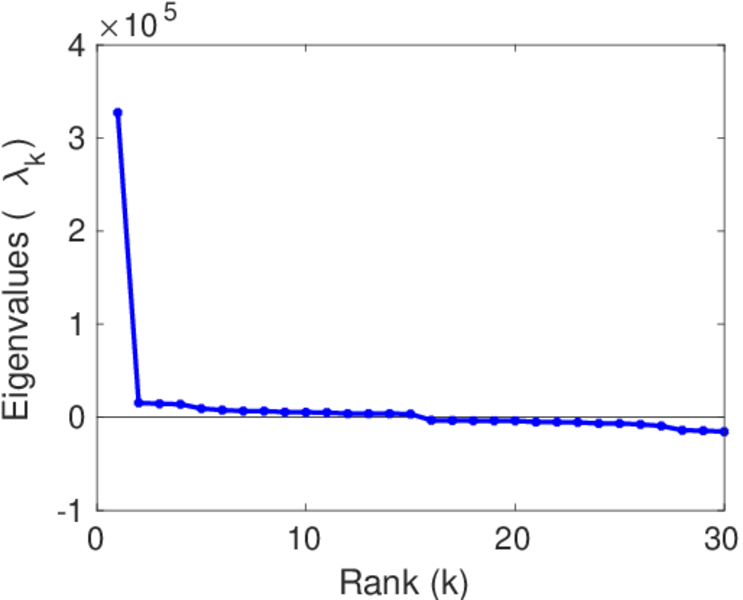
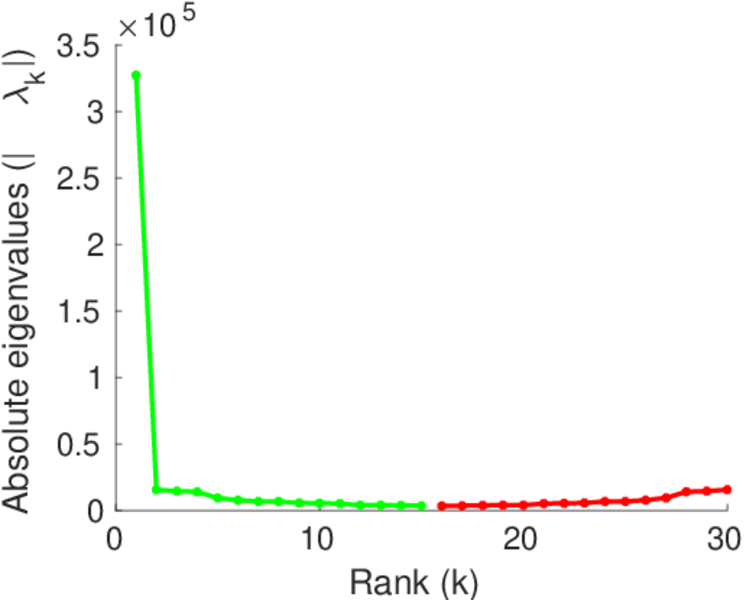
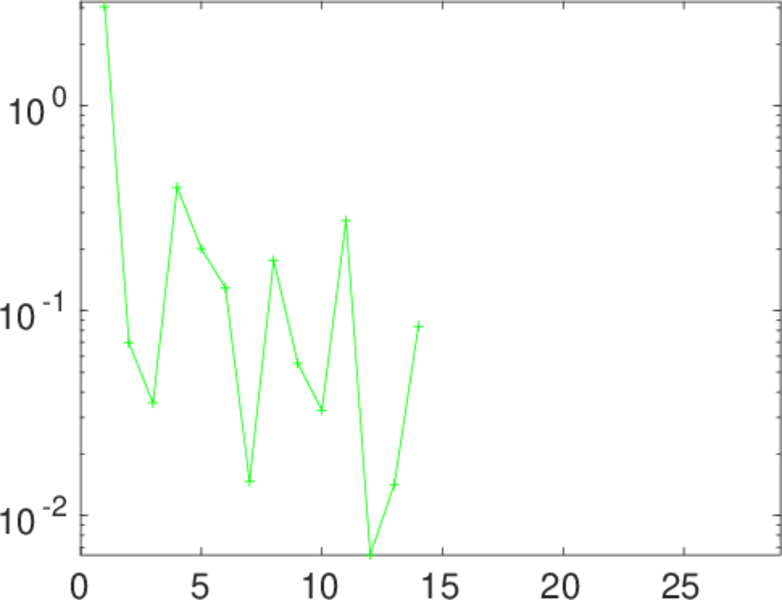
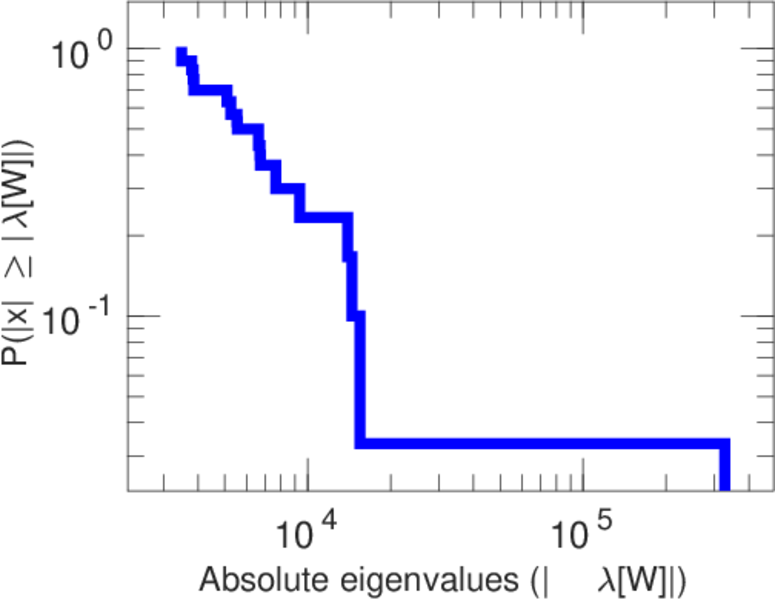
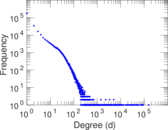
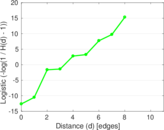
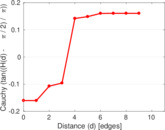
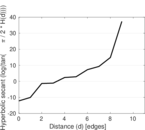
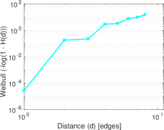
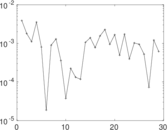
Plots


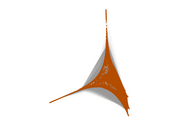


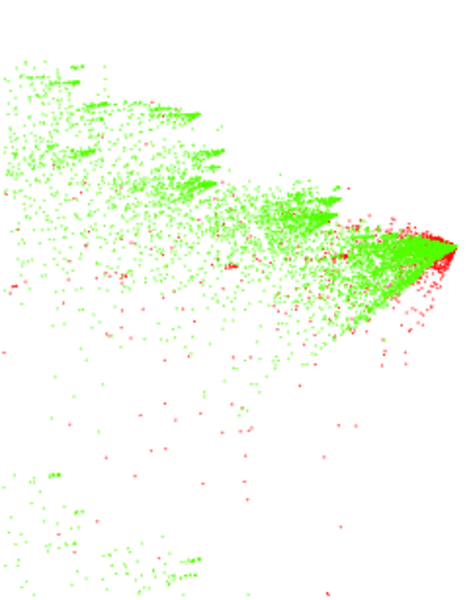
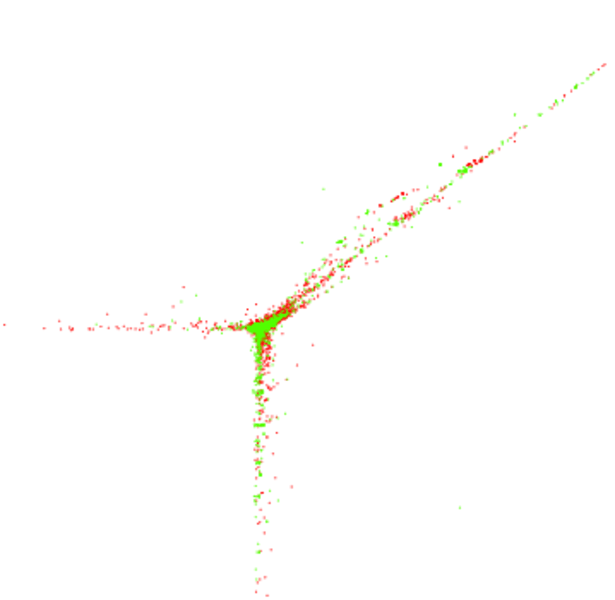
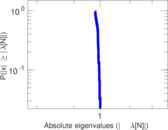
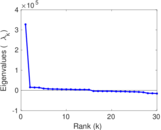
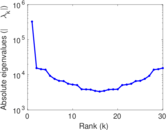
Matrix decompositions plots


Downloads
References
|
[1]
|
Jérôme Kunegis.
KONECT – The Koblenz Network Collection.
In Proc. Int. Conf. on World Wide Web Companion, pages
1343–1350, 2013.
[ http ]
|
|
[2]
|
Wikimedia Foundation.
Wikimedia downloads.
http://dumps.wikimedia.org/, January 2010.
|
 KONECT ‣ Networks ‣
Buy Me a Coffee
KONECT ‣ Networks ‣
Buy Me a Coffee