Wikipedia edits (mai)
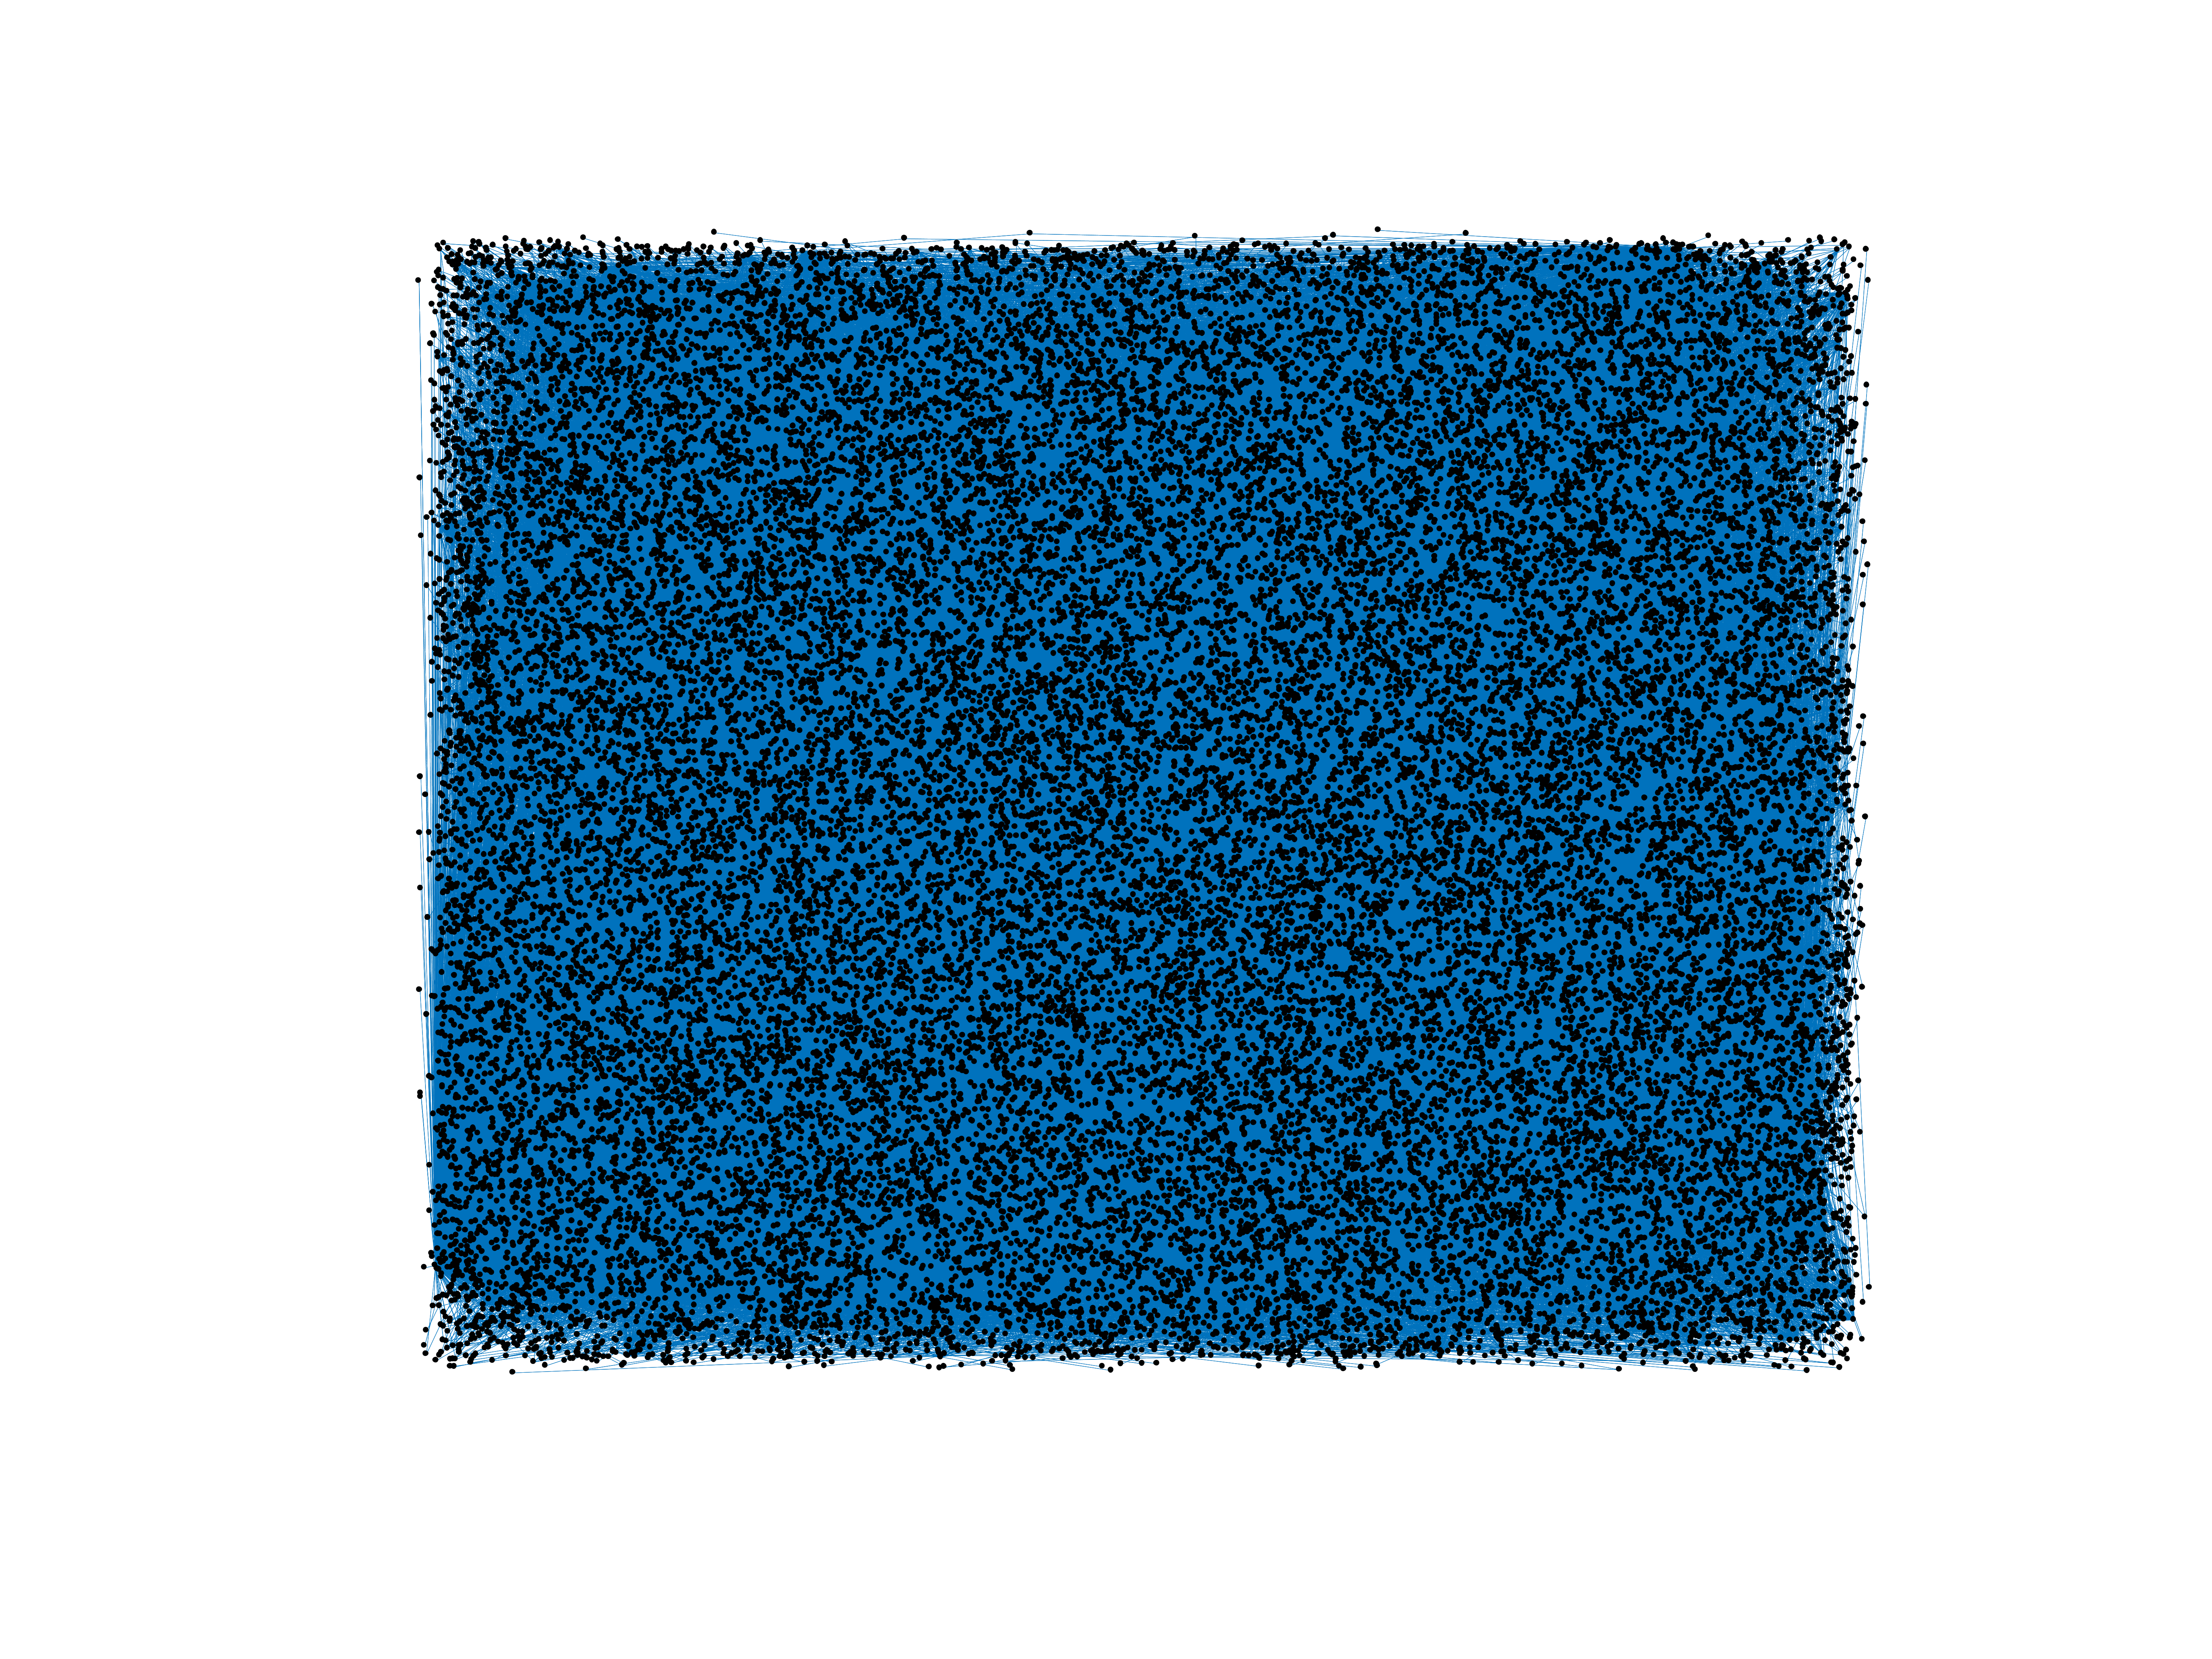
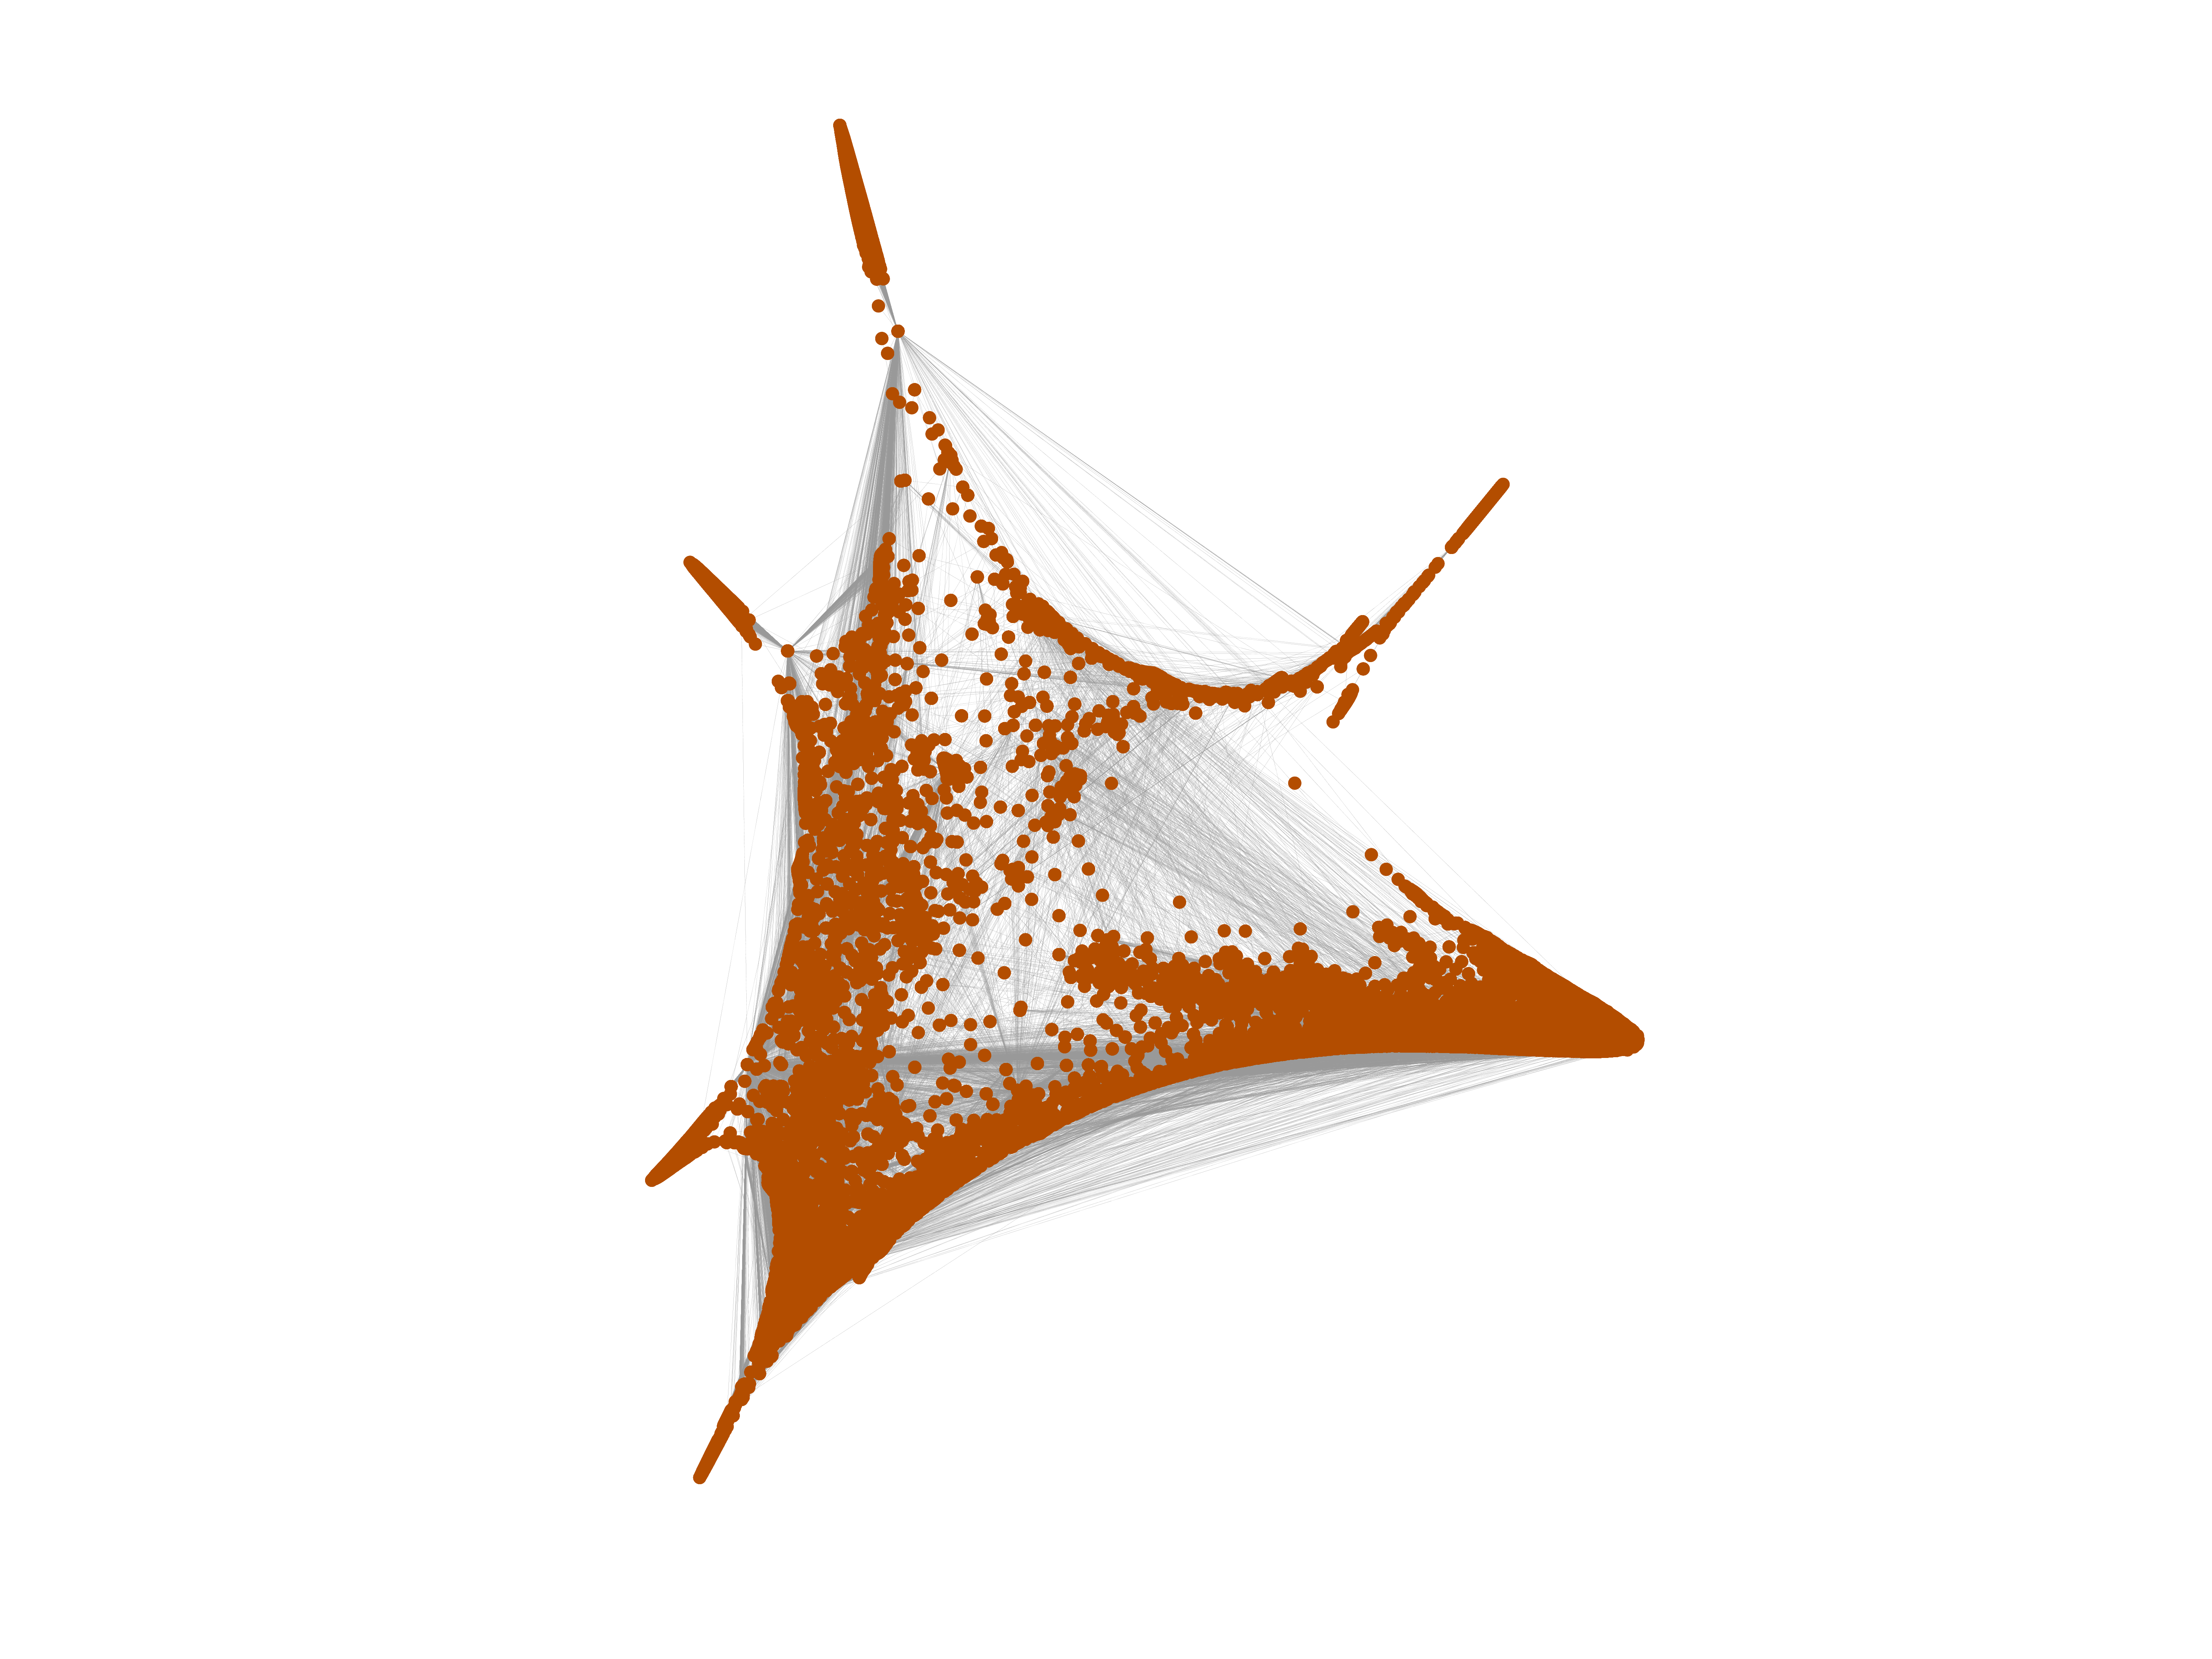
This is the bipartite edit network of the Maithili Wikipedia. It contains users
and pages from the Maithili Wikipedia, connected by edit events. Each edge
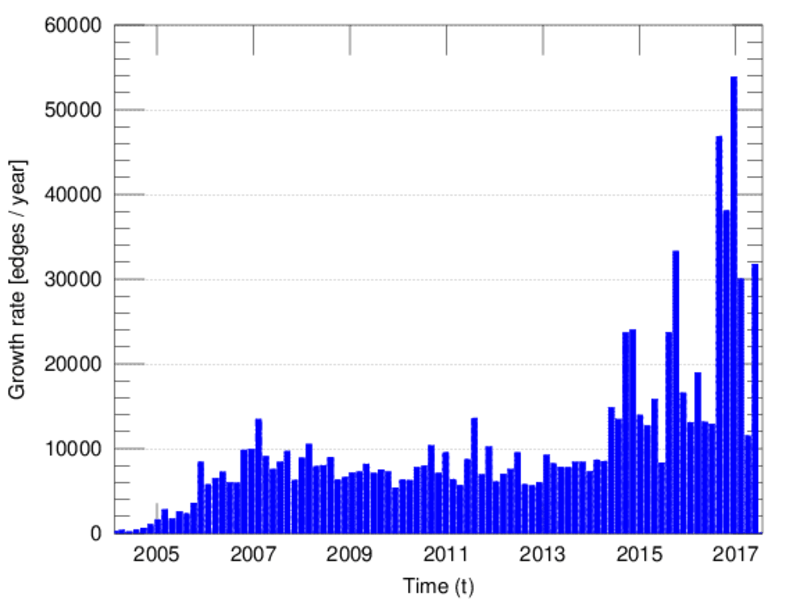
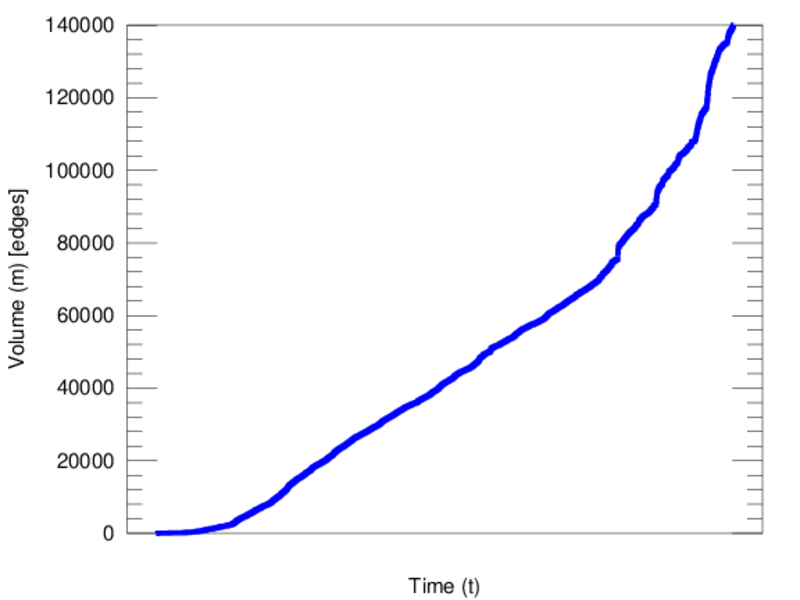
represents an edit. The dataset includes the timestamp of each edit.
Metadata
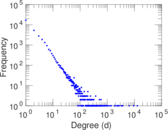
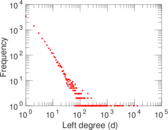
Statistics
| Size | n = | 33,865
|
| Left size | n1 = | 8,424
|
| Right size | n2 = | 25,441
|
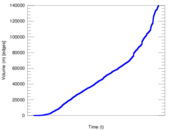
| Volume | m = | 140,034
|
| Unique edge count | m̿ = | 67,084
|
| Wedge count | s = | 52,458,694
|
| Claw count | z = | 75,997,950,640
|
| Cross count | x = | 101,983,726,007,765
|
| Square count | q = | 3,379,754
|
| 4-Tour count | T4 = | 237,020,868
|
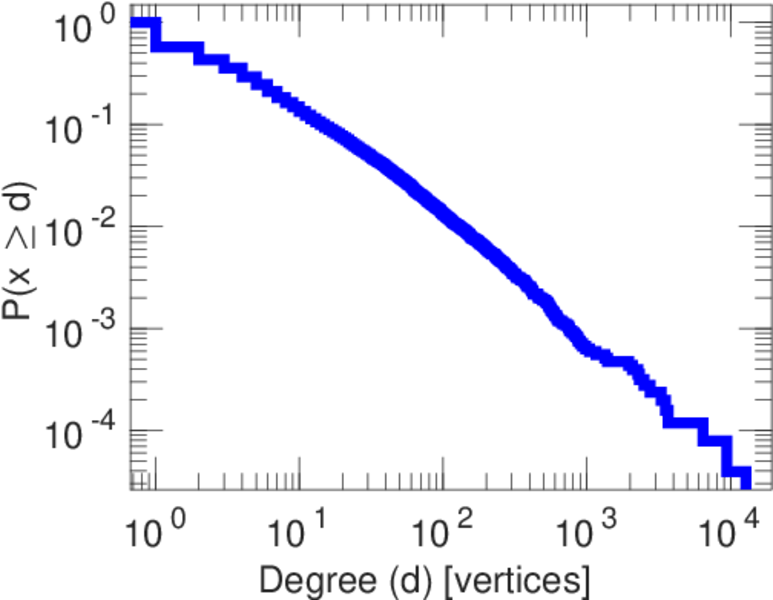
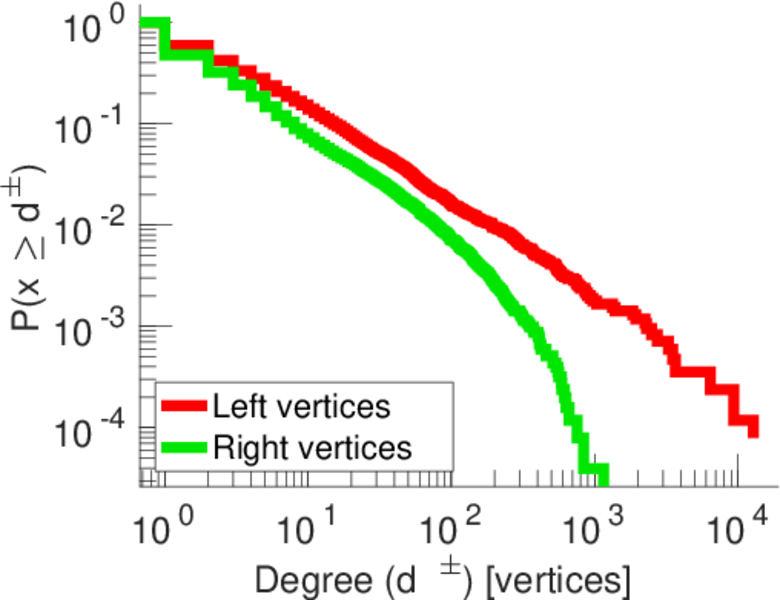
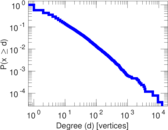
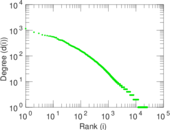
| Maximum degree | dmax = | 12,811
|
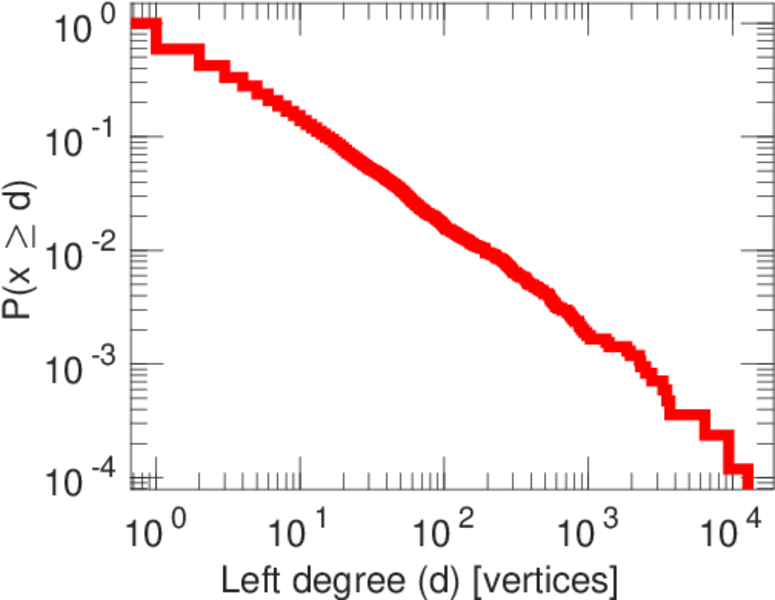
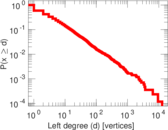
| Maximum left degree | d1max = | 12,811
|
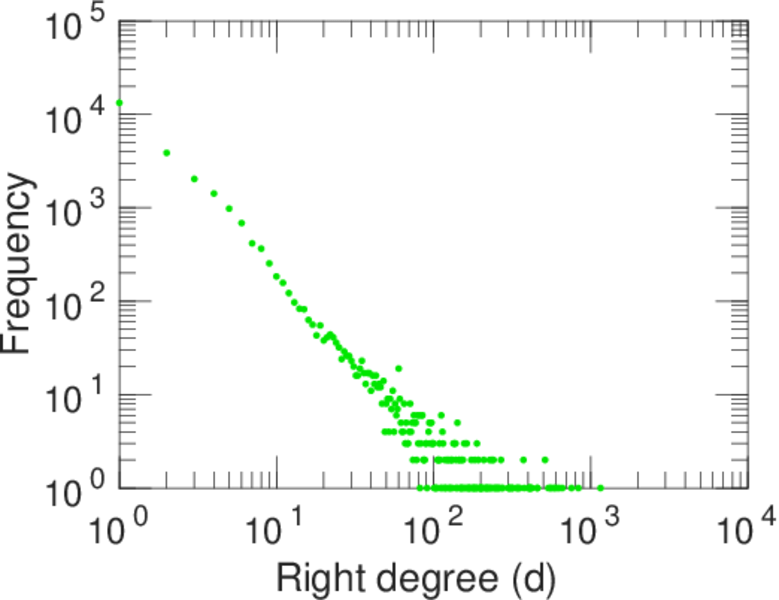
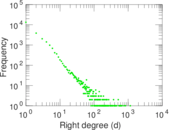
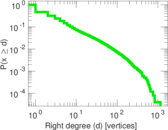
| Maximum right degree | d2max = | 1,157
|
| Average degree | d = | 8.270 13
|
| Average left degree | d1 = | 16.623 2
|
| Average right degree | d2 = | 5.504 26
|
| Fill | p = | 0.000 313 016
|
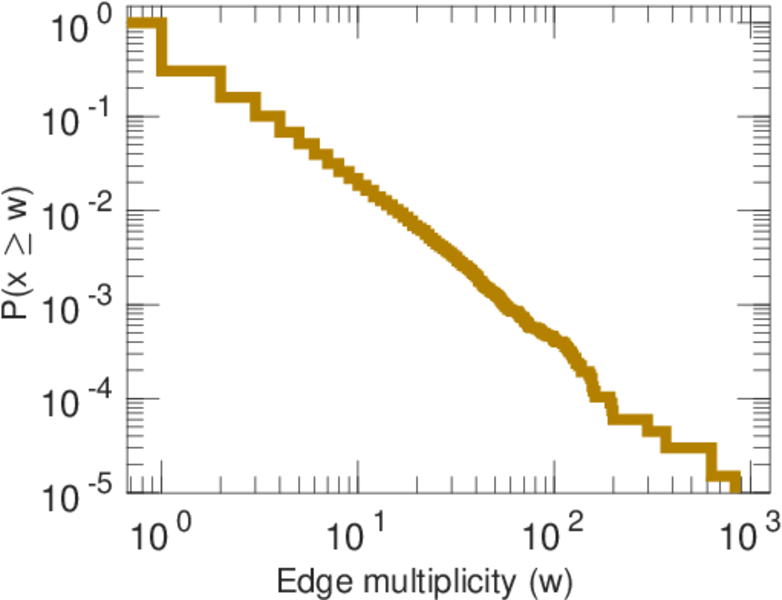
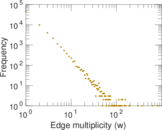
| Average edge multiplicity | m̃ = | 2.087 44
|
| Size of LCC | N = | 33,584
|
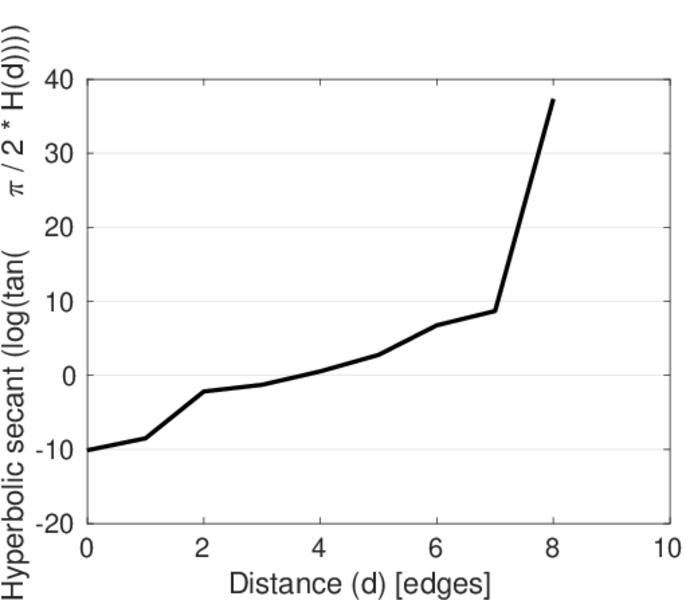
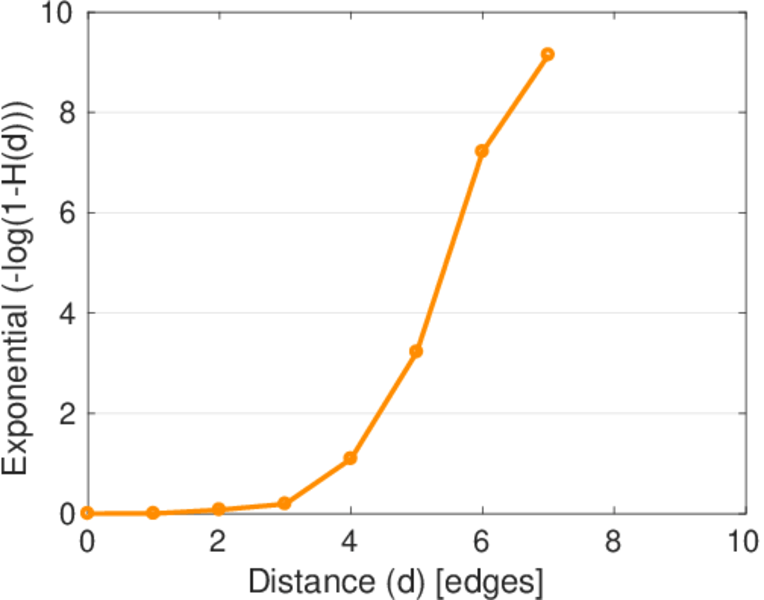
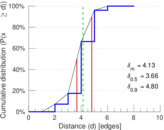
| Diameter | δ = | 10
|
| 50-Percentile effective diameter | δ0.5 = | 3.664 70
|
| 90-Percentile effective diameter | δ0.9 = | 4.796 70
|
| Median distance | δM = | 4
|
| Mean distance | δm = | 4.130 36
|
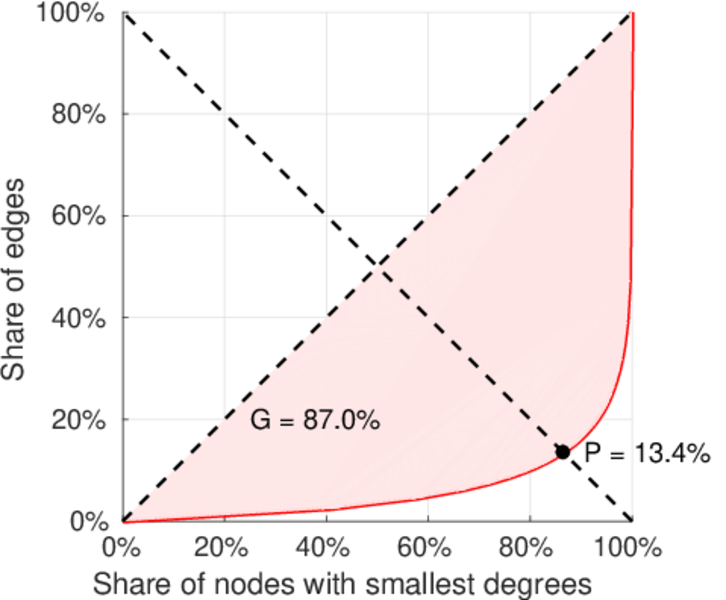
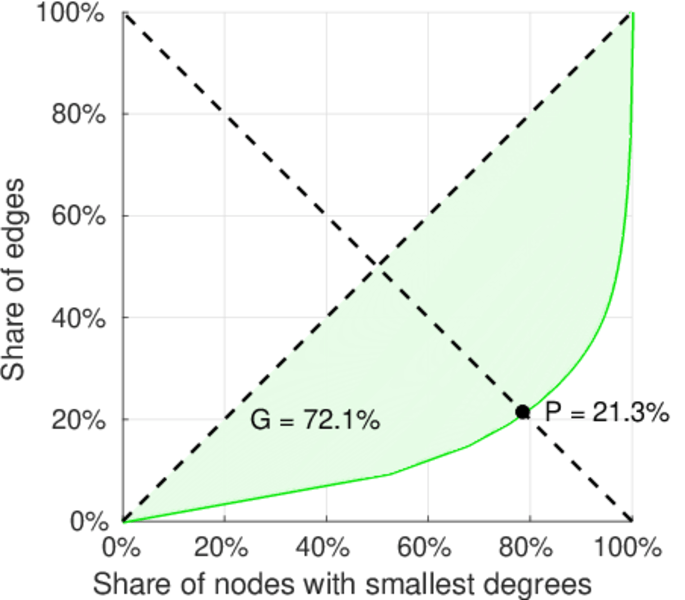
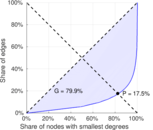
| Gini coefficient | G = | 0.807 719
|
| Balanced inequality ratio | P = | 0.171 651
|
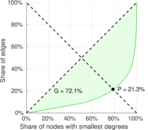
| Left balanced inequality ratio | P1 = | 0.134 253
|
| Right balanced inequality ratio | P2 = | 0.213 305
|
| Relative edge distribution entropy | Her = | 0.791 888
|
| Power law exponent | γ = | 3.217 11
|
| Tail power law exponent | γt = | 2.161 00
|
| Tail power law exponent with p | γ3 = | 2.161 00
|
| p-value | p = | 0.000 00
|
| Left tail power law exponent with p | γ3,1 = | 1.941 00
|
| Left p-value | p1 = | 0.297 000
|
| Right tail power law exponent with p | γ3,2 = | 2.251 00
|
| Right p-value | p2 = | 0.000 00
|
| Degree assortativity | ρ = | −0.360 536
|
| Degree assortativity p-value | pρ = | 0.000 00
|
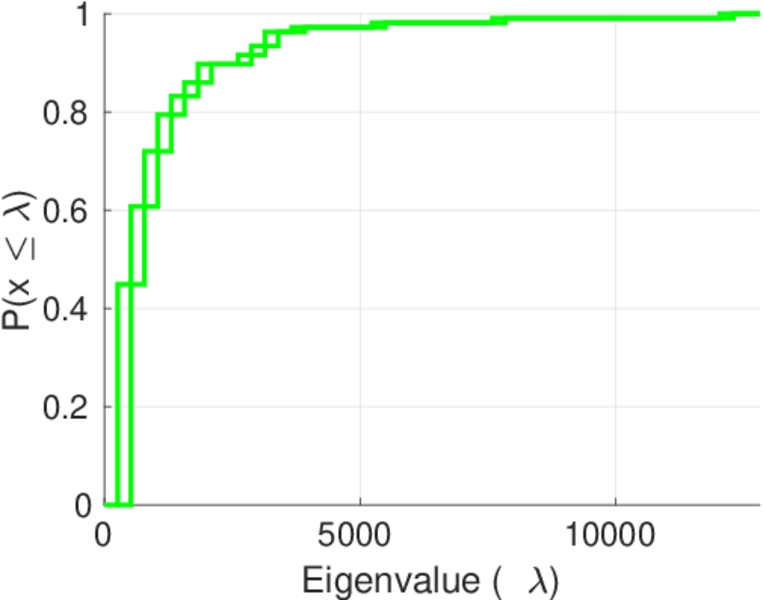
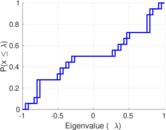
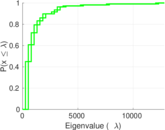
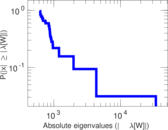
| Spectral norm | α = | 1,082.43
|
| Algebraic connectivity | a = | 0.015 279 0
|
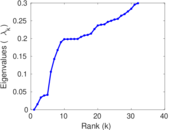
| Spectral separation | |λ1[A] / λ2[A]| = | 2.190 41
|
| Controllability | C = | 29,561
|
| Relative controllability | Cr = | 0.876 297
|
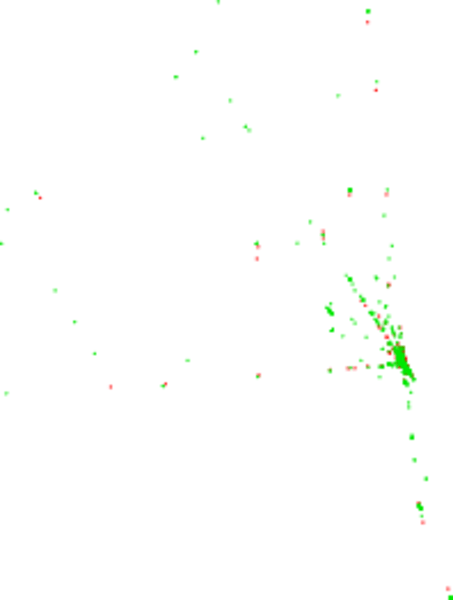
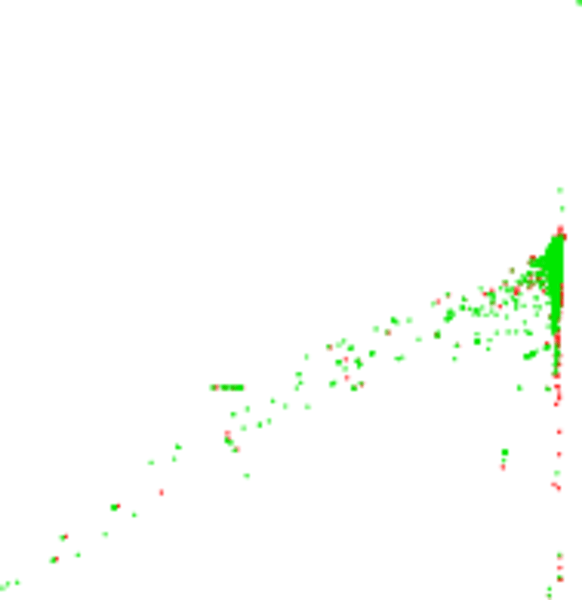
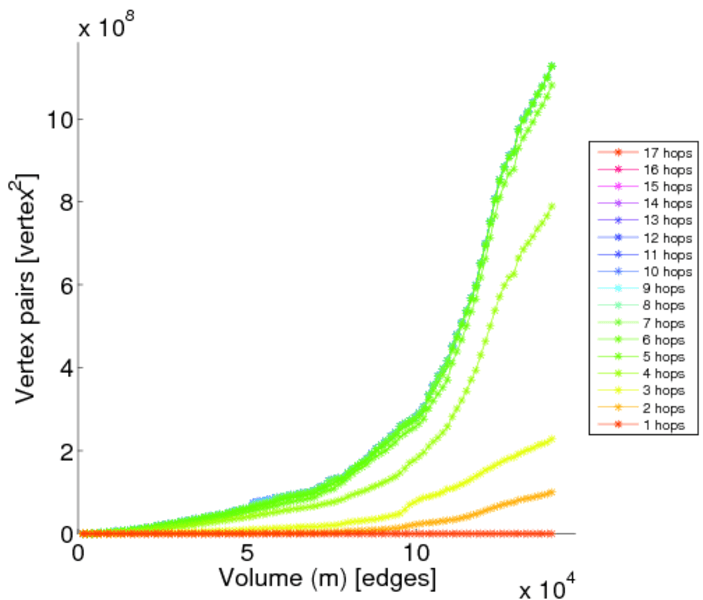
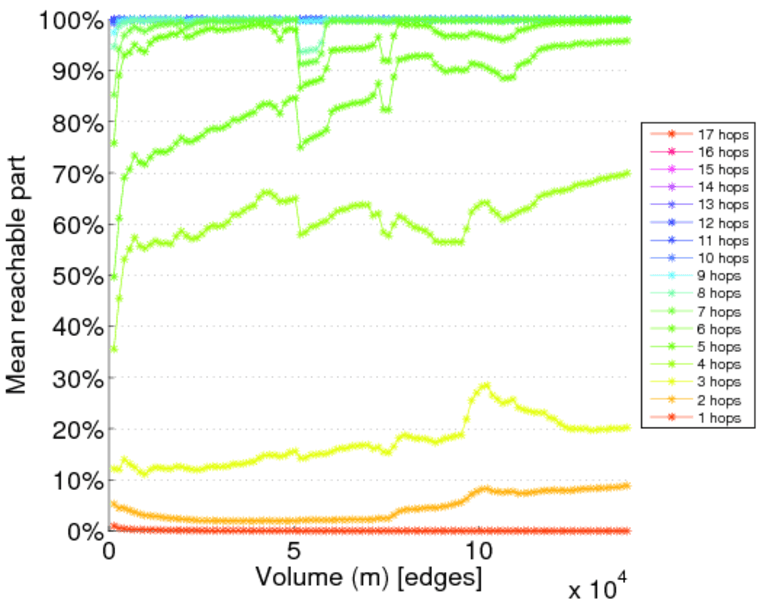
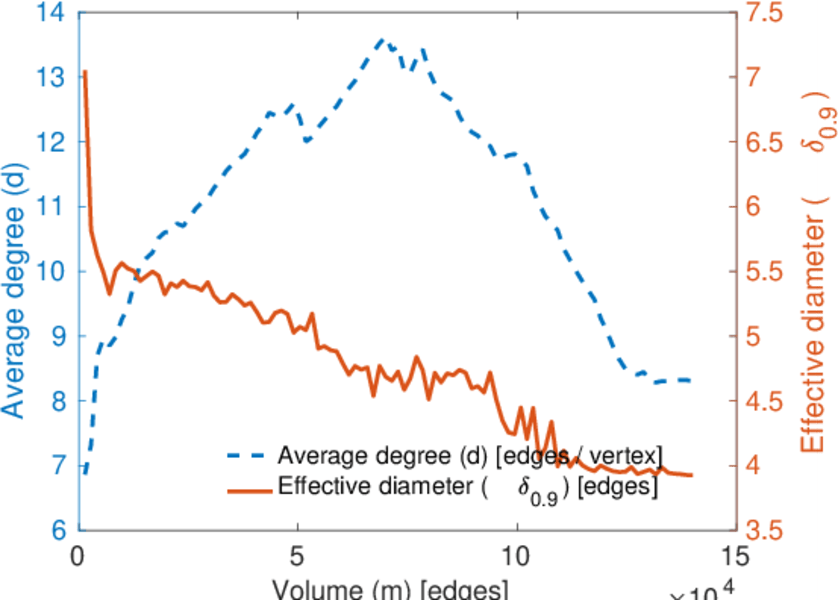
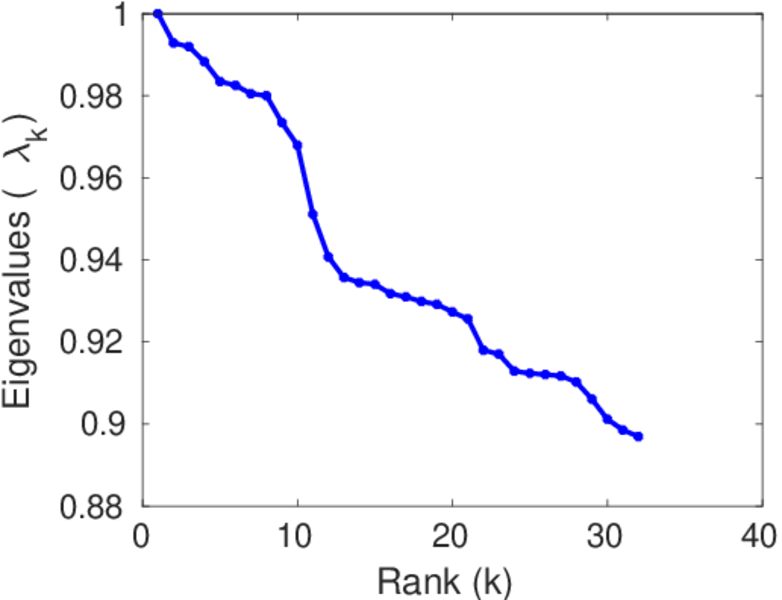
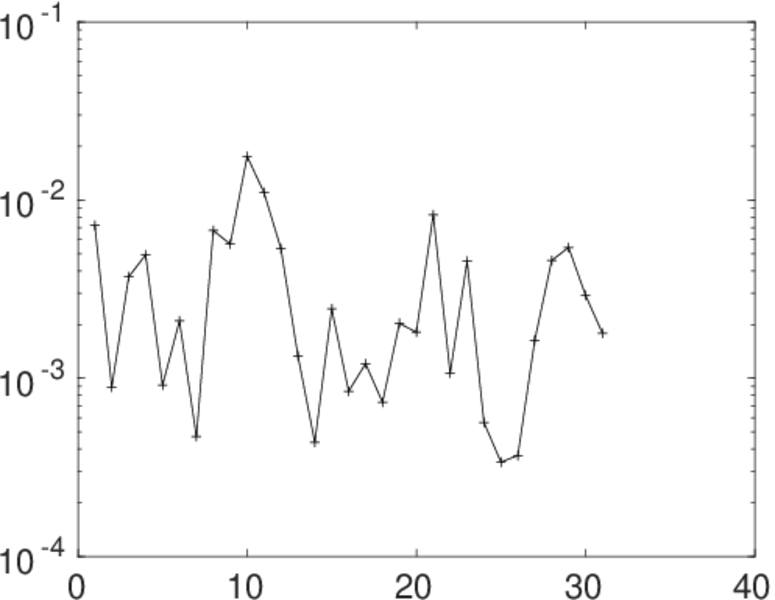
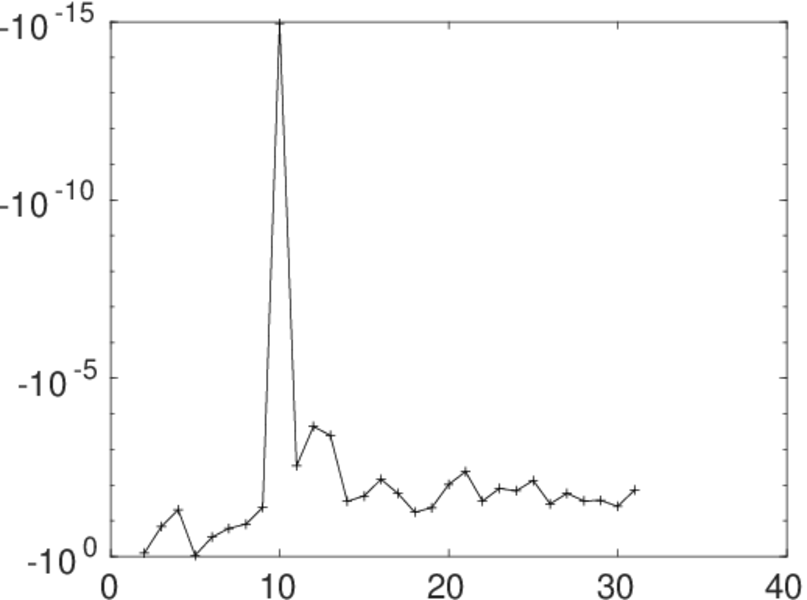
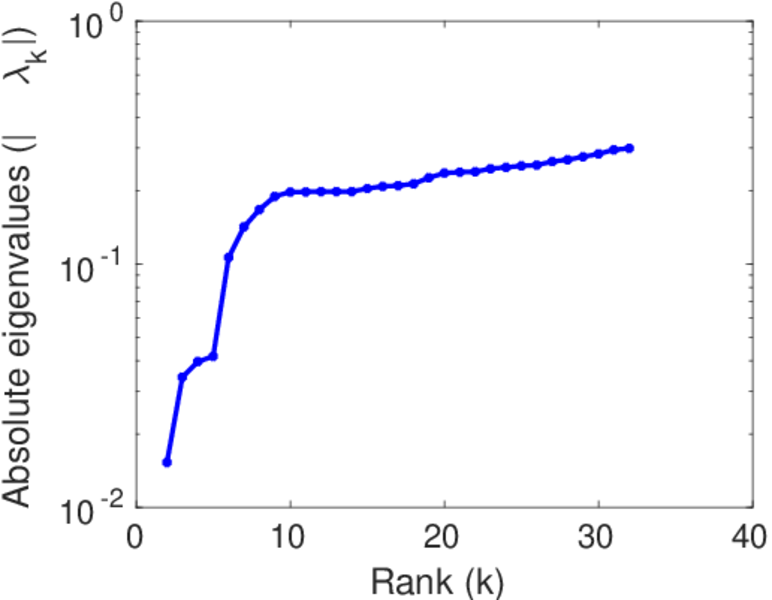
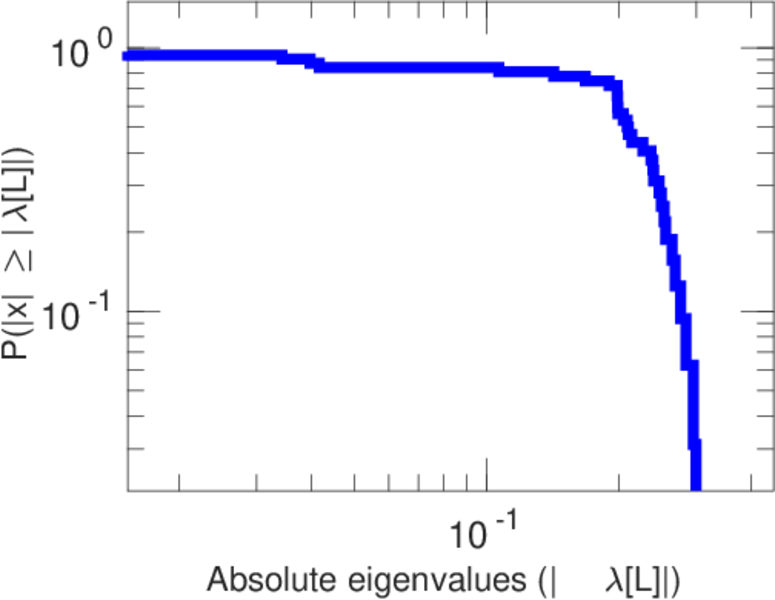
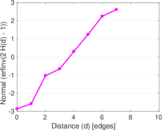
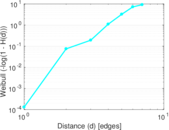
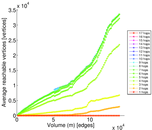
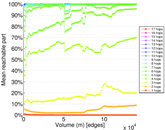
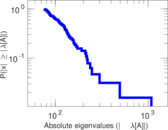
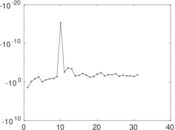
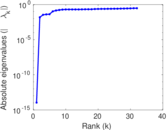
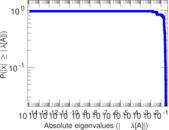
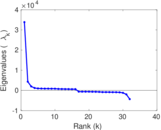
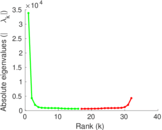
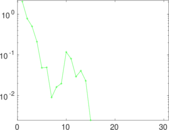
Plots


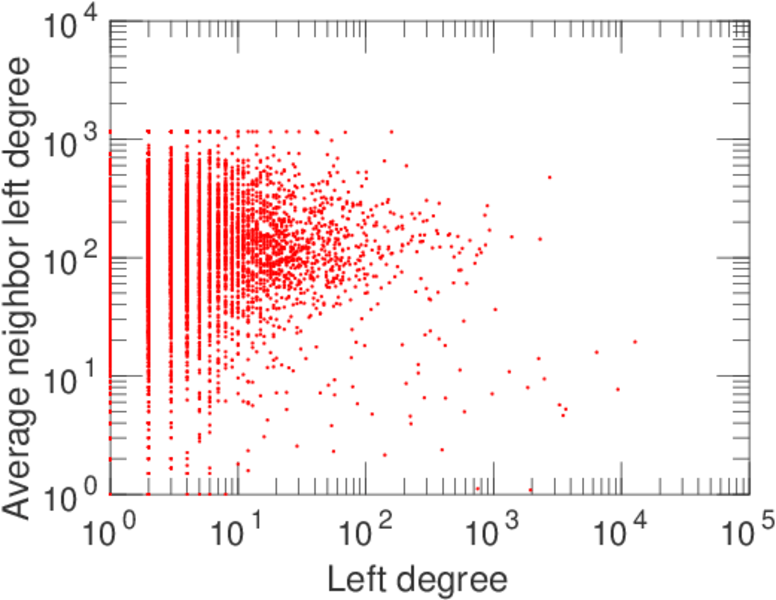
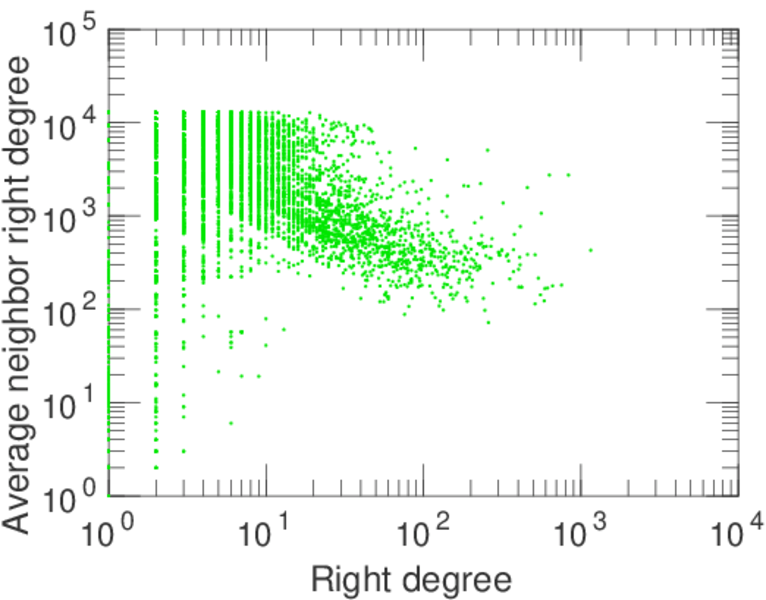
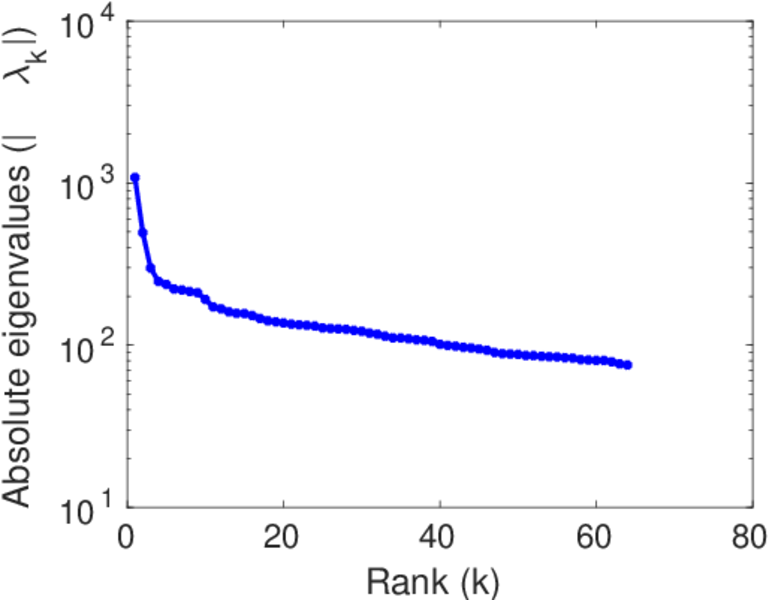
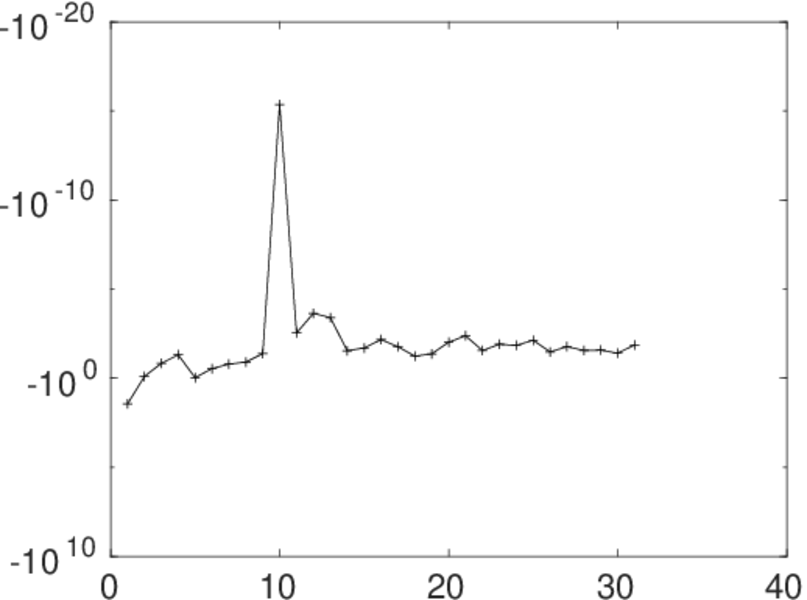
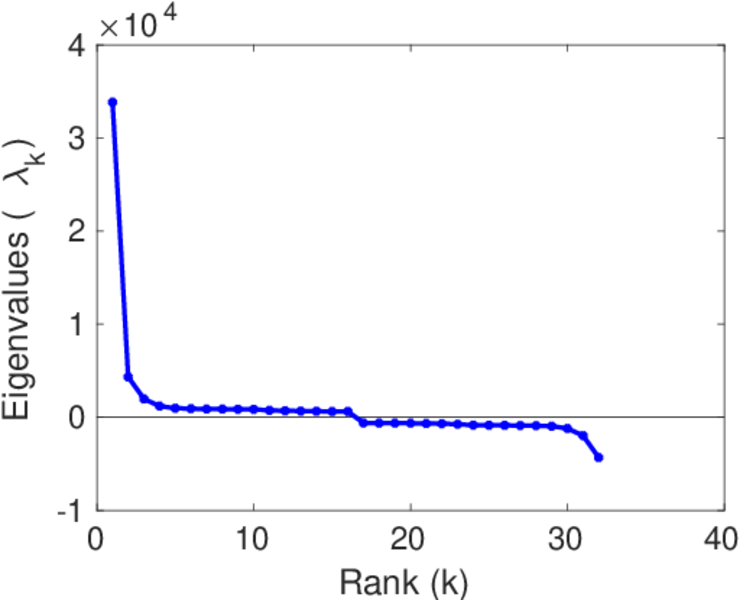
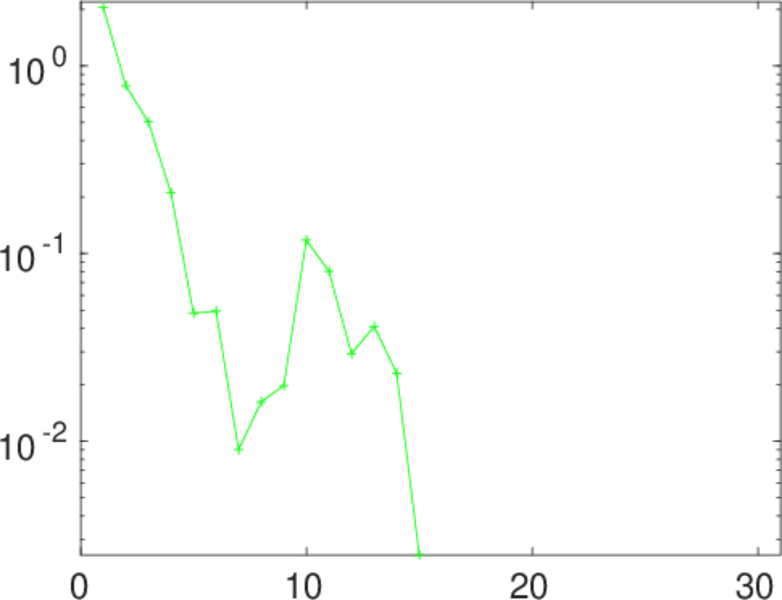
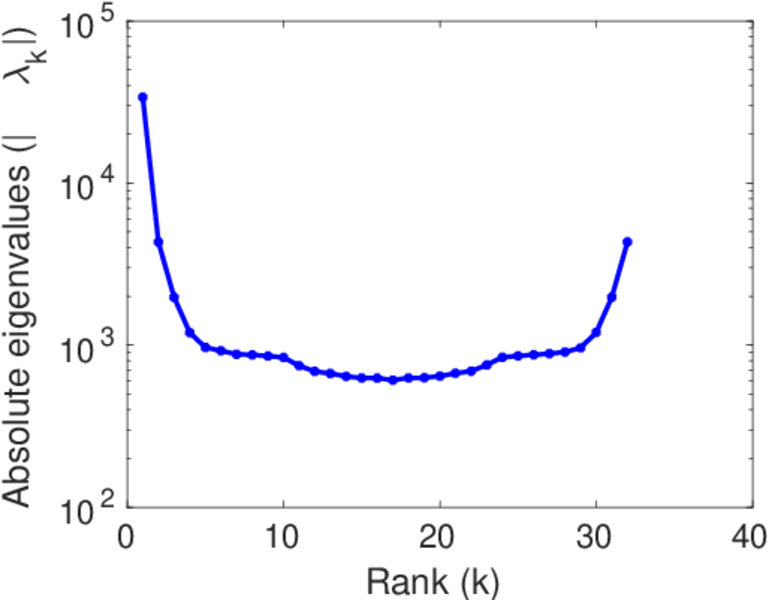
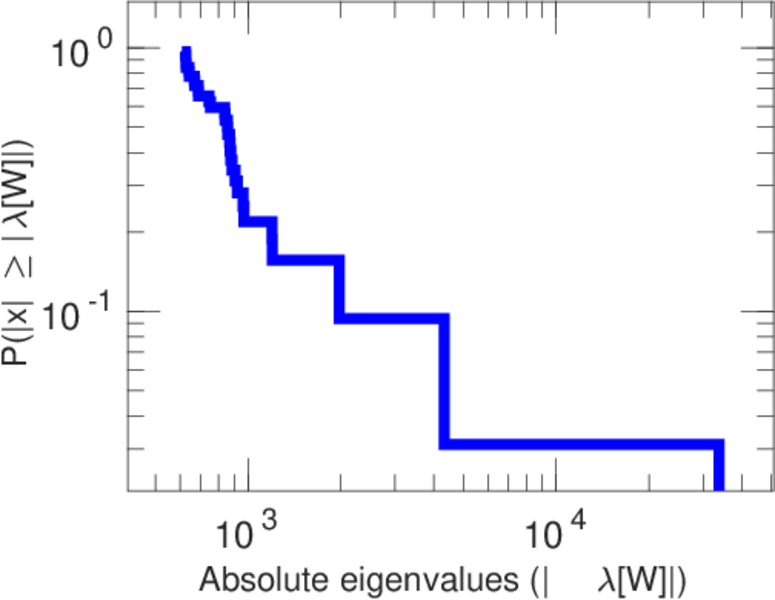
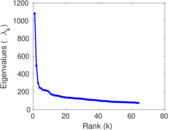
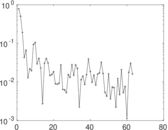
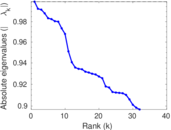
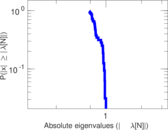
Matrix decompositions plots


Downloads
References
|
[1]
|
Jérôme Kunegis.
KONECT – The Koblenz Network Collection.
In Proc. Int. Conf. on World Wide Web Companion, pages
1343–1350, 2013.
[ http ]
|
|
[2]
|
Wikimedia Foundation.
Wikimedia downloads.
http://dumps.wikimedia.org/, January 2010.
|
 KONECT ‣ Networks ‣
Buy Me a Coffee
KONECT ‣ Networks ‣
Buy Me a Coffee