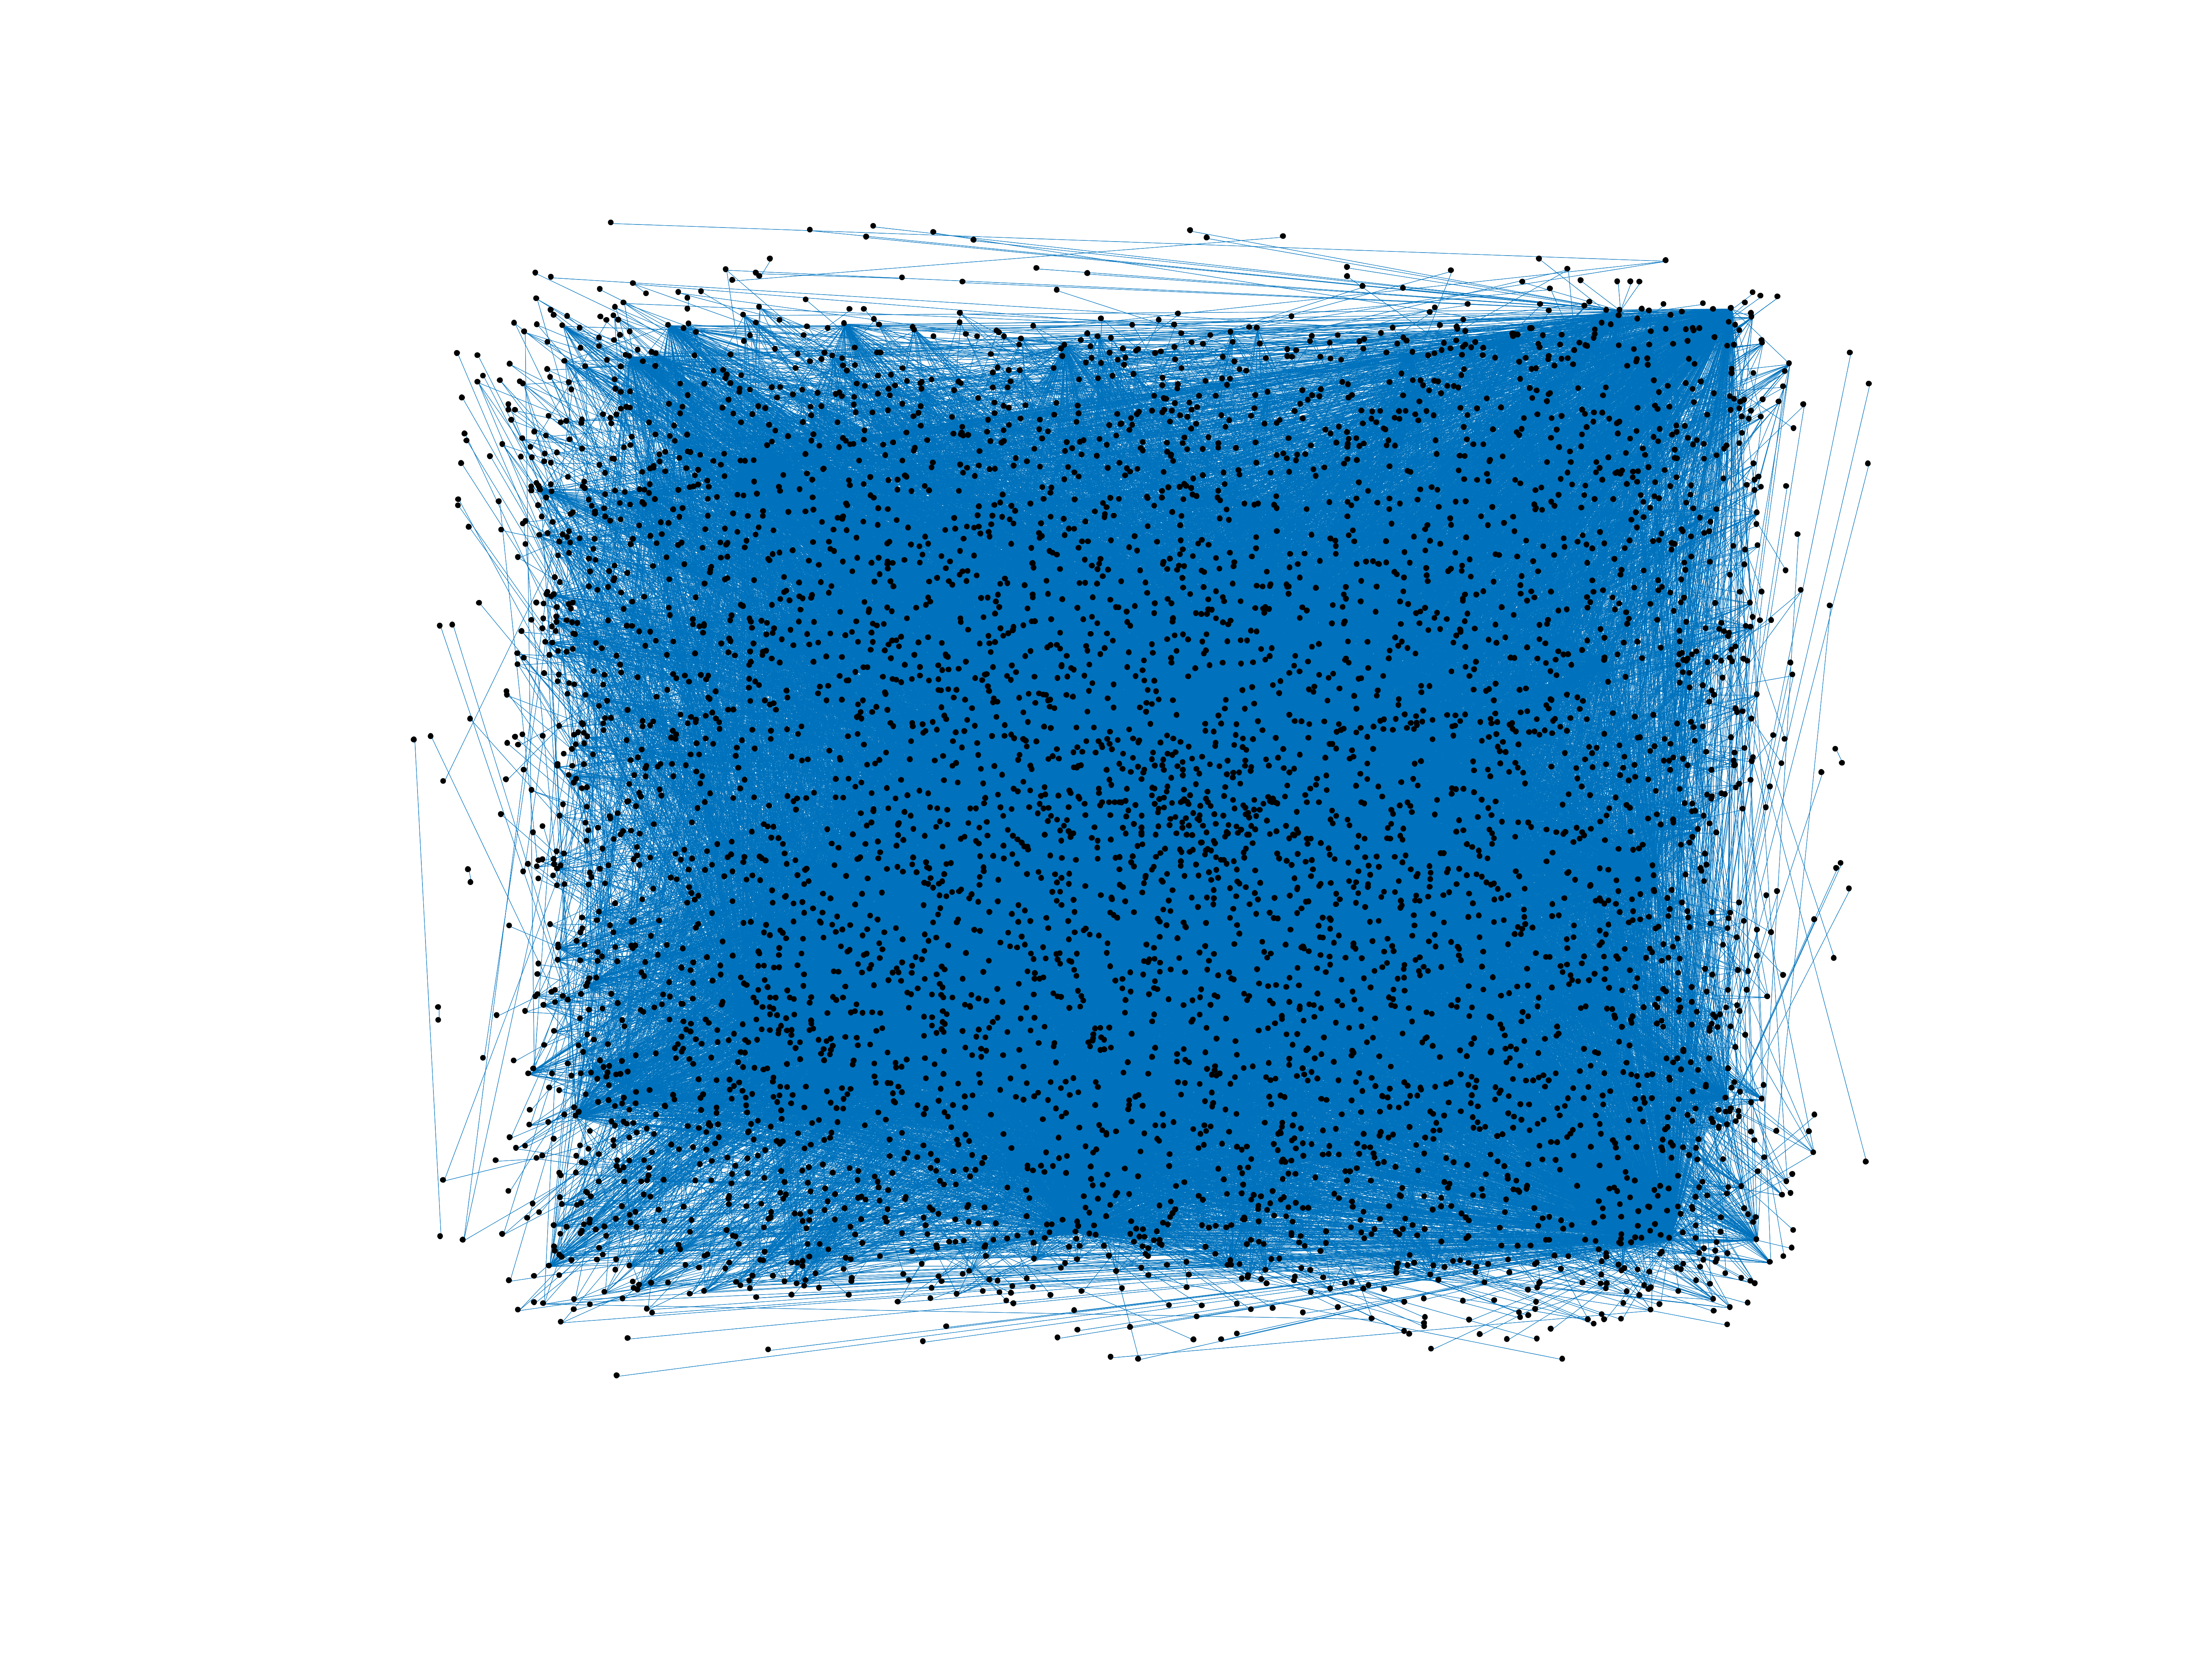
Wikipedia edits (mdf)
This is the bipartite edit network of the Moksha Wikipedia. It contains users
and pages from the Moksha Wikipedia, connected by edit events. Each edge
represents an edit. The dataset includes the timestamp of each edit.
Metadata
Statistics
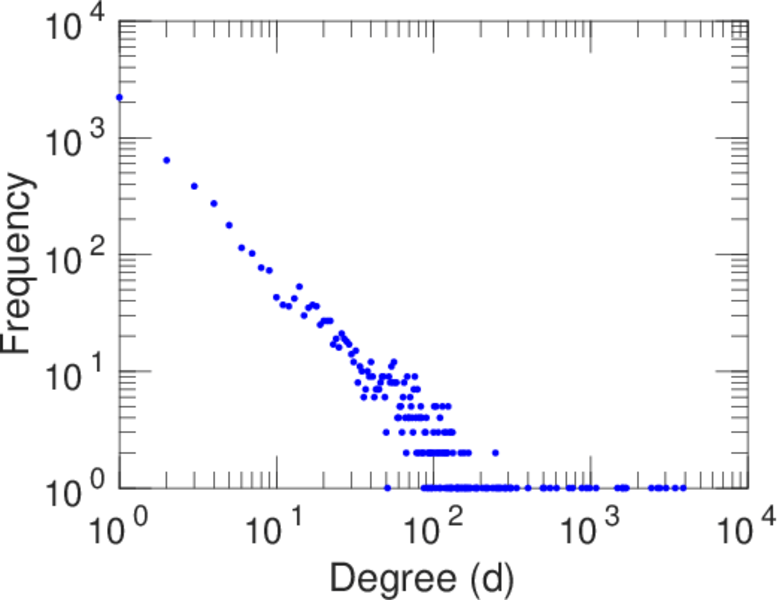
| Size | n = | 5,216
|
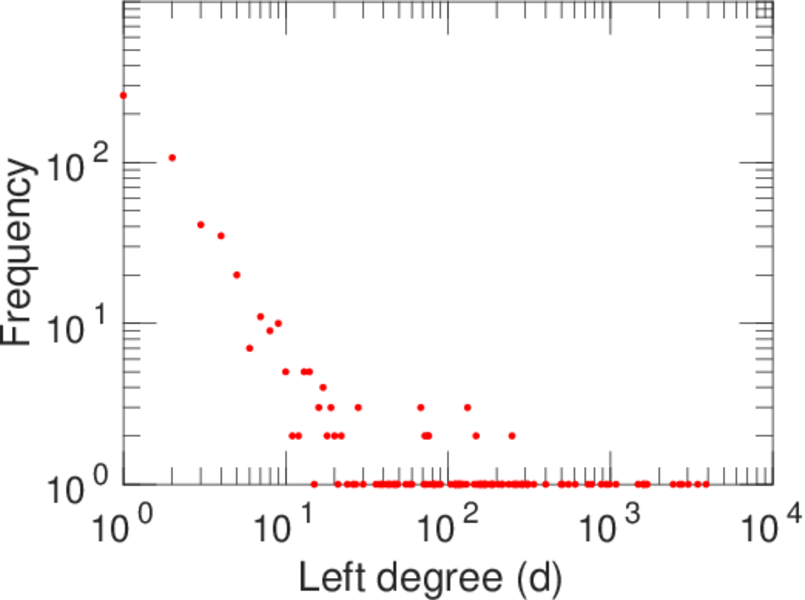
| Left size | n1 = | 643
|
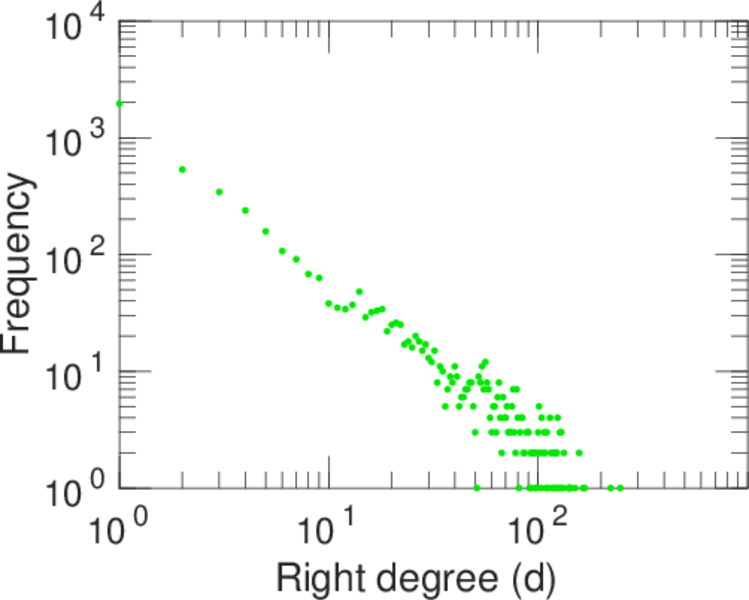
| Right size | n2 = | 4,573
|
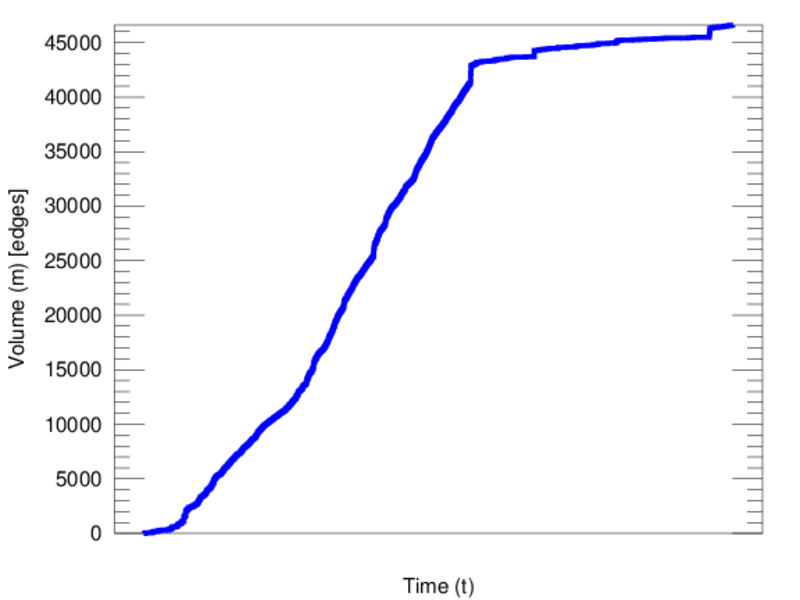
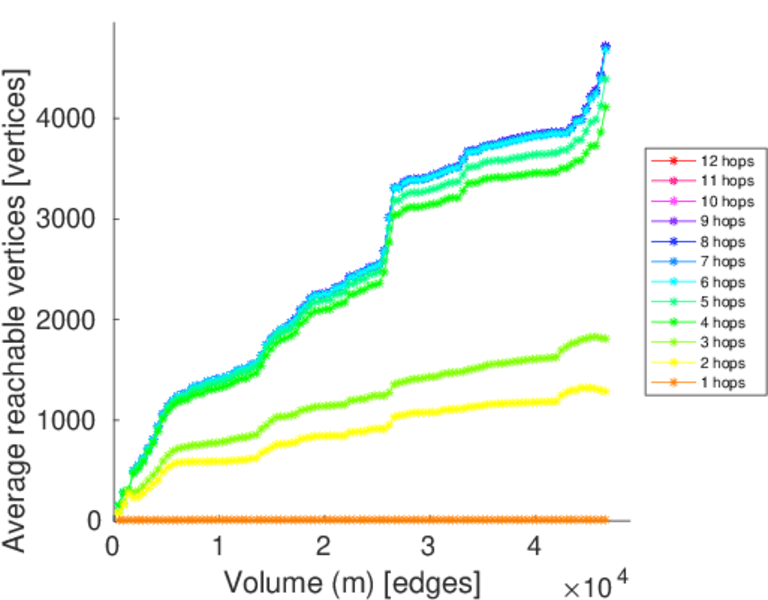
| Volume | m = | 46,607
|
| Unique edge count | m̿ = | 22,016
|
| Wedge count | s = | 6,176,912
|
| Claw count | z = | 1,882,042,198
|
| Cross count | x = | 526,796,360,578
|
| Square count | q = | 11,093,090
|
| 4-Tour count | T4 = | 113,524,384
|
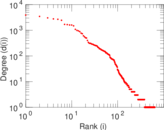
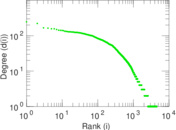
| Maximum degree | dmax = | 3,890
|
| Maximum left degree | d1max = | 3,890
|
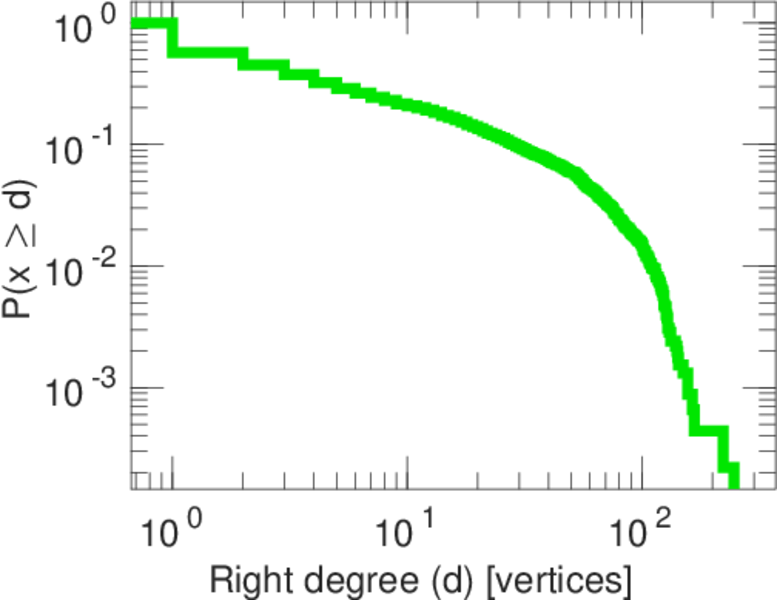
| Maximum right degree | d2max = | 247
|
| Average degree | d = | 17.870 8
|
| Average left degree | d1 = | 72.483 7
|
| Average right degree | d2 = | 10.191 8
|
| Fill | p = | 0.007 487 32
|
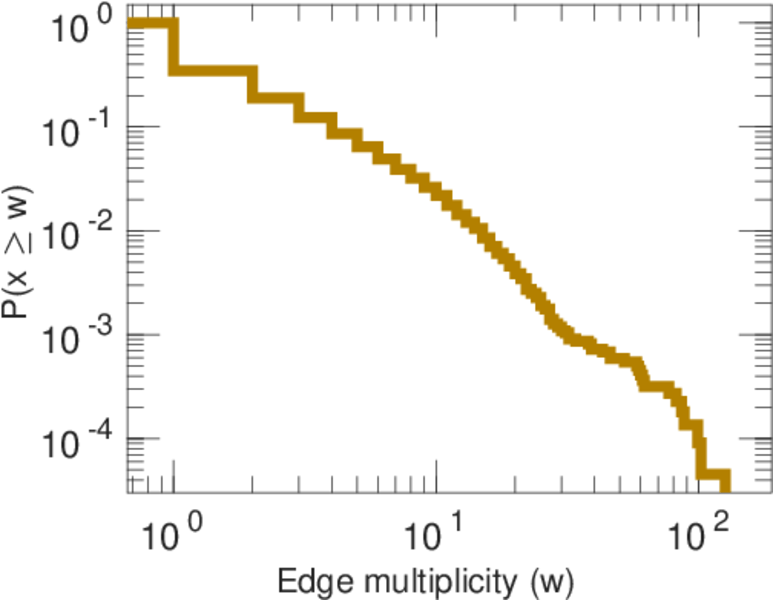
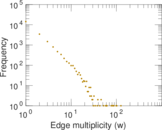
| Average edge multiplicity | m̃ = | 2.116 96
|
| Size of LCC | N = | 4,715
|
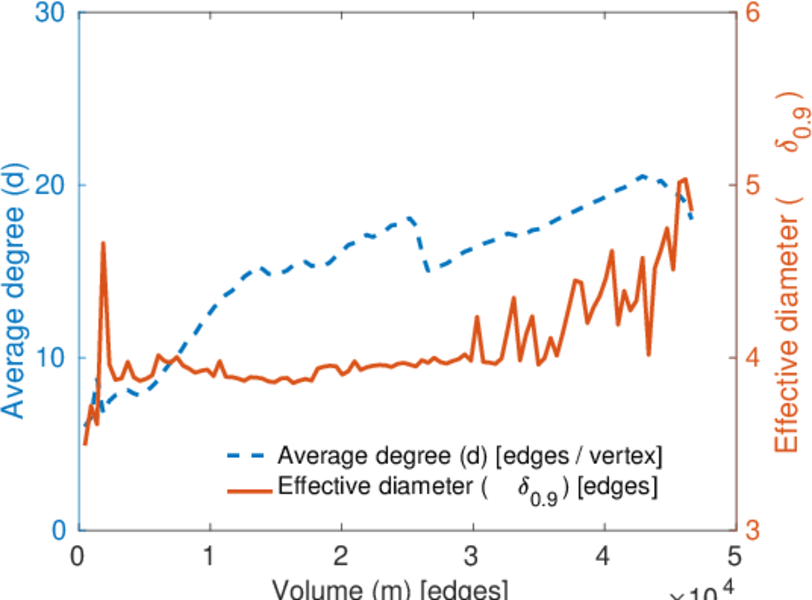
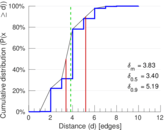
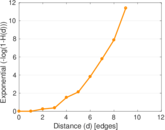
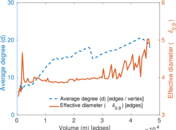
| Diameter | δ = | 11
|
| 50-Percentile effective diameter | δ0.5 = | 3.398 69
|
| 90-Percentile effective diameter | δ0.9 = | 5.191 90
|
| Median distance | δM = | 4
|
| Mean distance | δm = | 3.825 34
|
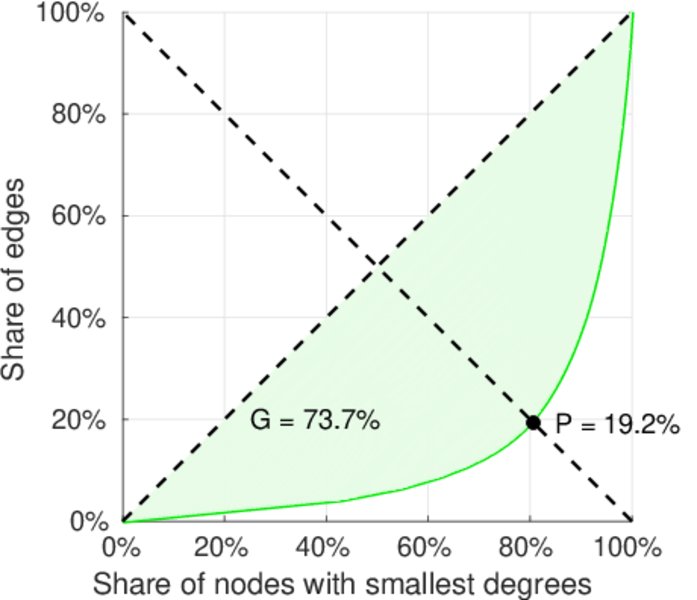
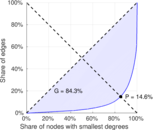
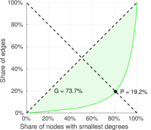
| Gini coefficient | G = | 0.846 088
|
| Balanced inequality ratio | P = | 0.146 759
|
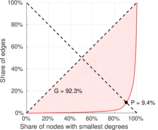
| Left balanced inequality ratio | P1 = | 0.093 548 2
|
| Right balanced inequality ratio | P2 = | 0.191 945
|
| Relative edge distribution entropy | Her = | 0.784 443
|
| Power law exponent | γ = | 2.094 41
|
| Tail power law exponent | γt = | 1.731 00
|
| Tail power law exponent with p | γ3 = | 1.731 00
|
| p-value | p = | 0.000 00
|
| Left tail power law exponent with p | γ3,1 = | 1.601 00
|
| Left p-value | p1 = | 0.000 00
|
| Right tail power law exponent with p | γ3,2 = | 1.751 00
|
| Right p-value | p2 = | 0.000 00
|
| Degree assortativity | ρ = | −0.308 747
|
| Degree assortativity p-value | pρ = | 0.000 00
|
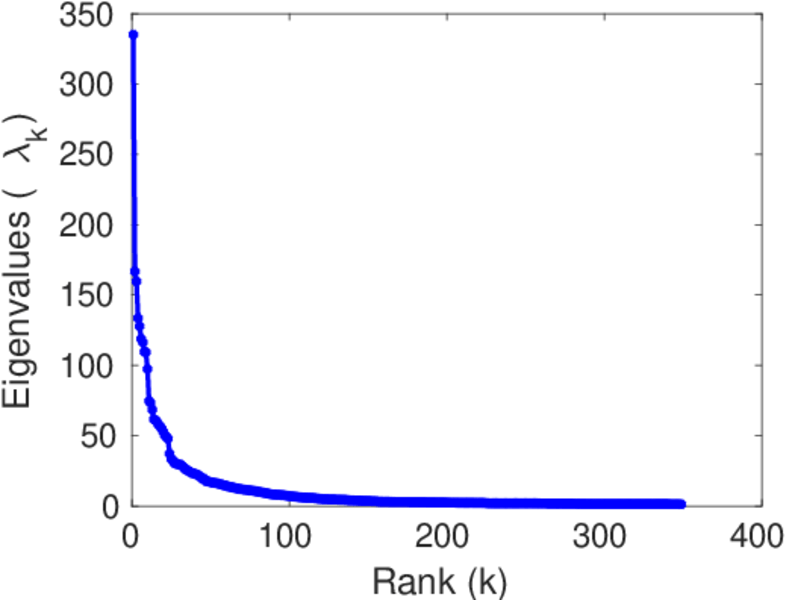
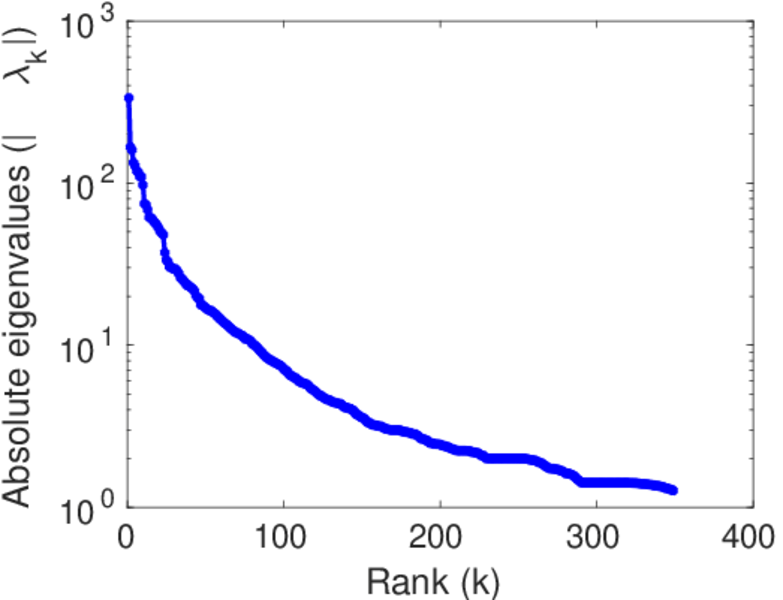
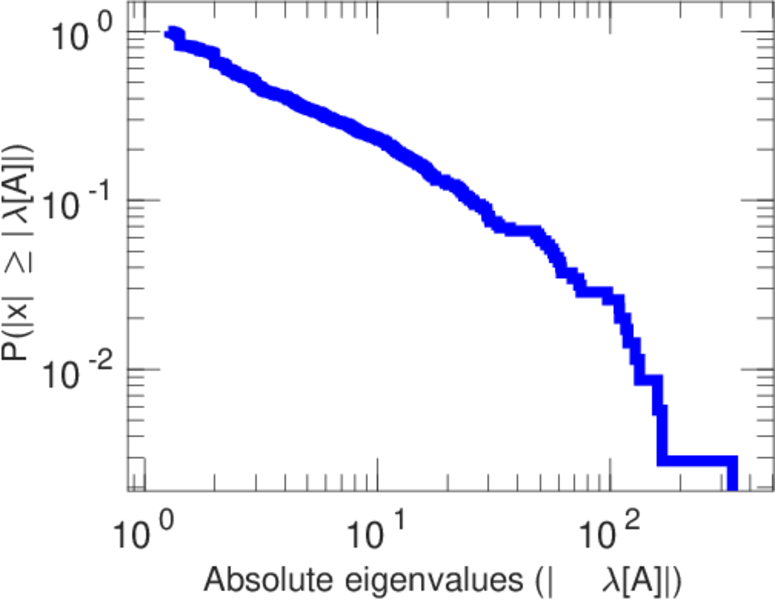
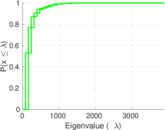
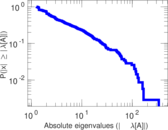
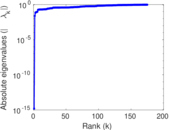
| Spectral norm | α = | 335.026
|
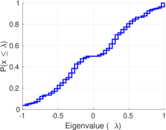
| Algebraic connectivity | a = | 0.024 227 7
|
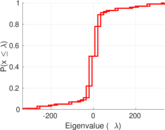
| Spectral separation | |λ1[A] / λ2[A]| = | 2.008 36
|
| Controllability | C = | 3,955
|
| Relative controllability | Cr = | 0.763 956
|
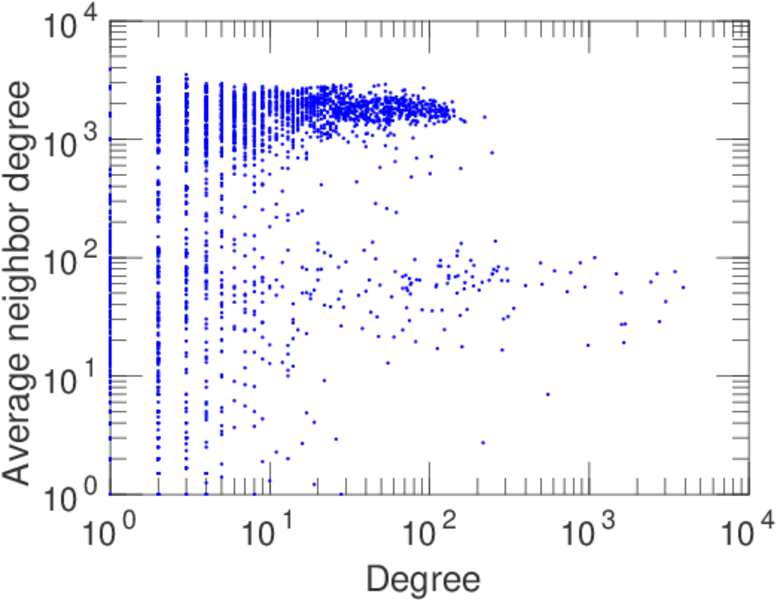
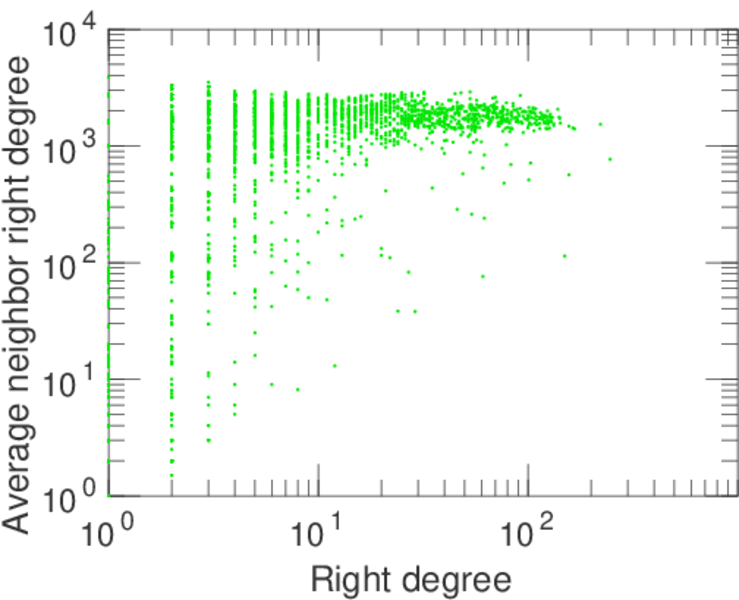
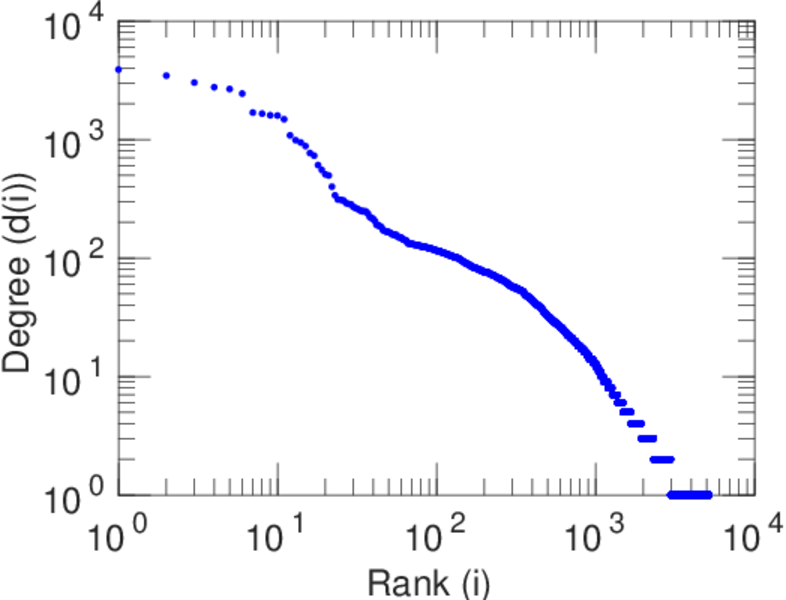
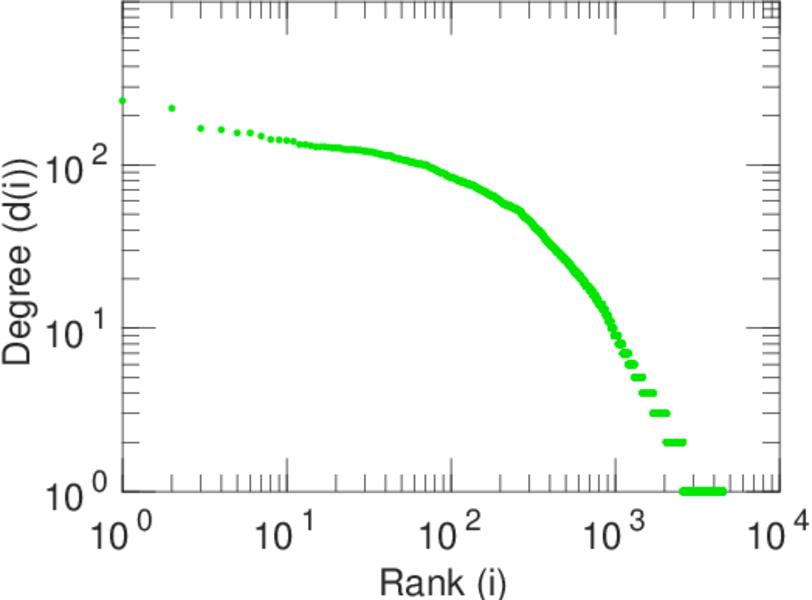
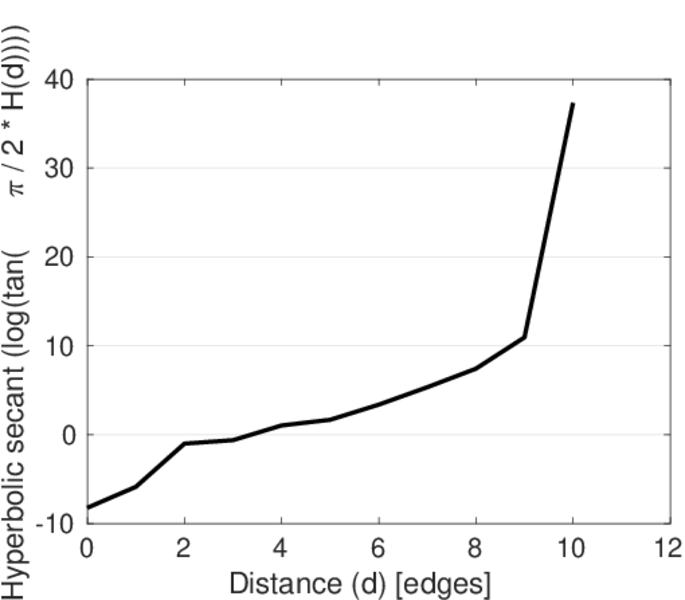
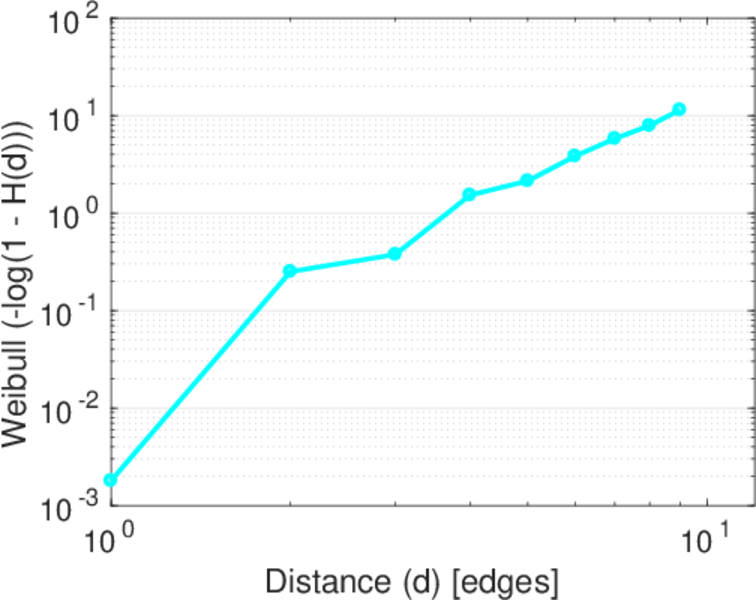
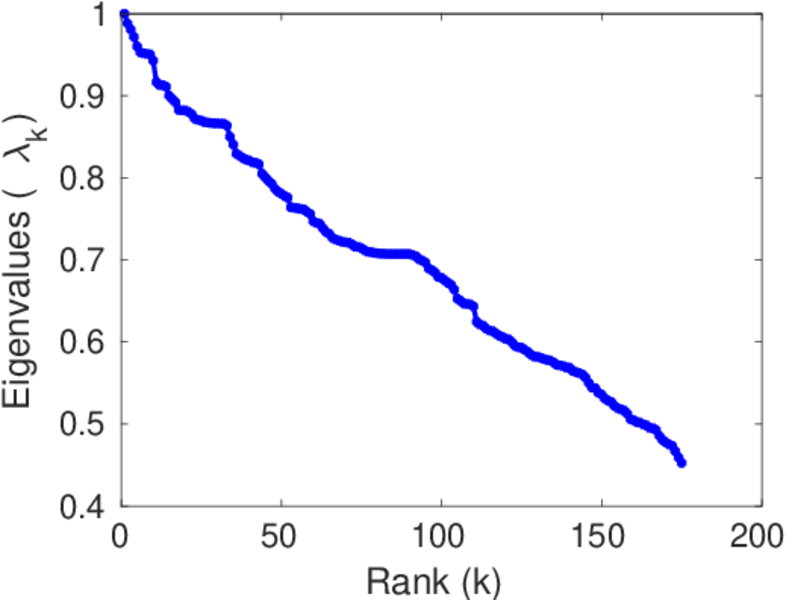
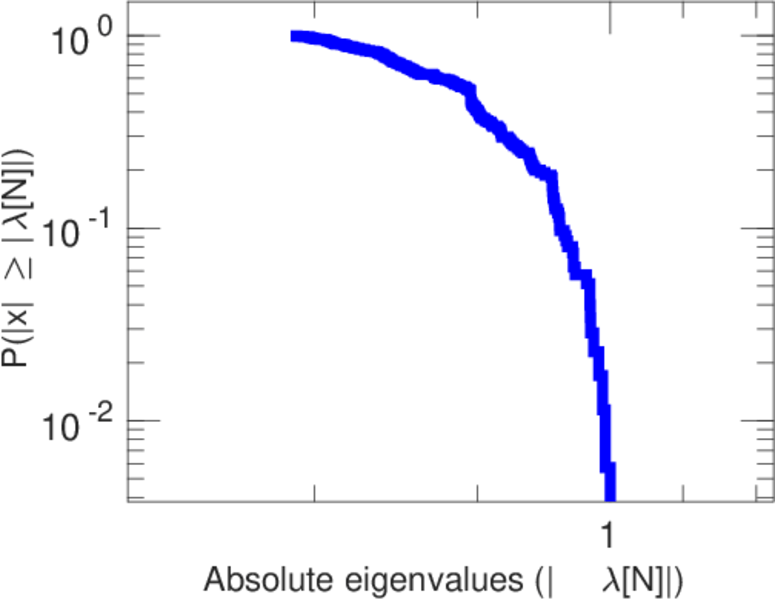
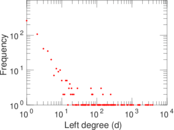
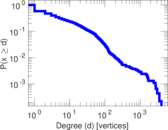
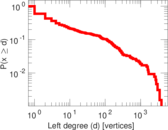
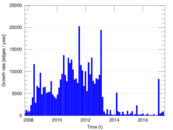
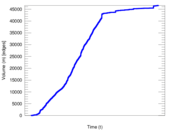
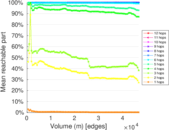
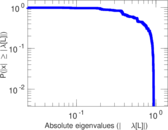
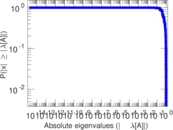
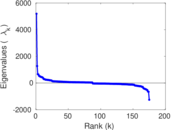
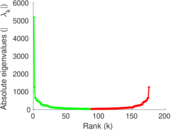
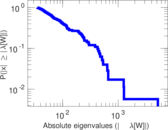
Plots


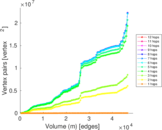
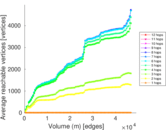
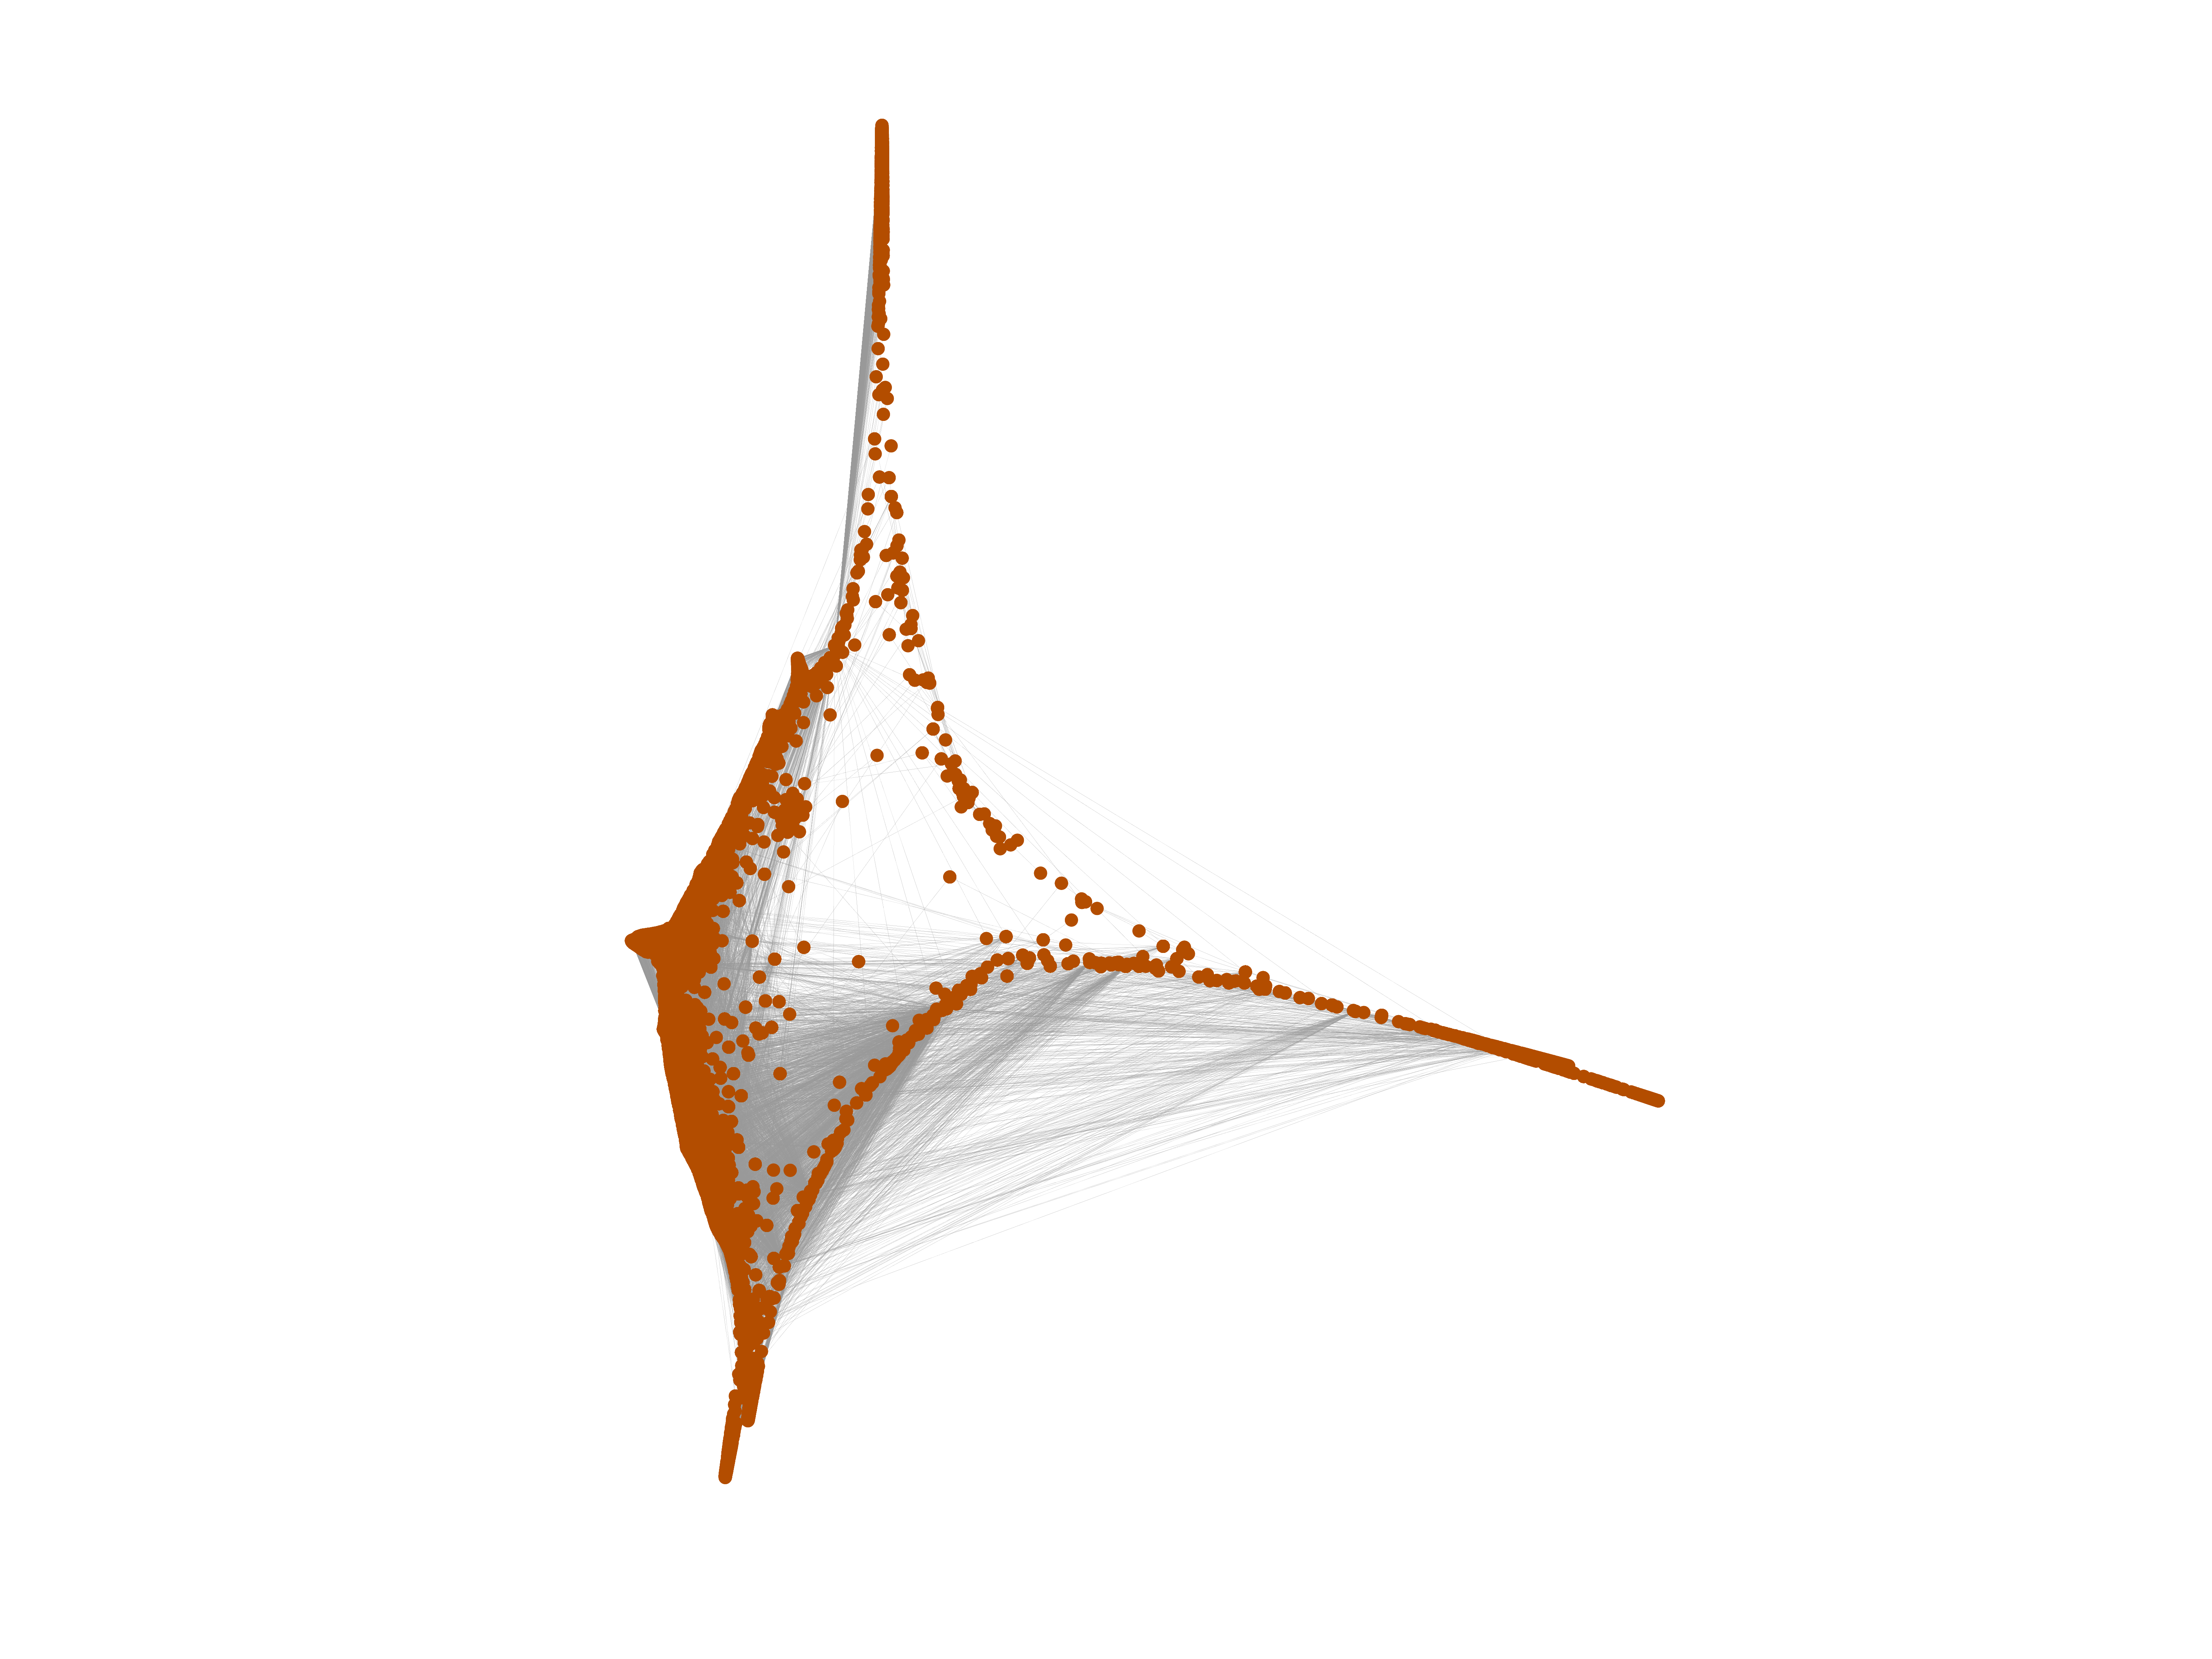
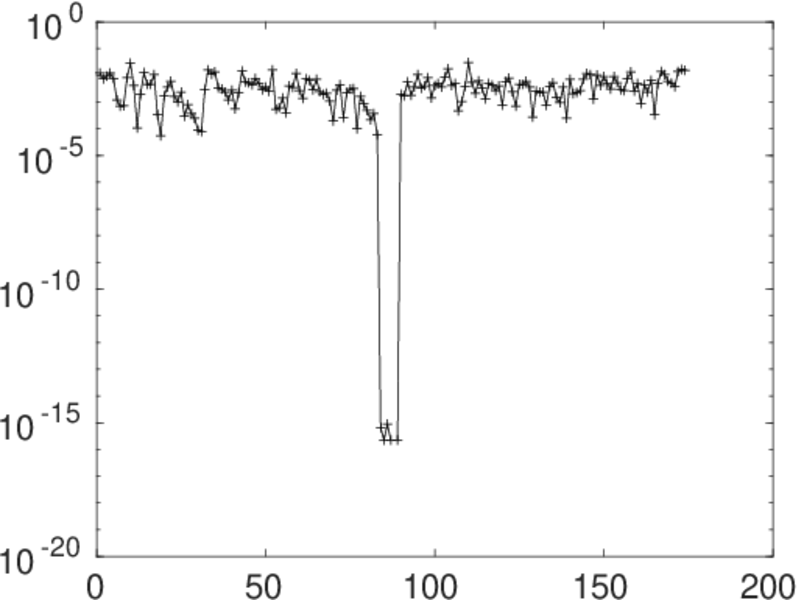
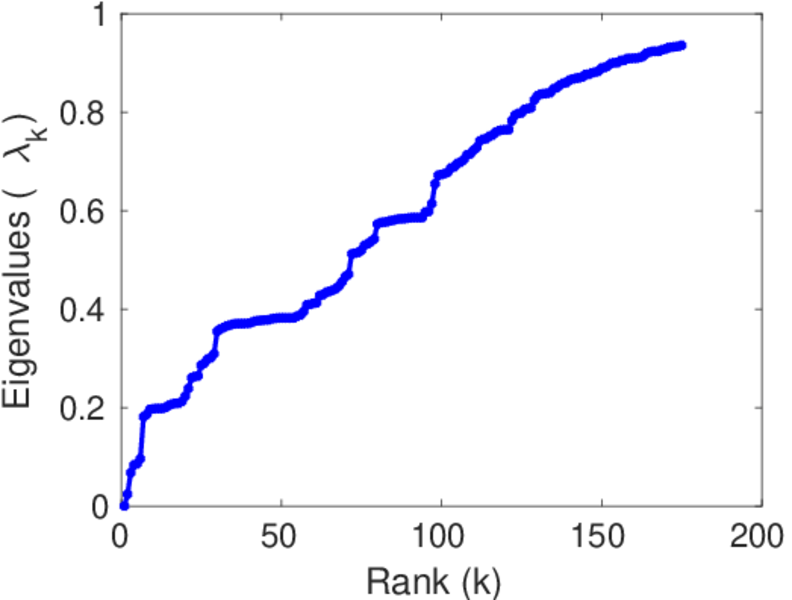
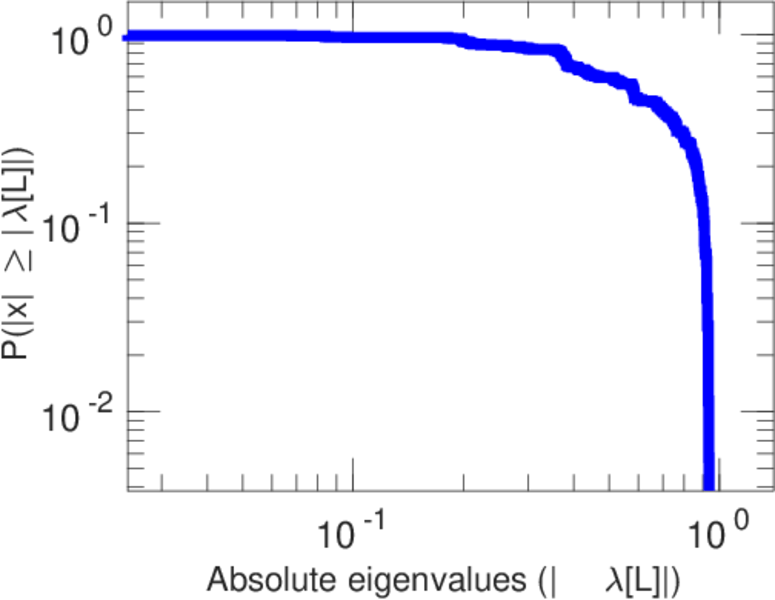
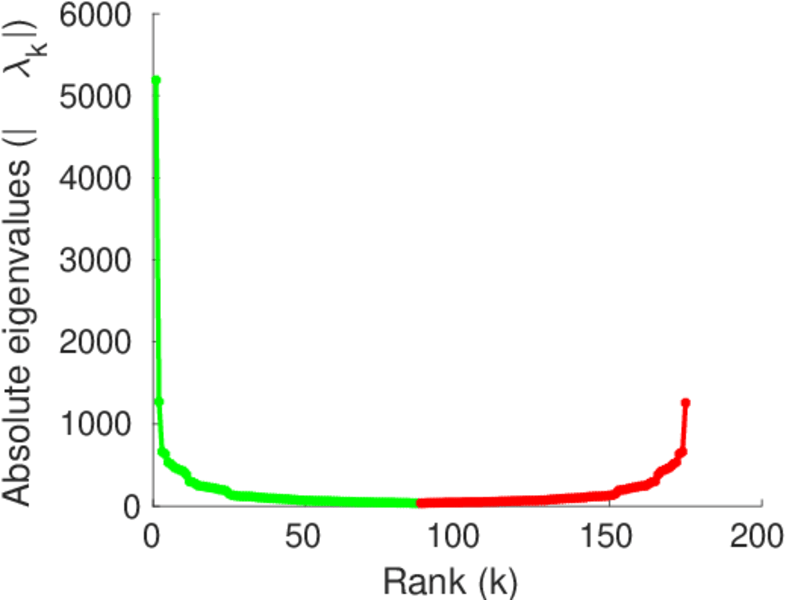
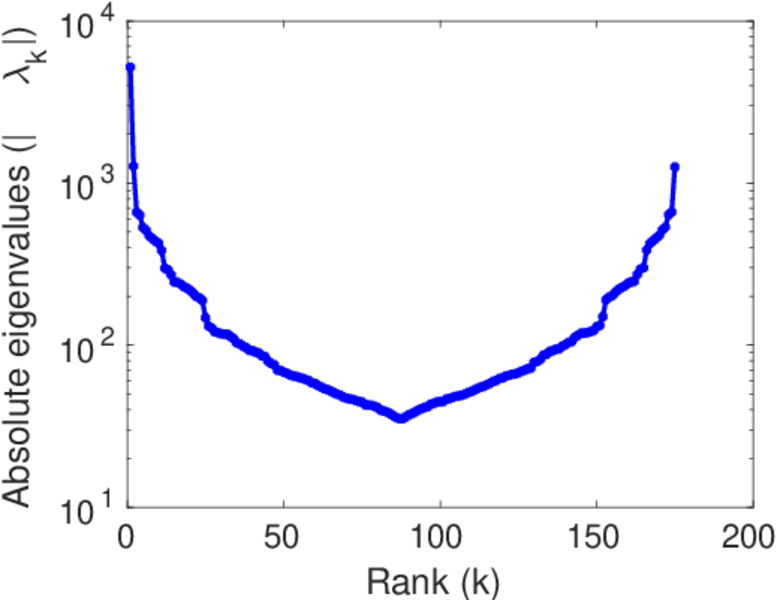
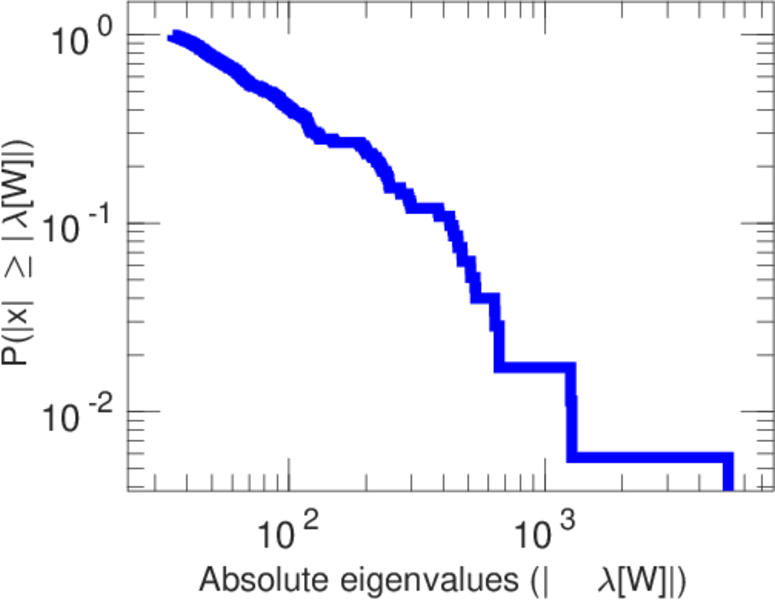
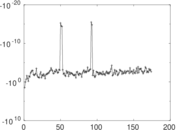
Matrix decompositions plots


Downloads
References
|
[1]
|
Jérôme Kunegis.
KONECT – The Koblenz Network Collection.
In Proc. Int. Conf. on World Wide Web Companion, pages
1343–1350, 2013.
[ http ]
|
|
[2]
|
Wikimedia Foundation.
Wikimedia downloads.
http://dumps.wikimedia.org/, January 2010.
|
 KONECT ‣ Networks ‣
Buy Me a Coffee
KONECT ‣ Networks ‣
Buy Me a Coffee