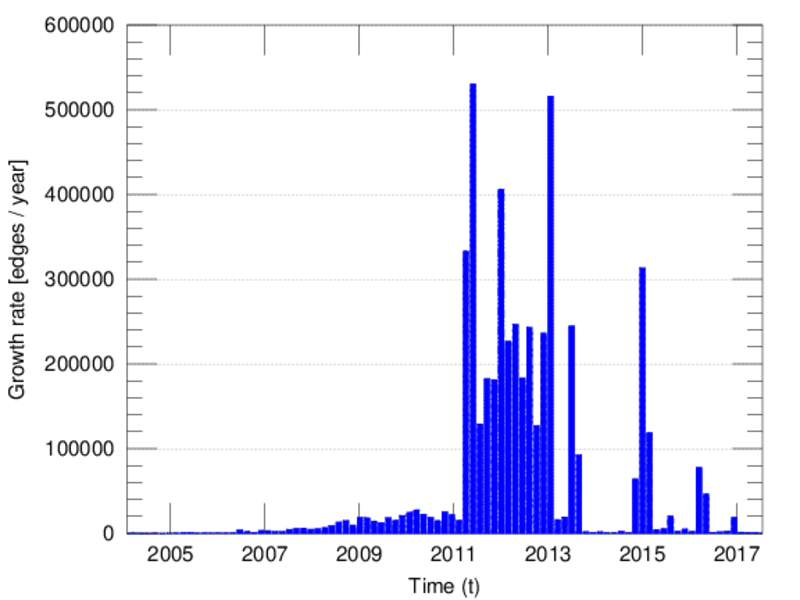
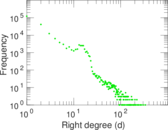
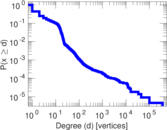
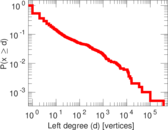
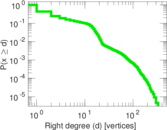
Wikipedia edits (mg)
This is the bipartite edit network of the Malagasy Wikipedia. It contains users
and pages from the Malagasy Wikipedia, connected by edit events. Each edge
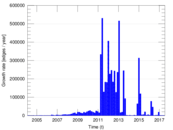
represents an edit. The dataset includes the timestamp of each edit.
Metadata
Statistics
| Size | n = | 220,064
|
| Left size | n1 = | 1,974
|
| Right size | n2 = | 218,090
|
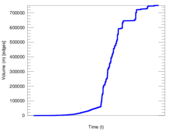
| Volume | m = | 750,811
|
| Unique edge count | m̿ = | 464,008
|
| Wedge count | s = | 23,785,057,176
|
| Claw count | z = | 1,486,346,704,603,495
|
| Square count | q = | 4,231,826,224
|
| 4-Tour count | T4 = | 128,996,231,380
|
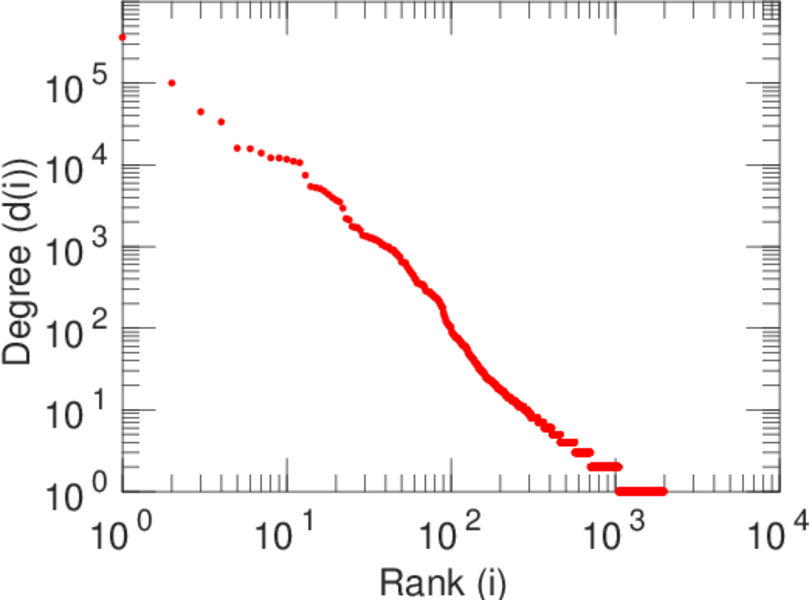
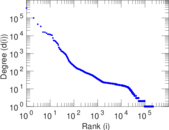
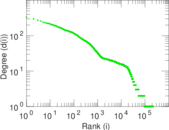
| Maximum degree | dmax = | 365,048
|
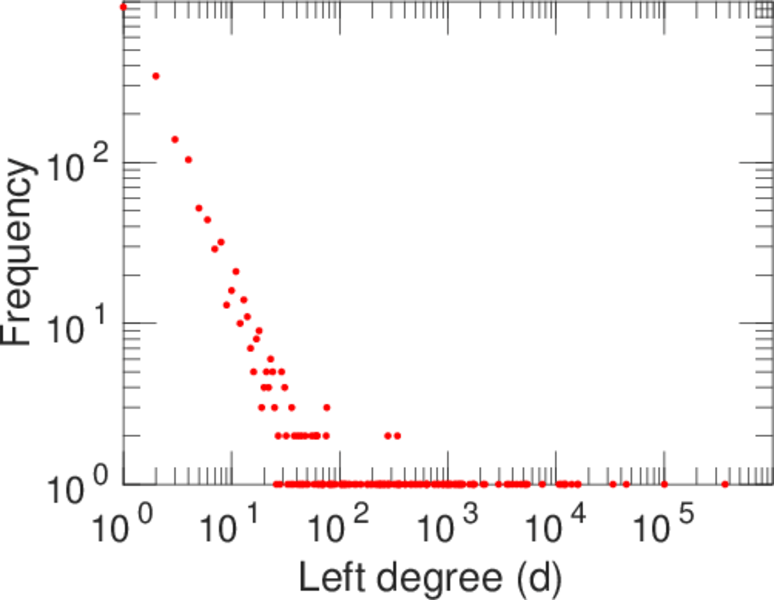
| Maximum left degree | d1max = | 365,048
|
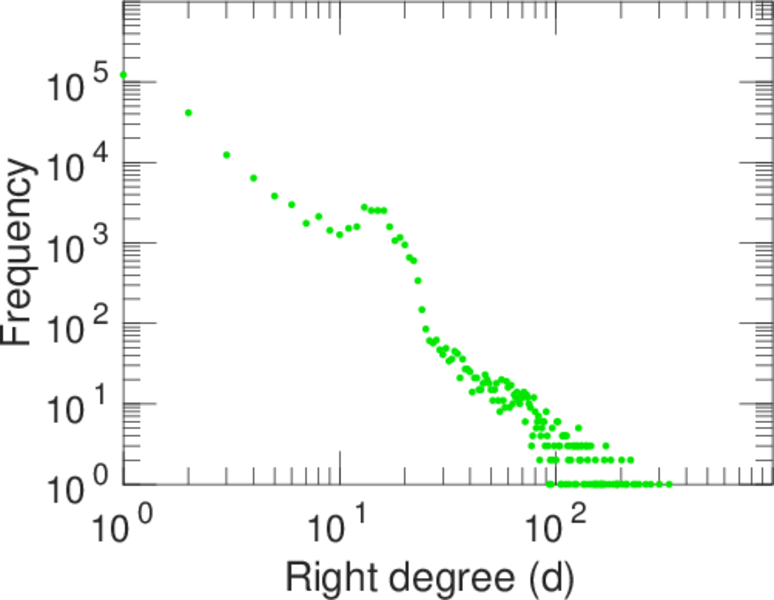
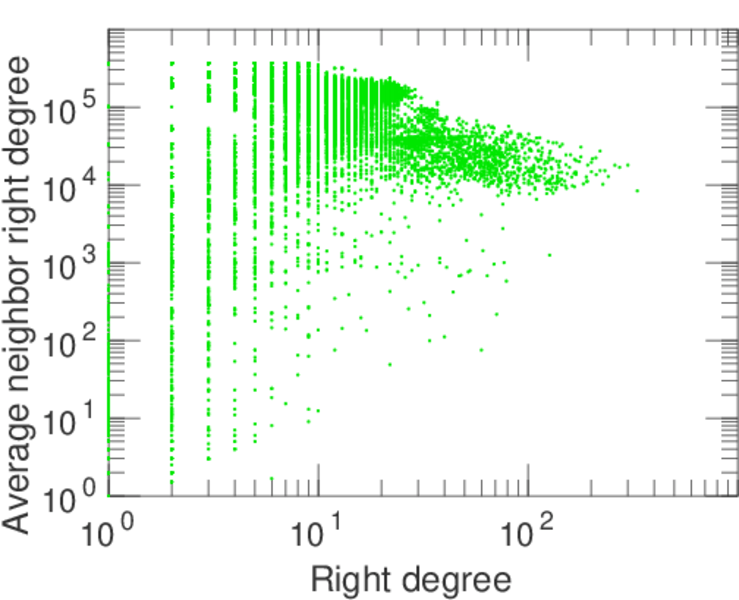
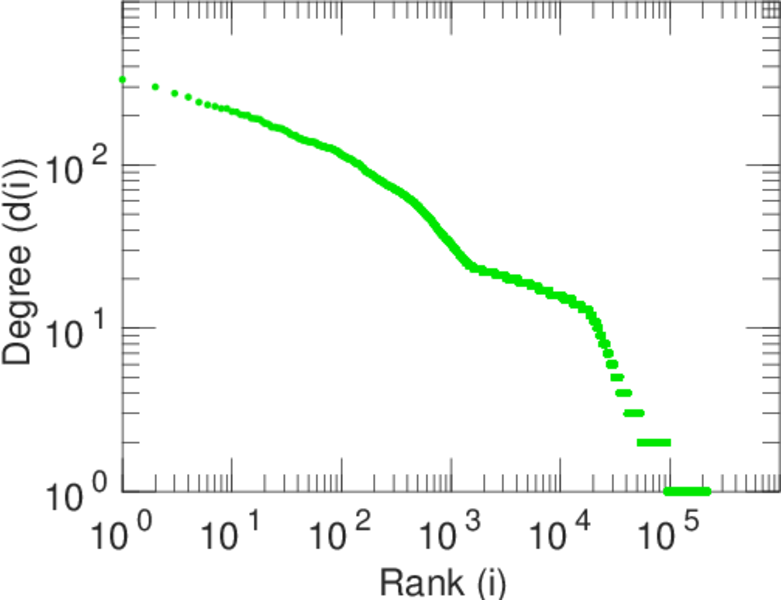
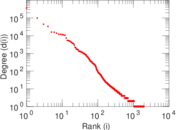
| Maximum right degree | d2max = | 333
|
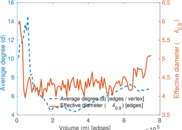
| Average degree | d = | 6.823 57
|
| Average left degree | d1 = | 380.350
|
| Average right degree | d2 = | 3.442 67
|
| Fill | p = | 0.001 077 81
|
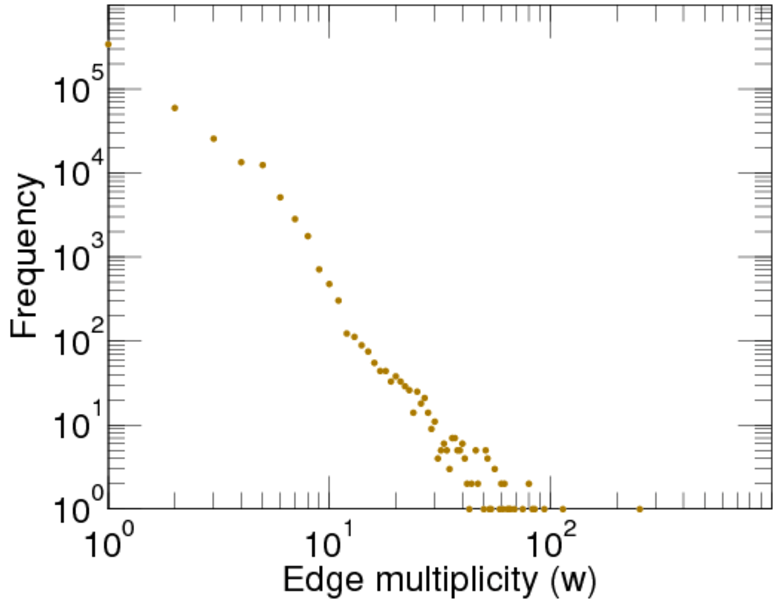
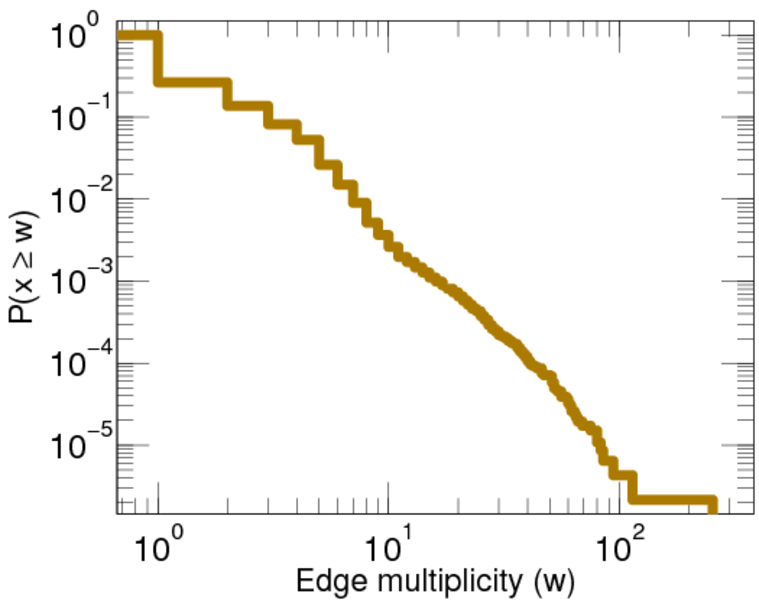
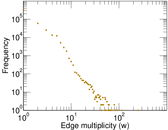
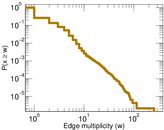
| Average edge multiplicity | m̃ = | 1.618 10
|
| Size of LCC | N = | 219,186
|
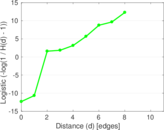
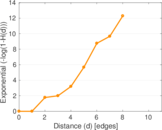
| Diameter | δ = | 12
|
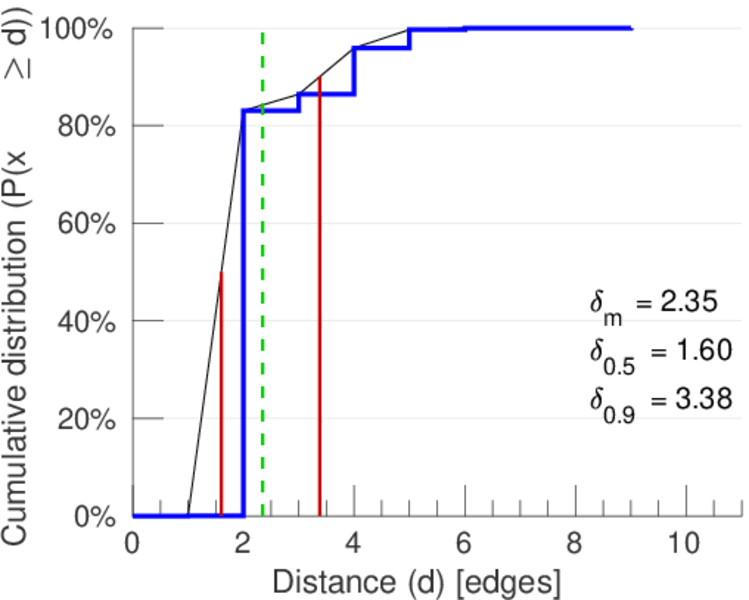
| 50-Percentile effective diameter | δ0.5 = | 1.602 03
|
| 90-Percentile effective diameter | δ0.9 = | 3.377 65
|
| Median distance | δM = | 2
|
| Mean distance | δm = | 2.349 93
|
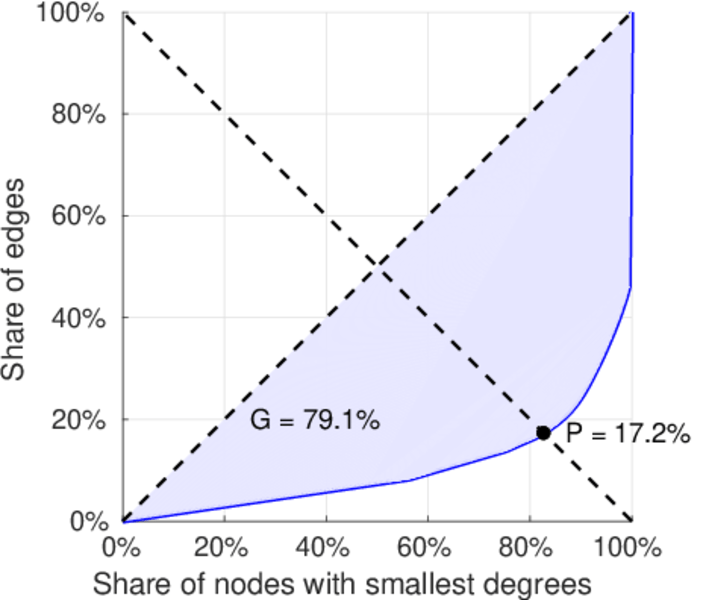
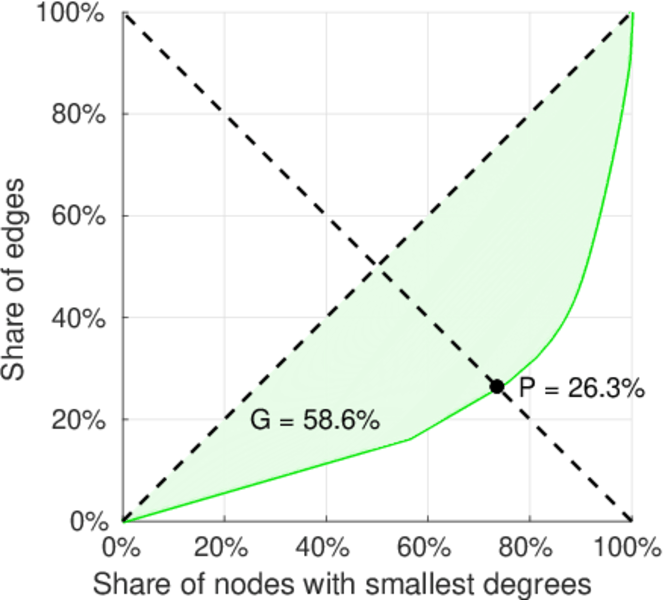
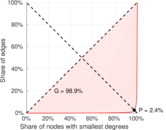
| Balanced inequality ratio | P = | 0.170 837
|
| Left balanced inequality ratio | P1 = | 0.023 930 1
|
| Right balanced inequality ratio | P2 = | 0.262 970
|
| Relative edge distribution entropy | Her = | 0.641 961
|
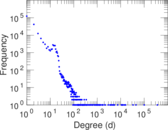
| Power law exponent | γ = | 3.458 21
|
| Tail power law exponent | γt = | 2.231 00
|
| Tail power law exponent with p | γ3 = | 2.231 00
|
| p-value | p = | 0.000 00
|
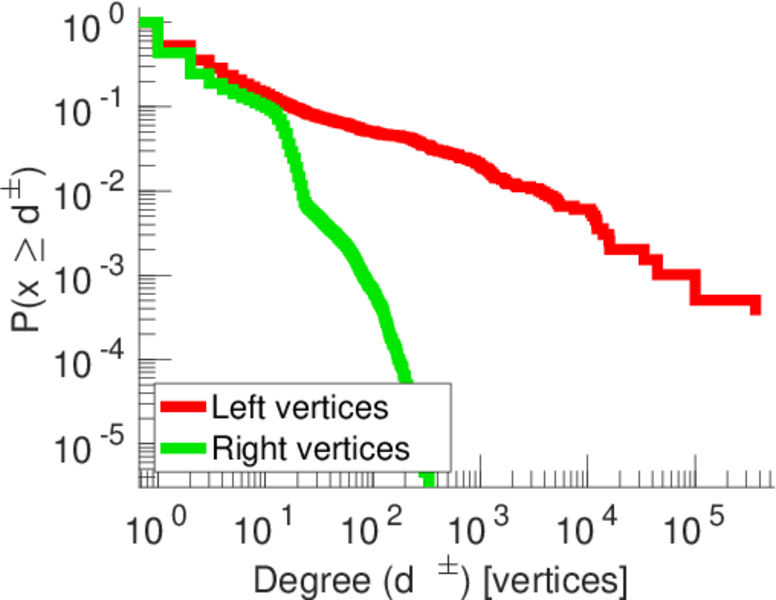
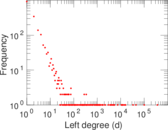
| Left tail power law exponent with p | γ3,1 = | 1.751 00
|
| Left p-value | p1 = | 0.000 00
|
| Right tail power law exponent with p | γ3,2 = | 2.241 00
|
| Right p-value | p2 = | 0.000 00
|
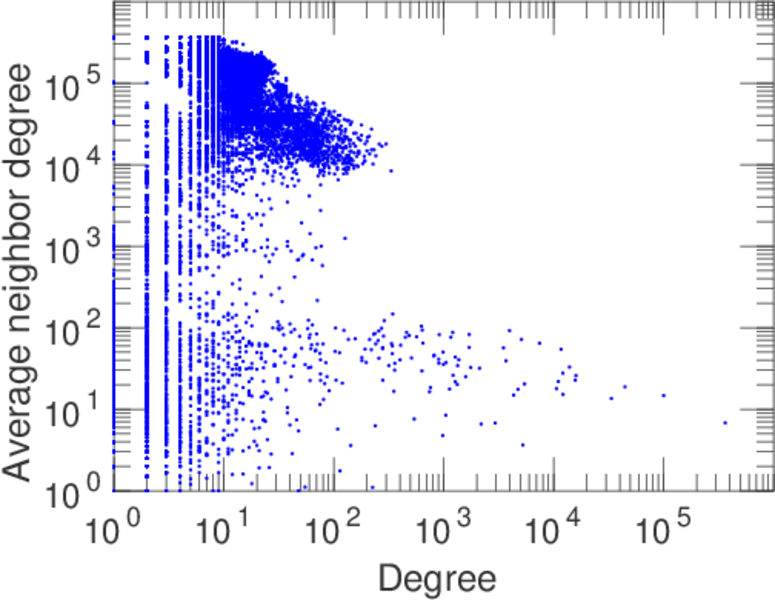
| Degree assortativity | ρ = | −0.509 555
|
| Degree assortativity p-value | pρ = | 0.000 00
|
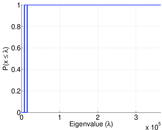
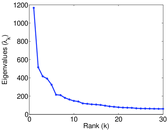
| Spectral norm | α = | 1,166.39
|
| Algebraic connectivity | a = | 0.008 630 13
|
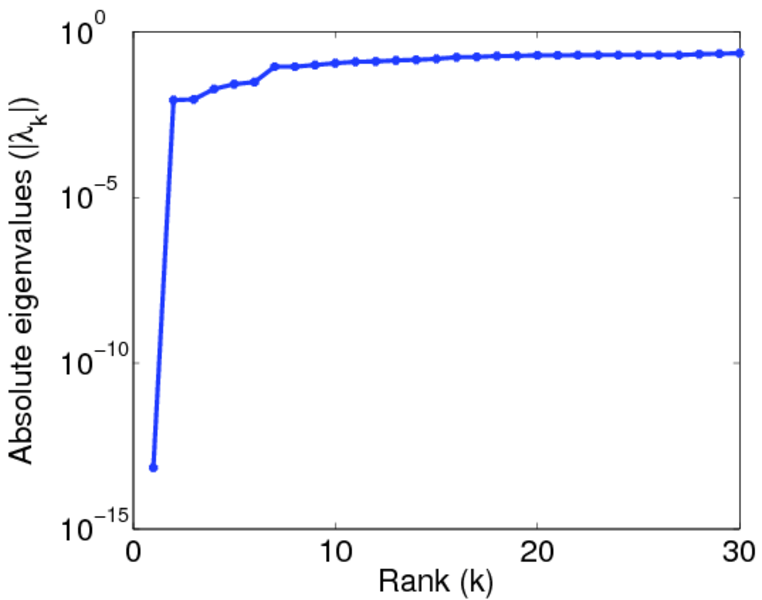
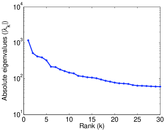
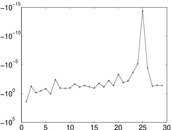
| Spectral separation | |λ1[A] / λ2[A]| = | 2.261 38
|
| Controllability | C = | 216,448
|
| Relative controllability | Cr = | 0.984 311
|
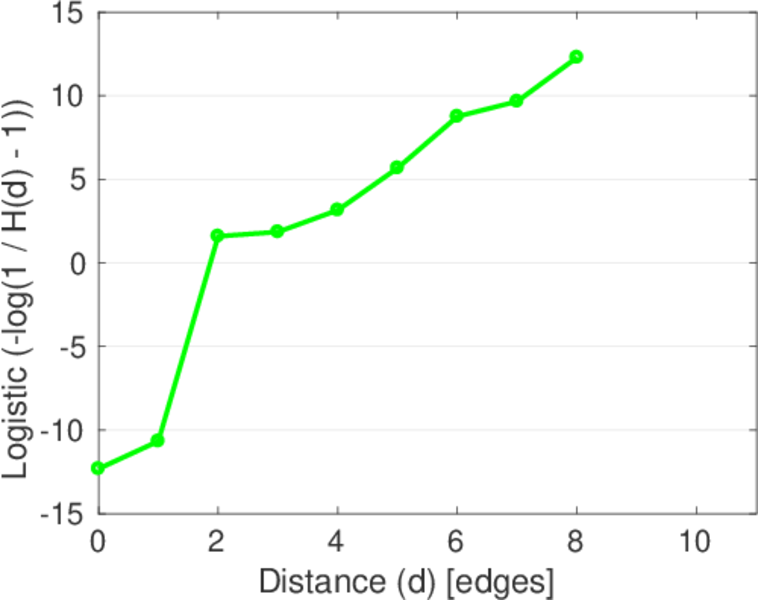
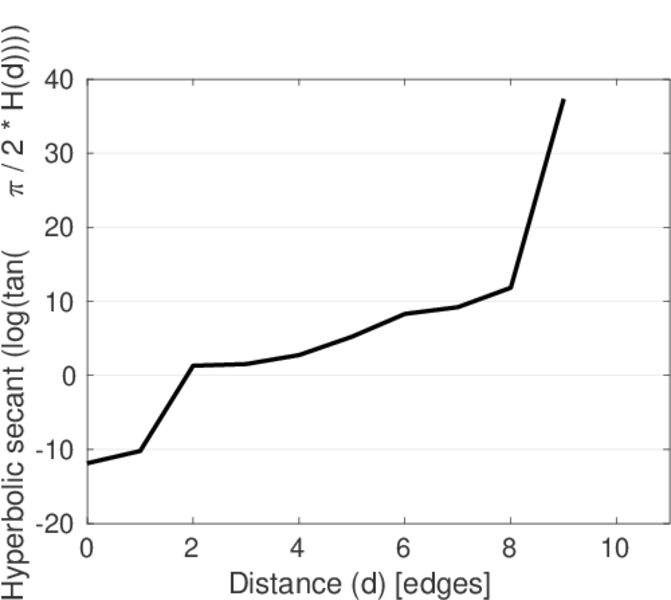
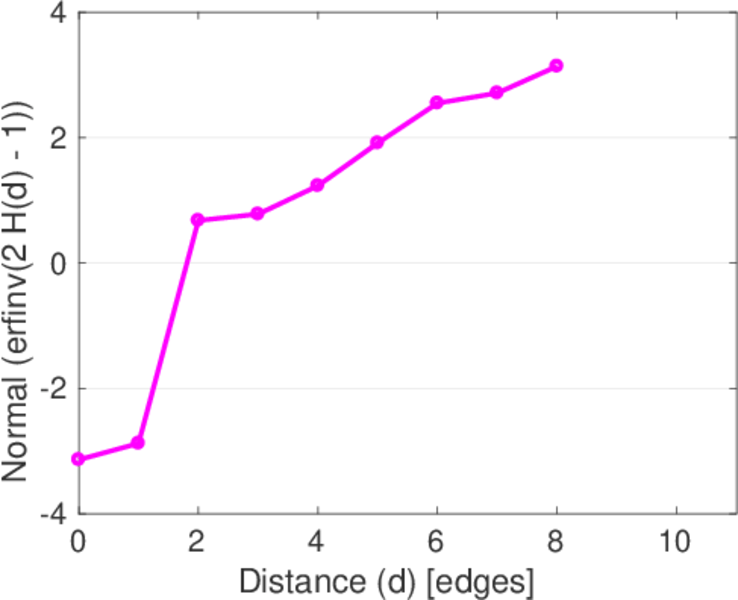
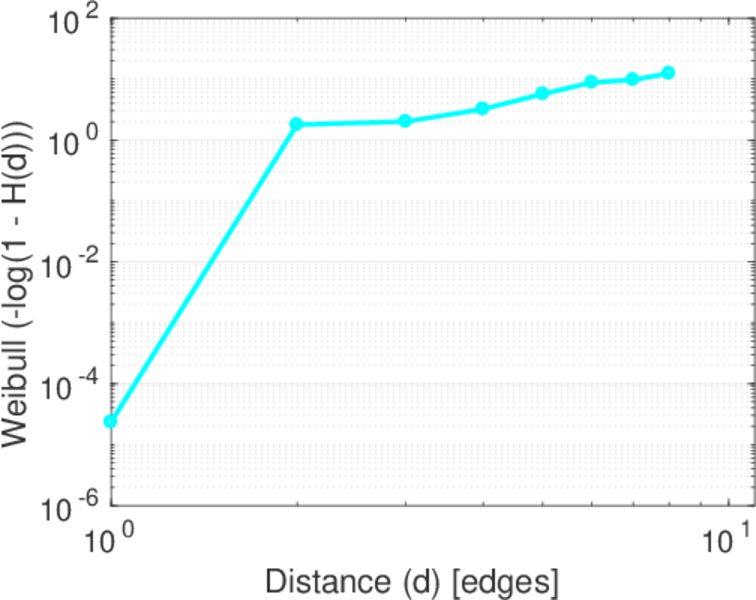
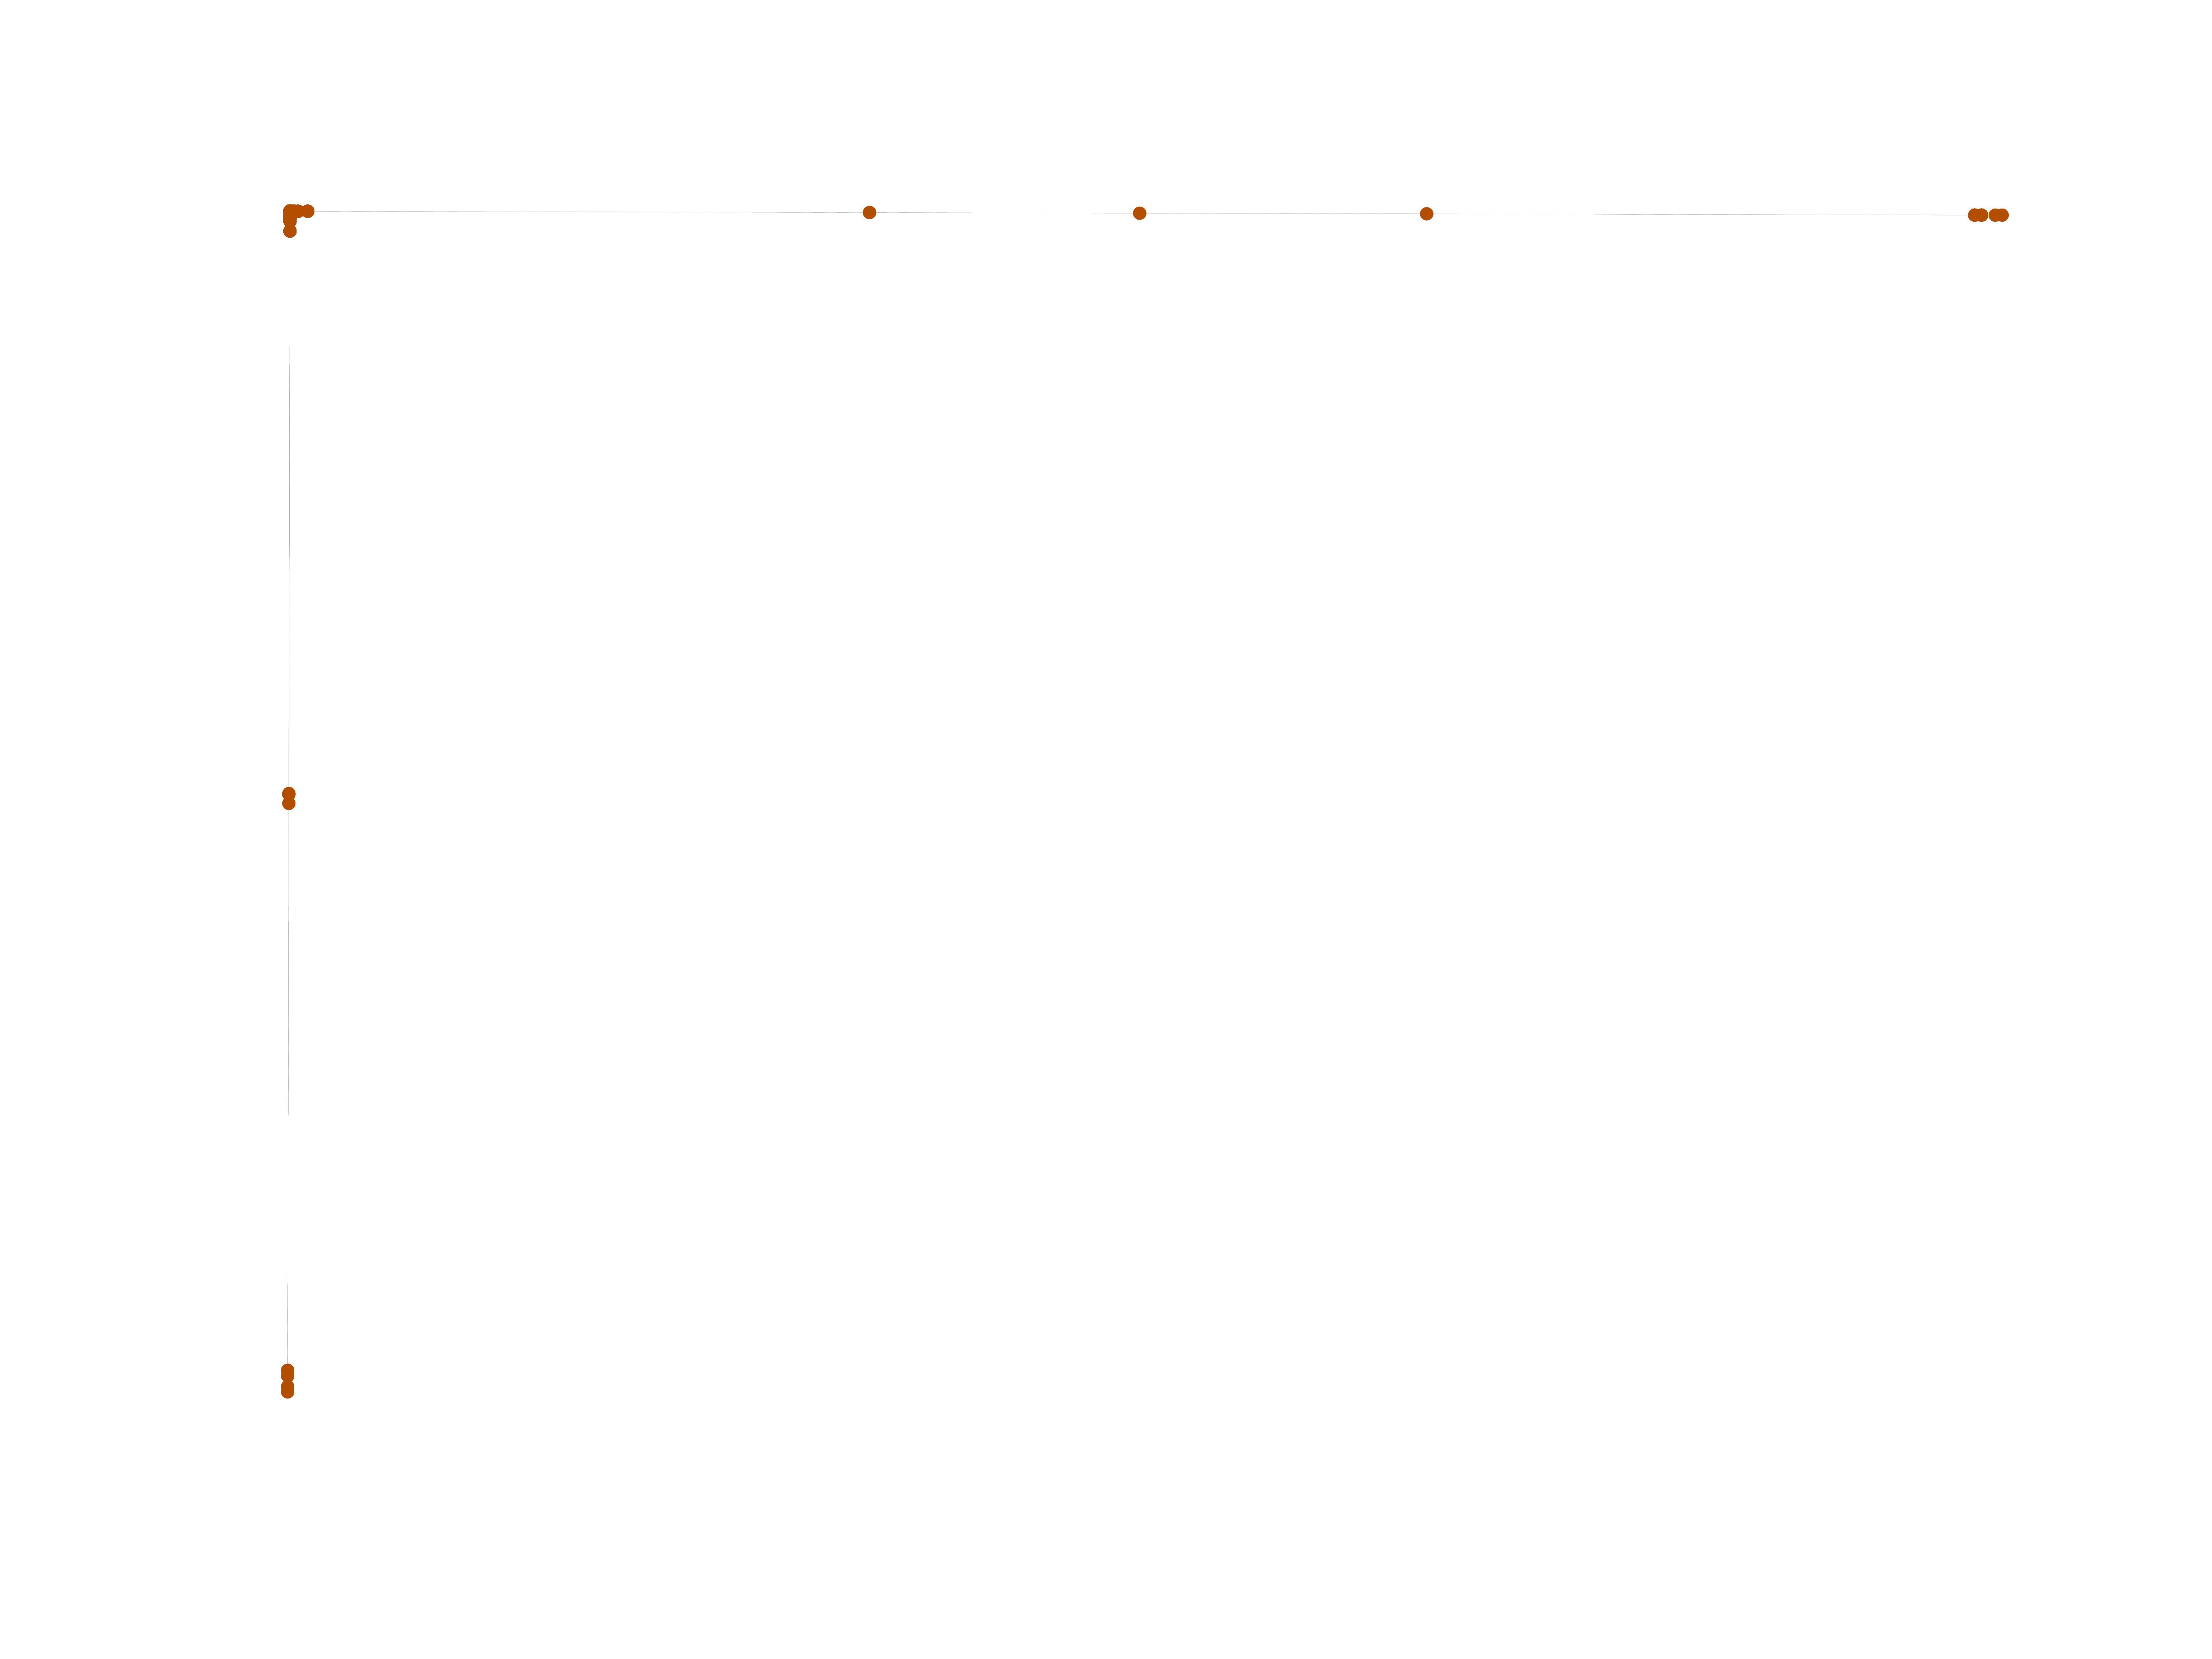
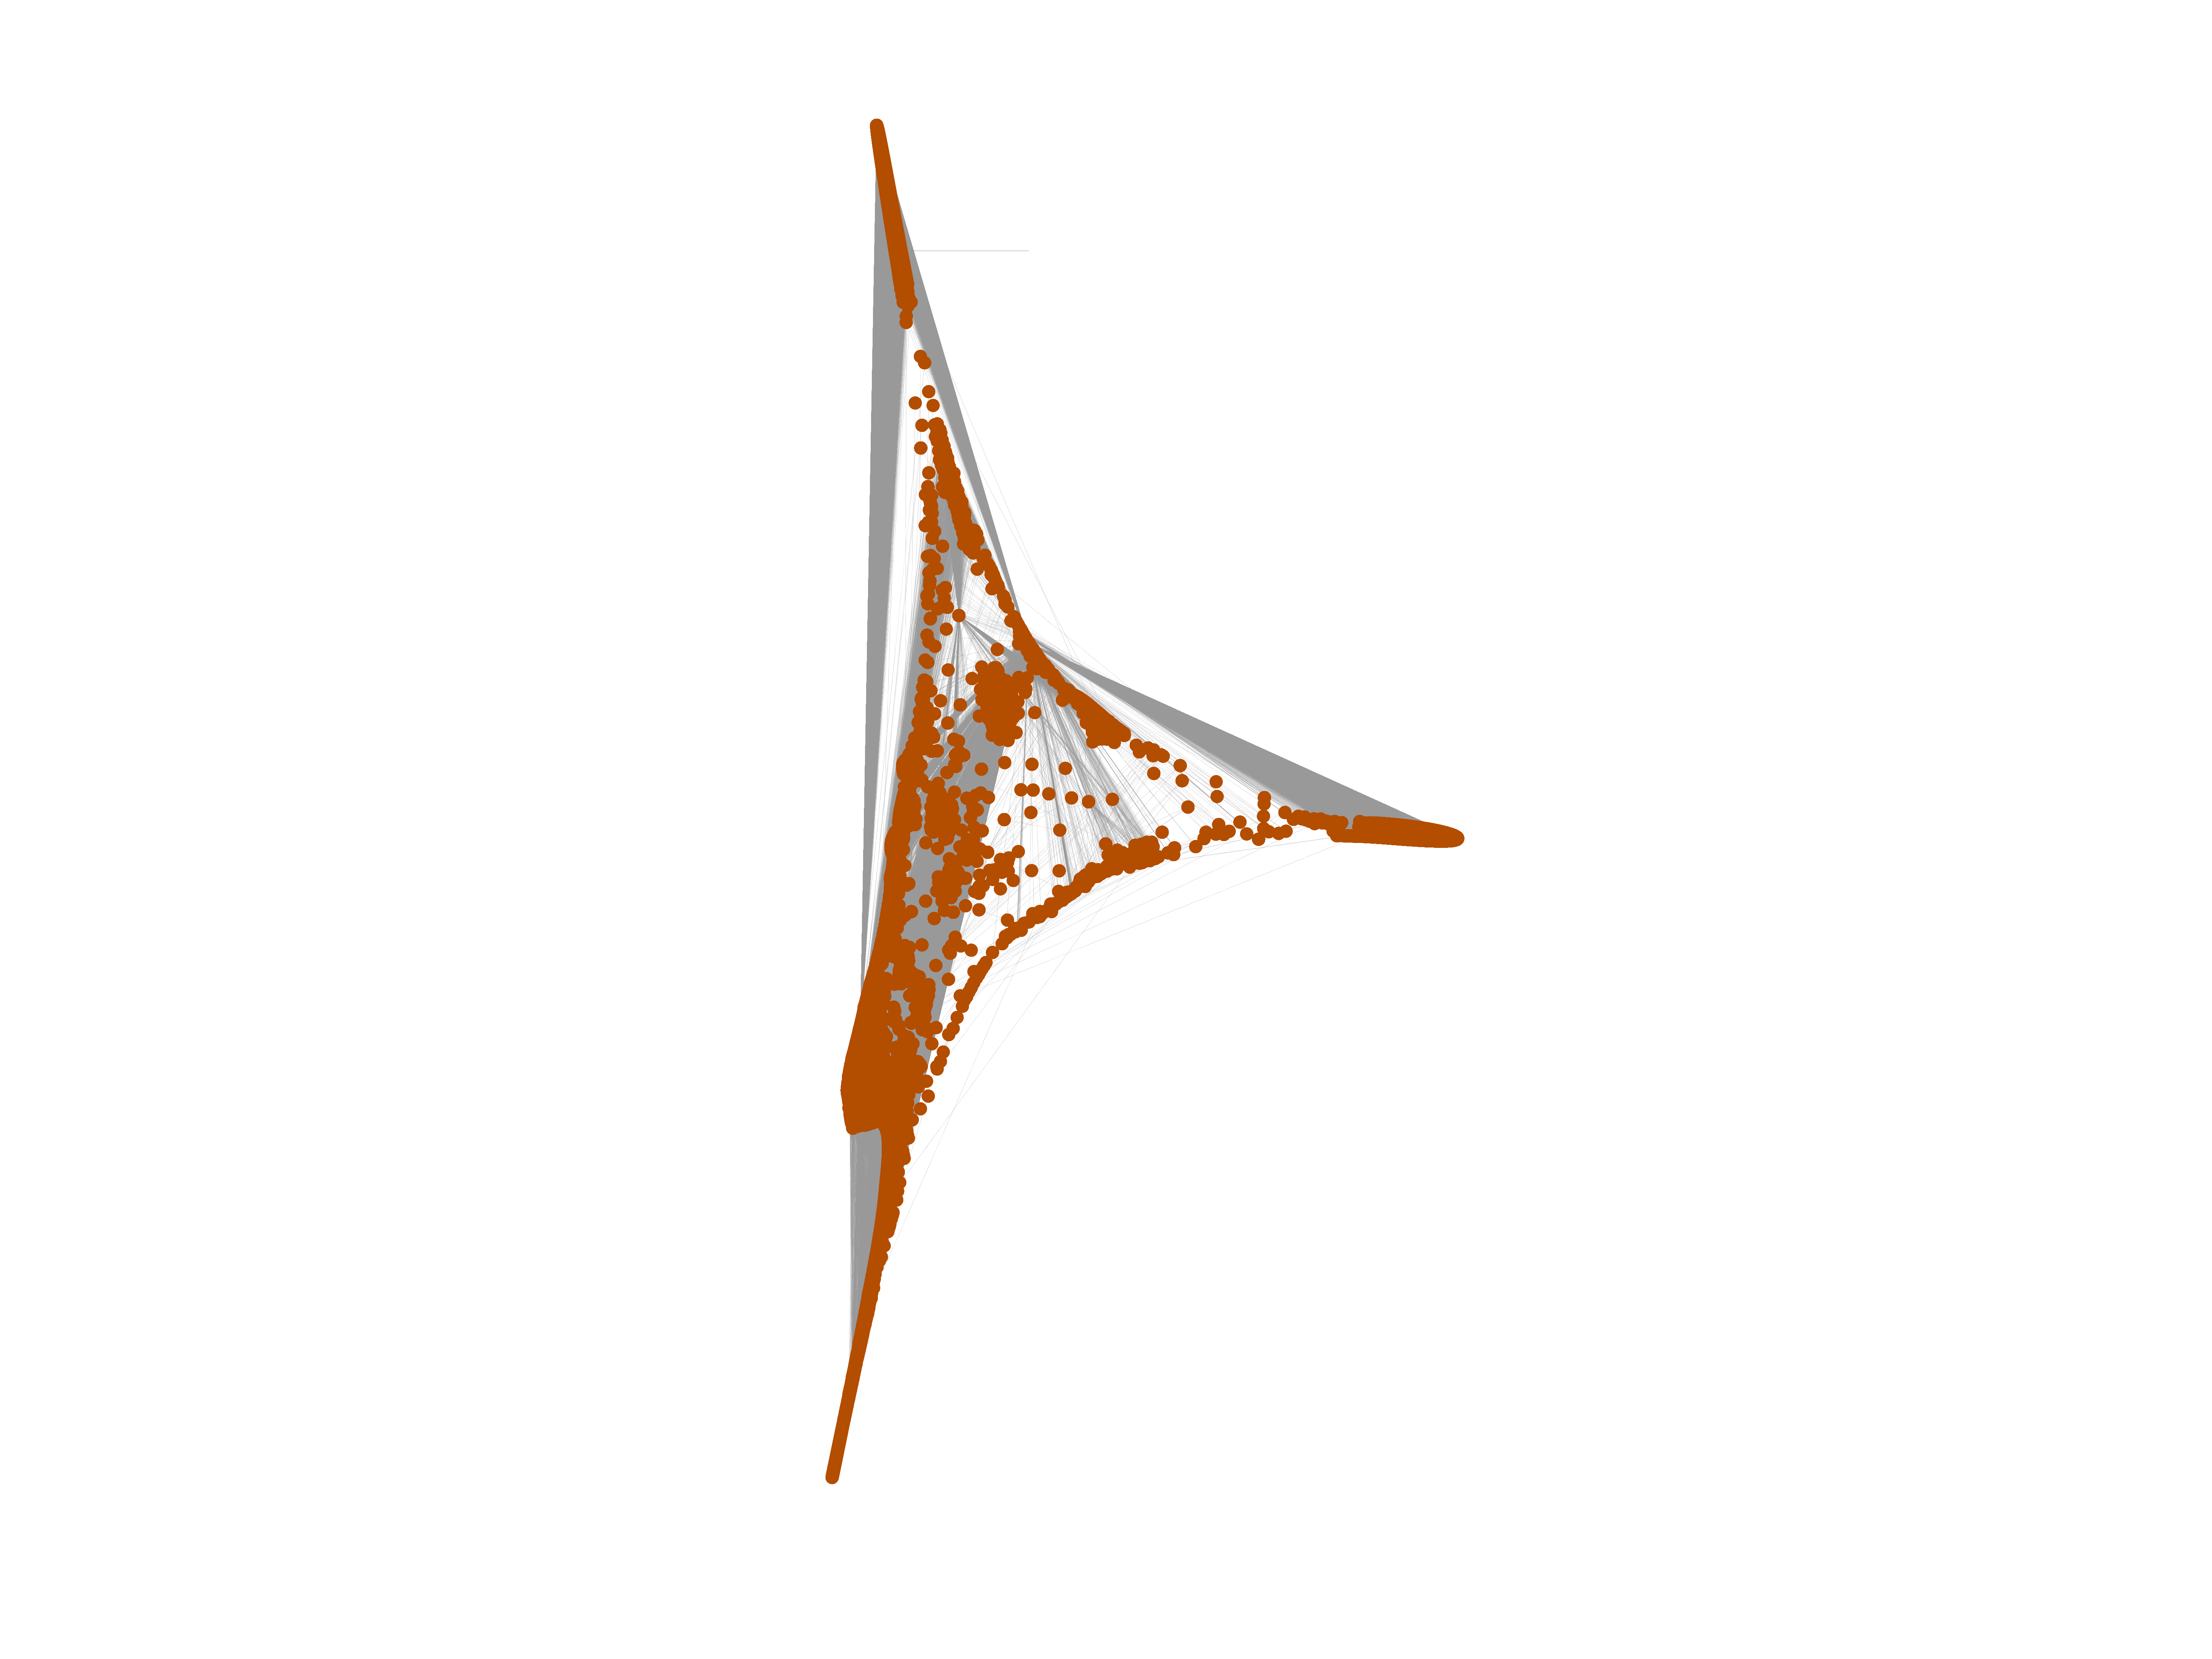
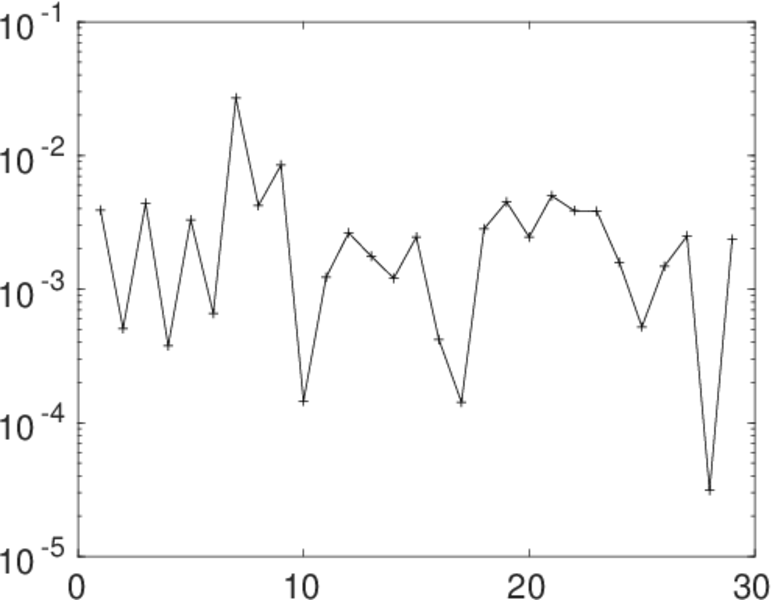
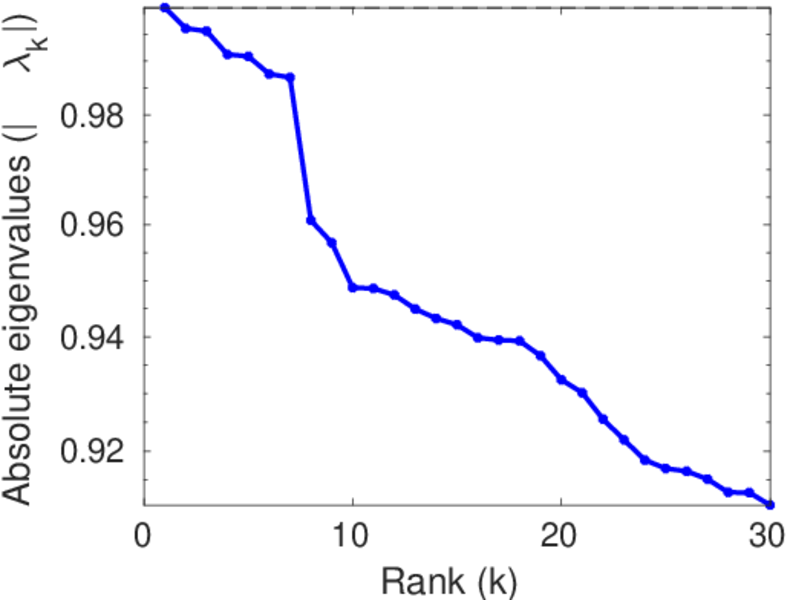
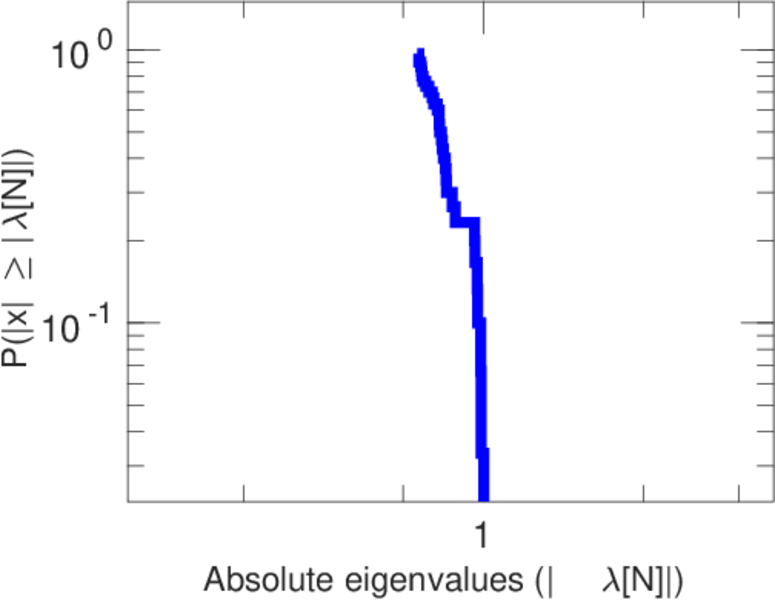
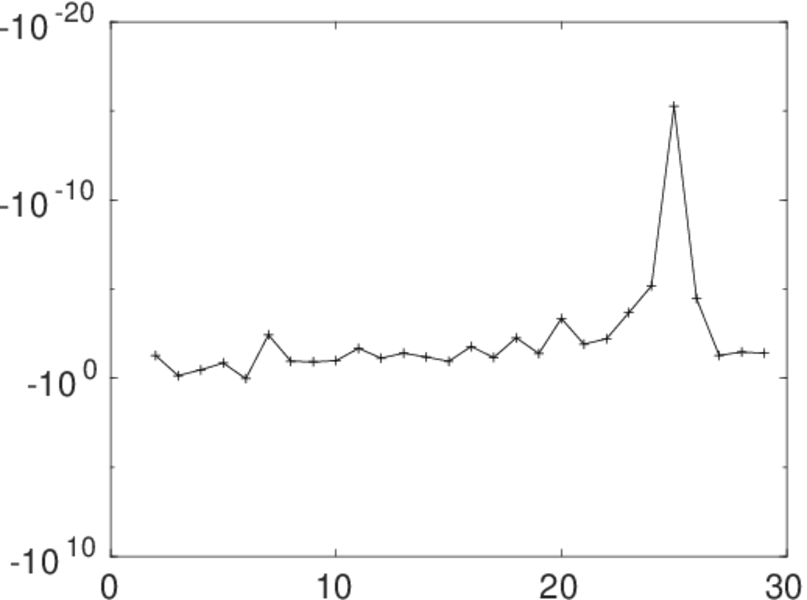
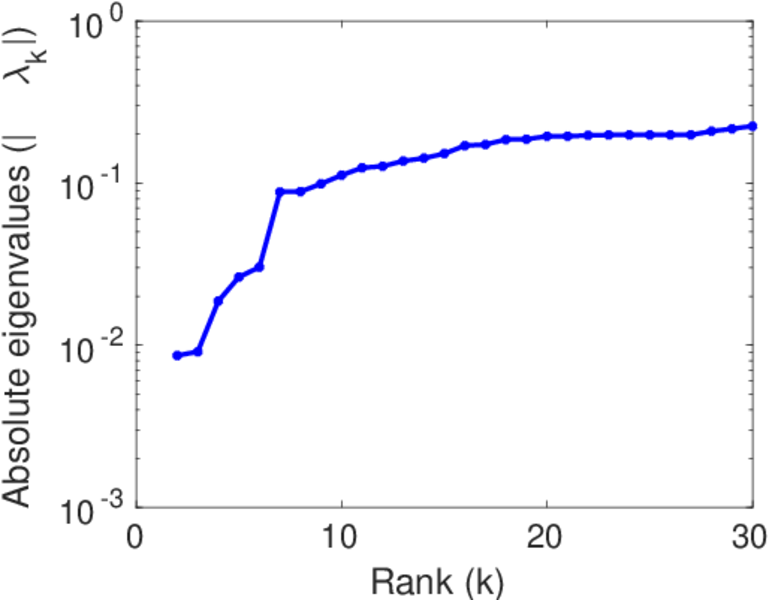
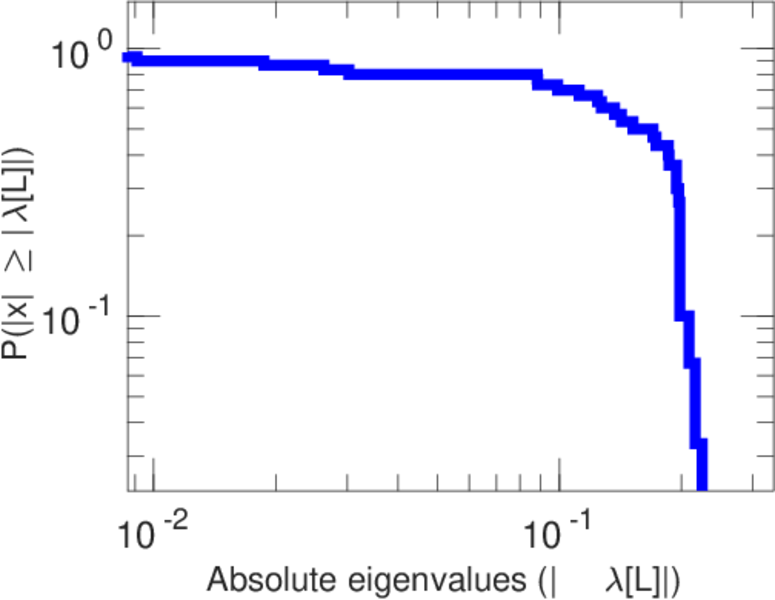
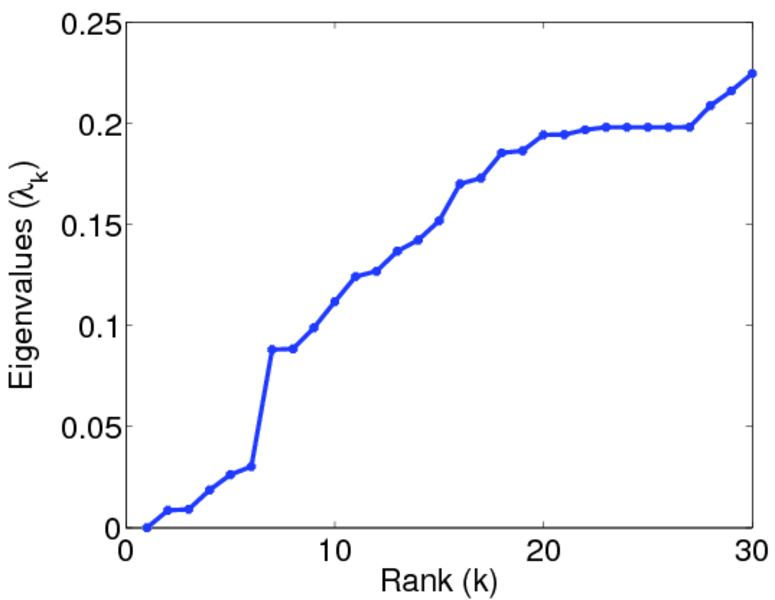
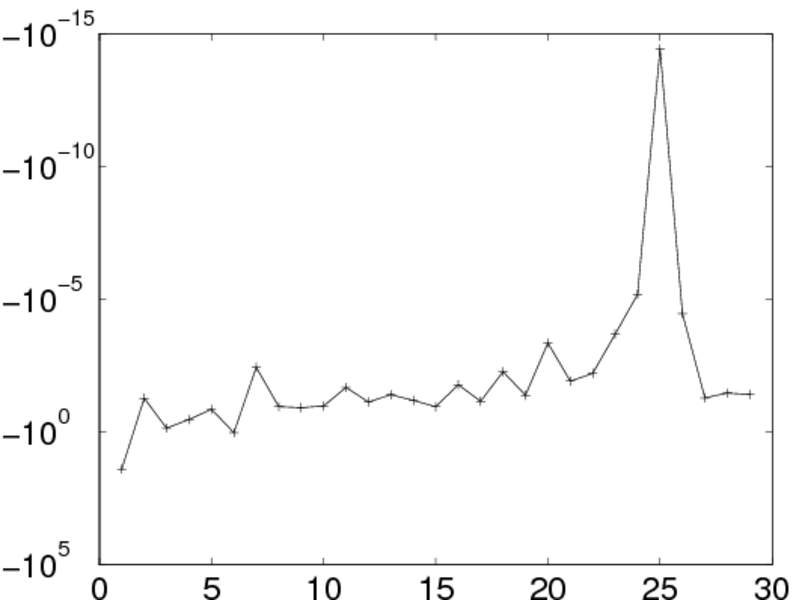
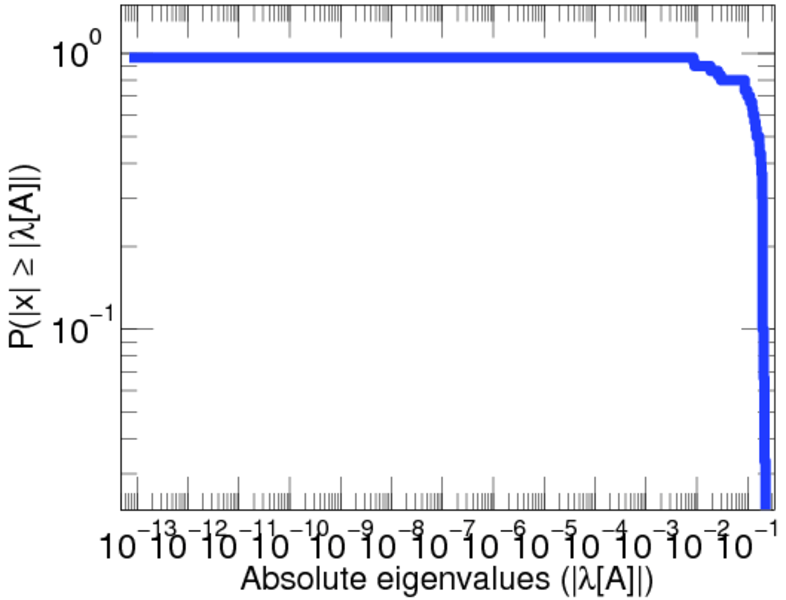
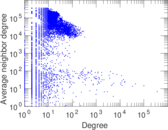
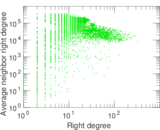
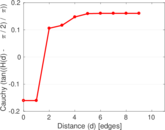
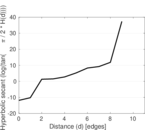
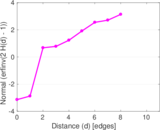
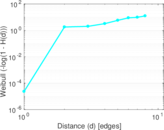
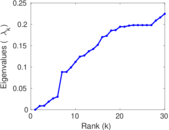
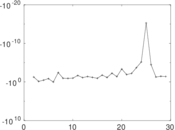
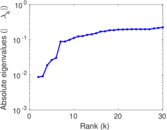
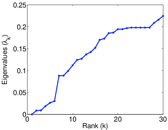
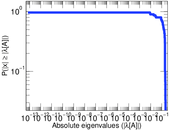
Plots


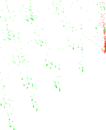


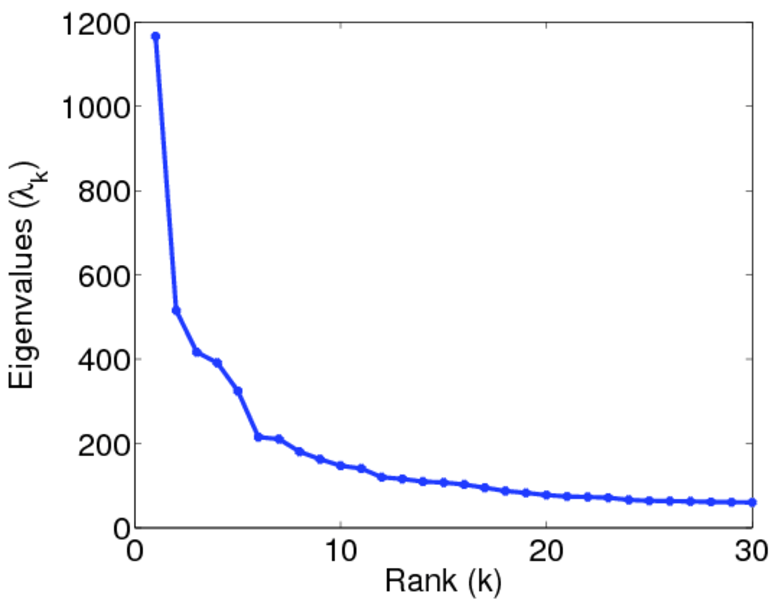
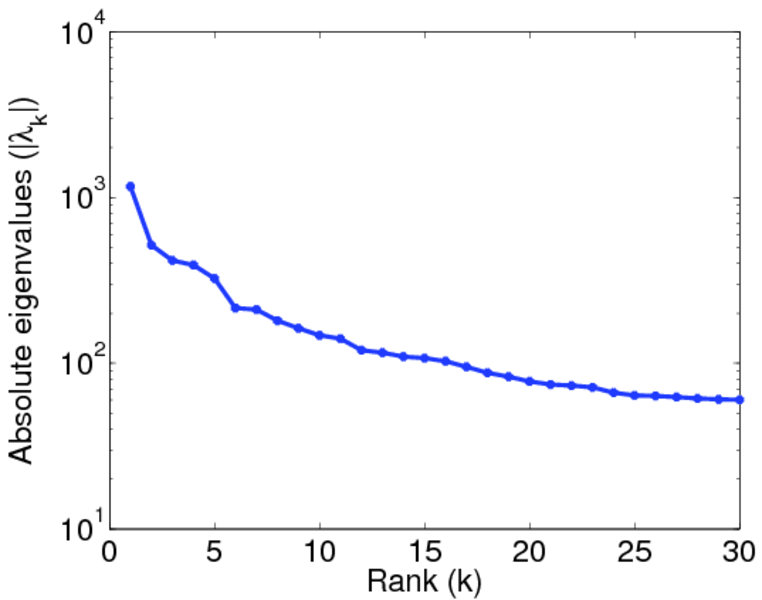
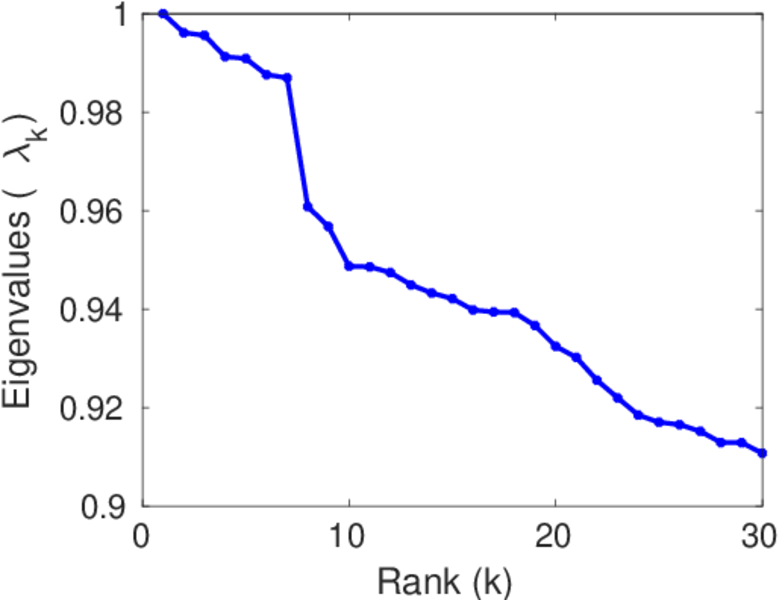
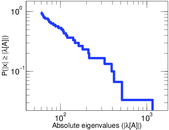
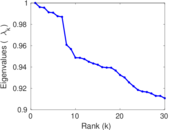
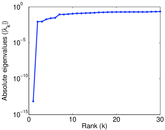
Matrix decompositions plots


Downloads
References
|
[1]
|
Jérôme Kunegis.
KONECT – The Koblenz Network Collection.
In Proc. Int. Conf. on World Wide Web Companion, pages
1343–1350, 2013.
[ http ]
|
|
[2]
|
Wikimedia Foundation.
Wikimedia downloads.
http://dumps.wikimedia.org/, January 2010.
|
 KONECT ‣ Networks ‣
Buy Me a Coffee
KONECT ‣ Networks ‣
Buy Me a Coffee