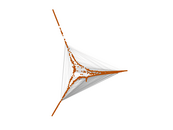
Wikipedia edits (mhr)
This is the bipartite edit network of the Eastern Mari Wikipedia. It contains
users and pages from the Eastern Mari Wikipedia, connected by edit events. Each
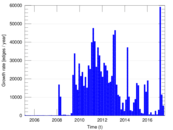
edge represents an edit. The dataset includes the timestamp of each edit.
Metadata
Statistics
| Size | n = | 22,981
|
| Left size | n1 = | 1,063
|
| Right size | n2 = | 21,918
|
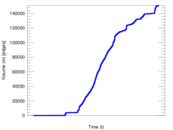
| Volume | m = | 151,128
|
| Unique edge count | m̿ = | 77,313
|
| Wedge count | s = | 98,478,272
|
| Claw count | z = | 147,728,270,524
|
| Cross count | x = | 210,274,779,452,058
|
| Square count | q = | 111,429,272
|
| 4-Tour count | T4 = | 1,285,594,534
|
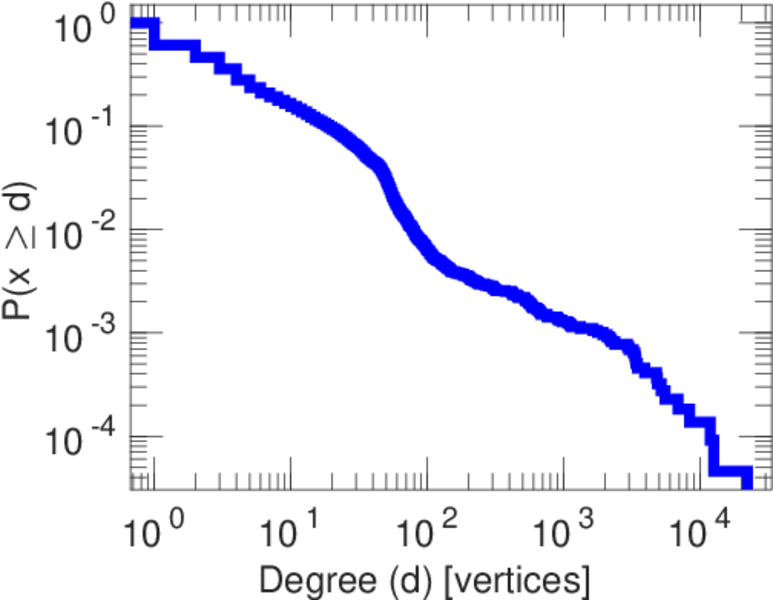
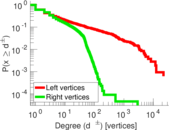
| Maximum degree | dmax = | 22,154
|
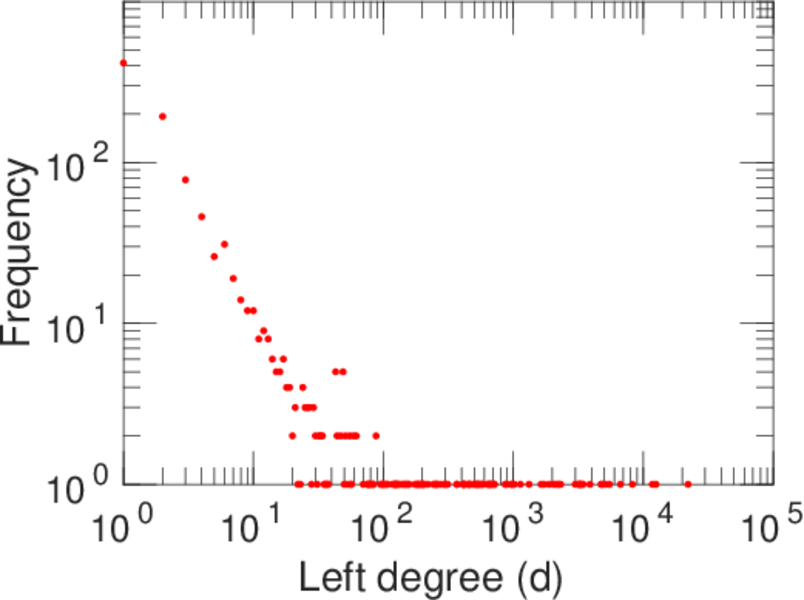
| Maximum left degree | d1max = | 22,154
|
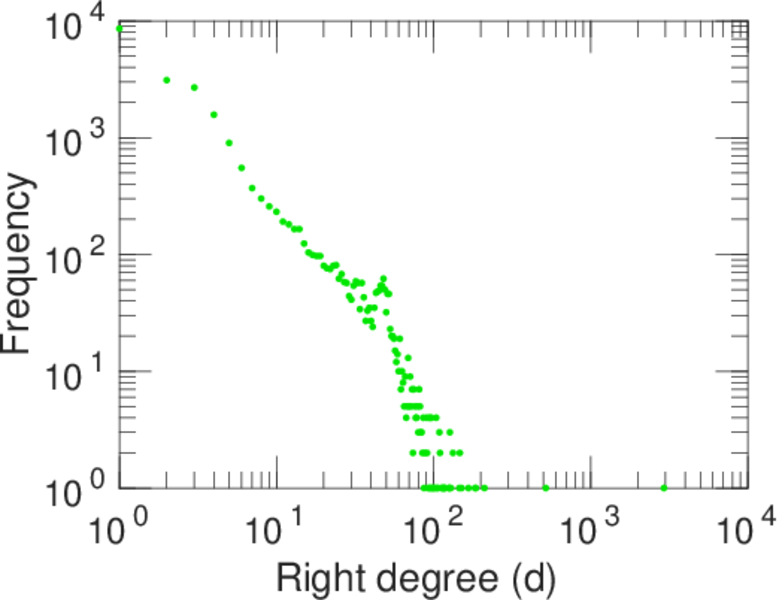
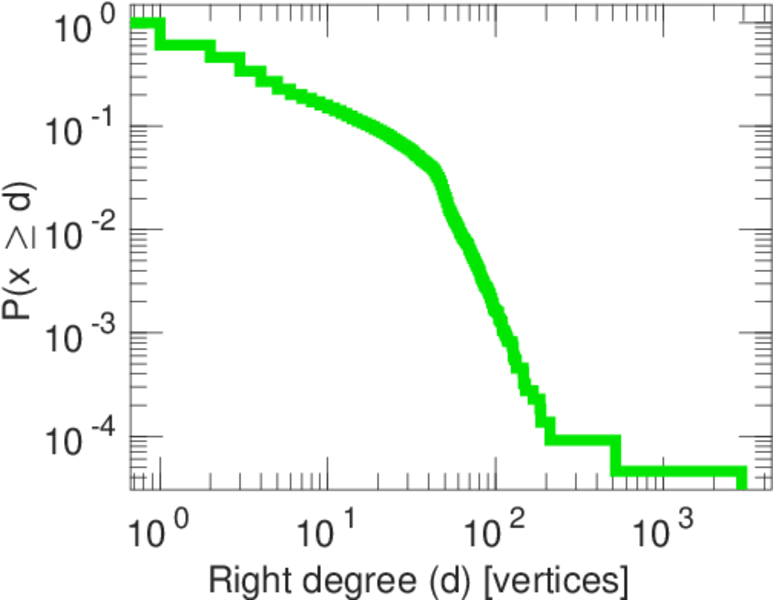
| Maximum right degree | d2max = | 2,932
|
| Average degree | d = | 13.152 4
|
| Average left degree | d1 = | 142.171
|
| Average right degree | d2 = | 6.895 15
|
| Fill | p = | 0.003 318 32
|
| Average edge multiplicity | m̃ = | 1.954 76
|
| Size of LCC | N = | 22,479
|
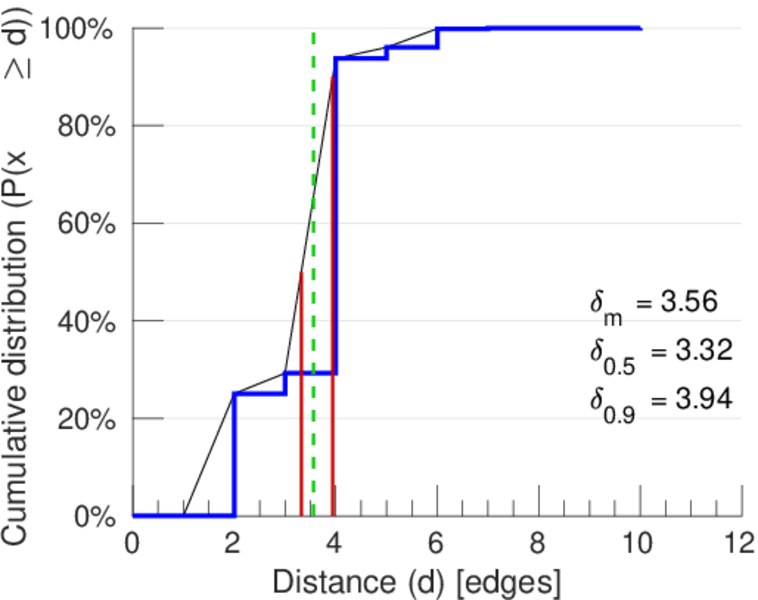
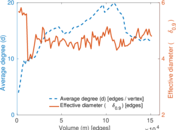
| Diameter | δ = | 12
|
| 50-Percentile effective diameter | δ0.5 = | 3.321 83
|
| 90-Percentile effective diameter | δ0.9 = | 3.942 06
|
| Median distance | δM = | 4
|
| Mean distance | δm = | 3.561 13
|
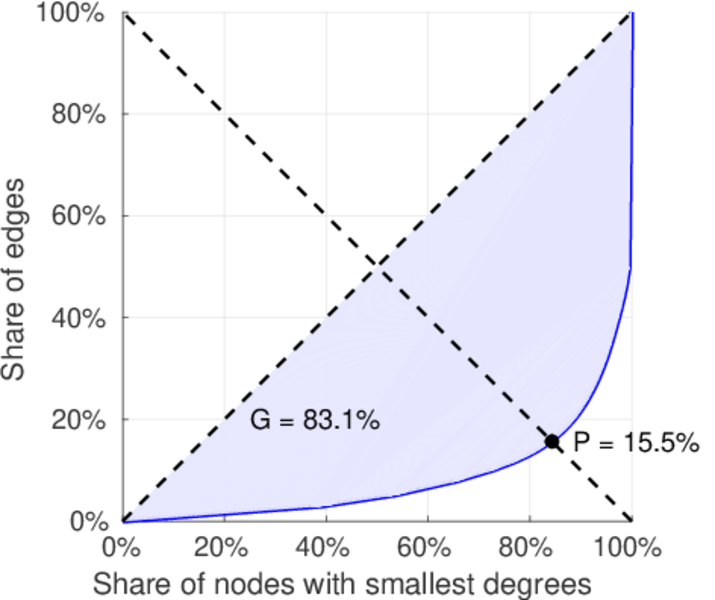
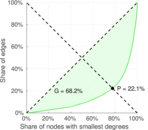
| Gini coefficient | G = | 0.836 238
|
| Balanced inequality ratio | P = | 0.154 760
|
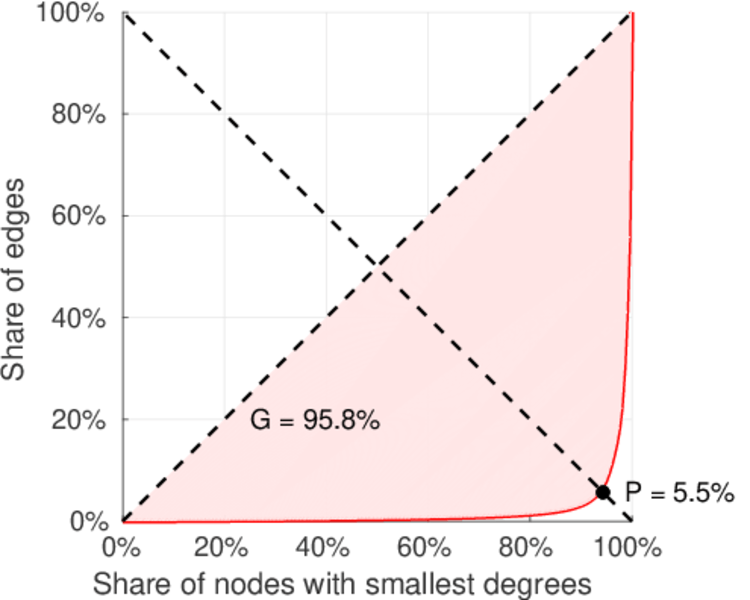
| Left balanced inequality ratio | P1 = | 0.055 204 9
|
| Right balanced inequality ratio | P2 = | 0.221 475
|
| Relative edge distribution entropy | Her = | 0.733 649
|
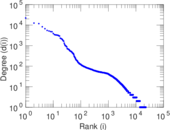
| Power law exponent | γ = | 2.490 32
|
| Tail power law exponent | γt = | 1.901 00
|
| Tail power law exponent with p | γ3 = | 1.901 00
|
| p-value | p = | 0.000 00
|
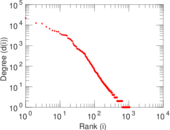
| Left tail power law exponent with p | γ3,1 = | 1.481 00
|
| Left p-value | p1 = | 0.000 00
|
| Right tail power law exponent with p | γ3,2 = | 8.551 00
|
| Right p-value | p2 = | 0.538 000
|
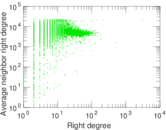
| Degree assortativity | ρ = | −0.432 199
|
| Degree assortativity p-value | pρ = | 0.000 00
|
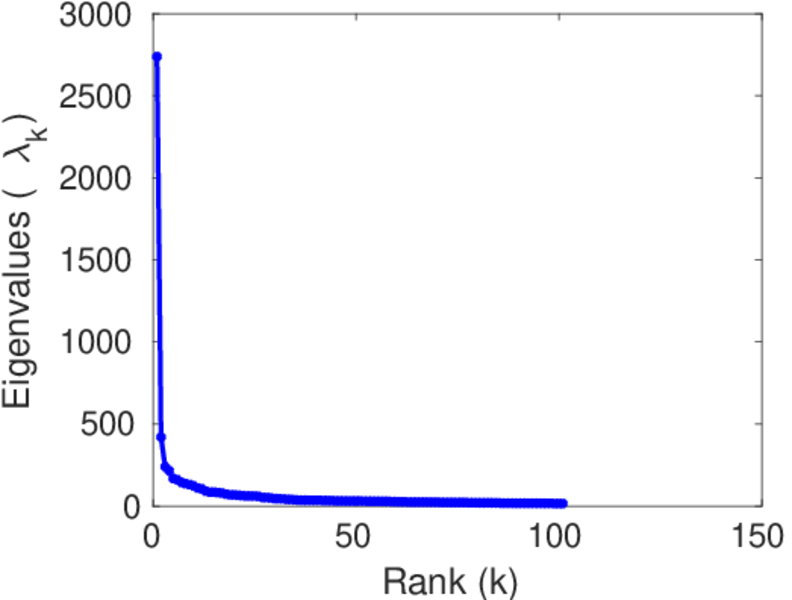
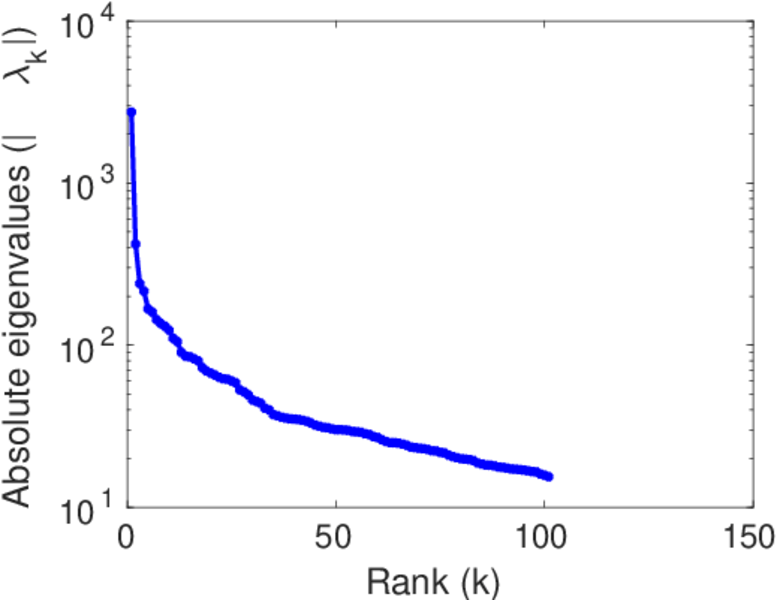
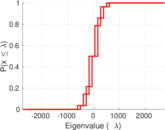
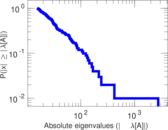
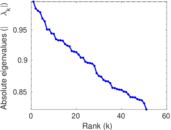
| Spectral norm | α = | 2,738.42
|
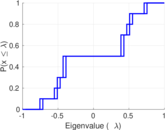
| Algebraic connectivity | a = | 0.024 921 8
|
| Spectral separation | |λ1[A] / λ2[A]| = | 6.514 03
|
| Controllability | C = | 21,004
|
| Relative controllability | Cr = | 0.917 045
|
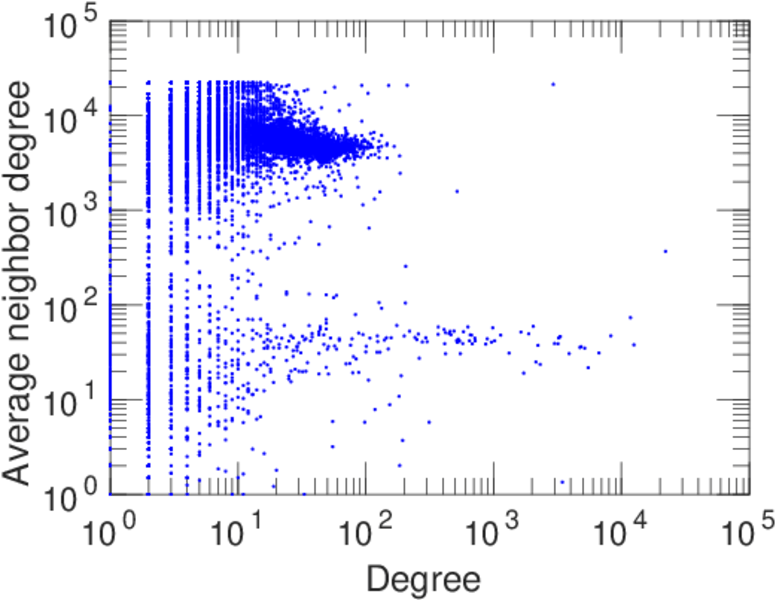
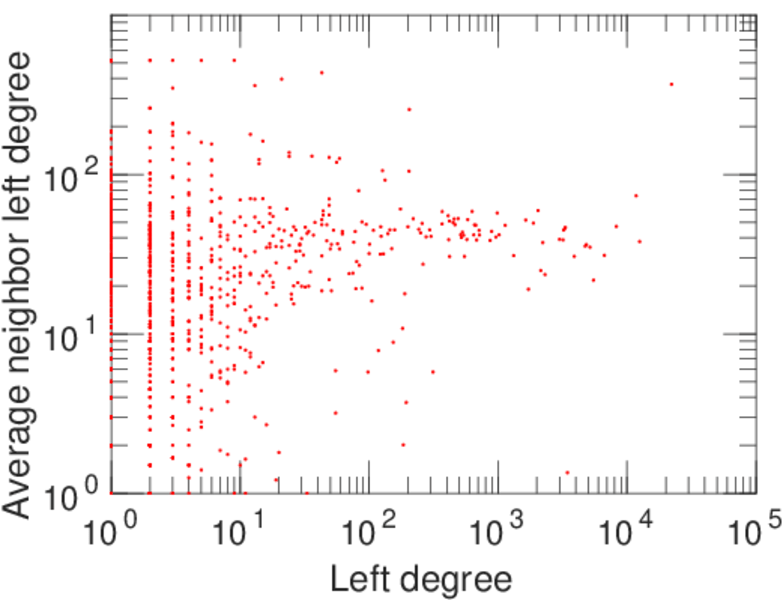
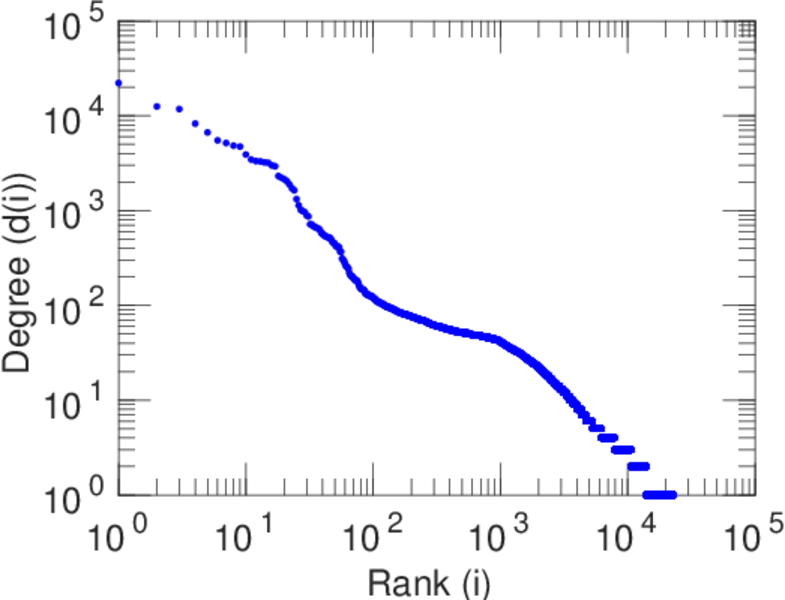
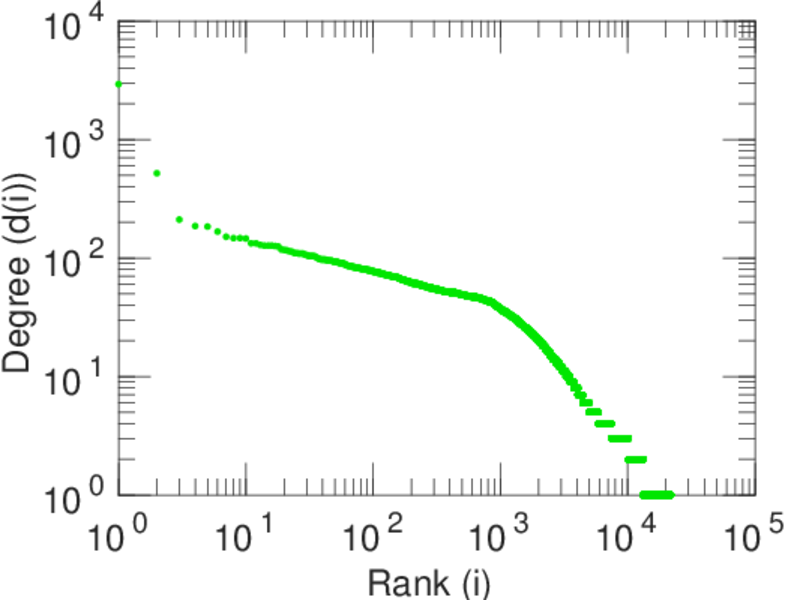
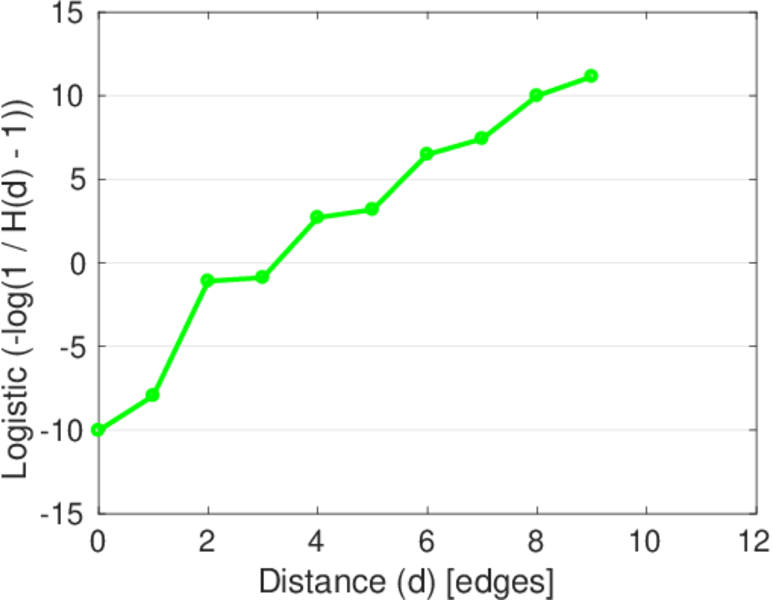
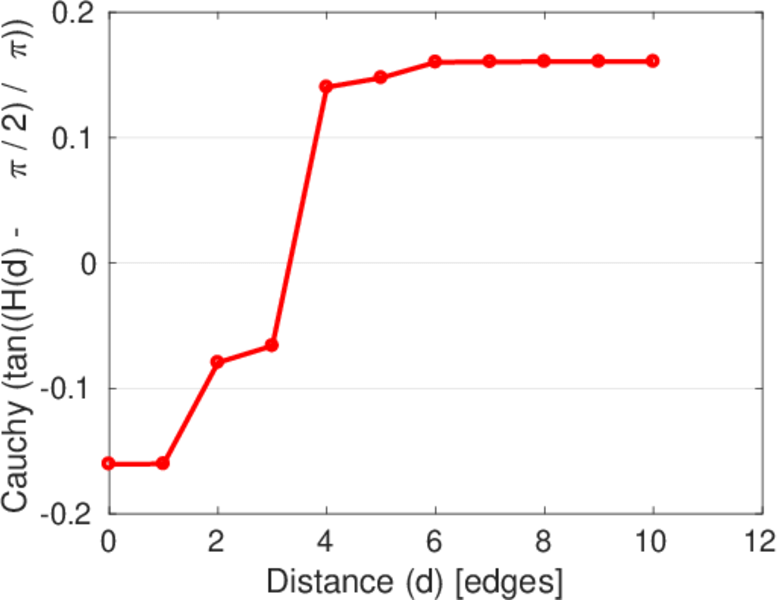
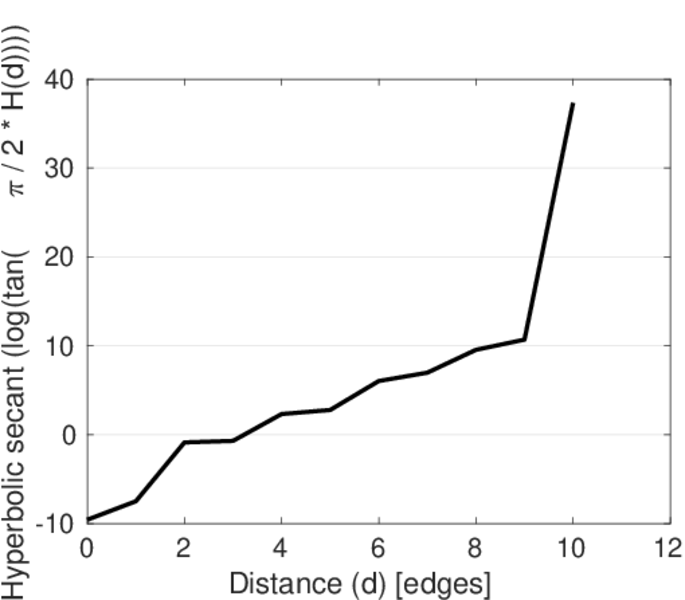
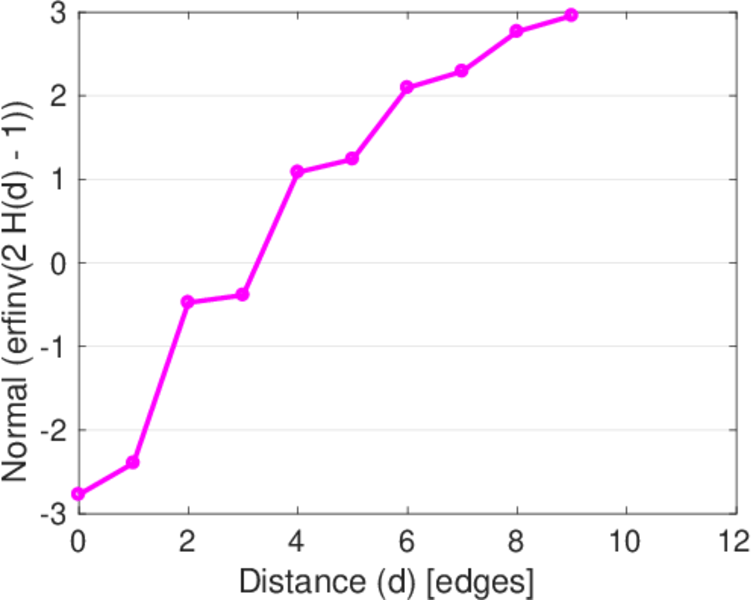
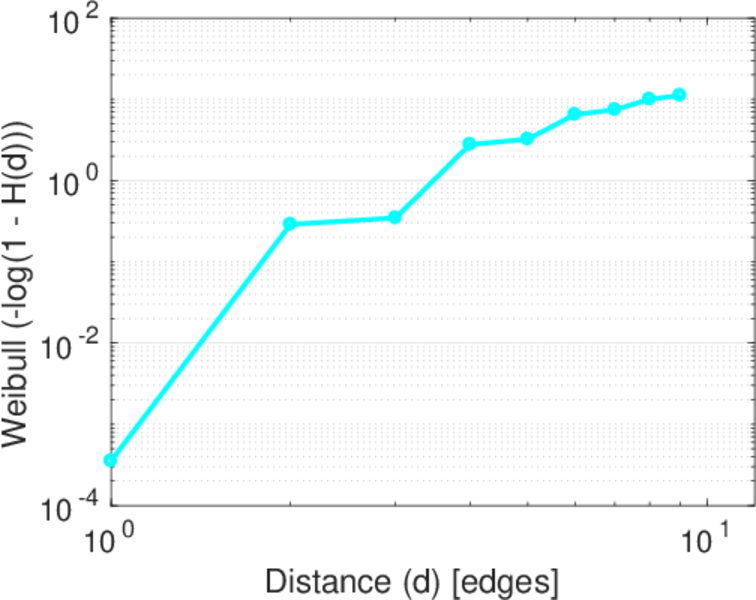
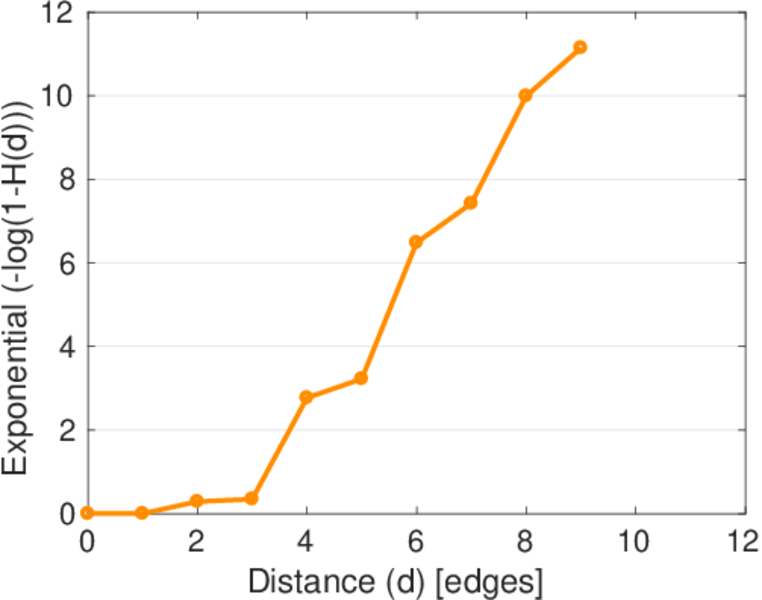
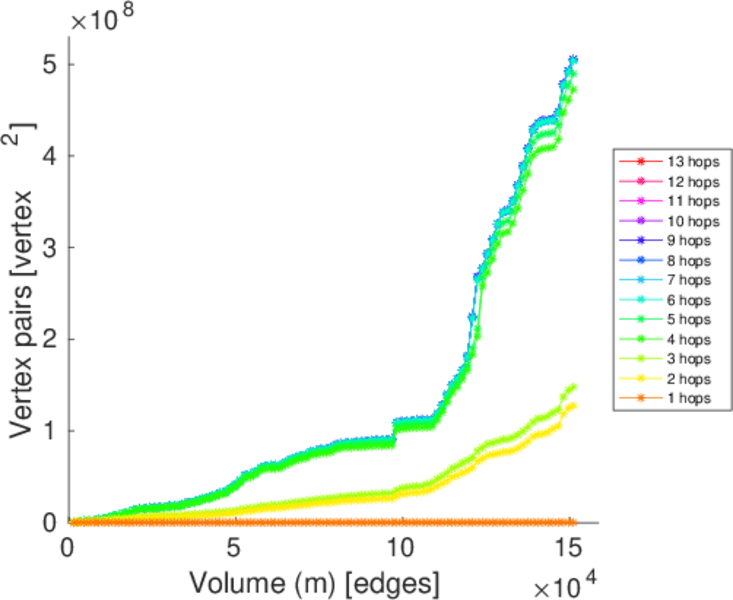
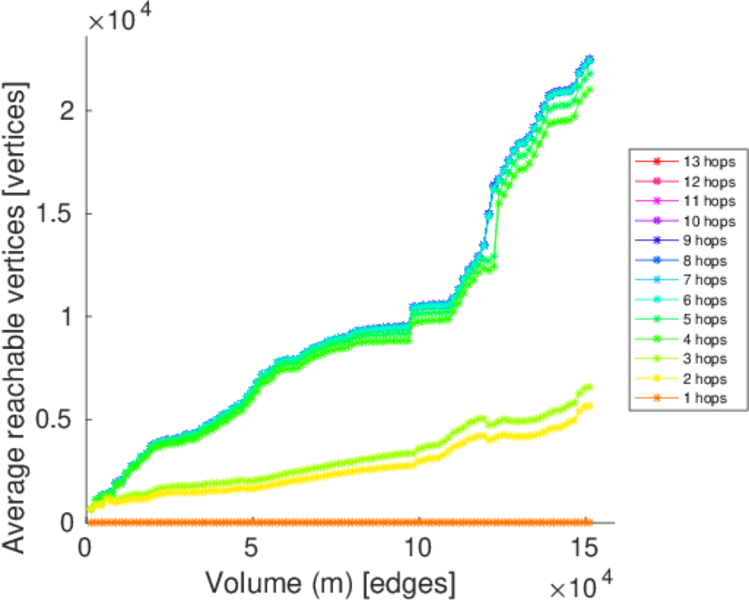
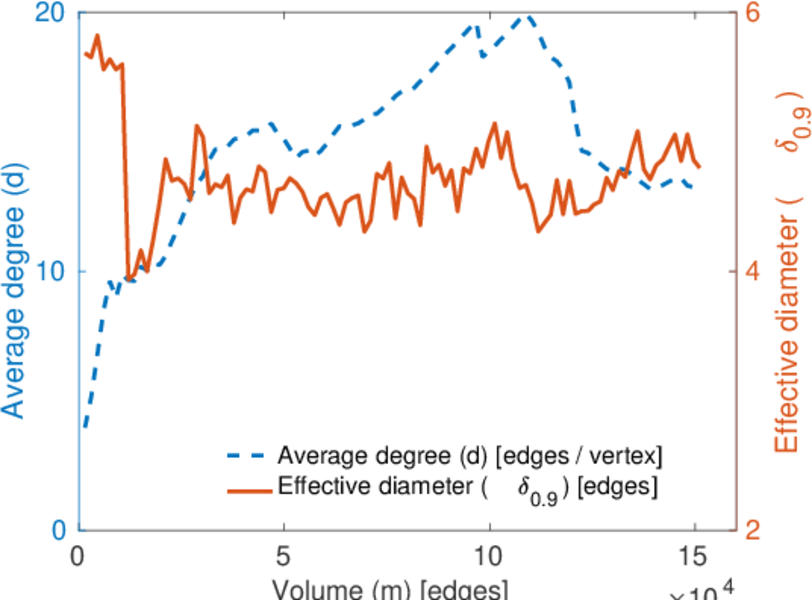
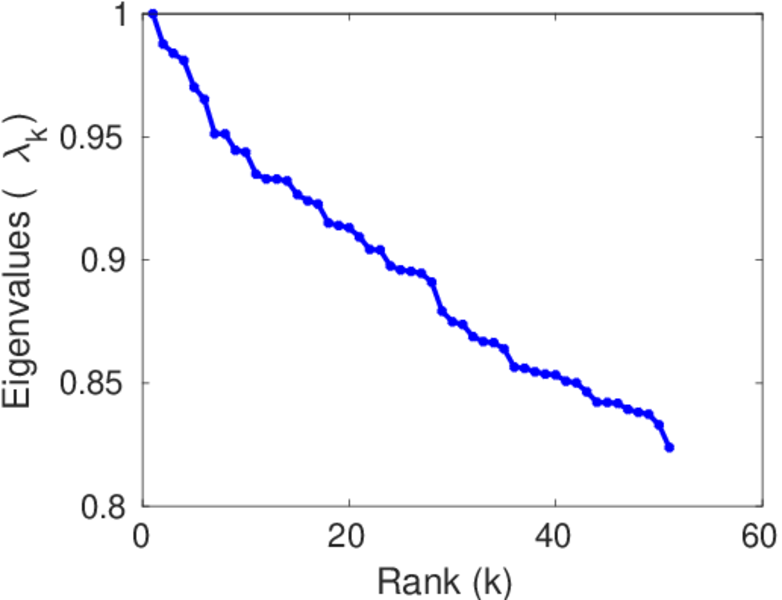
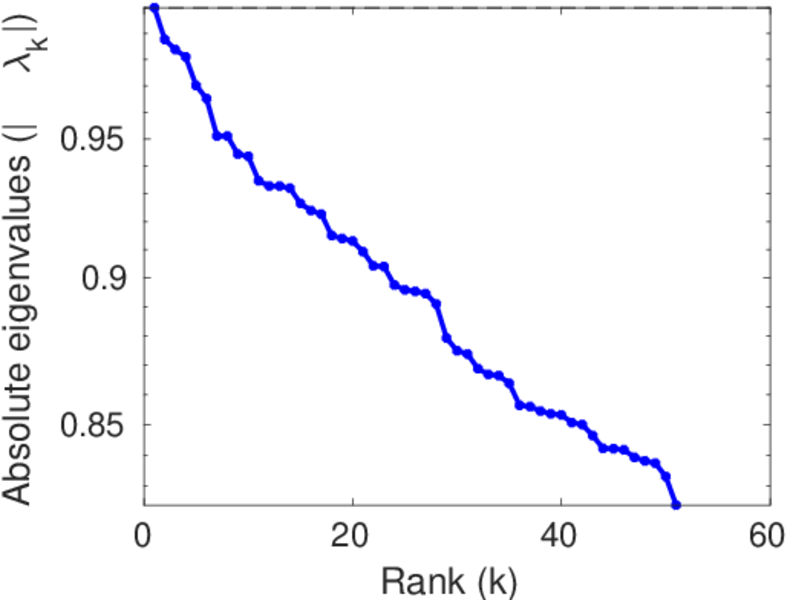
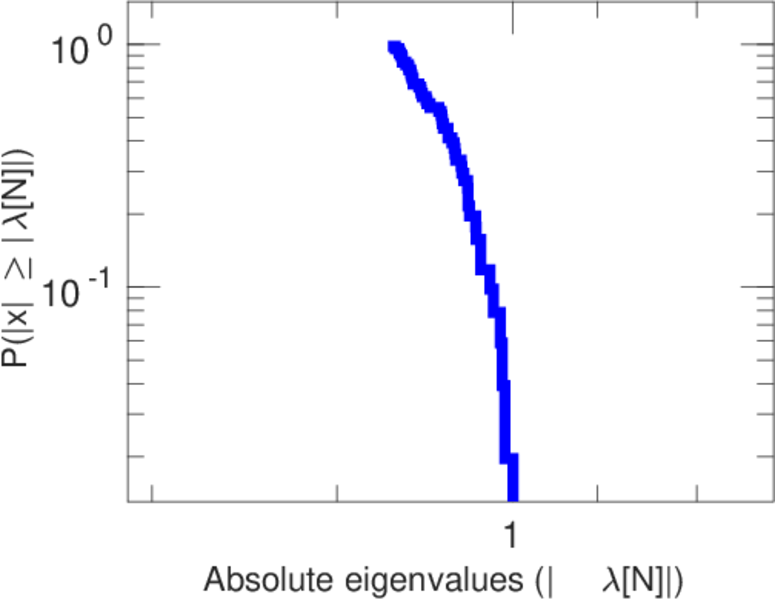
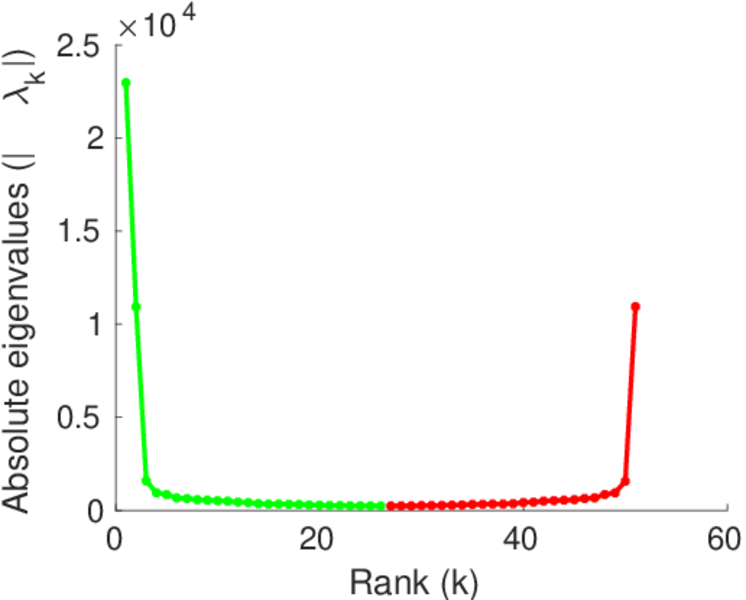
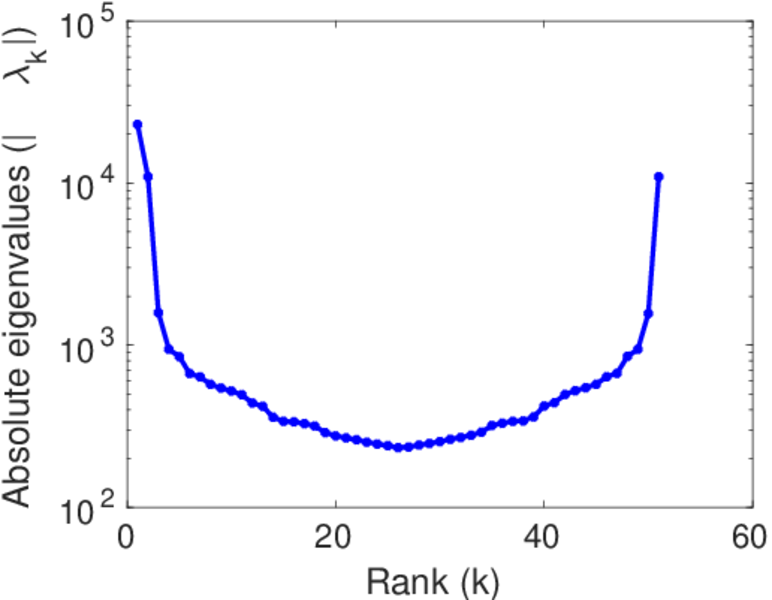
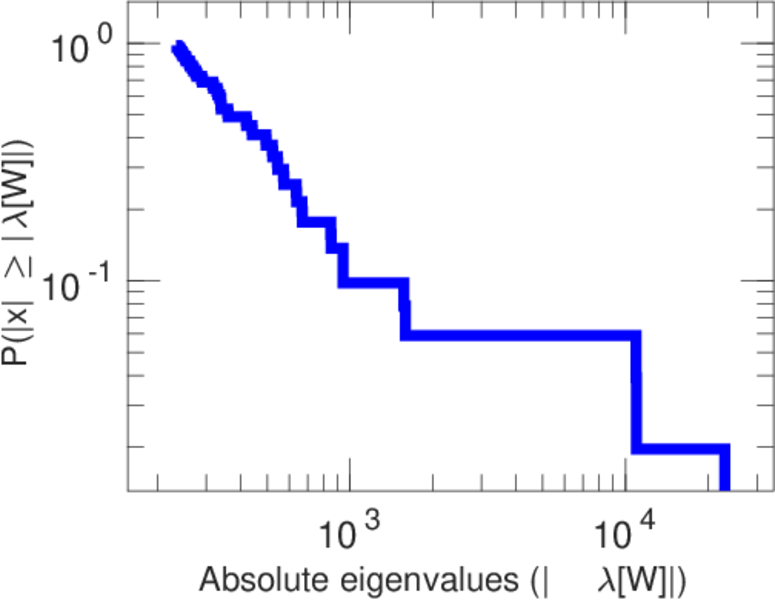
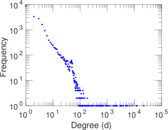
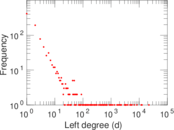
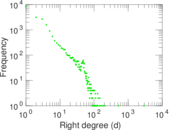
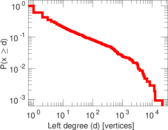
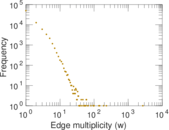
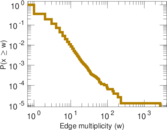
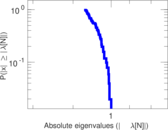
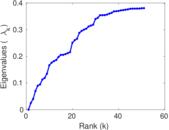
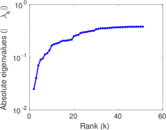
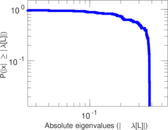
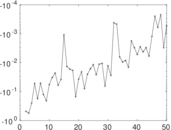
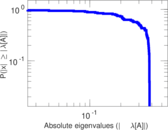
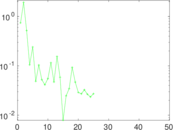
Plots


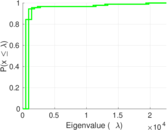
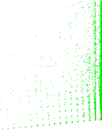
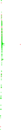
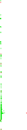


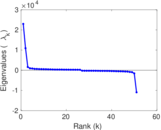
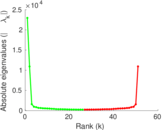
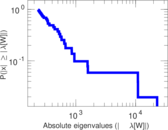
Matrix decompositions plots


Downloads
References
|
[1]
|
Jérôme Kunegis.
KONECT – The Koblenz Network Collection.
In Proc. Int. Conf. on World Wide Web Companion, pages
1343–1350, 2013.
[ http ]
|
|
[2]
|
Wikimedia Foundation.
Wikimedia downloads.
http://dumps.wikimedia.org/, January 2010.
|
 KONECT ‣ Networks ‣
Buy Me a Coffee
KONECT ‣ Networks ‣
Buy Me a Coffee