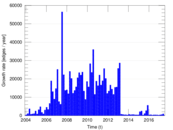
Wikipedia edits (mi)
This is the bipartite edit network of the Maori Wikipedia. It contains users
and pages from the Maori Wikipedia, connected by edit events. Each edge
represents an edit. The dataset includes the timestamp of each edit.
Metadata
Statistics
| Size | n = | 13,743
|
| Left size | n1 = | 1,041
|
| Right size | n2 = | 12,702
|
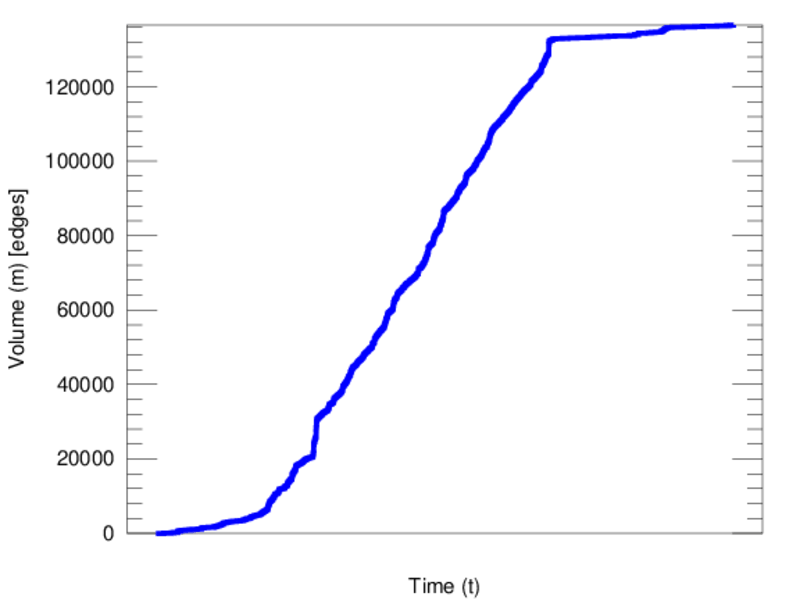
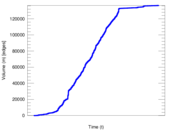
| Volume | m = | 136,602
|
| Unique edge count | m̿ = | 60,346
|
| Wedge count | s = | 54,978,210
|
| Claw count | z = | 58,478,700,298
|
| Cross count | x = | 60,567,473,013,521
|
| Square count | q = | 151,424,773
|
| 4-Tour count | T4 = | 1,431,451,712
|
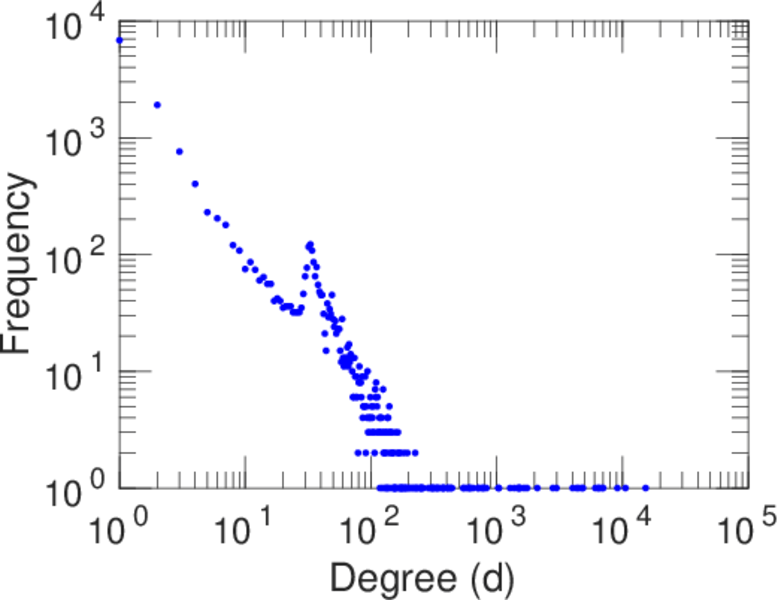
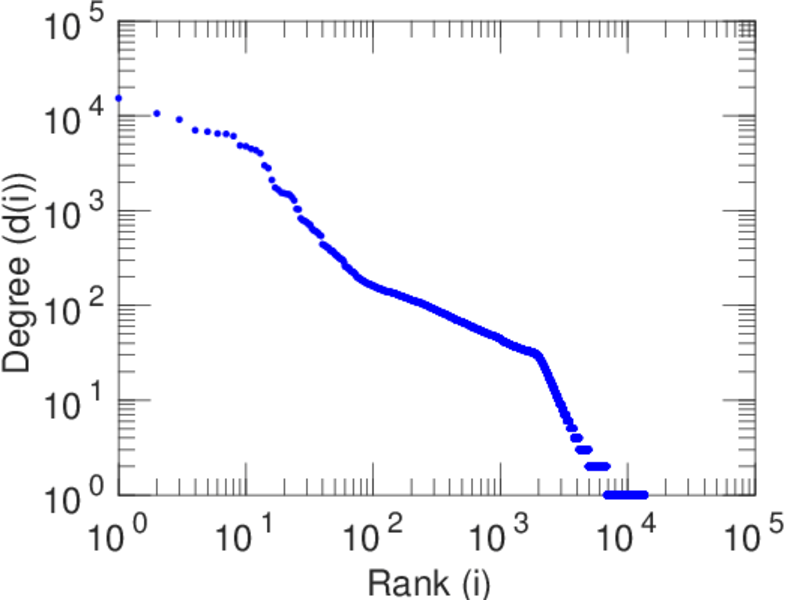
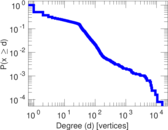
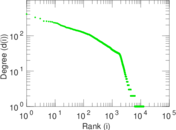
| Maximum degree | dmax = | 15,318
|
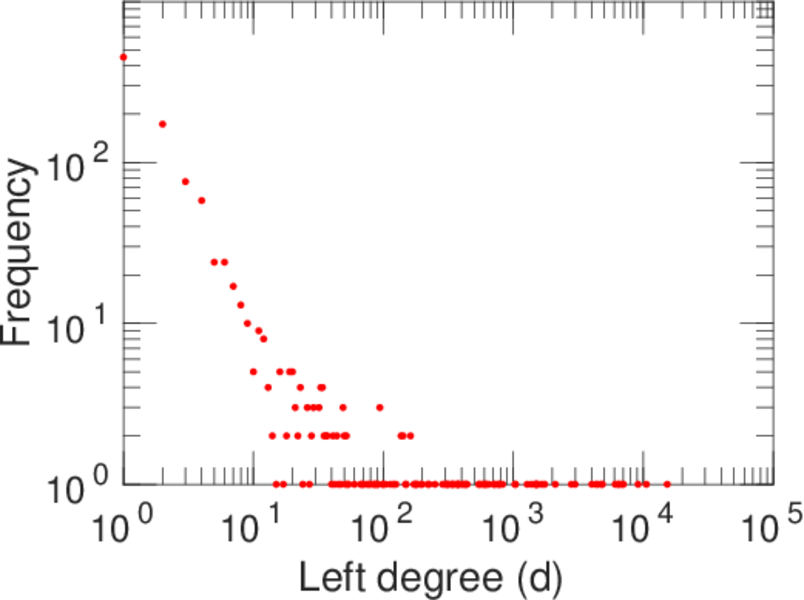
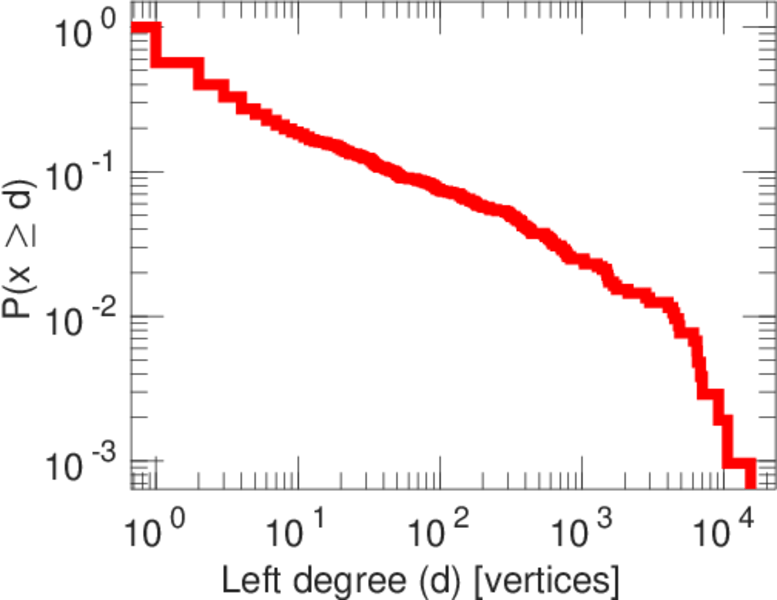
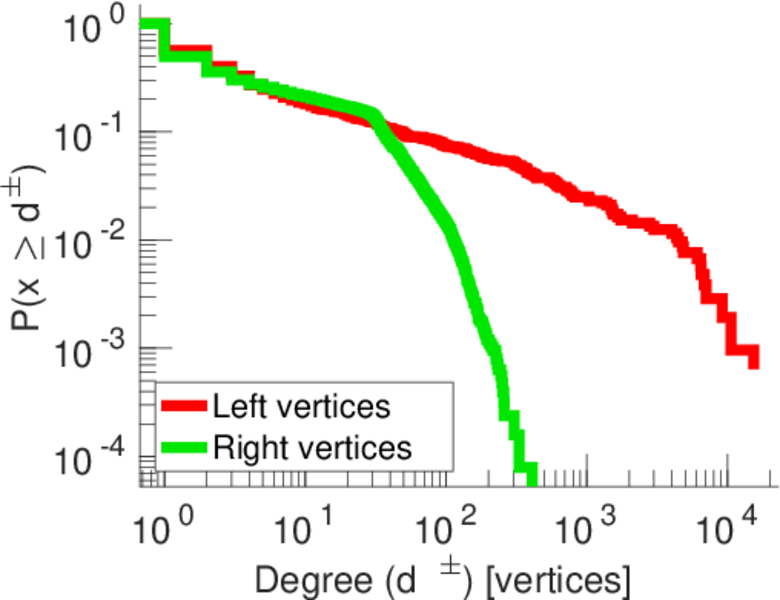
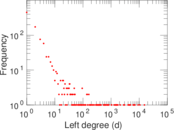
| Maximum left degree | d1max = | 15,318
|
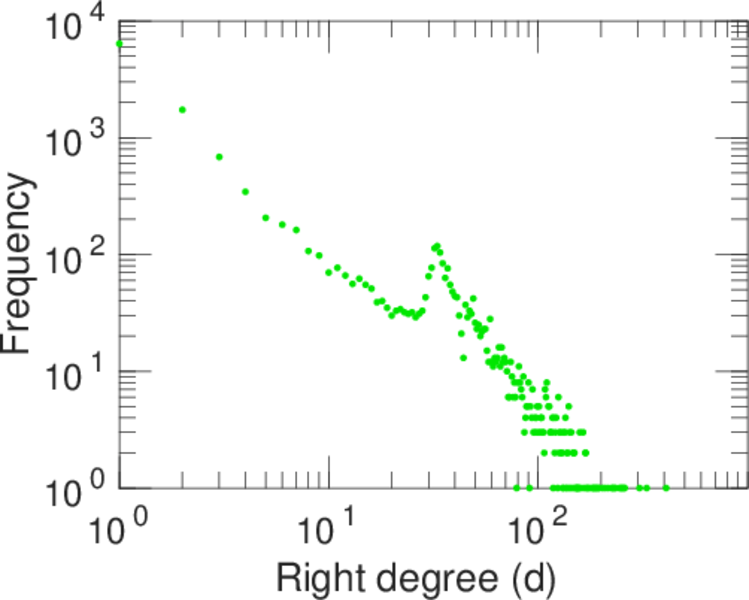
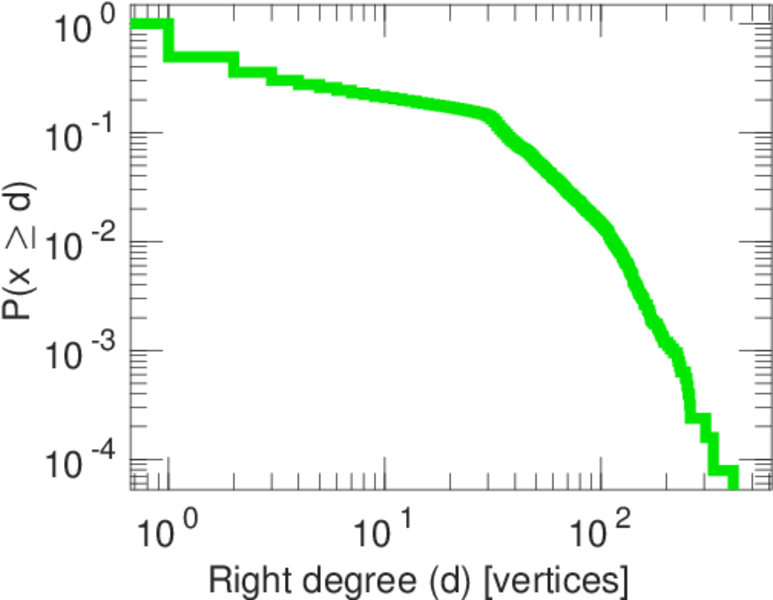
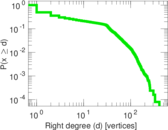
| Maximum right degree | d2max = | 409
|
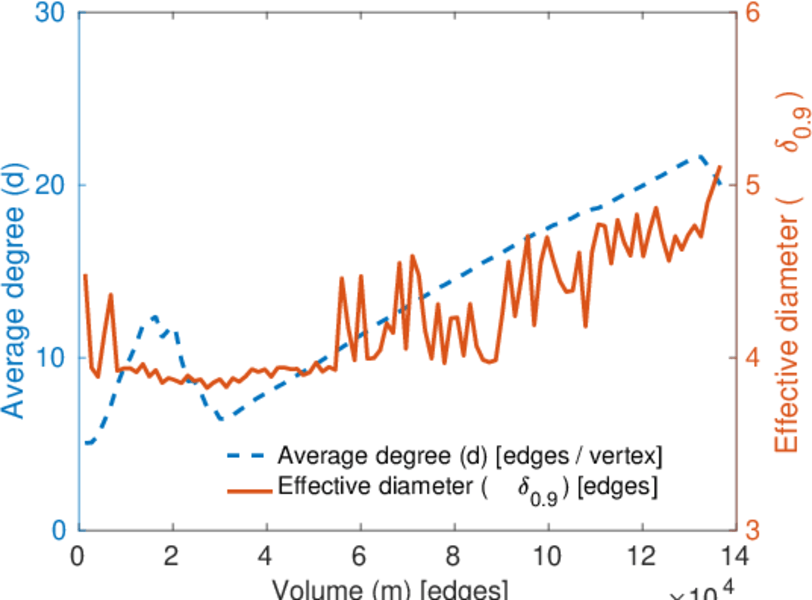
| Average degree | d = | 19.879 5
|
| Average left degree | d1 = | 131.222
|
| Average right degree | d2 = | 10.754 4
|
| Fill | p = | 0.004 563 79
|
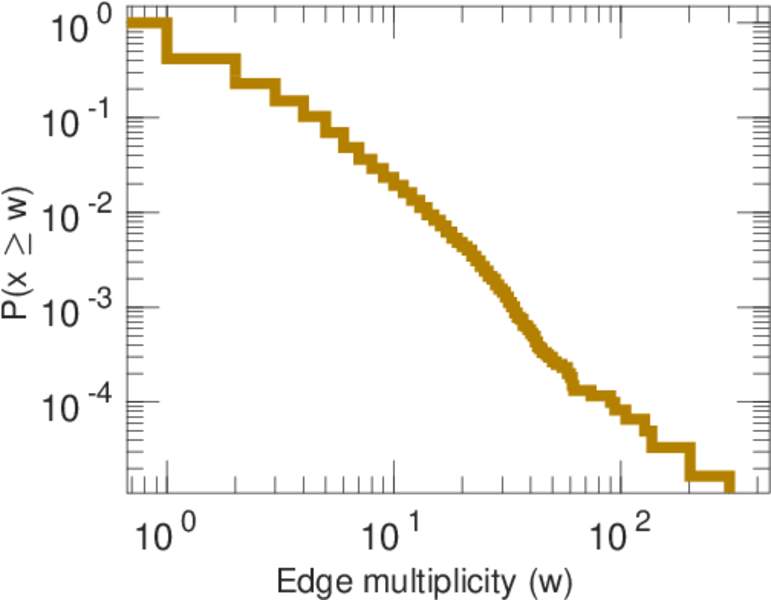
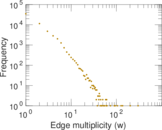
| Average edge multiplicity | m̃ = | 2.263 65
|
| Size of LCC | N = | 13,086
|
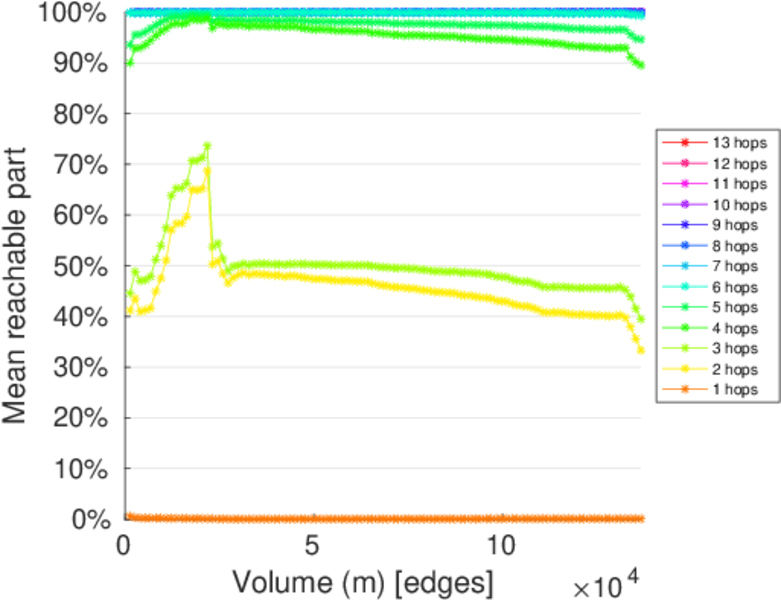
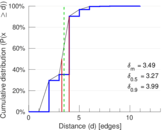
| Diameter | δ = | 13
|
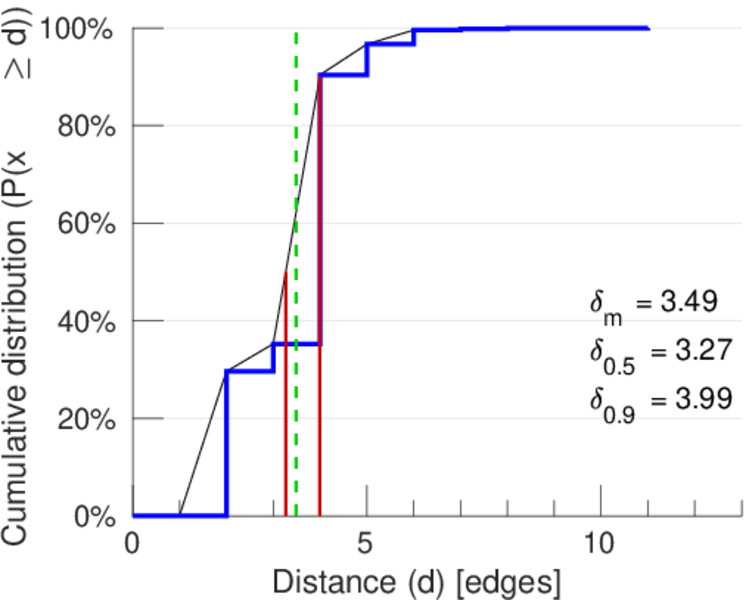
| 50-Percentile effective diameter | δ0.5 = | 3.267 37
|
| 90-Percentile effective diameter | δ0.9 = | 3.992 87
|
| Median distance | δM = | 4
|
| Mean distance | δm = | 3.486 48
|
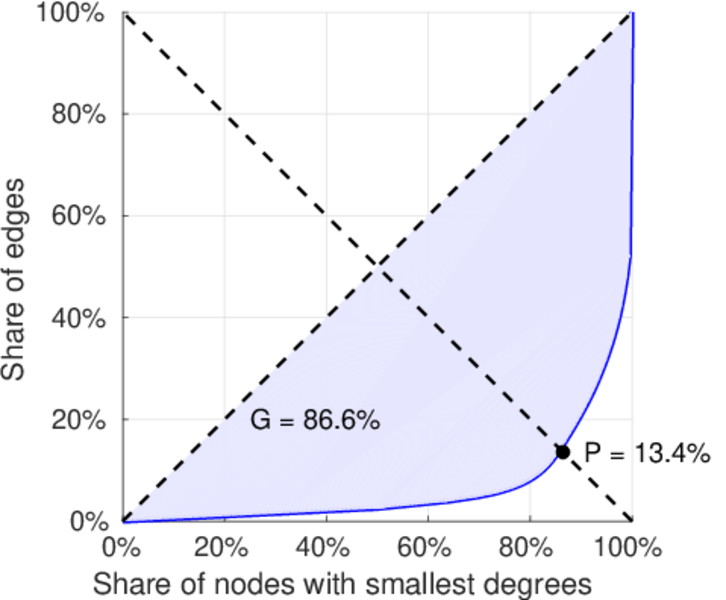
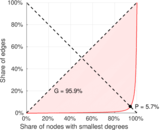
| Gini coefficient | G = | 0.865 569
|
| Balanced inequality ratio | P = | 0.144 668
|
| Left balanced inequality ratio | P1 = | 0.057 180 7
|
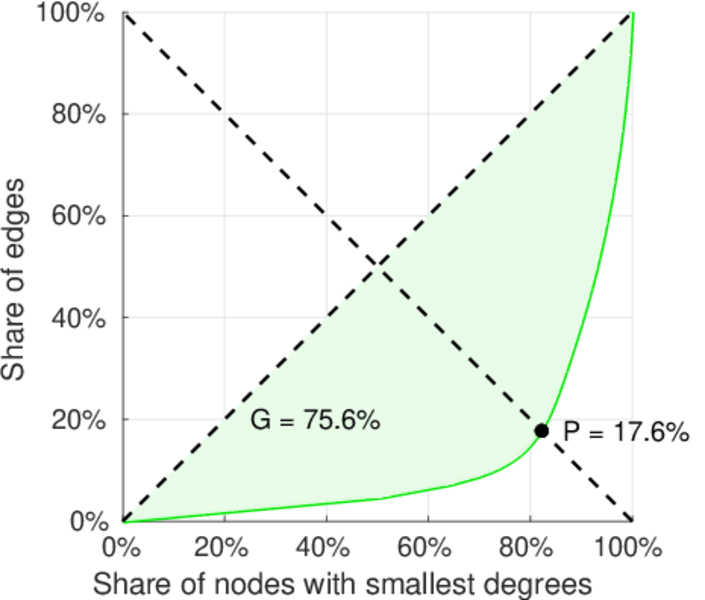
| Right balanced inequality ratio | P2 = | 0.176 059
|
| Relative edge distribution entropy | Her = | 0.741 807
|
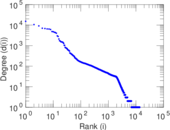
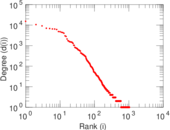
| Power law exponent | γ = | 2.331 81
|
| Tail power law exponent | γt = | 1.831 00
|
| Tail power law exponent with p | γ3 = | 1.831 00
|
| p-value | p = | 0.000 00
|
| Left tail power law exponent with p | γ3,1 = | 1.481 00
|
| Left p-value | p1 = | 0.001 000 00
|
| Right tail power law exponent with p | γ3,2 = | 5.291 00
|
| Right p-value | p2 = | 0.002 000 00
|
| Degree assortativity | ρ = | −0.404 662
|
| Degree assortativity p-value | pρ = | 0.000 00
|
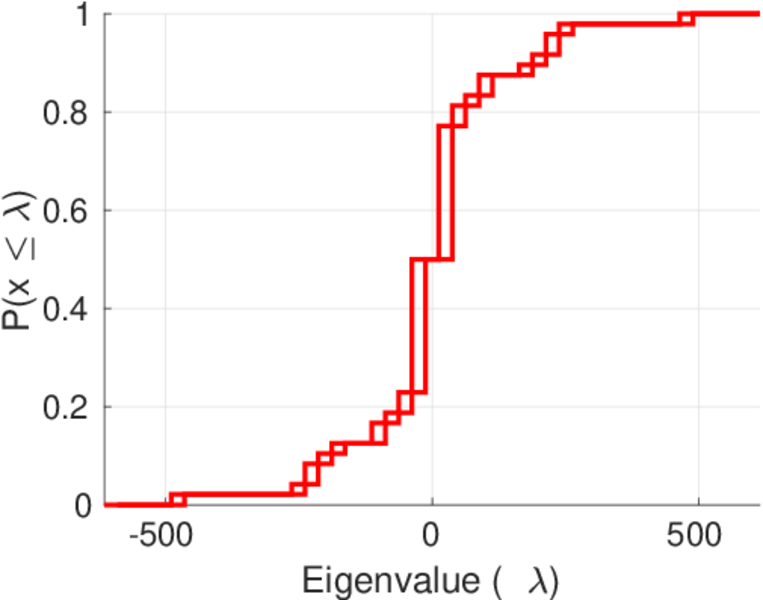
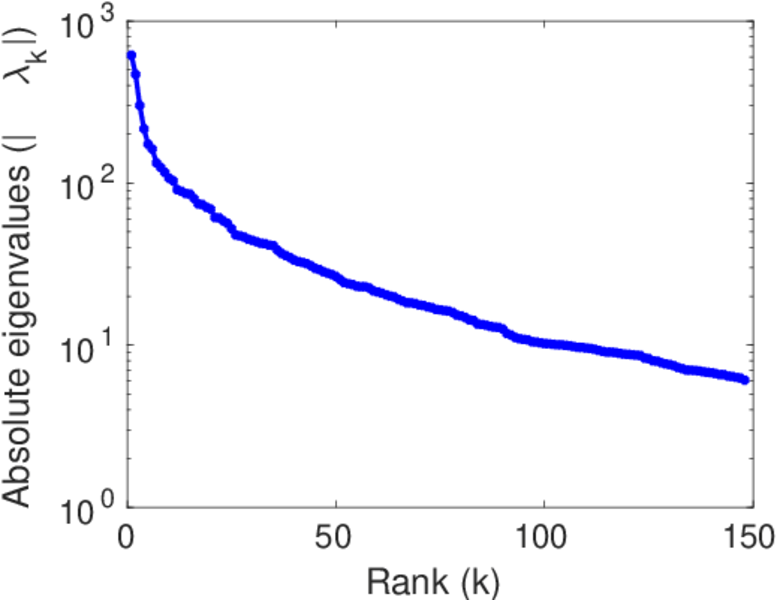
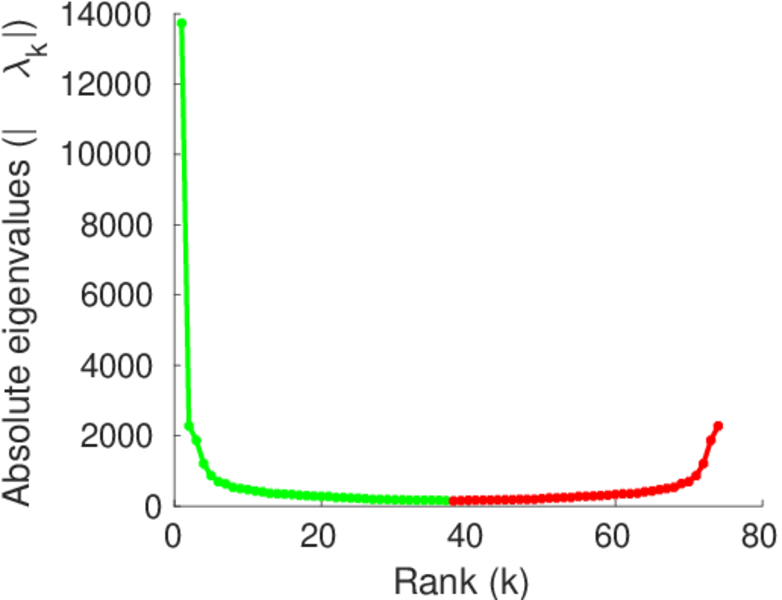
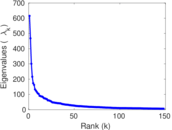
| Spectral norm | α = | 615.219
|
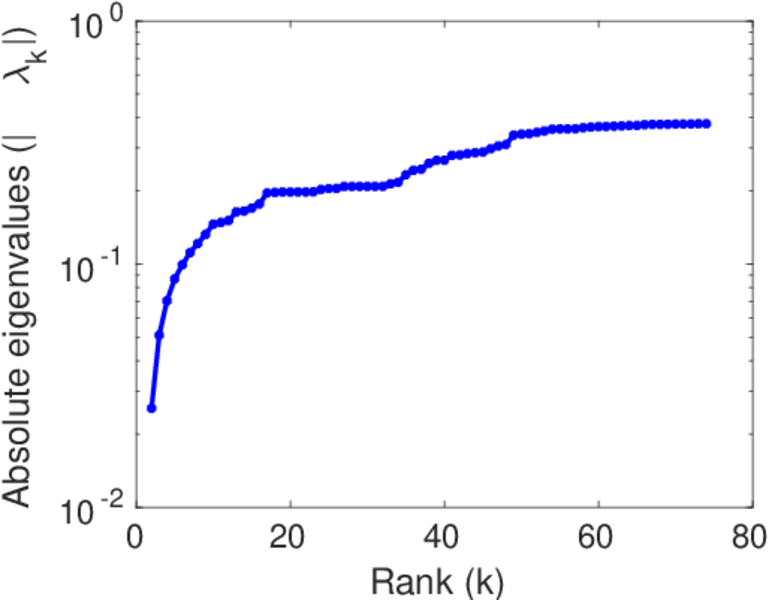
| Algebraic connectivity | a = | 0.025 537 6
|
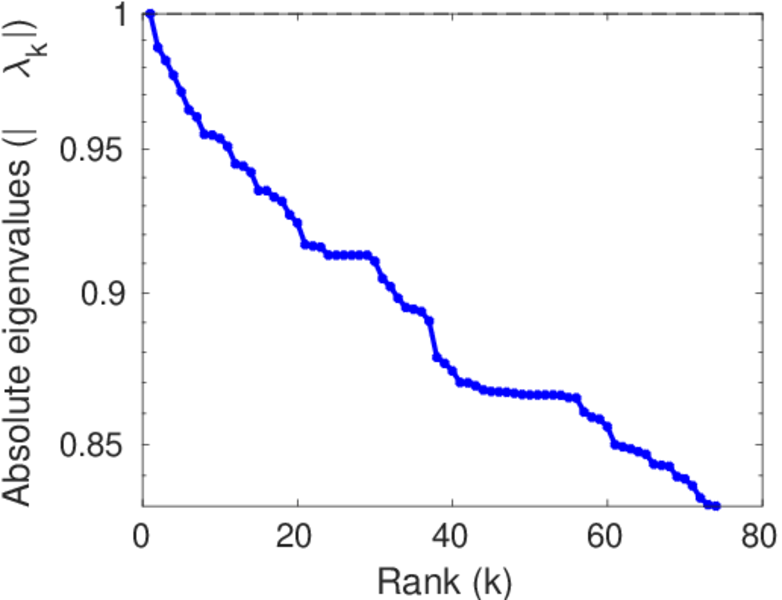
| Spectral separation | |λ1[A] / λ2[A]| = | 1.314 73
|
| Controllability | C = | 11,763
|
| Relative controllability | Cr = | 0.861 569
|
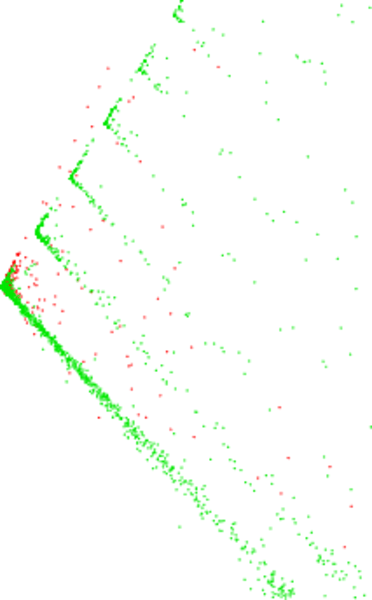
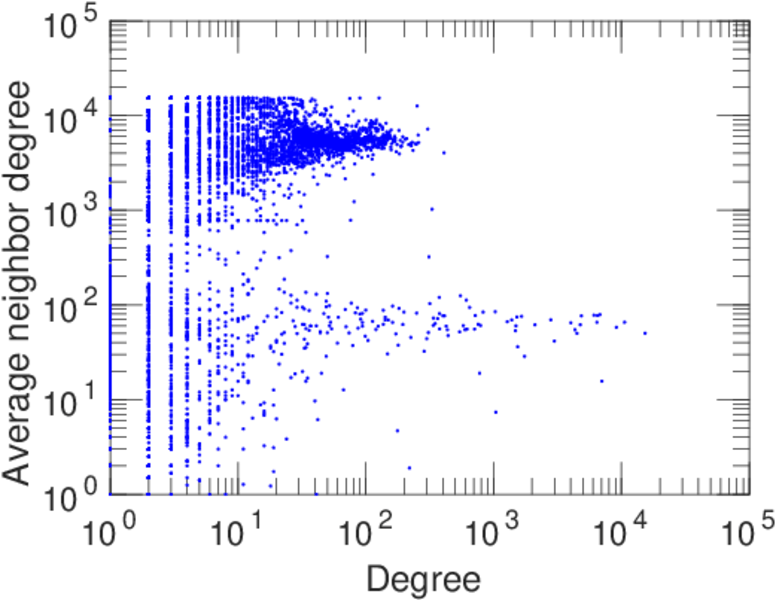
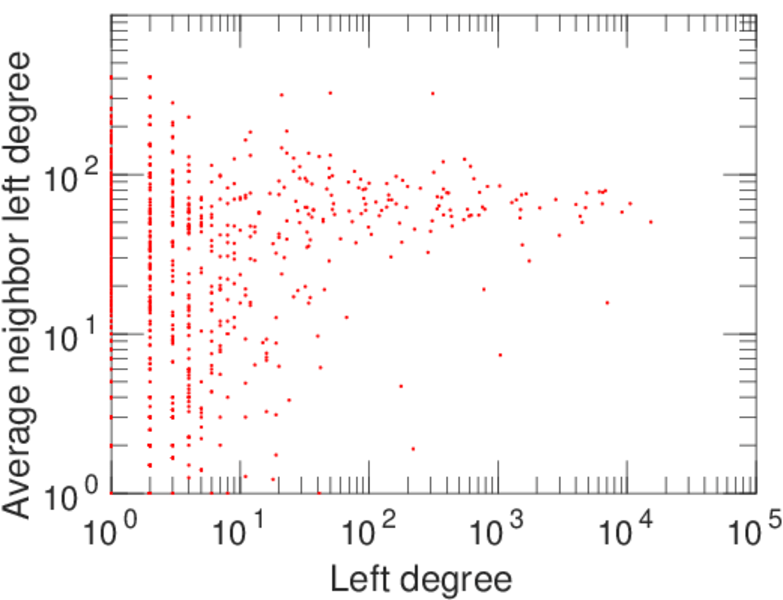
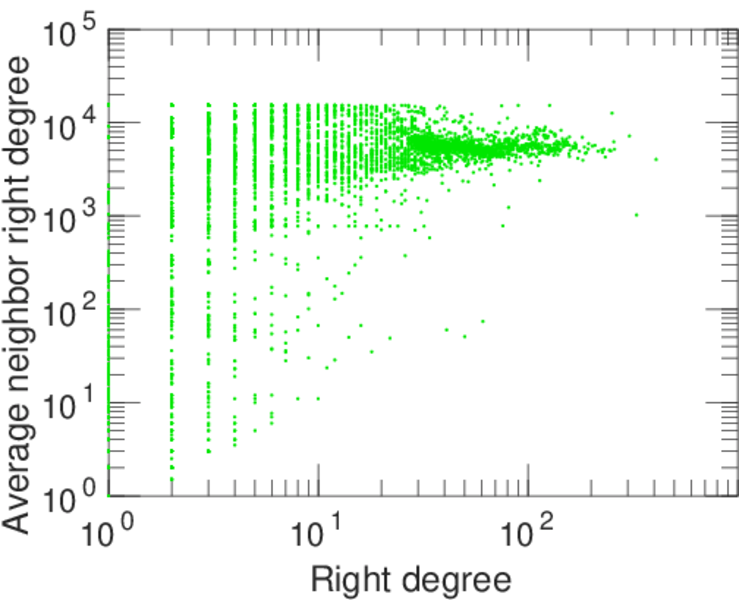
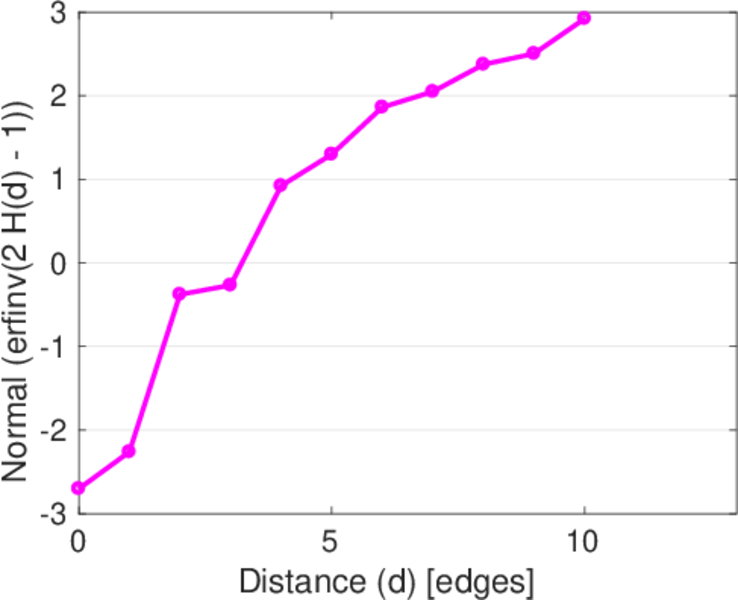
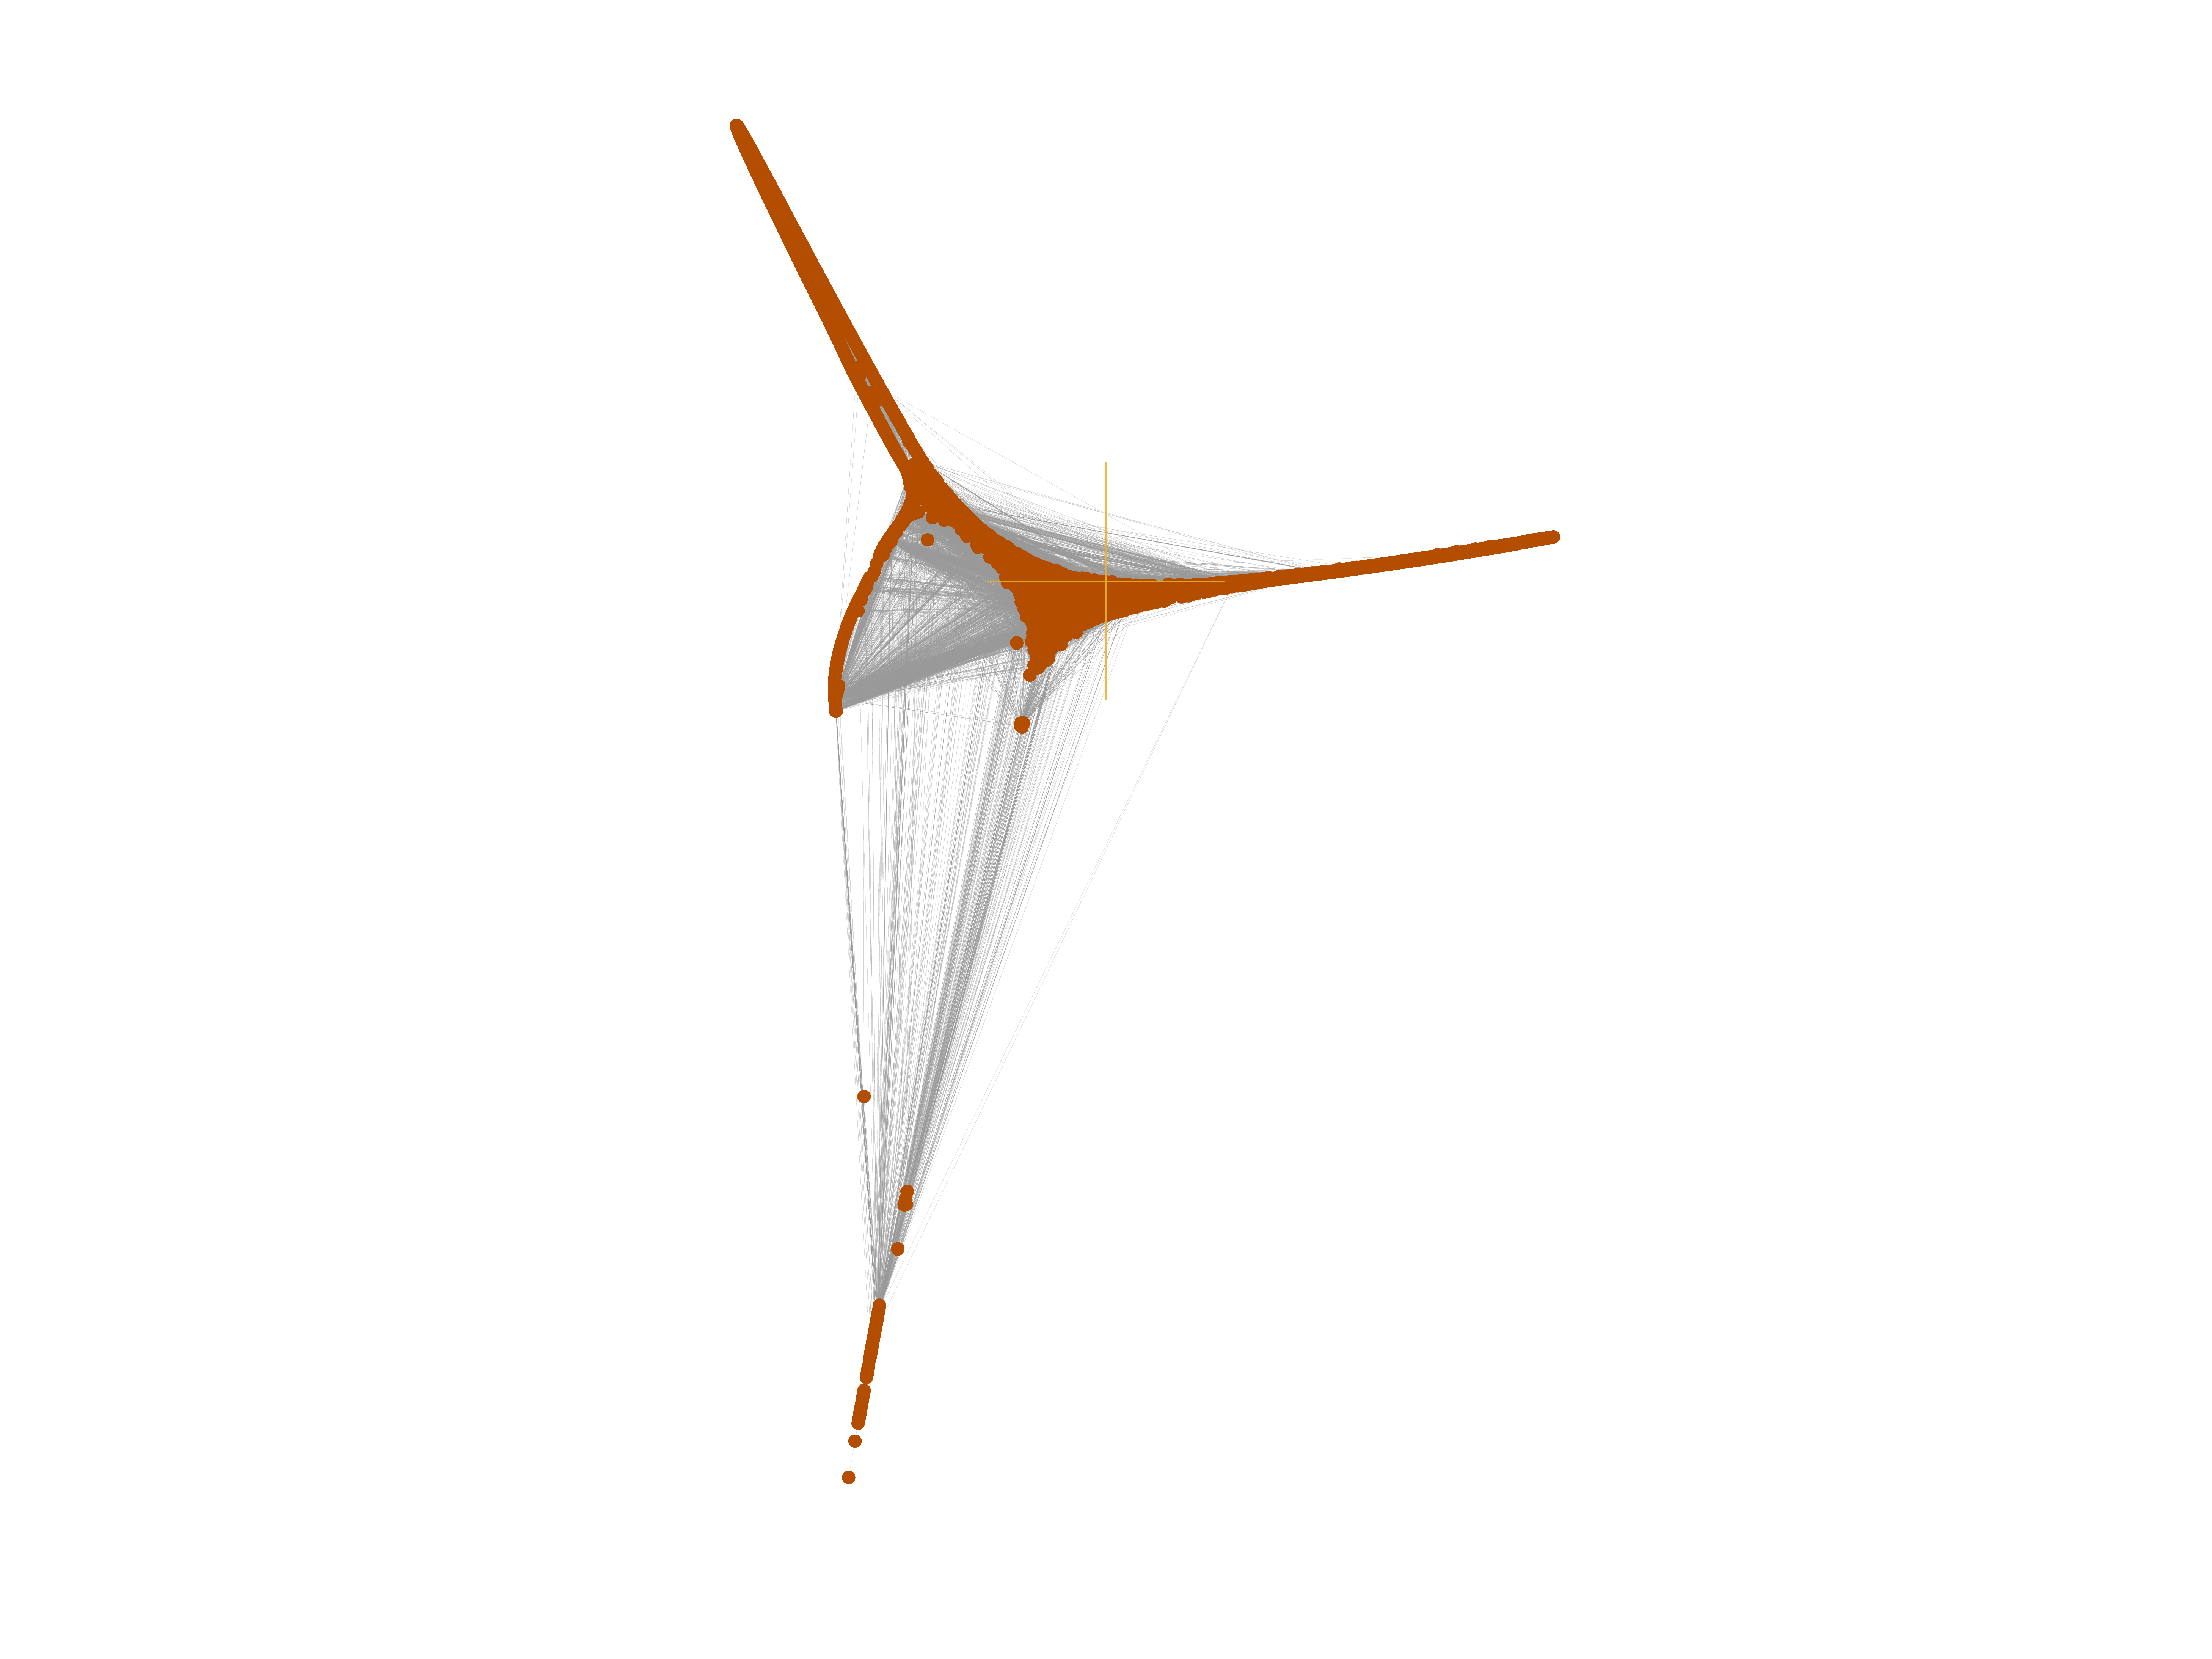
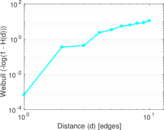
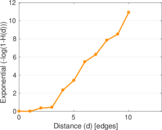
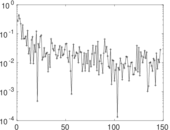
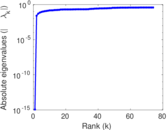
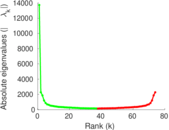
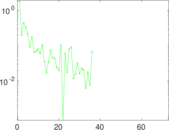
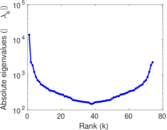
Plots


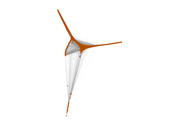


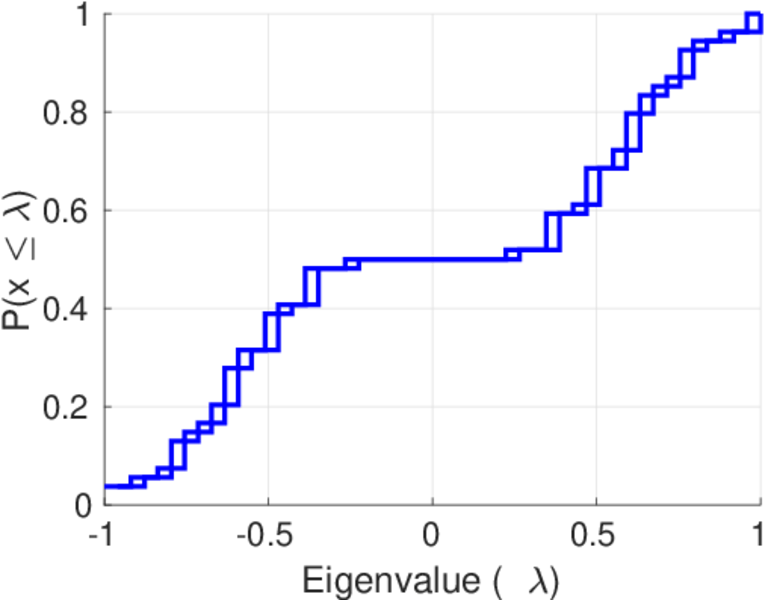
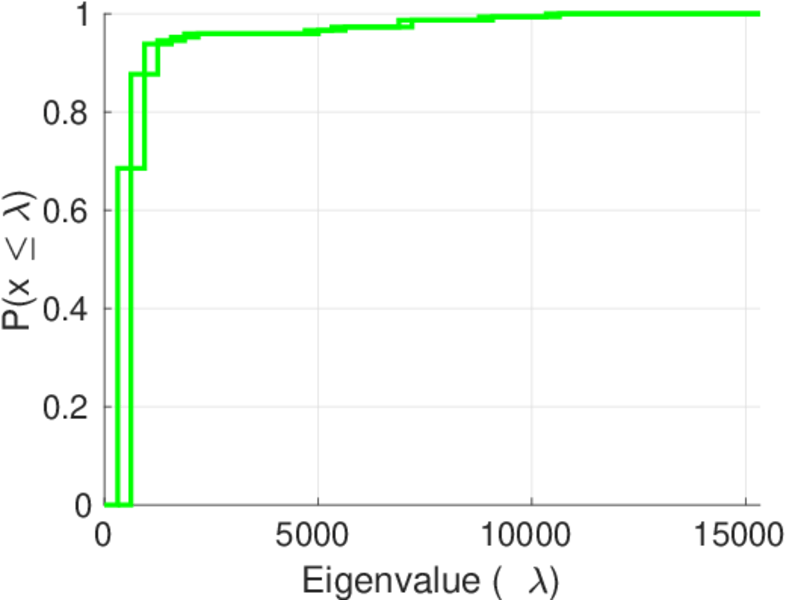
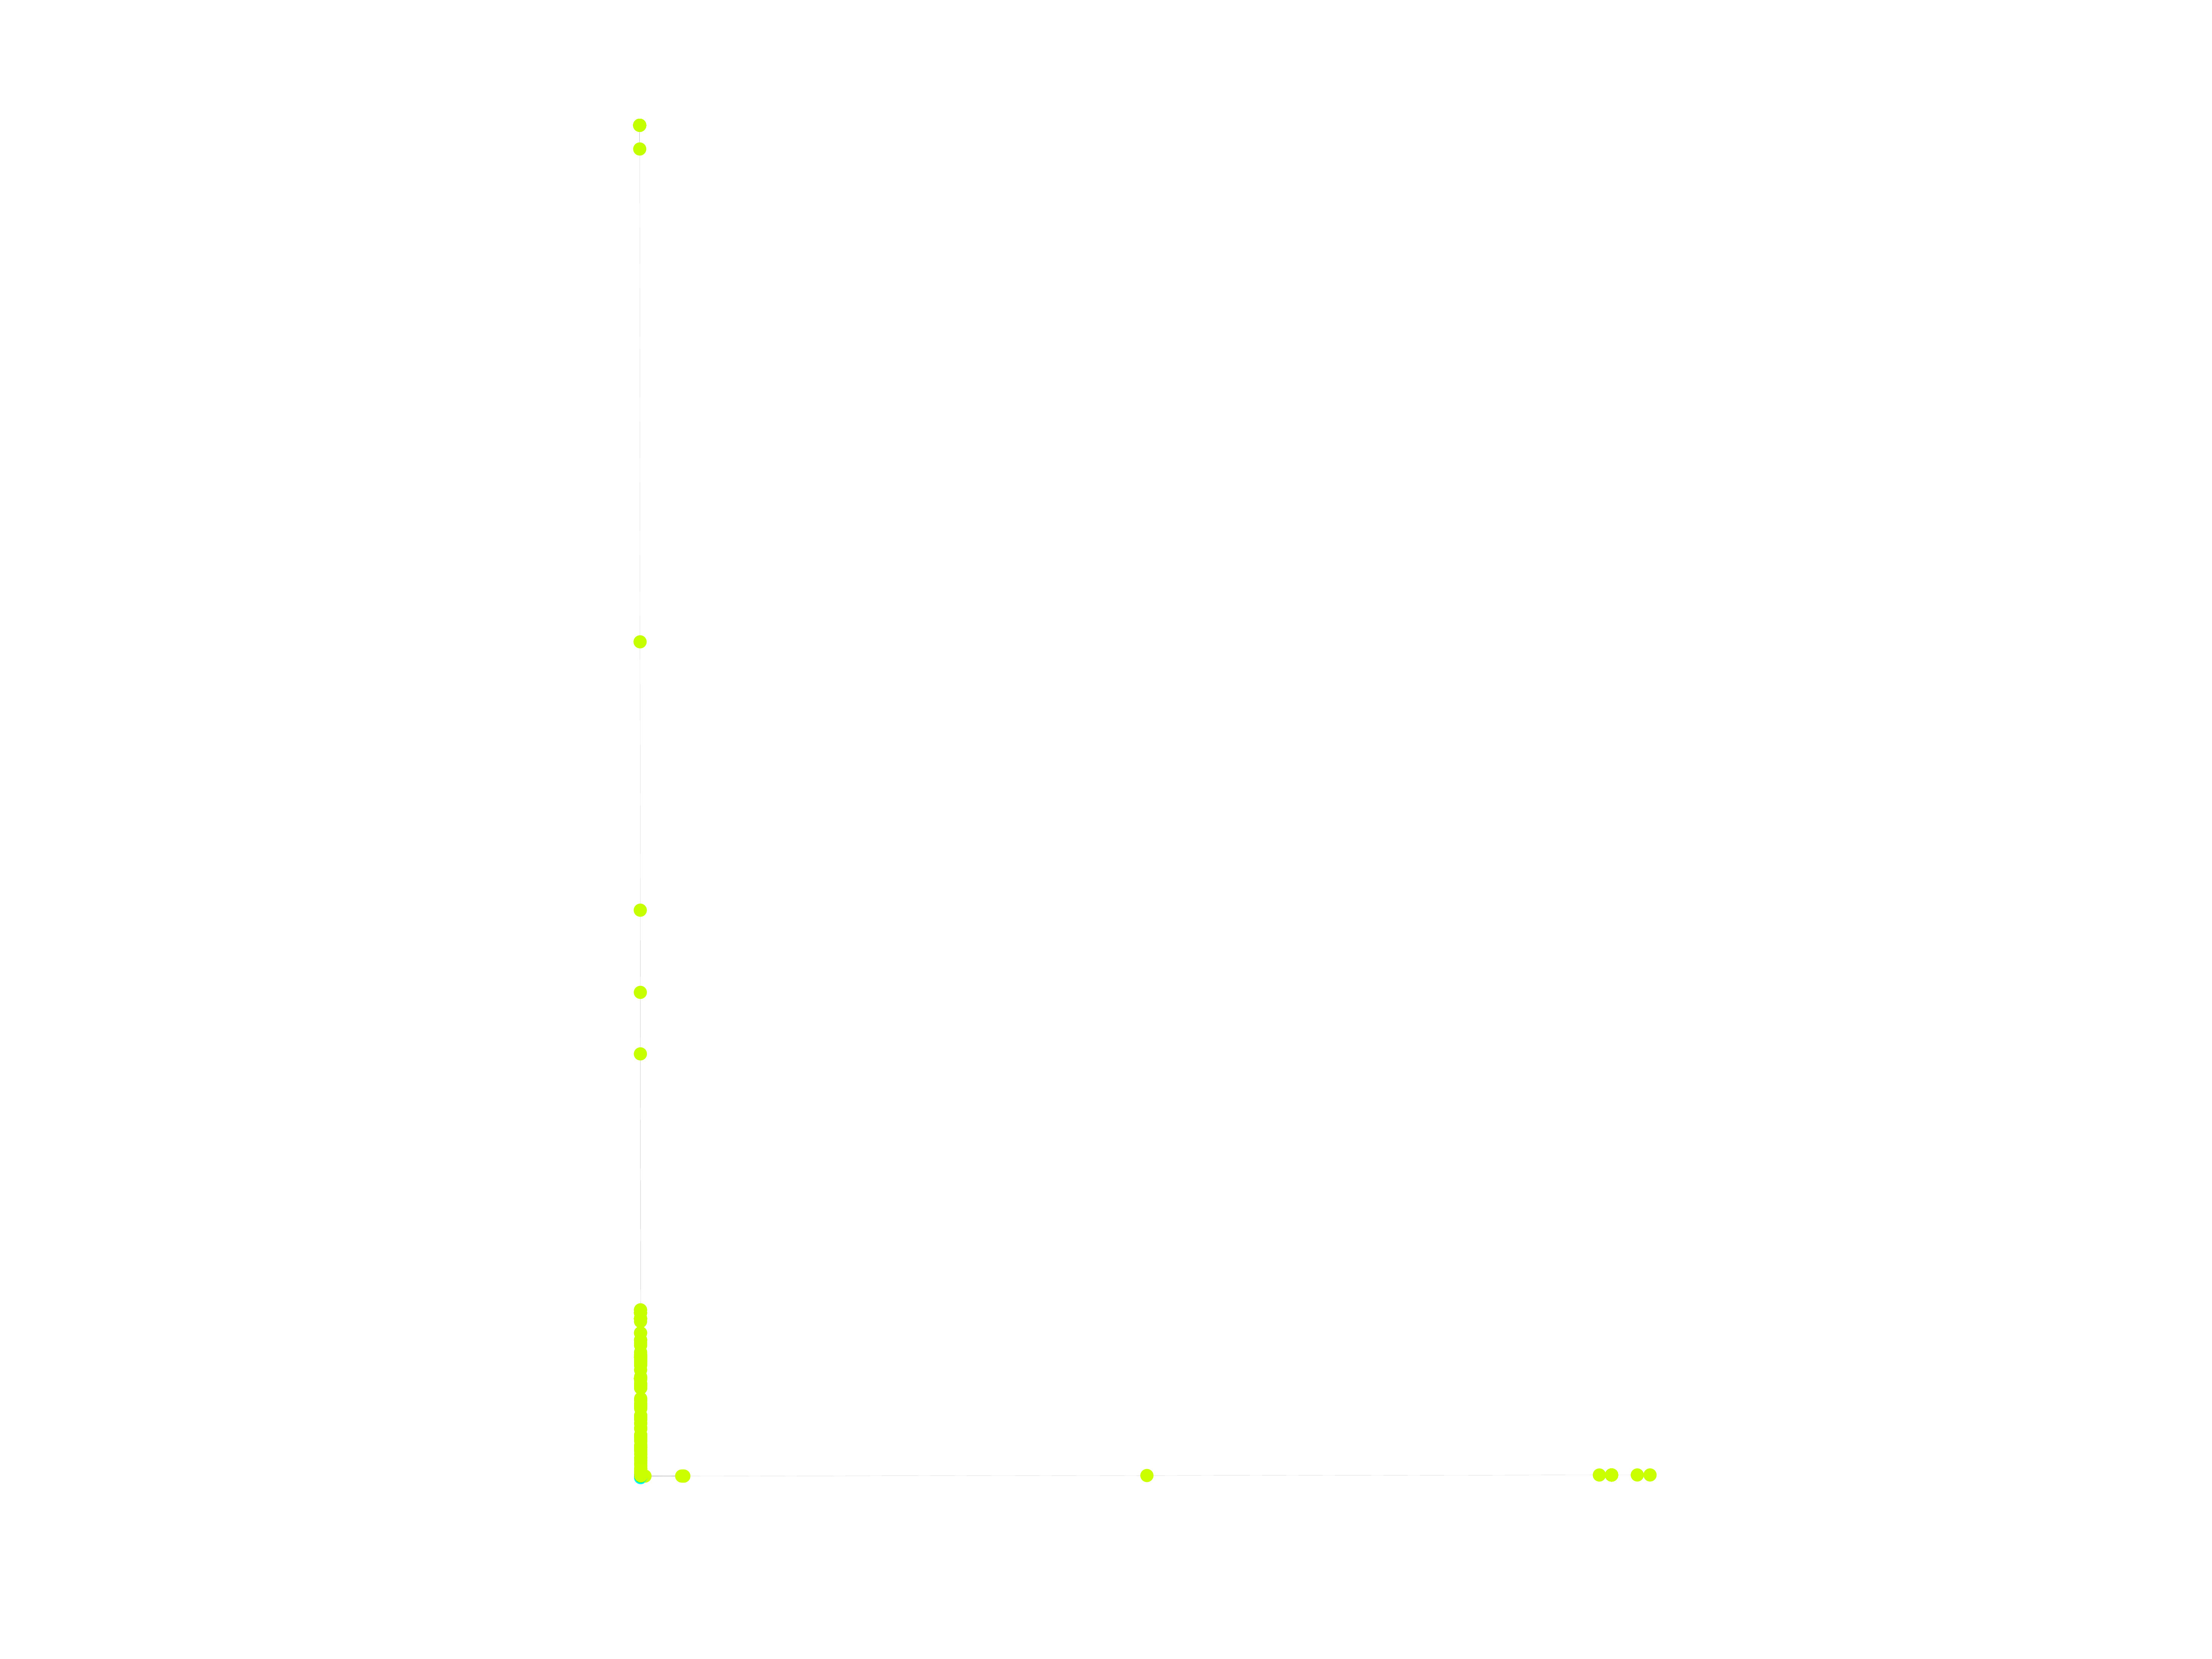
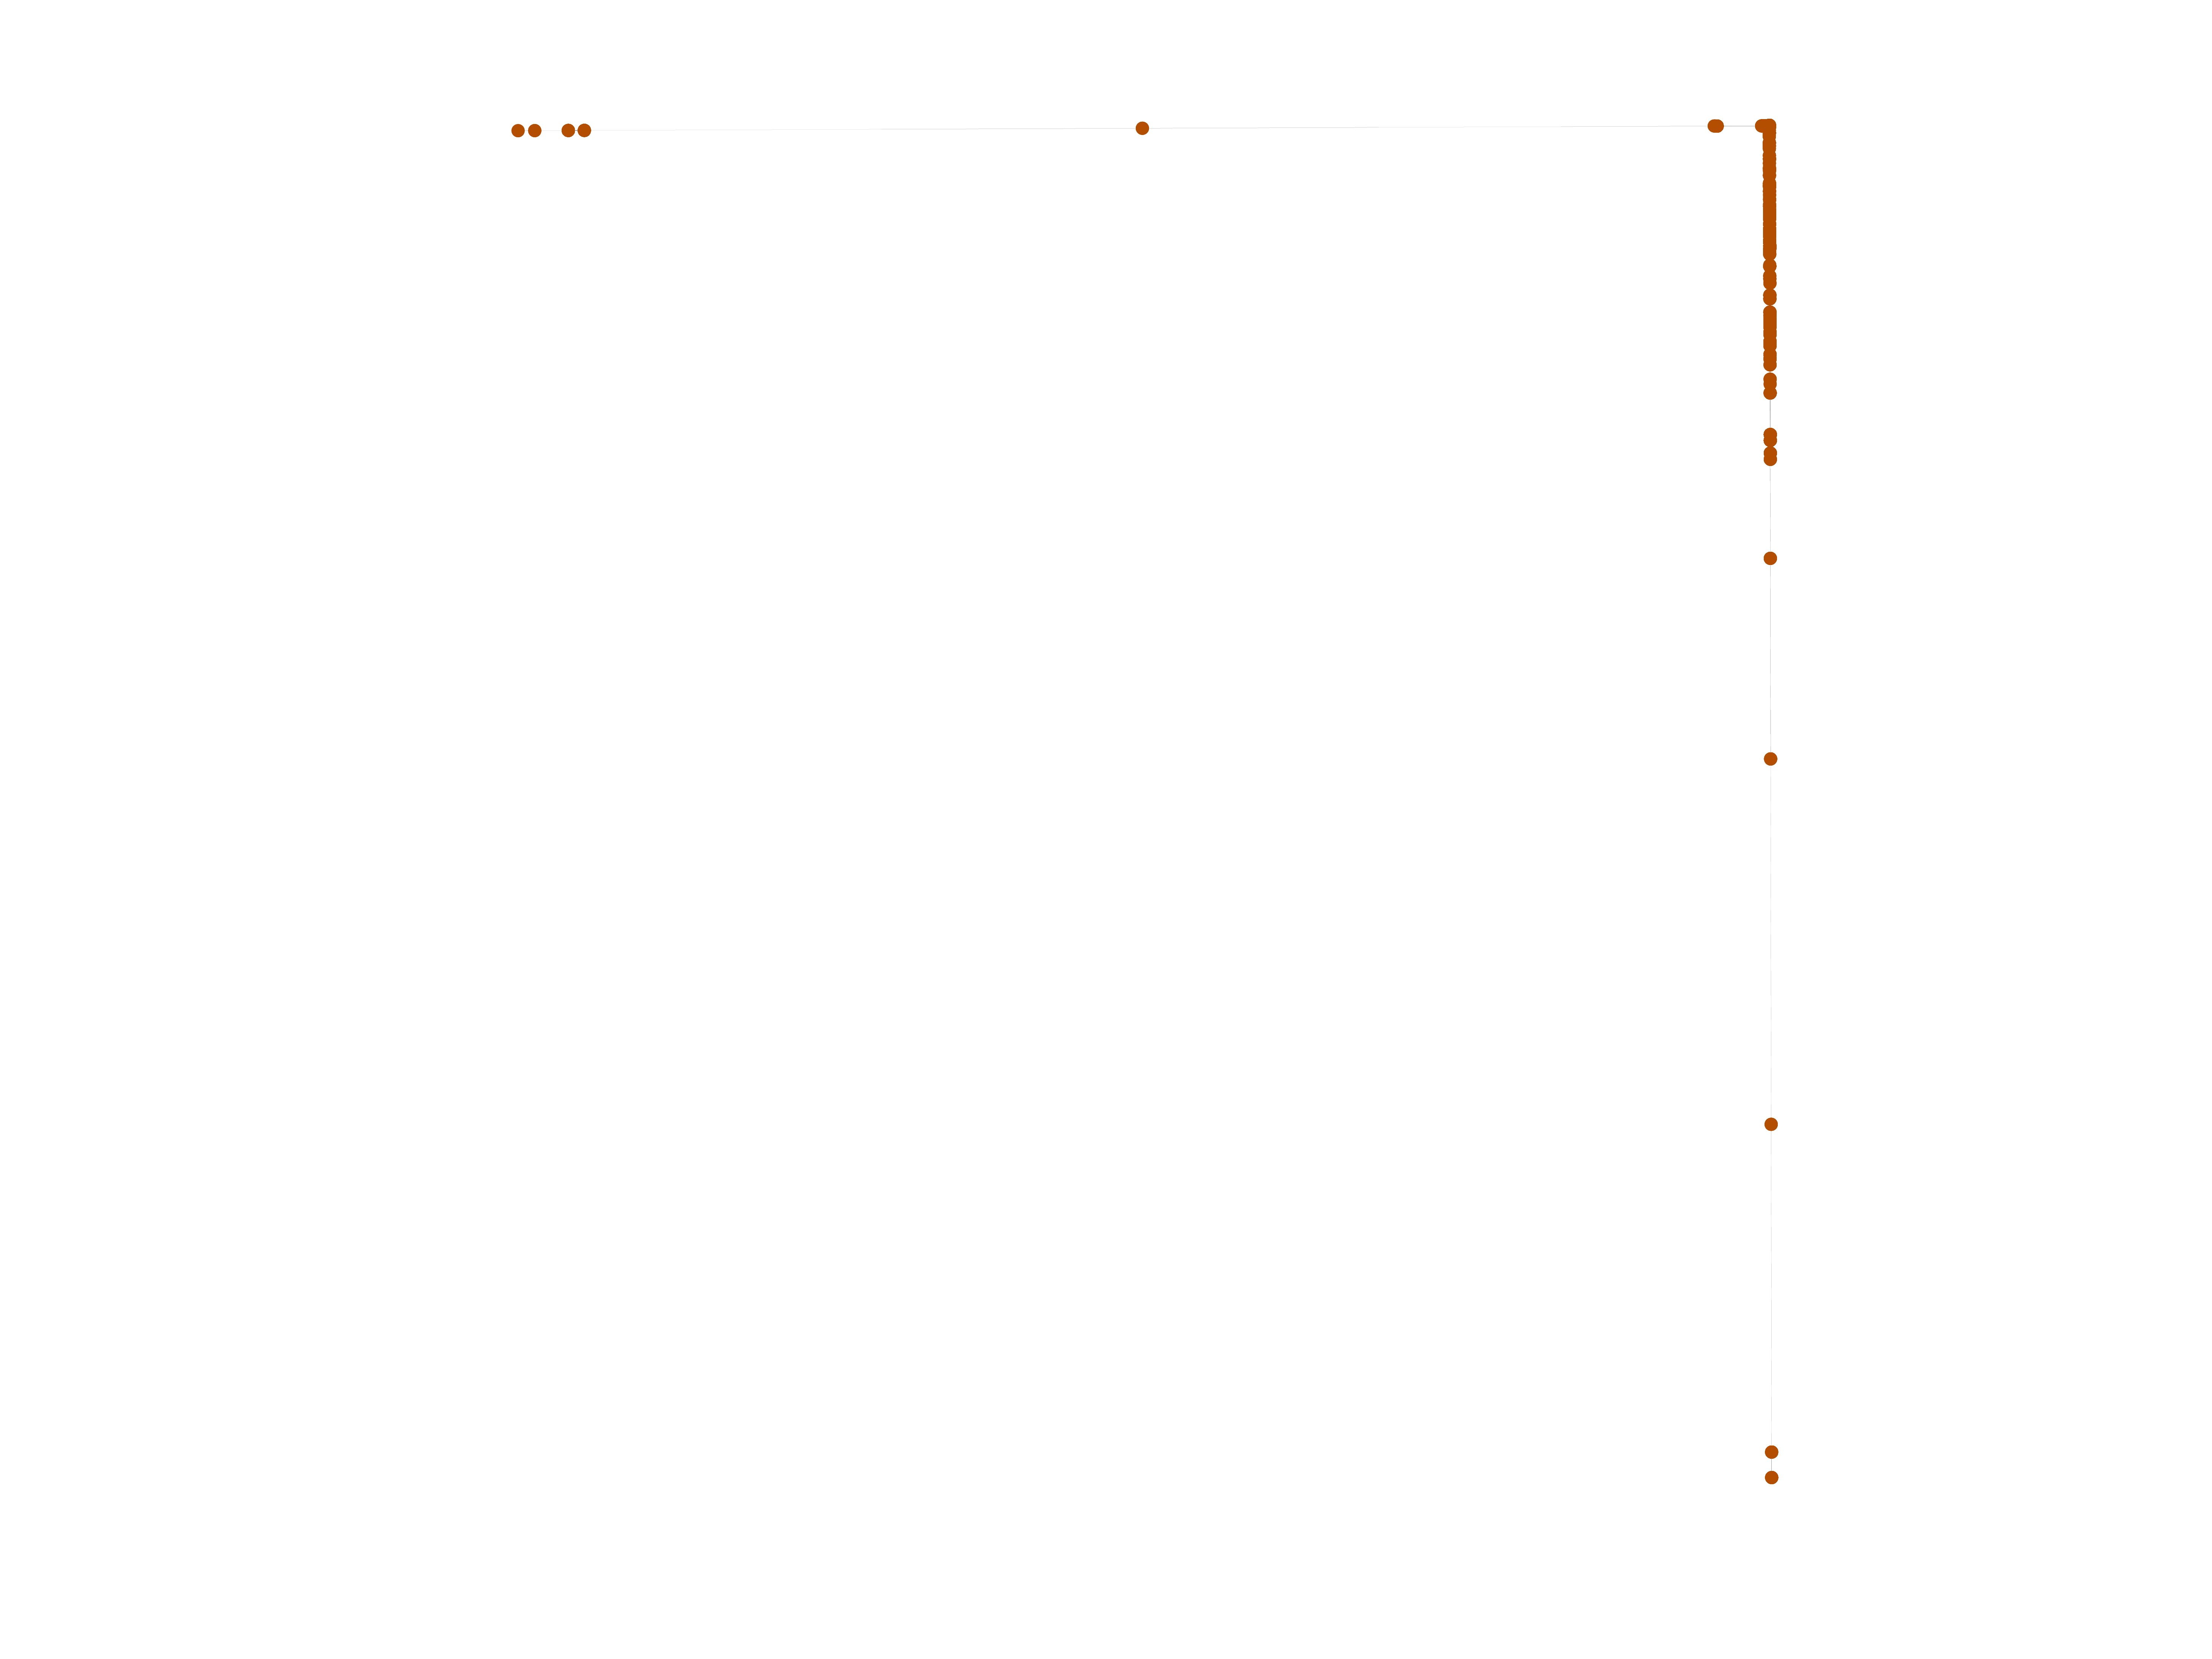
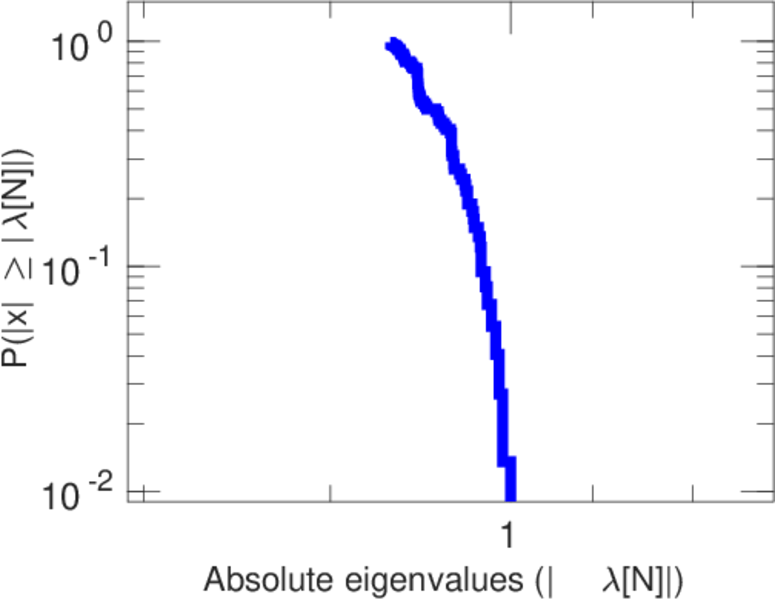
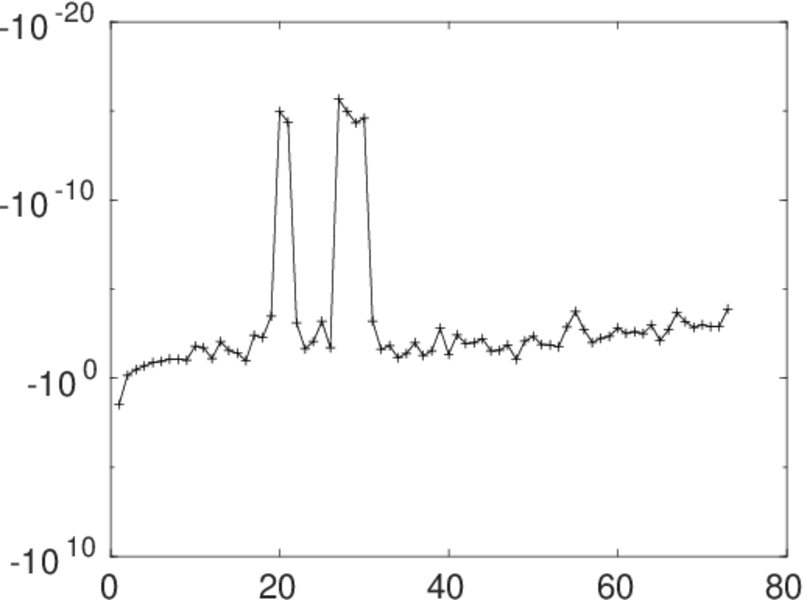
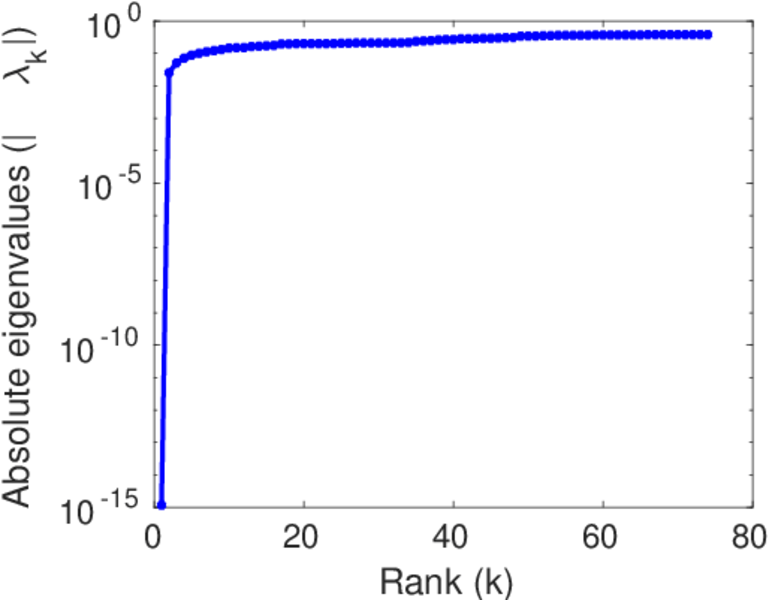
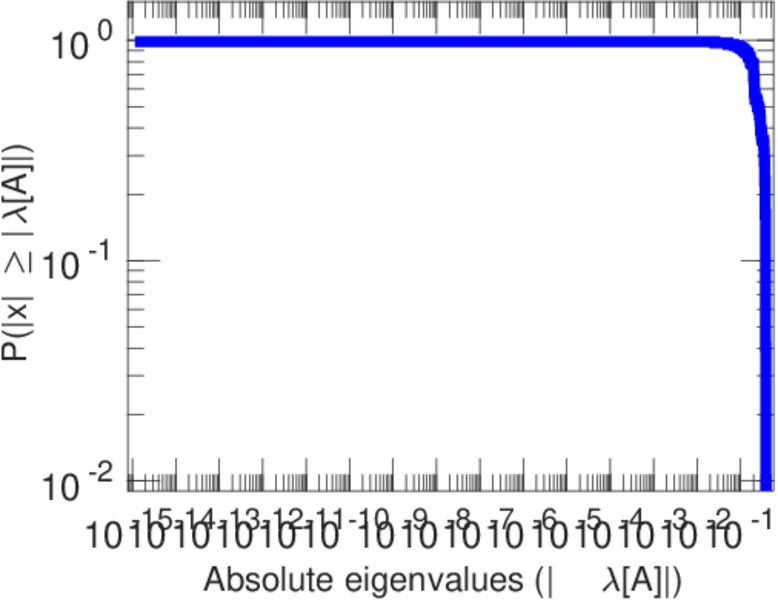
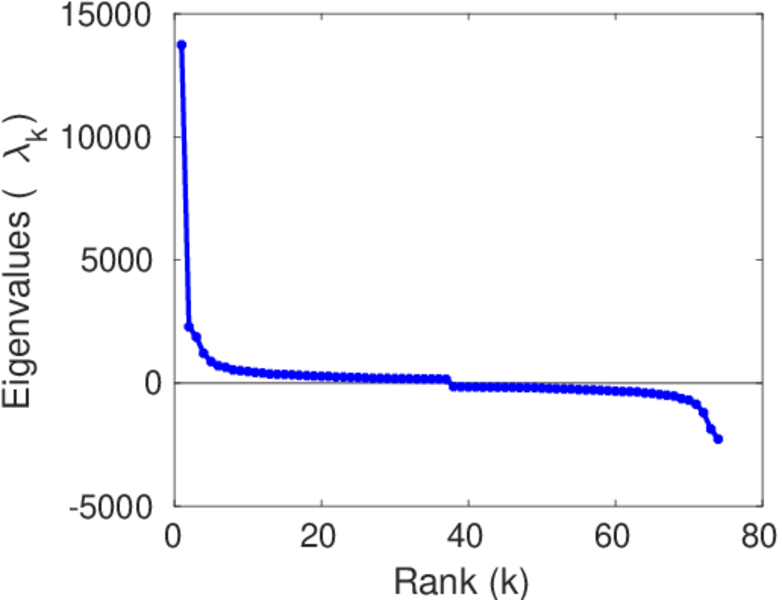
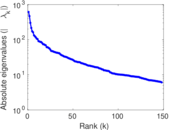
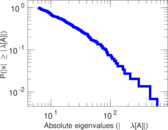
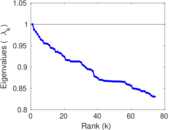
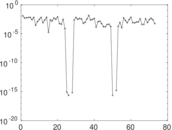
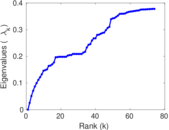
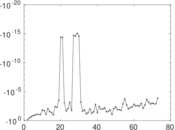
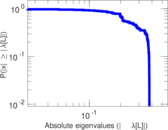
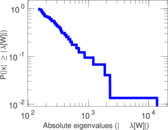
Matrix decompositions plots


Downloads
References
|
[1]
|
Jérôme Kunegis.
KONECT – The Koblenz Network Collection.
In Proc. Int. Conf. on World Wide Web Companion, pages
1343–1350, 2013.
[ http ]
|
|
[2]
|
Wikimedia Foundation.
Wikimedia downloads.
http://dumps.wikimedia.org/, January 2010.
|
 KONECT ‣ Networks ‣
Buy Me a Coffee
KONECT ‣ Networks ‣
Buy Me a Coffee