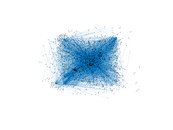
Wiktionary edits (mi)
This is the bipartite edit network of the Maori Wiktionary. It contains users
and pages from the Maori Wiktionary, connected by edit events. Each edge
represents an edit. The dataset includes the timestamp of each edit.
Metadata
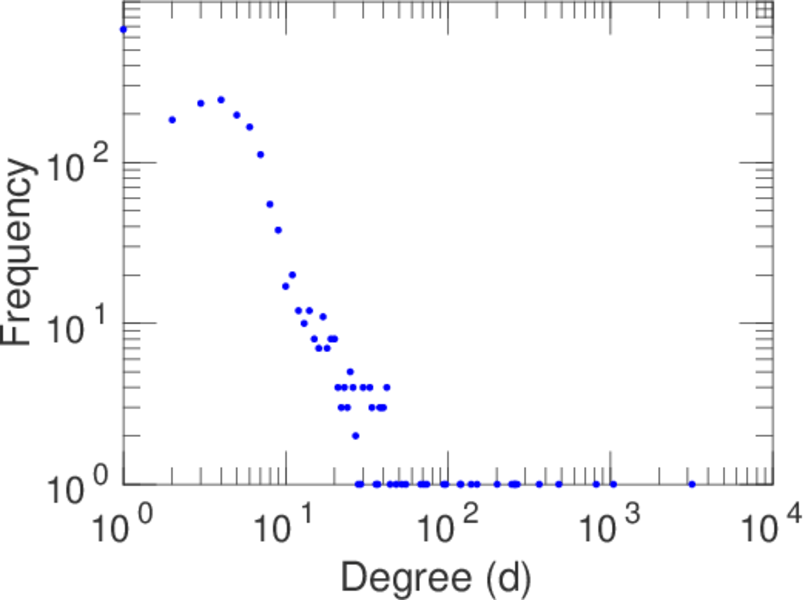
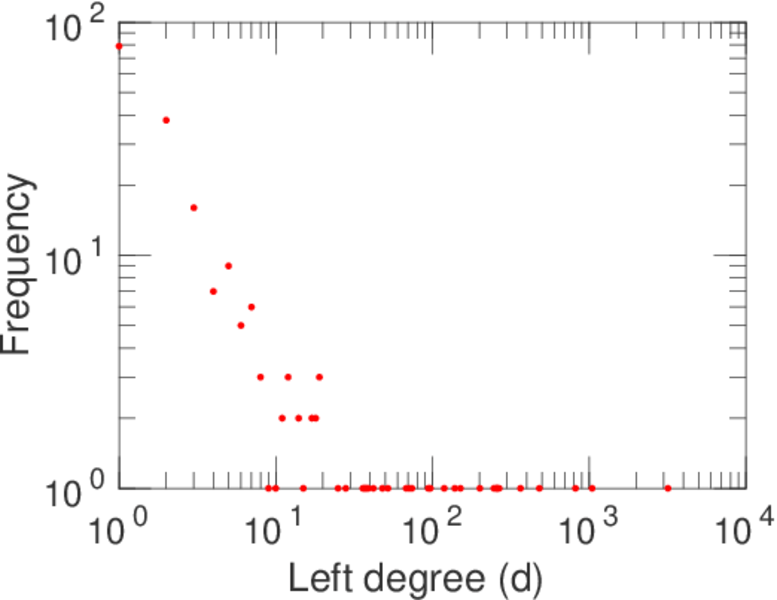
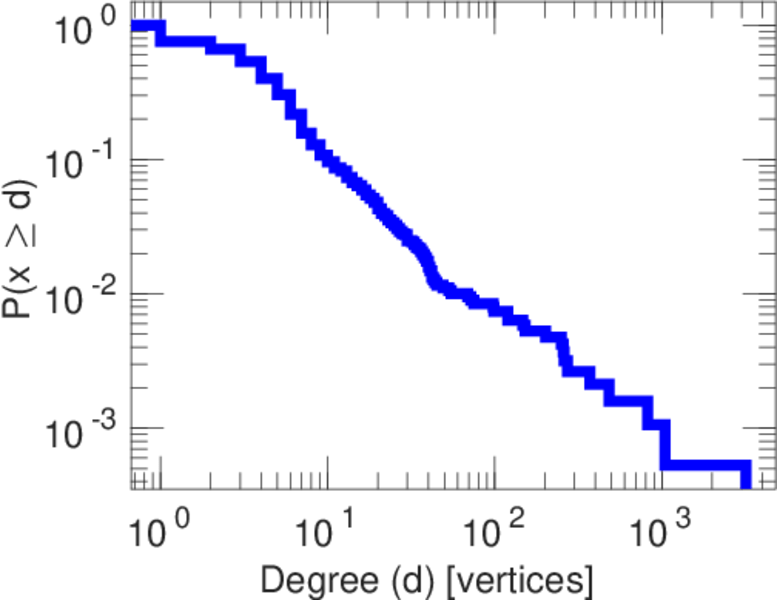
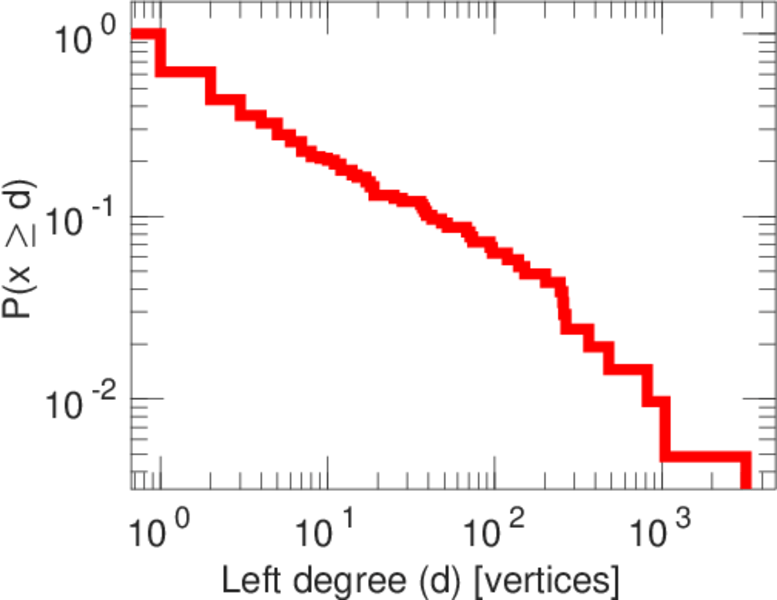
Statistics
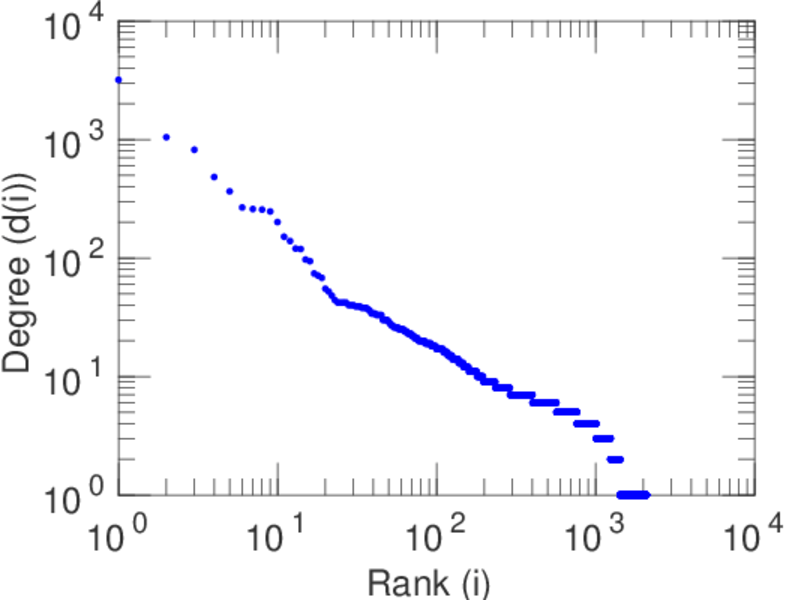
| Size | n = | 2,262
|
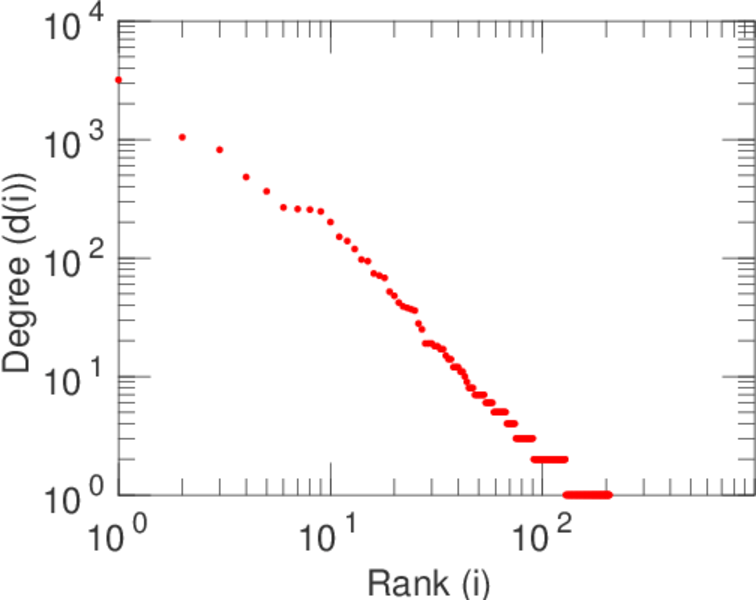
| Left size | n1 = | 207
|
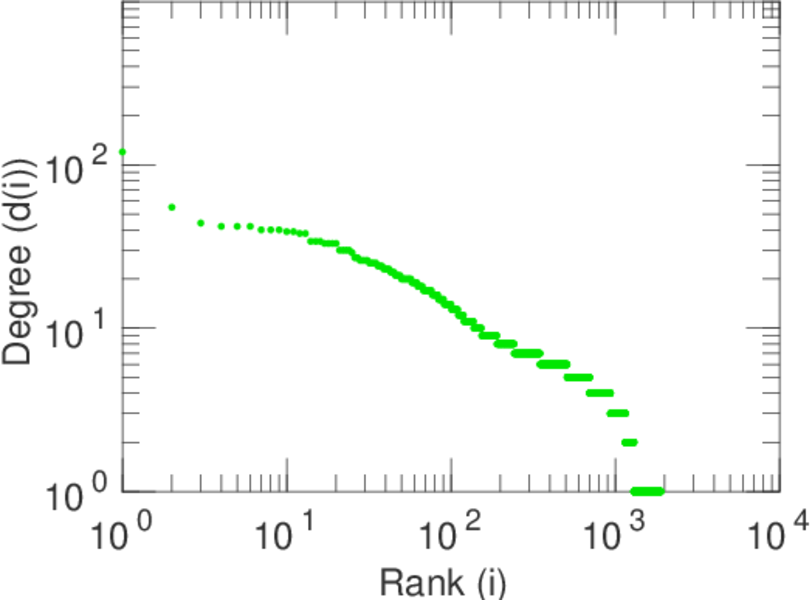
| Right size | n2 = | 2,055
|
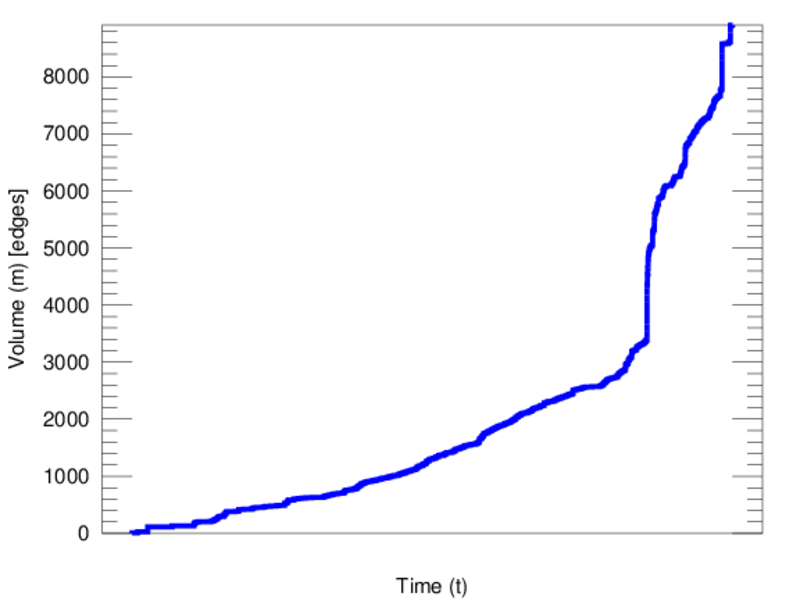
| Volume | m = | 8,909
|
| Unique edge count | m̿ = | 5,029
|
| Wedge count | s = | 1,269,199
|
| Claw count | z = | 346,363,195
|
| Cross count | x = | 80,987,469,784
|
| Square count | q = | 875,409
|
| 4-Tour count | T4 = | 12,090,566
|
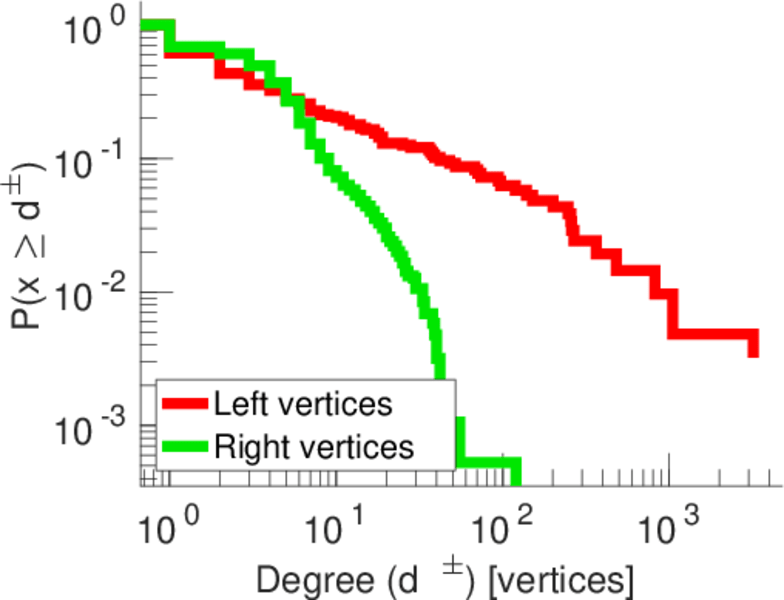
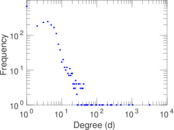
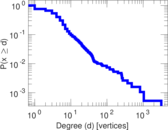
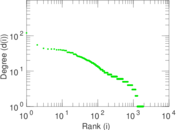
| Maximum degree | dmax = | 3,190
|
| Maximum left degree | d1max = | 3,190
|
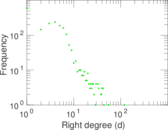
| Maximum right degree | d2max = | 120
|
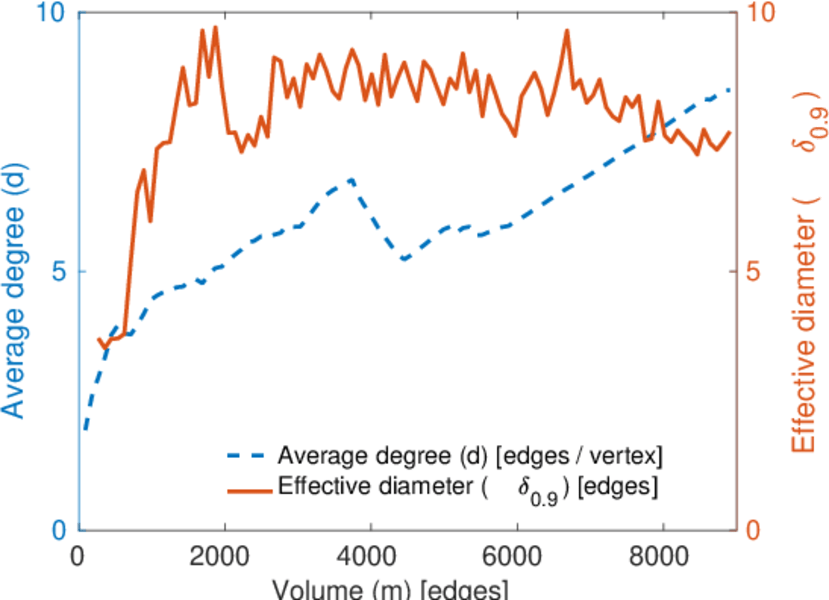
| Average degree | d = | 7.877 10
|
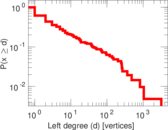
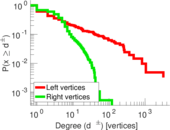
| Average left degree | d1 = | 43.038 6
|
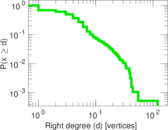
| Average right degree | d2 = | 4.335 28
|
| Fill | p = | 0.011 822 2
|
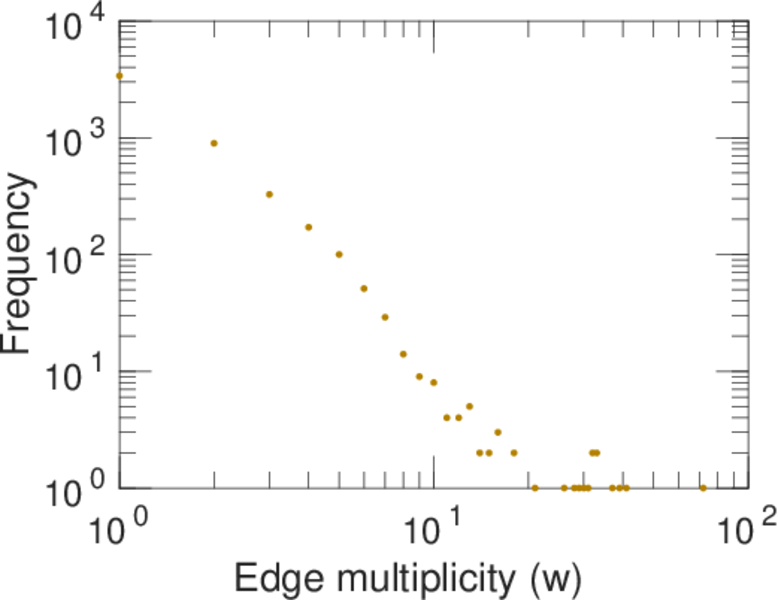
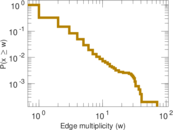
| Average edge multiplicity | m̃ = | 1.771 53
|
| Size of LCC | N = | 1,871
|
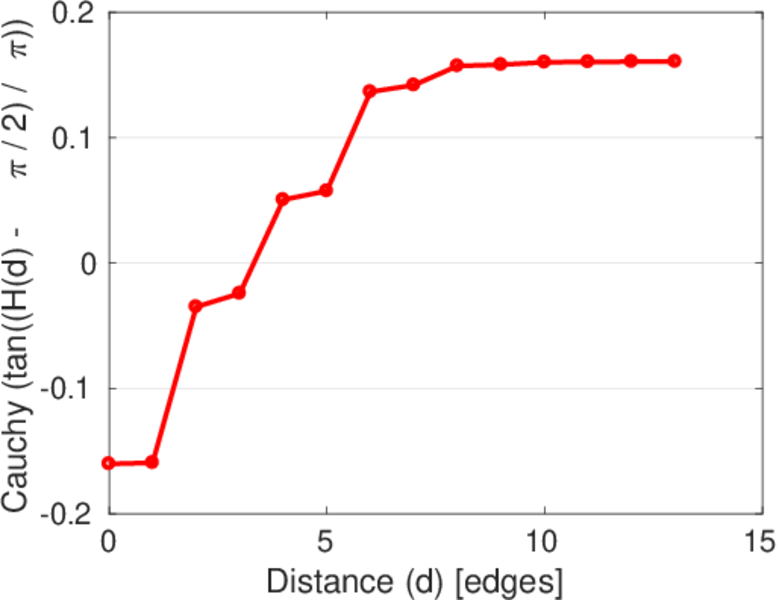
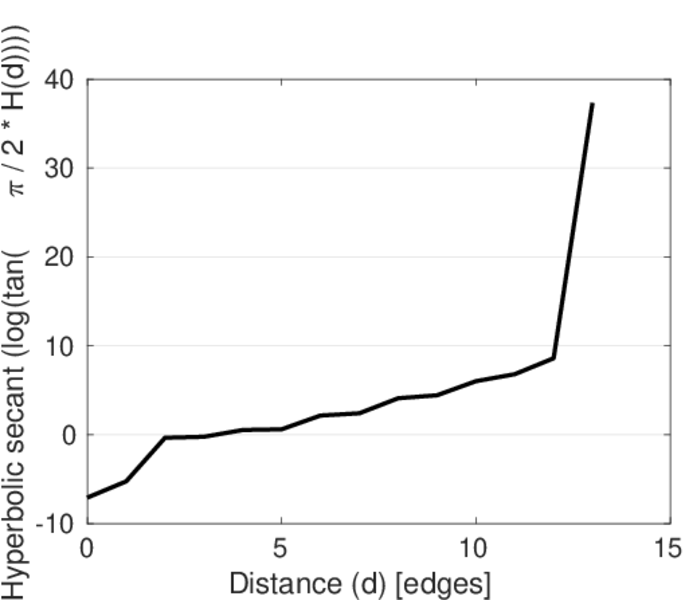
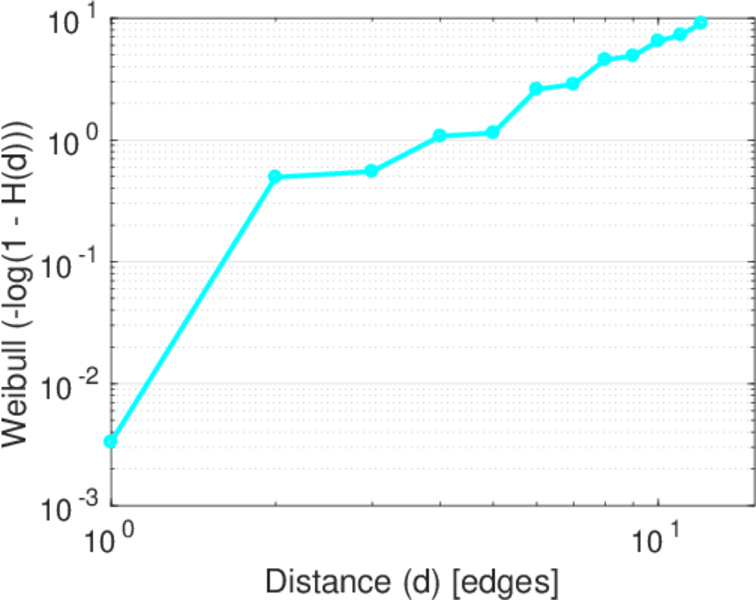
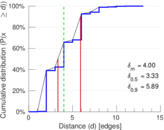
| Diameter | δ = | 15
|
| 50-Percentile effective diameter | δ0.5 = | 3.326 72
|
| 90-Percentile effective diameter | δ0.9 = | 5.894 71
|
| Median distance | δM = | 4
|
| Mean distance | δm = | 3.997 51
|
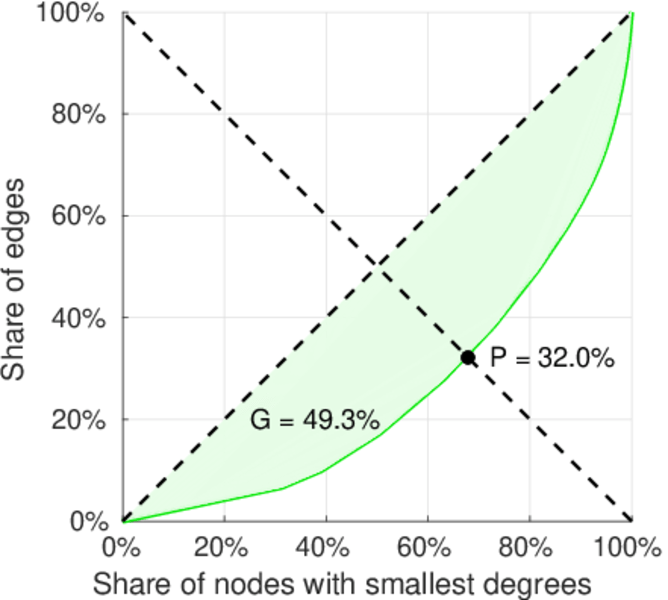
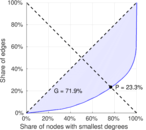
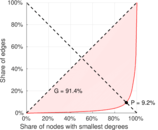
| Gini coefficient | G = | 0.710 245
|
| Balanced inequality ratio | P = | 0.235 436
|
| Left balanced inequality ratio | P1 = | 0.092 266 2
|
| Right balanced inequality ratio | P2 = | 0.320 126
|
| Relative edge distribution entropy | Her = | 0.768 012
|
| Power law exponent | γ = | 2.290 54
|
| Tail power law exponent | γt = | 1.731 00
|
| Tail power law exponent with p | γ3 = | 1.731 00
|
| p-value | p = | 0.126 000
|
| Left tail power law exponent with p | γ3,1 = | 1.631 00
|
| Left p-value | p1 = | 0.218 000
|
| Right tail power law exponent with p | γ3,2 = | 4.211 00
|
| Right p-value | p2 = | 0.015 000 0
|
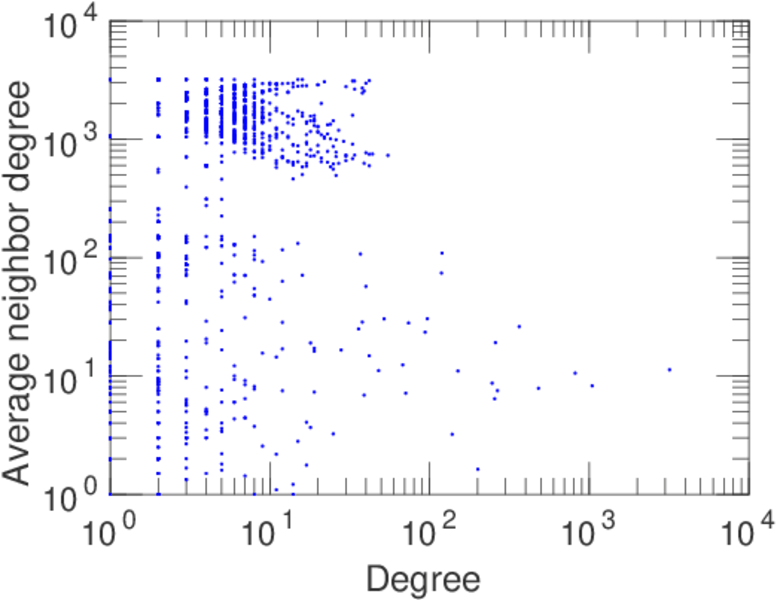
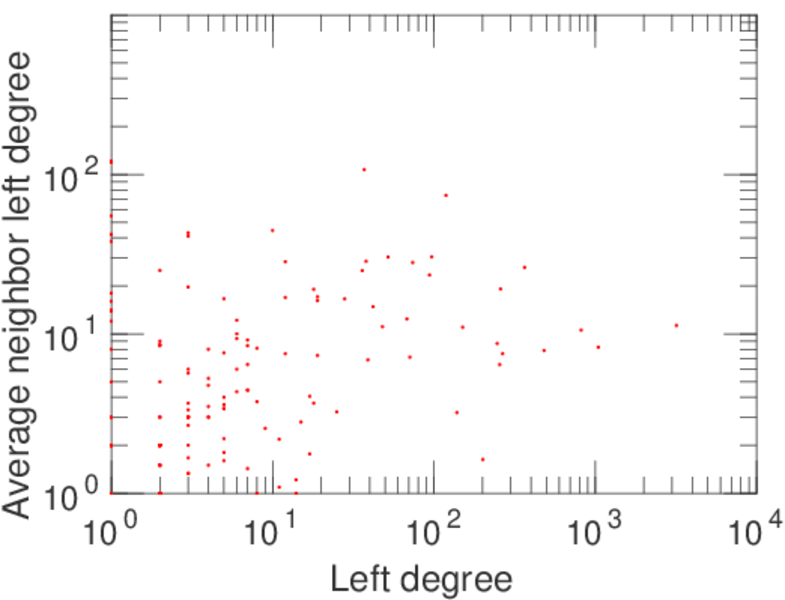
| Degree assortativity | ρ = | −0.090 078 1
|
| Degree assortativity p-value | pρ = | 1.560 35 × 10−10
|
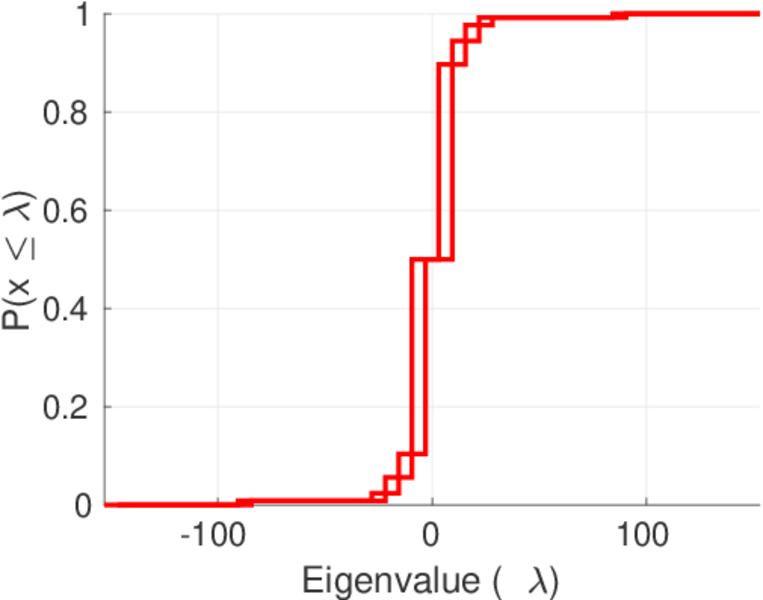
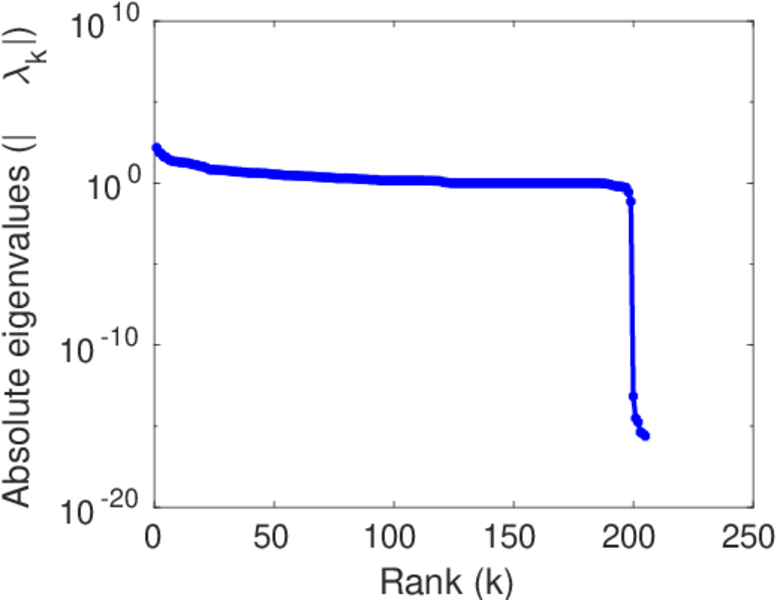
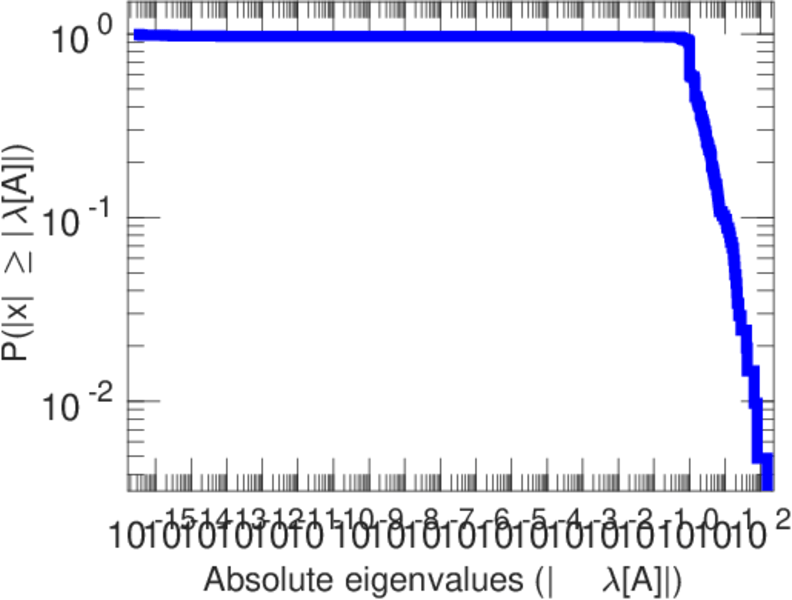
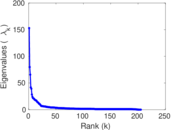
| Spectral norm | α = | 152.889
|
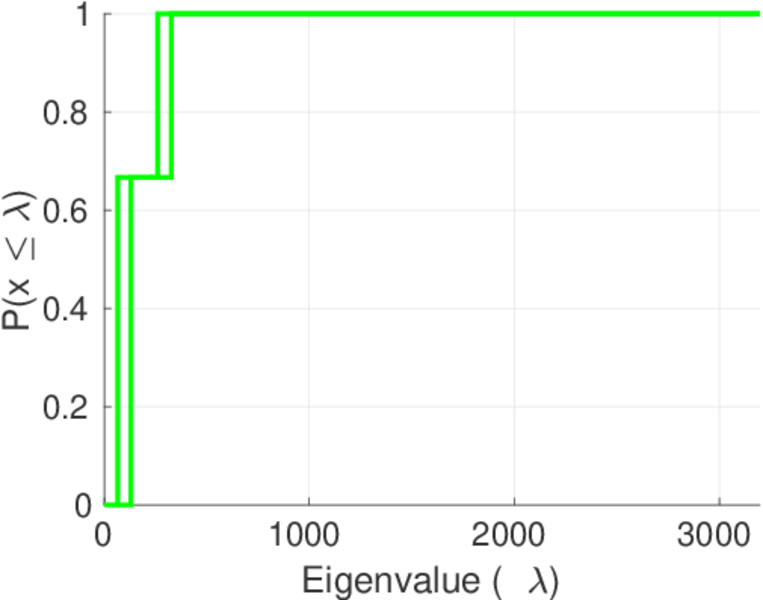
| Algebraic connectivity | a = | 0.008 784 51
|
| Spectral separation | |λ1[A] / λ2[A]| = | 1.915 17
|
| Controllability | C = | 1,699
|
| Relative controllability | Cr = | 0.810 205
|
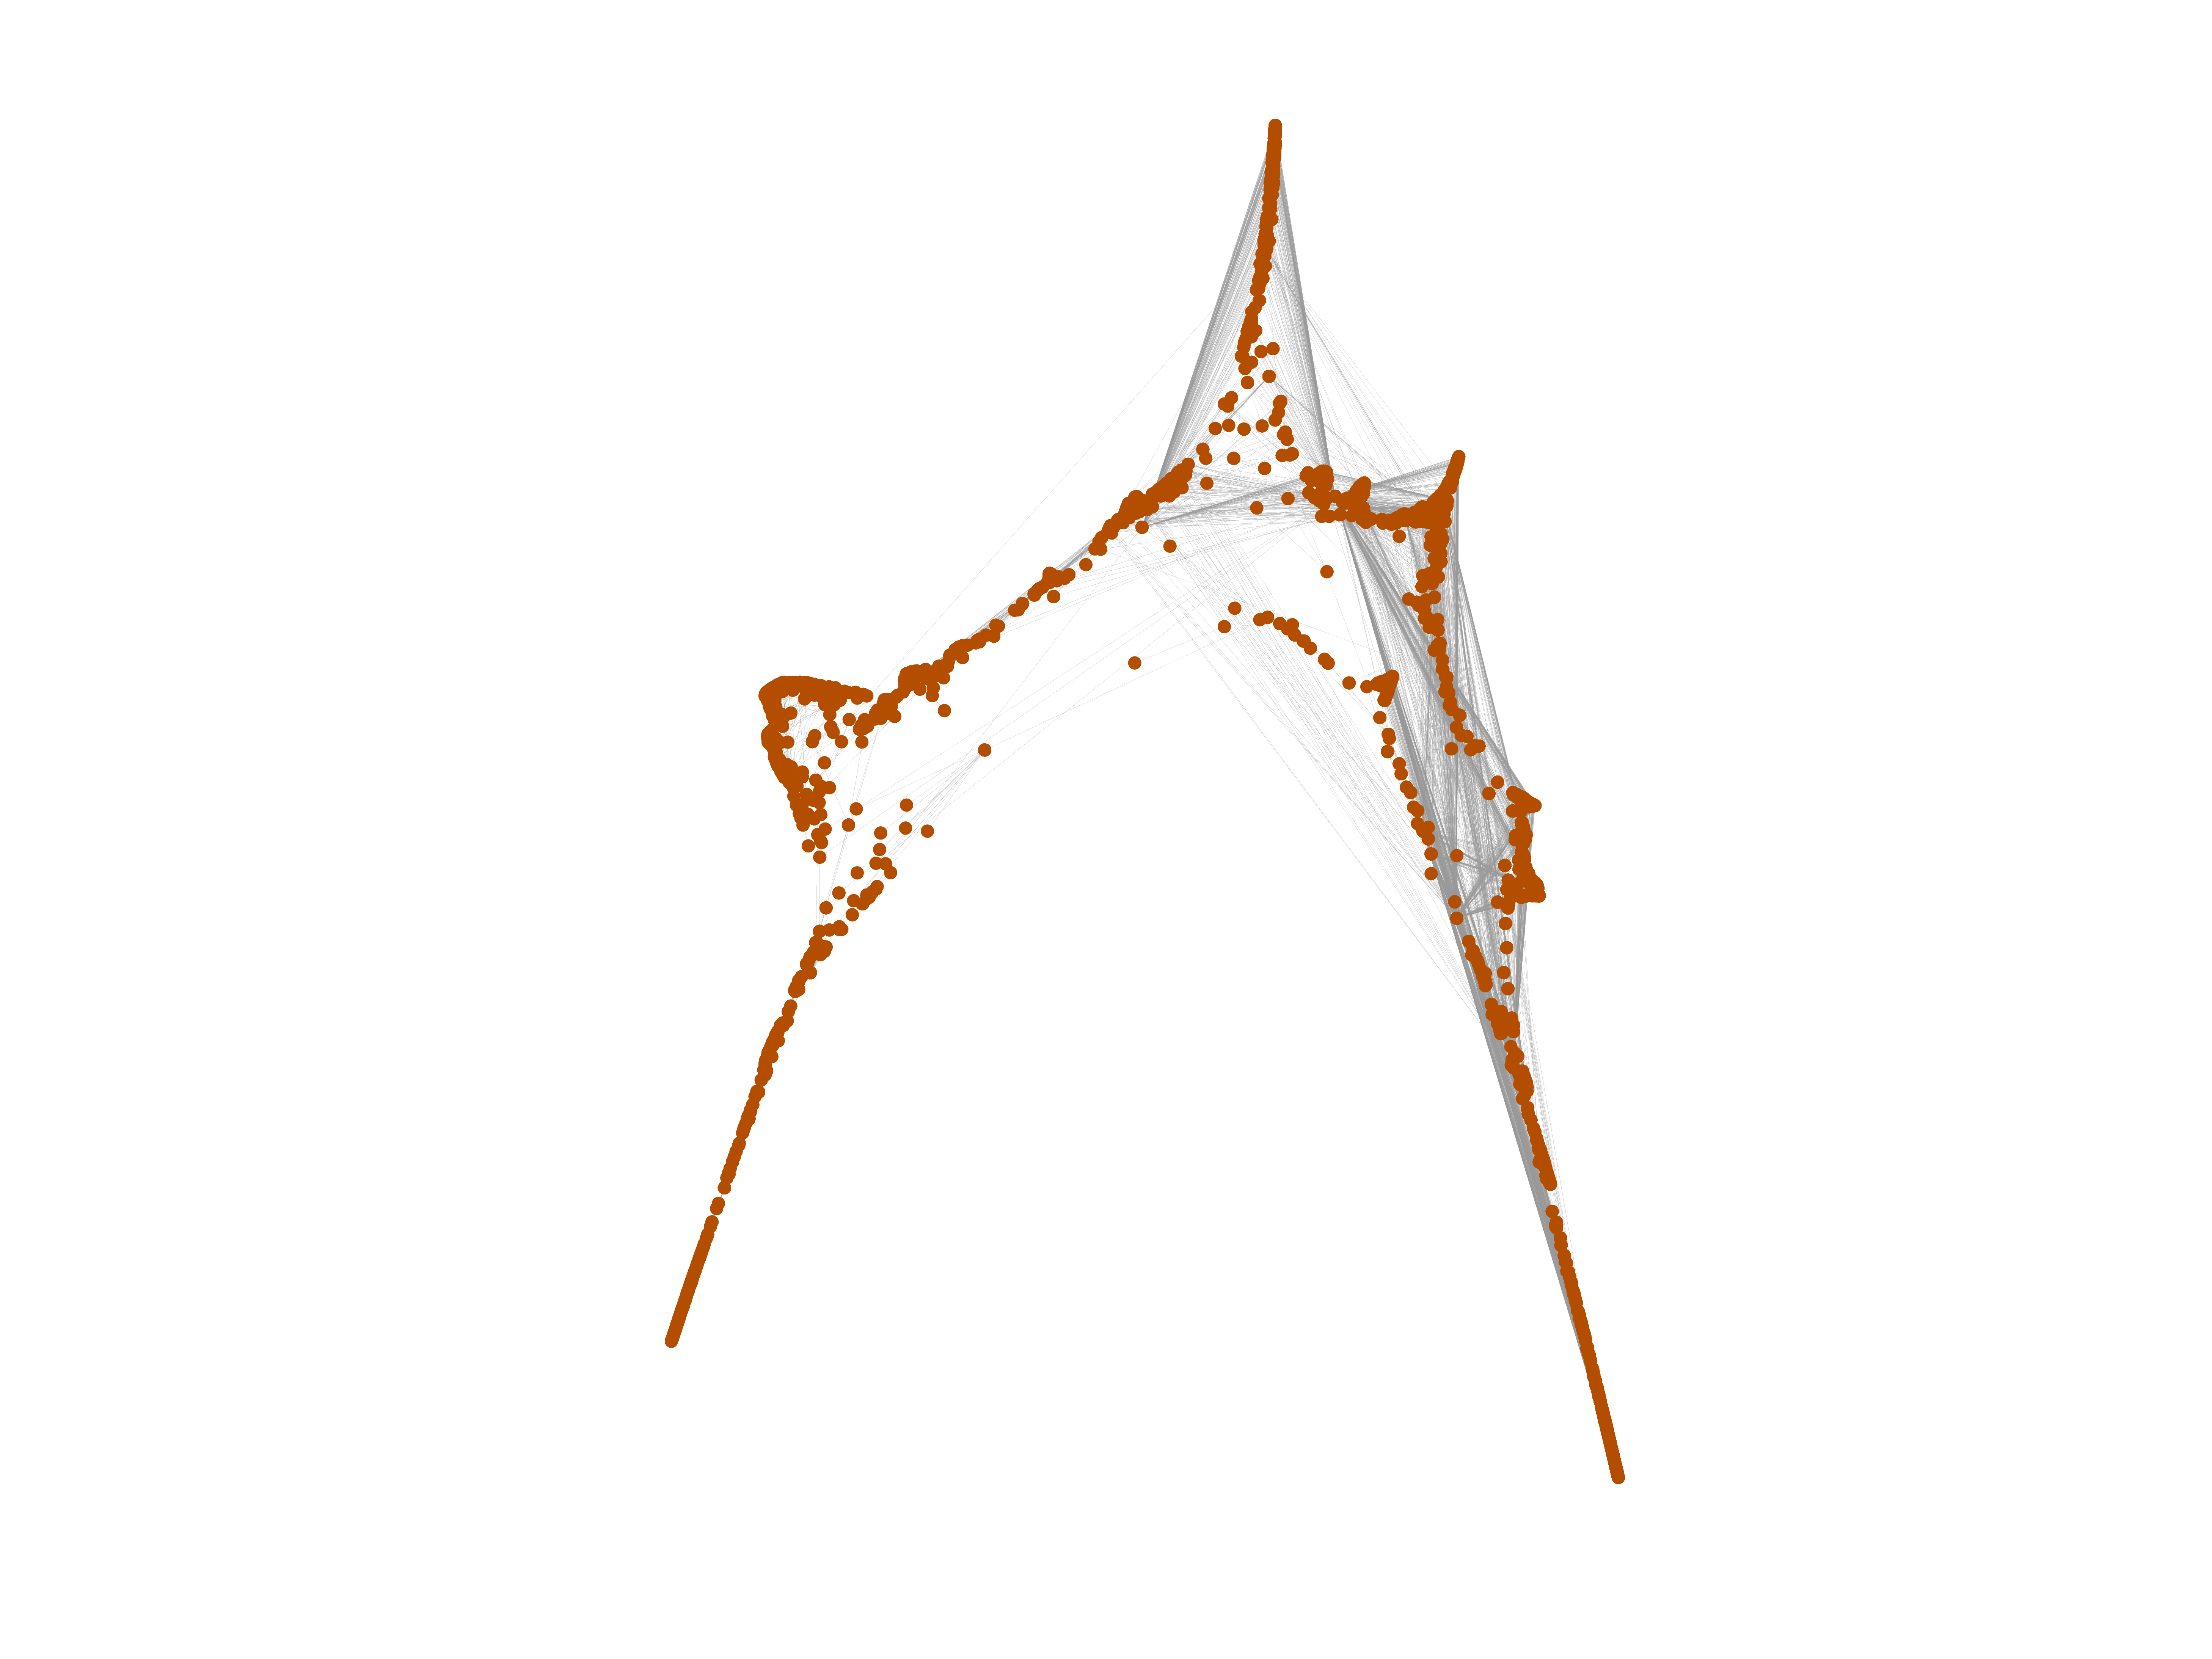
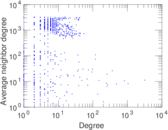
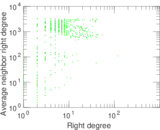
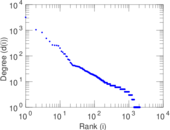
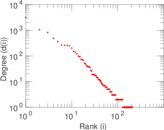
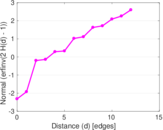
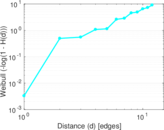
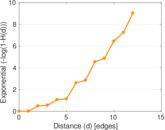
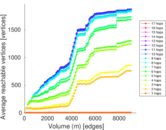
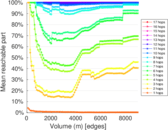
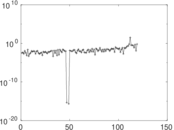
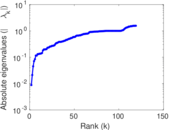
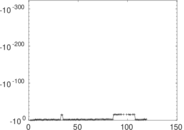
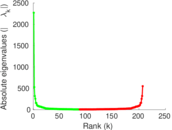
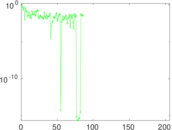
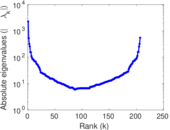
Plots


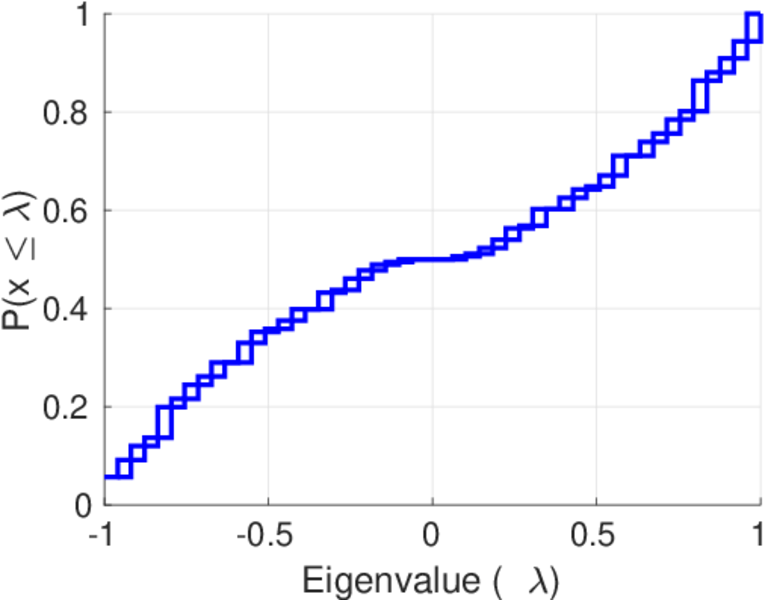
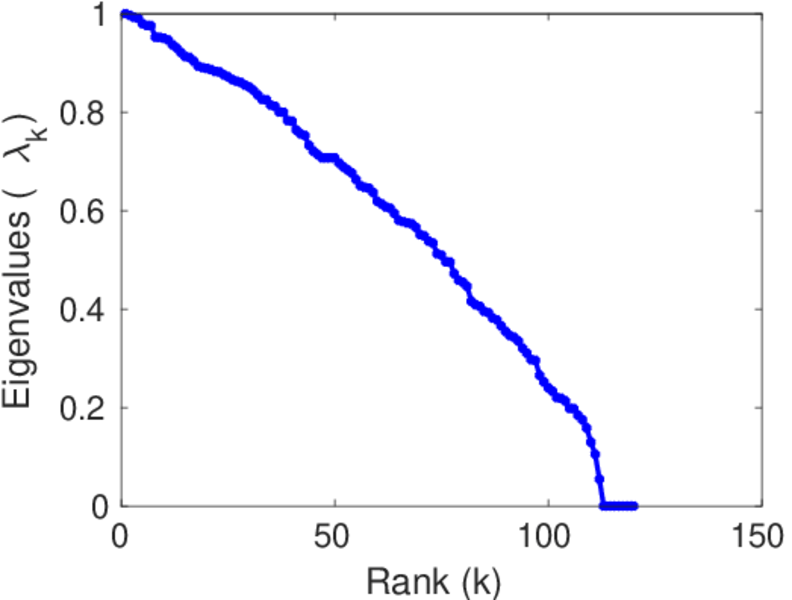
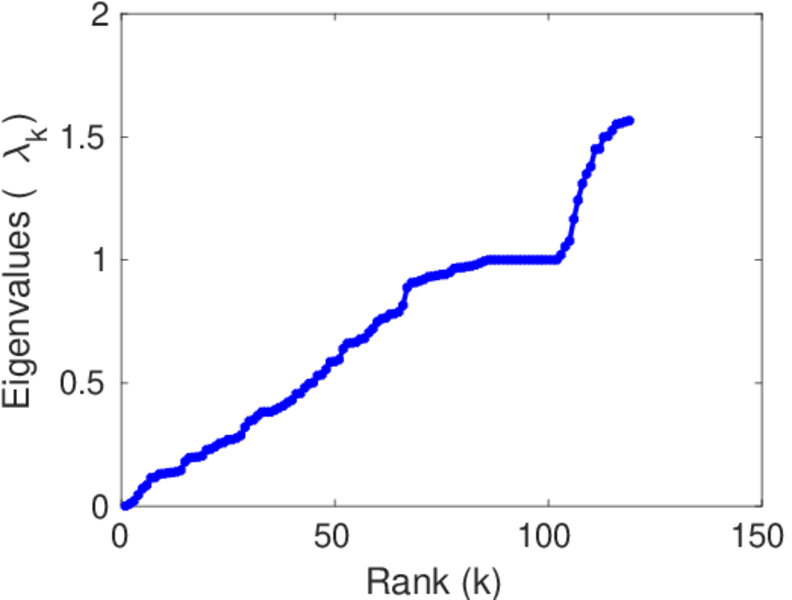
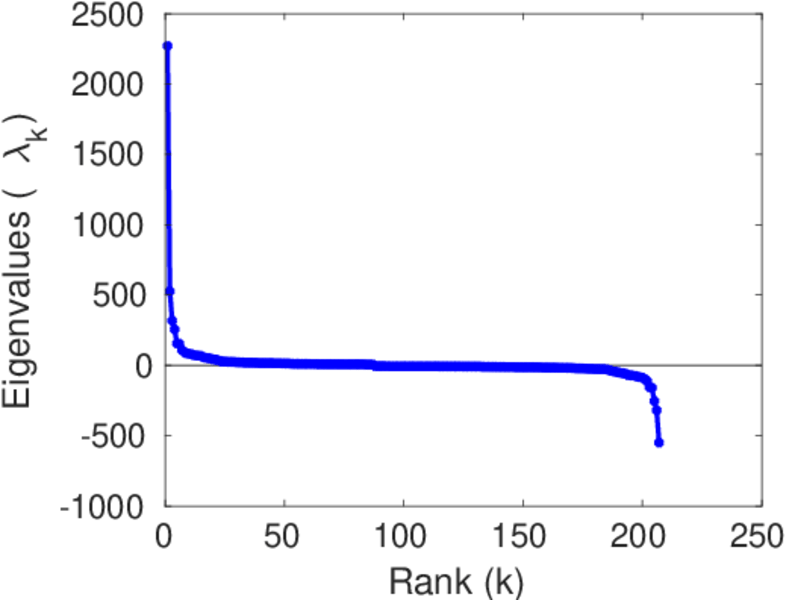
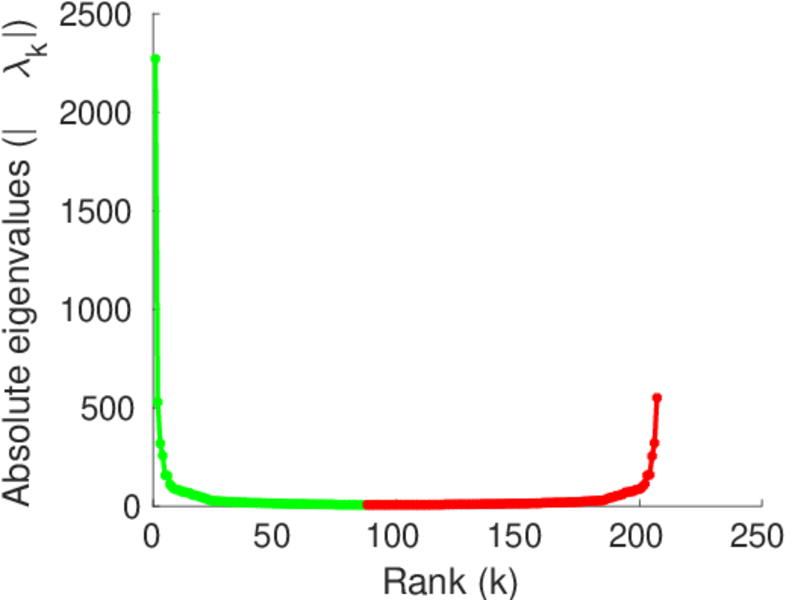
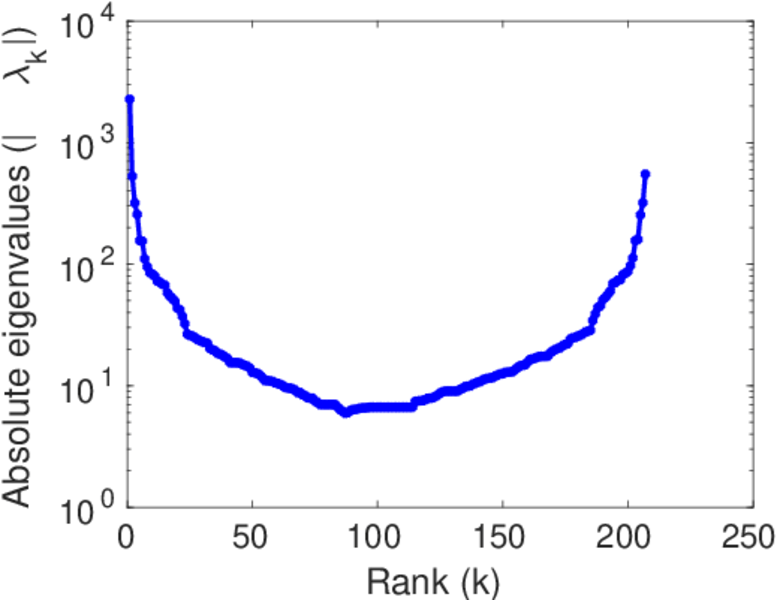
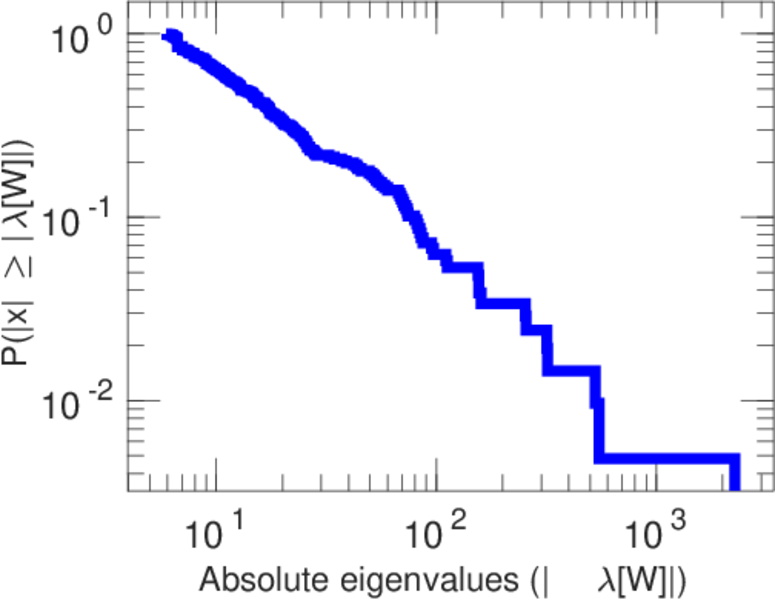
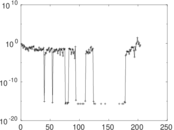
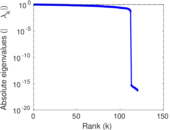
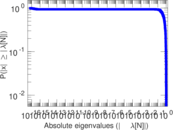
Matrix decompositions plots


Downloads
References
|
[1]
|
Jérôme Kunegis.
KONECT – The Koblenz Network Collection.
In Proc. Int. Conf. on World Wide Web Companion, pages
1343–1350, 2013.
[ http ]
|
|
[2]
|
Wikimedia Foundation.
Wikimedia downloads.
http://dumps.wikimedia.org/, January 2010.
|
 KONECT ‣ Networks ‣
Buy Me a Coffee
KONECT ‣ Networks ‣
Buy Me a Coffee