Wikipedia edits (ml)
This is the bipartite edit network of the Malayalam Wikipedia. It contains
users and pages from the Malayalam Wikipedia, connected by edit events. Each
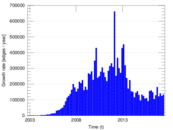
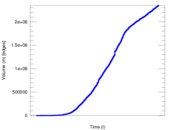
edge represents an edit. The dataset includes the timestamp of each edit.
Metadata
Statistics
| Size | n = | 362,166
|
| Left size | n1 = | 36,162
|
| Right size | n2 = | 326,004
|
| Volume | m = | 2,349,591
|
| Unique edge count | m̿ = | 1,094,136
|
| Wedge count | s = | 7,236,441,972
|
| Claw count | z = | 78,360,916,793,788
|
| Cross count | x = | 817,525,241,406,720,128
|
| Square count | q = | 3,406,295,614
|
| 4-Tour count | T4 = | 56,199,087,604
|
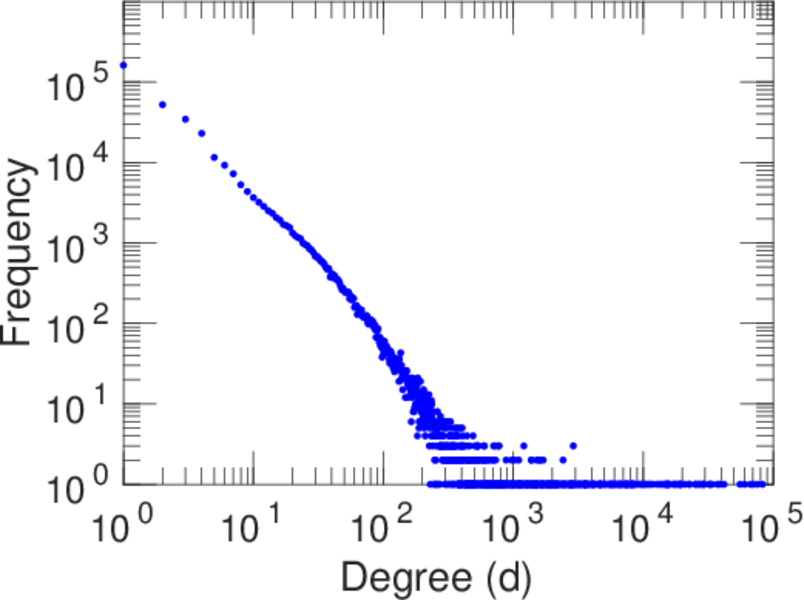
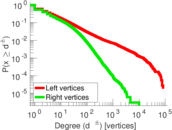
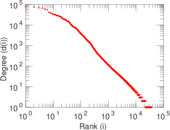
| Maximum degree | dmax = | 82,791
|
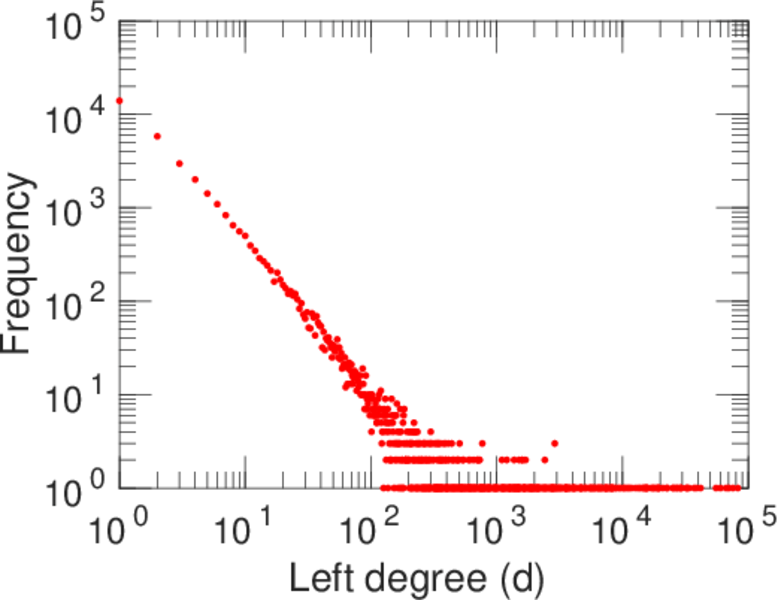
| Maximum left degree | d1max = | 82,791
|
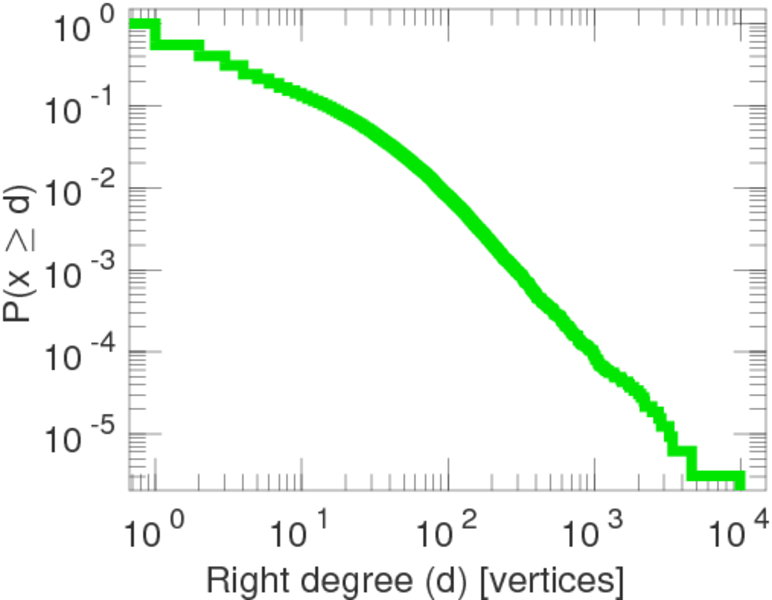
| Maximum right degree | d2max = | 9,934
|
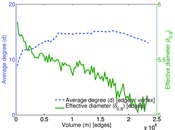
| Average degree | d = | 12.975 2
|
| Average left degree | d1 = | 64.974 0
|
| Average right degree | d2 = | 7.207 25
|
| Fill | p = | 9.281 02 × 10−5
|
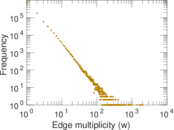
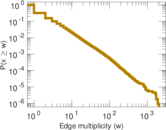
| Average edge multiplicity | m̃ = | 2.147 44
|
| Size of LCC | N = | 359,504
|
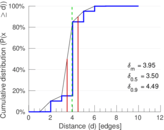
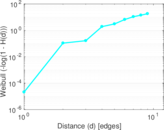
| Diameter | δ = | 11
|
| 50-Percentile effective diameter | δ0.5 = | 3.499 35
|
| 90-Percentile effective diameter | δ0.9 = | 4.489 67
|
| Median distance | δM = | 4
|
| Mean distance | δm = | 3.947 25
|
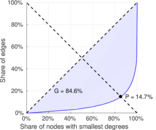
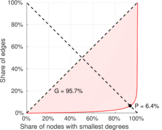
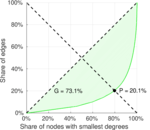
| Gini coefficient | G = | 0.851 875
|
| Relative edge distribution entropy | Her = | 0.750 453
|
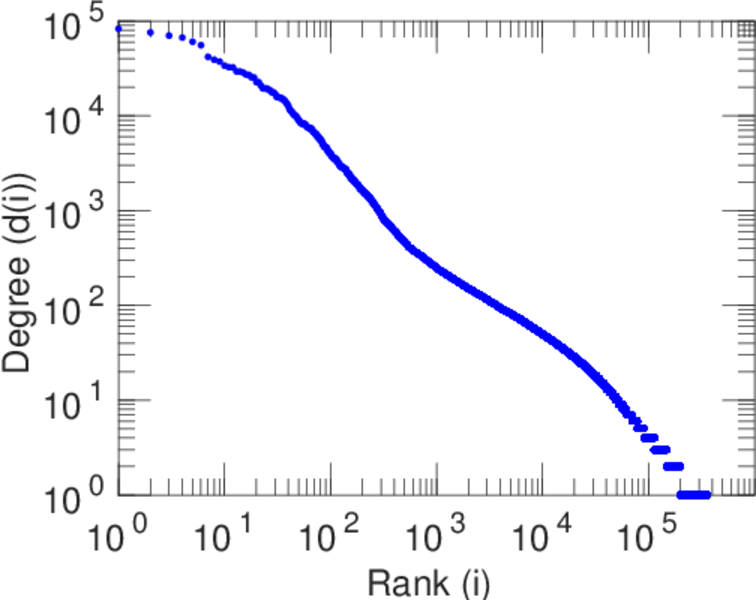
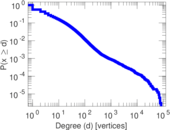
| Power law exponent | γ = | 2.546 21
|
| Tail power law exponent | γt = | 2.091 00
|
| Tail power law exponent with p | γ3 = | 2.091 00
|
| p-value | p = | 0.000 00
|
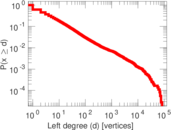
| Left tail power law exponent with p | γ3,1 = | 1.831 00
|
| Left p-value | p1 = | 0.000 00
|
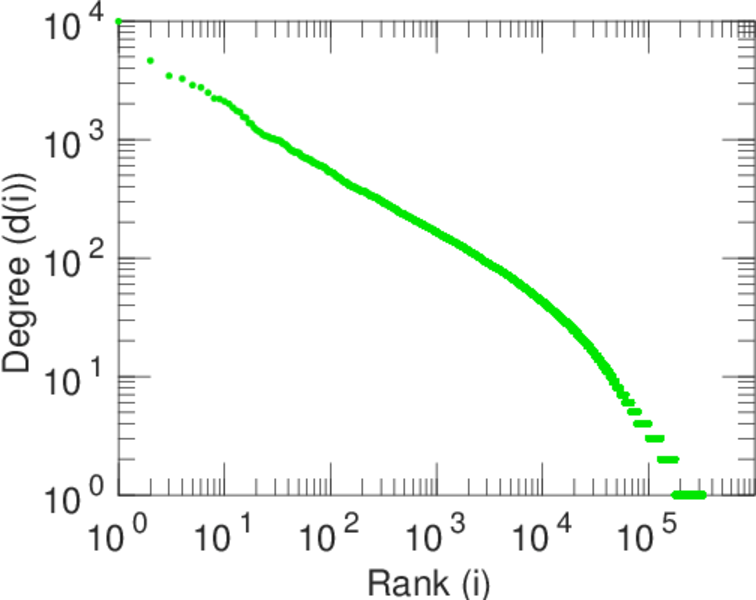
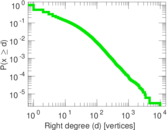
| Right tail power law exponent with p | γ3,2 = | 4.031 00
|
| Right p-value | p2 = | 0.928 000
|
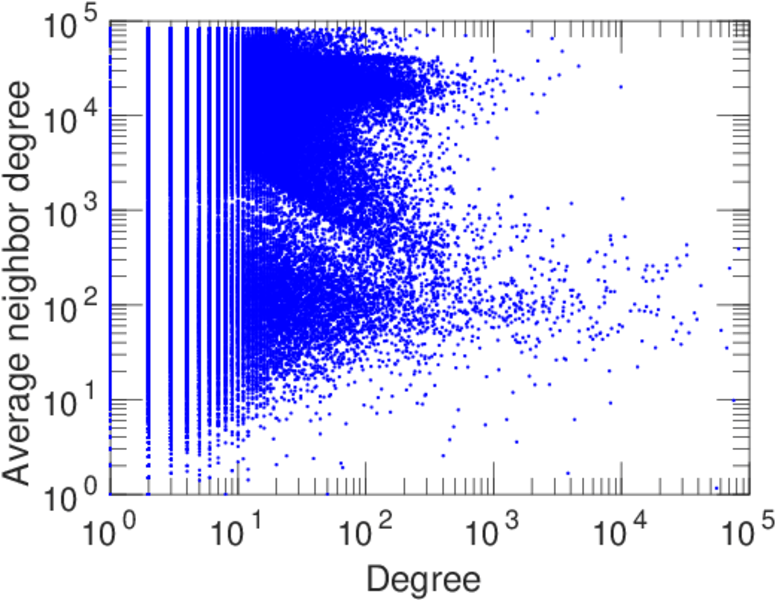
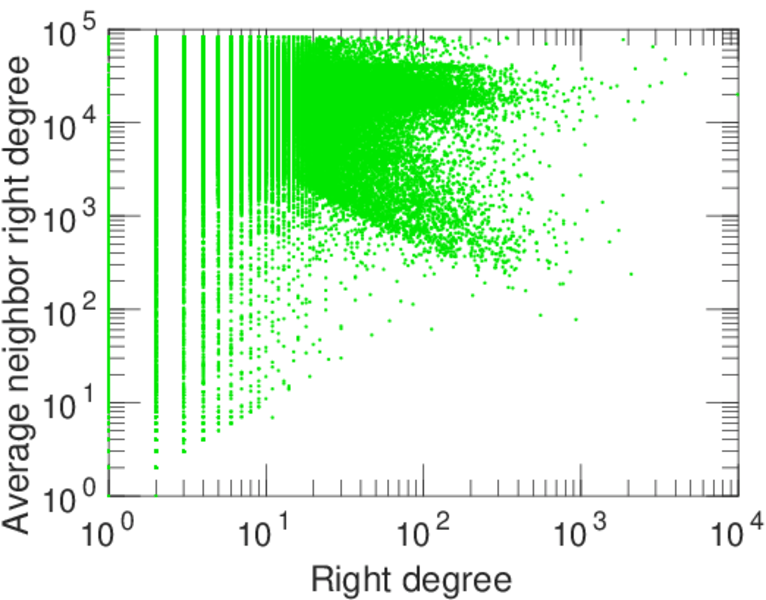
| Degree assortativity | ρ = | −0.242 073
|
| Degree assortativity p-value | pρ = | 0.000 00
|
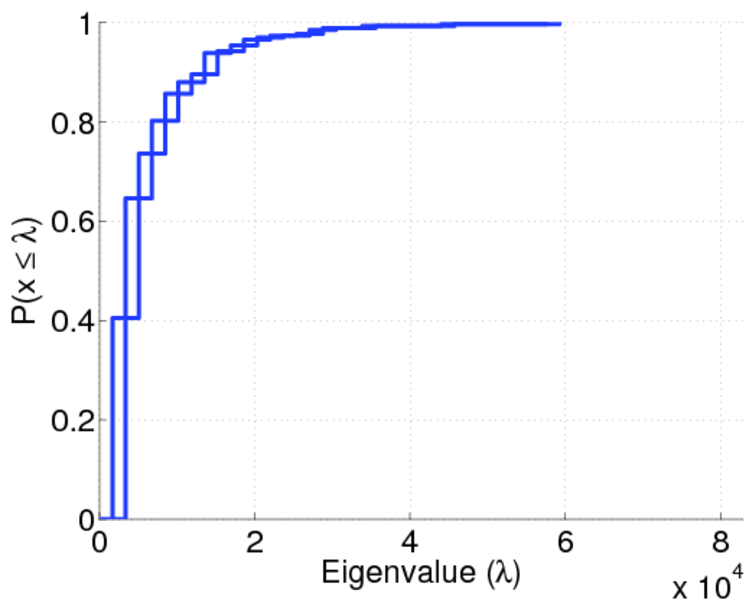
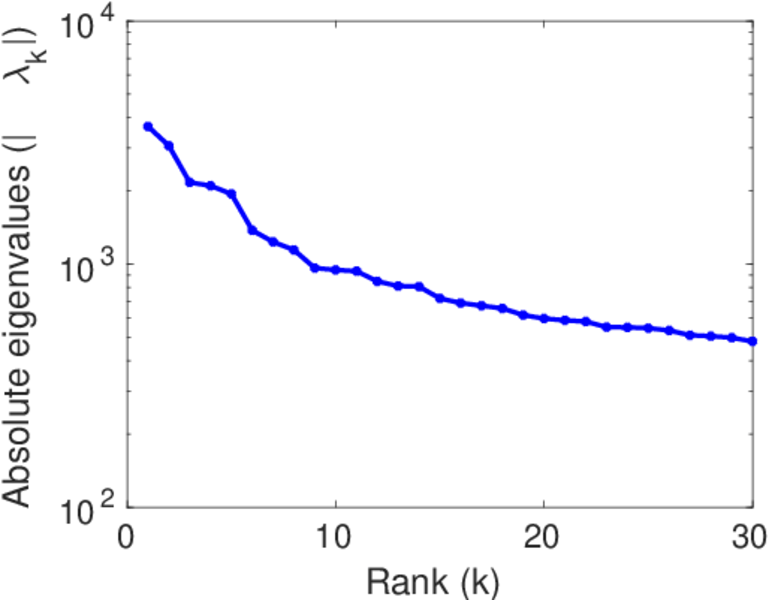
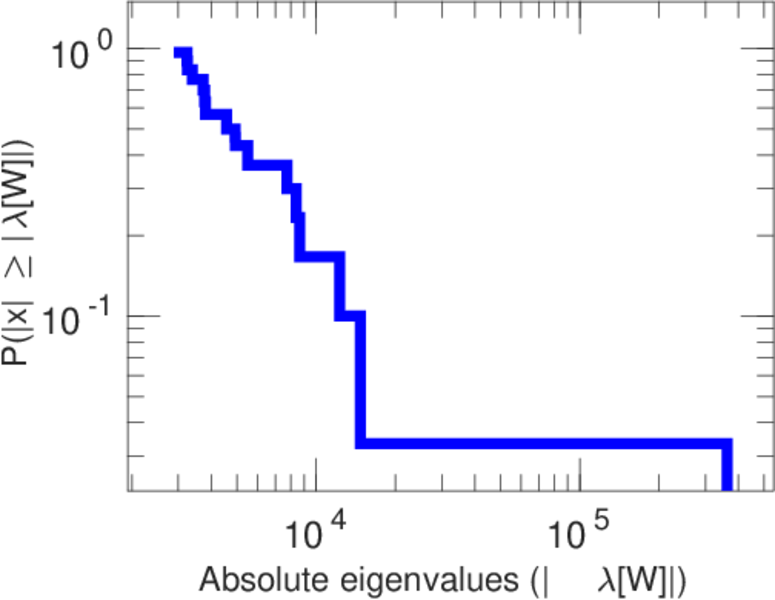
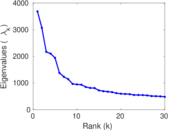
| Spectral norm | α = | 3,682.34
|
| Algebraic connectivity | a = | 0.043 677 2
|
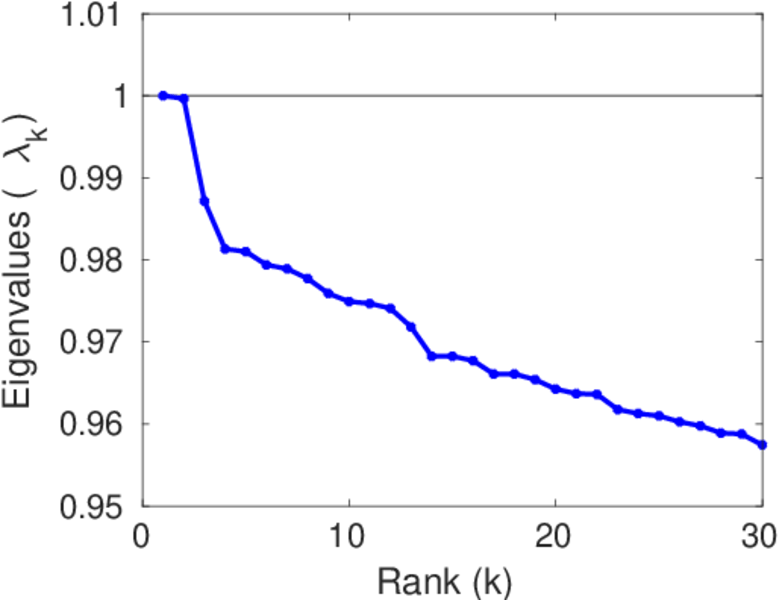
| Spectral separation | |λ1[A] / λ2[A]| = | 1.200 78
|
| Controllability | C = | 325,748
|
| Relative controllability | Cr = | 0.901 587
|
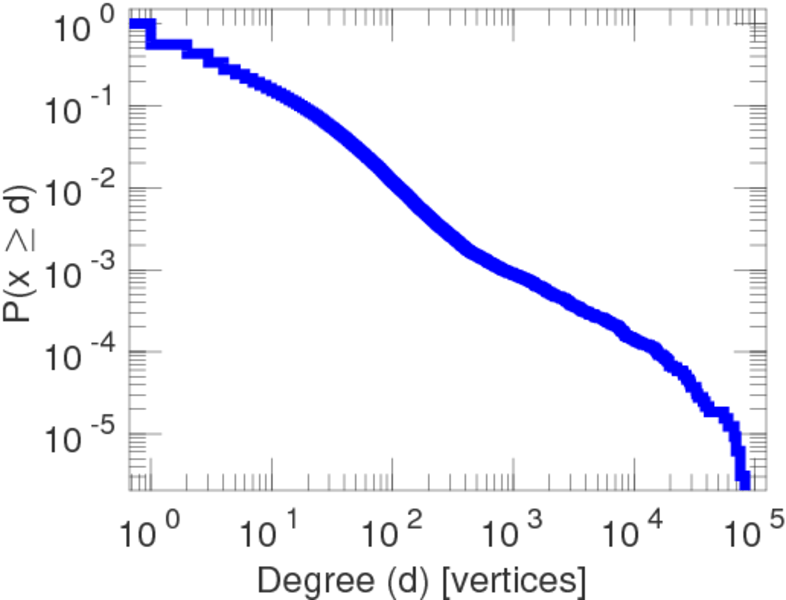
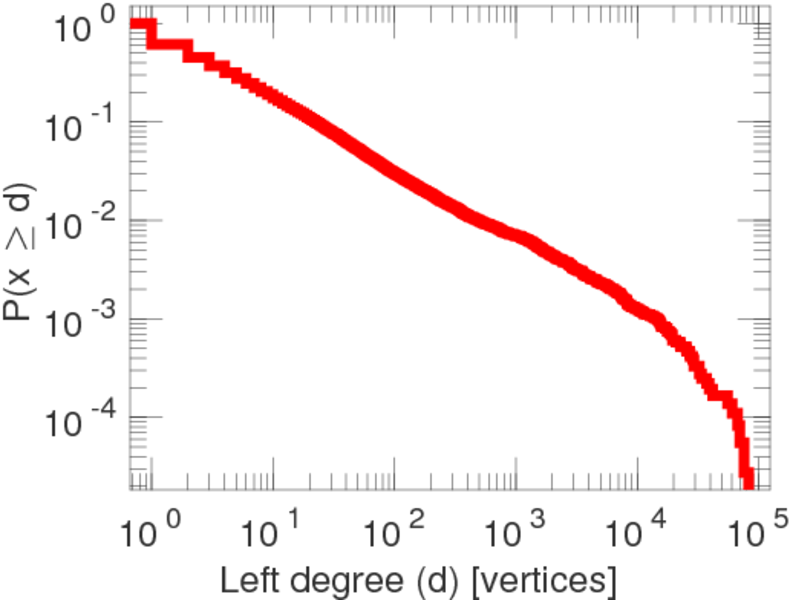
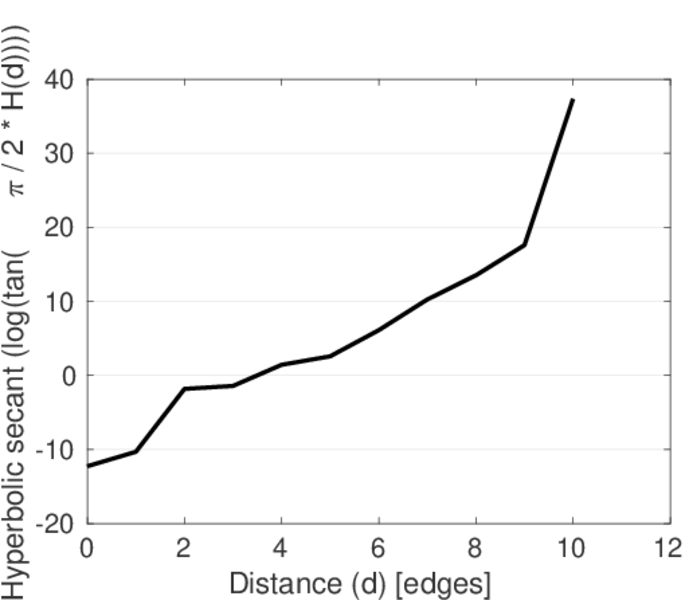
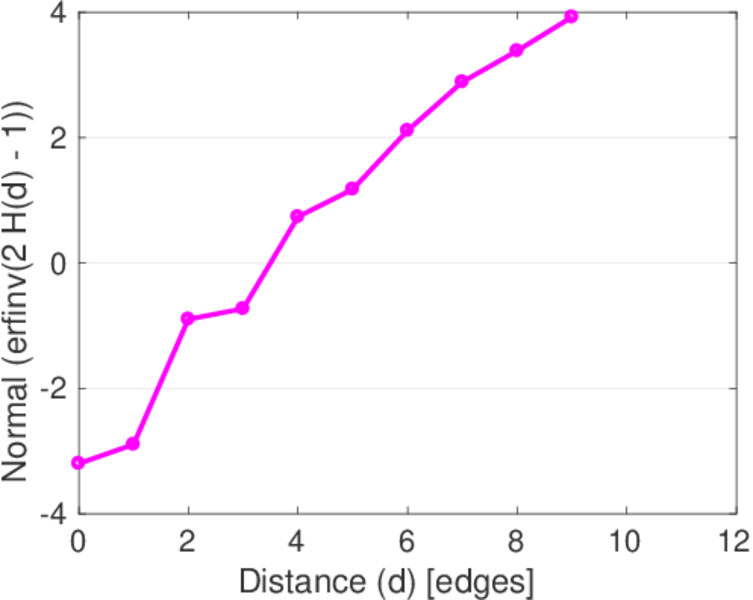
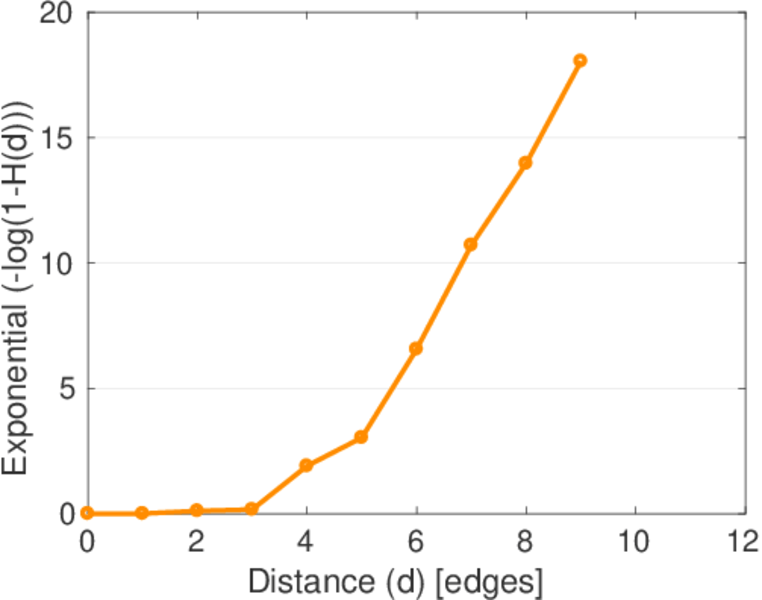
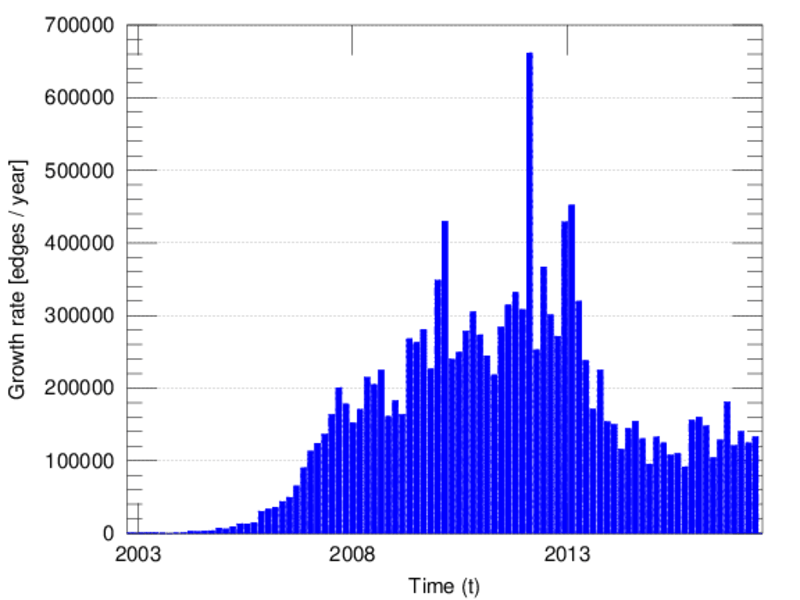
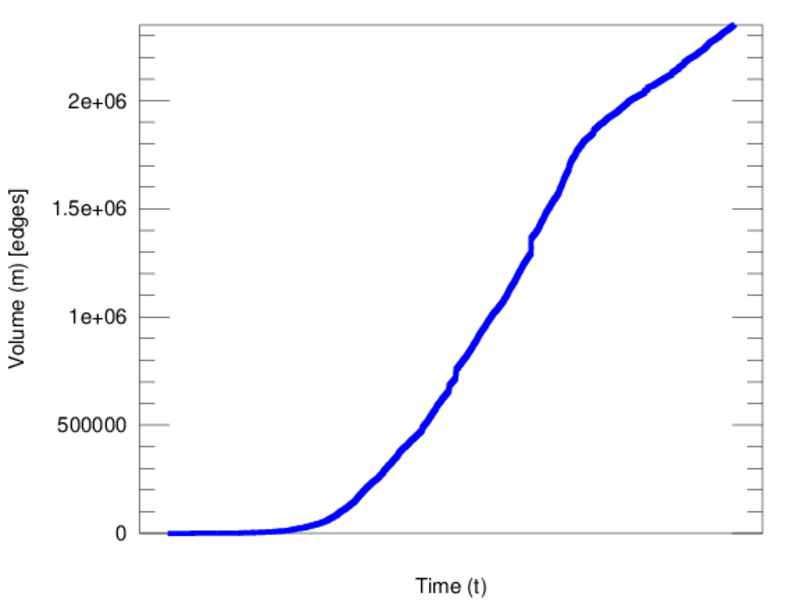
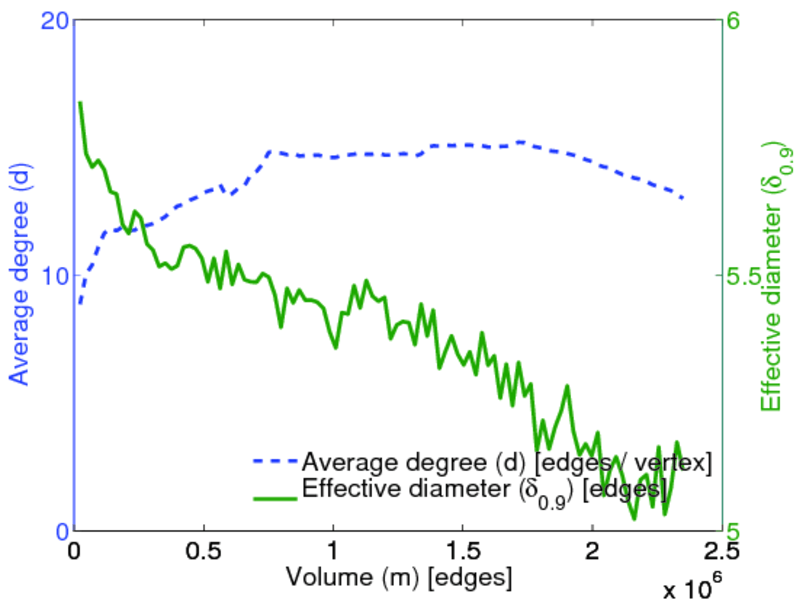
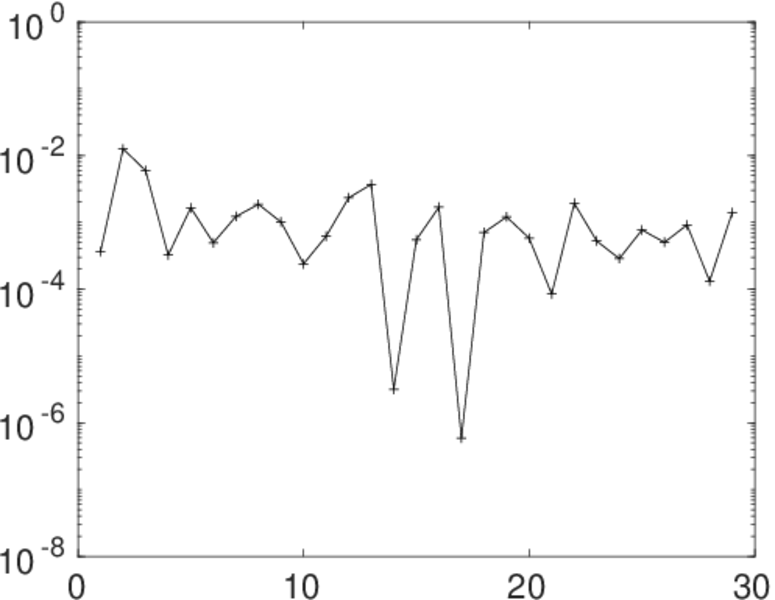
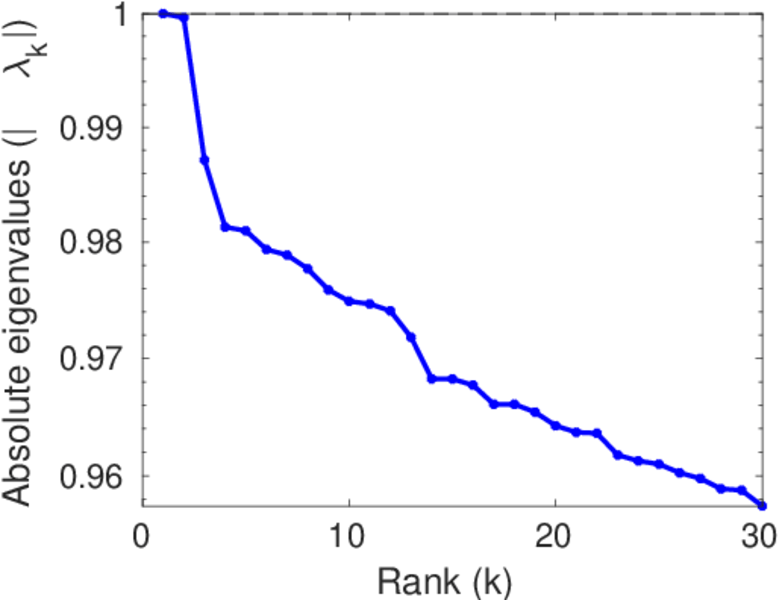
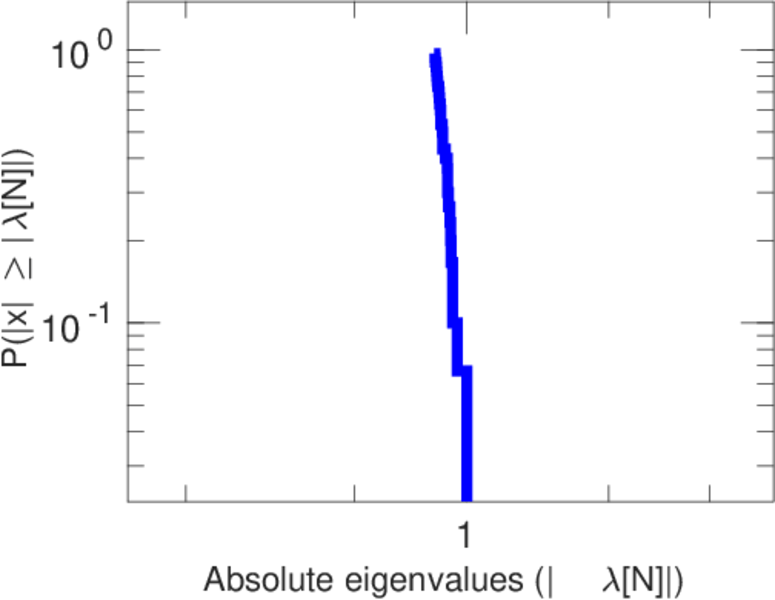
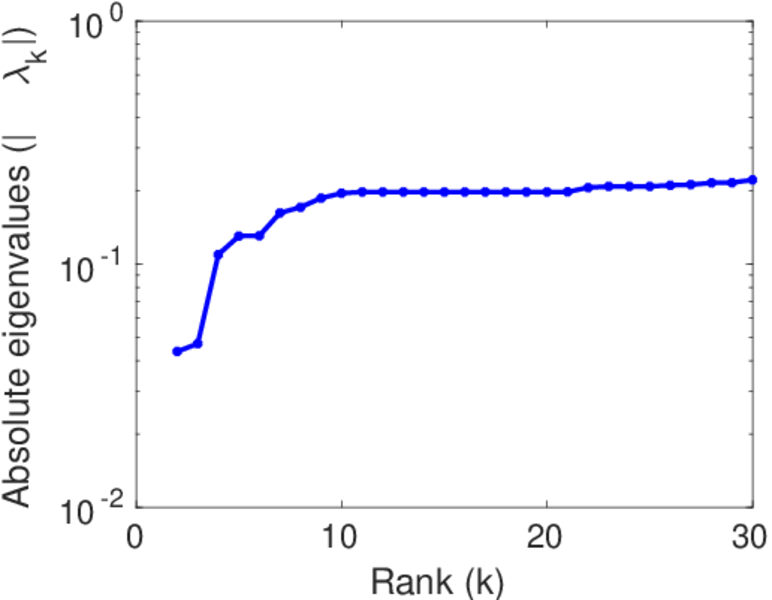
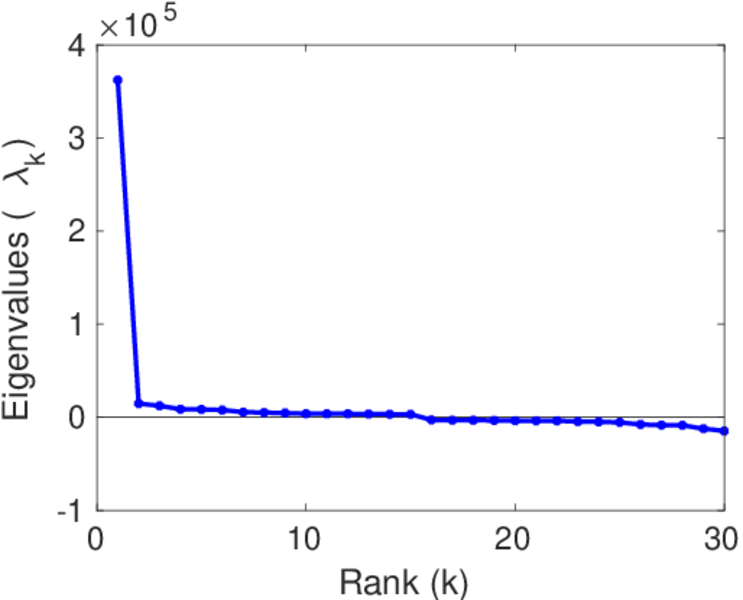
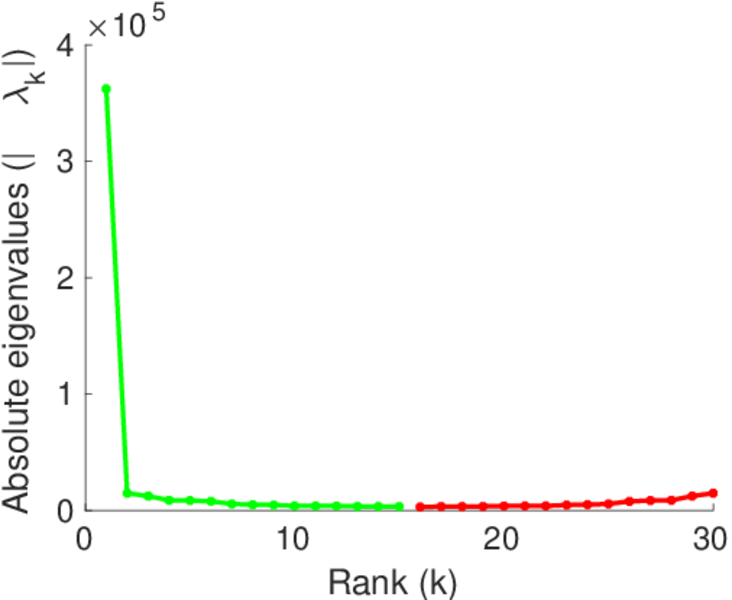
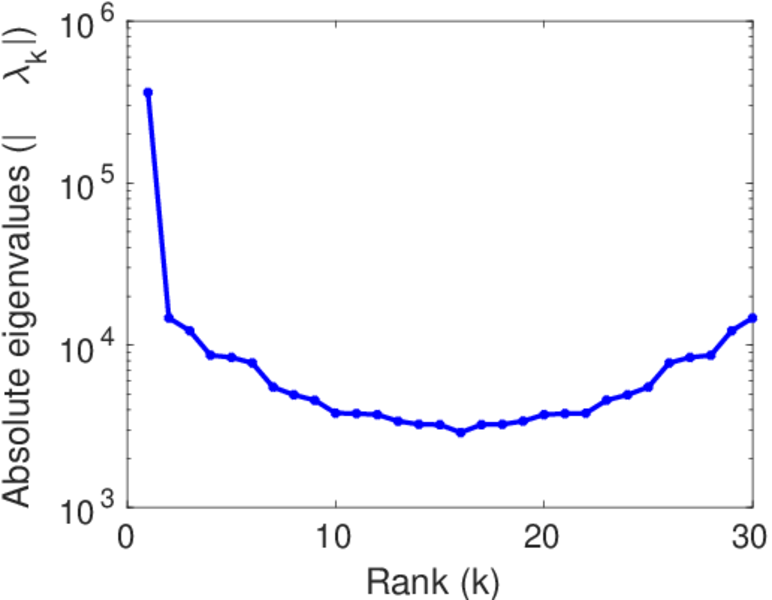
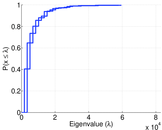
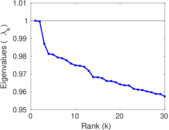
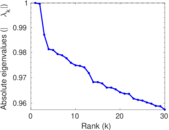
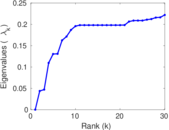
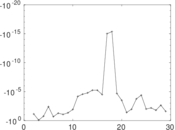
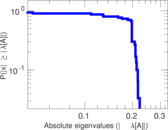
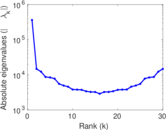
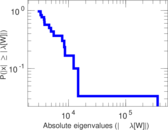
Plots


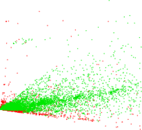
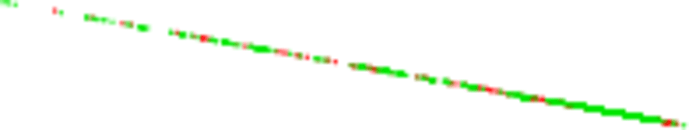
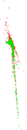


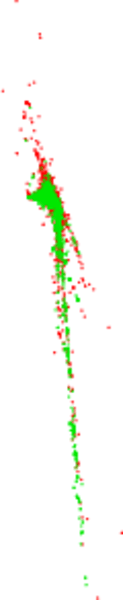
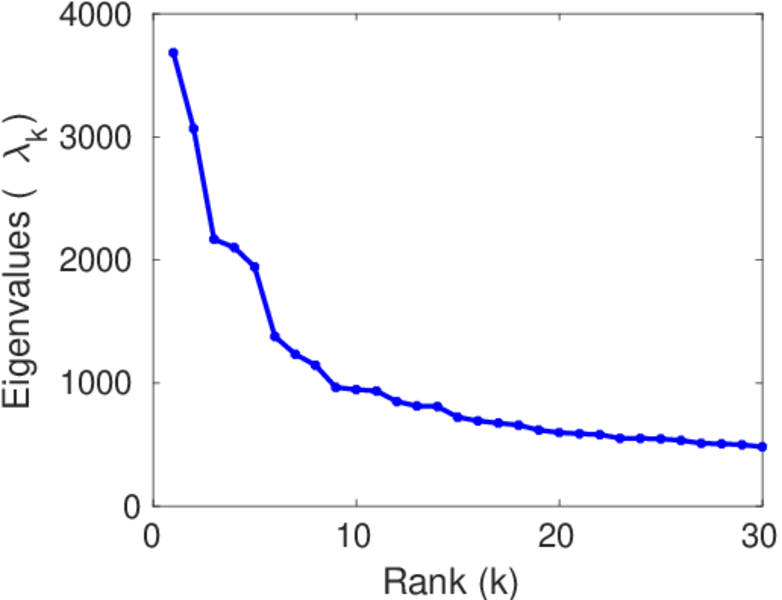
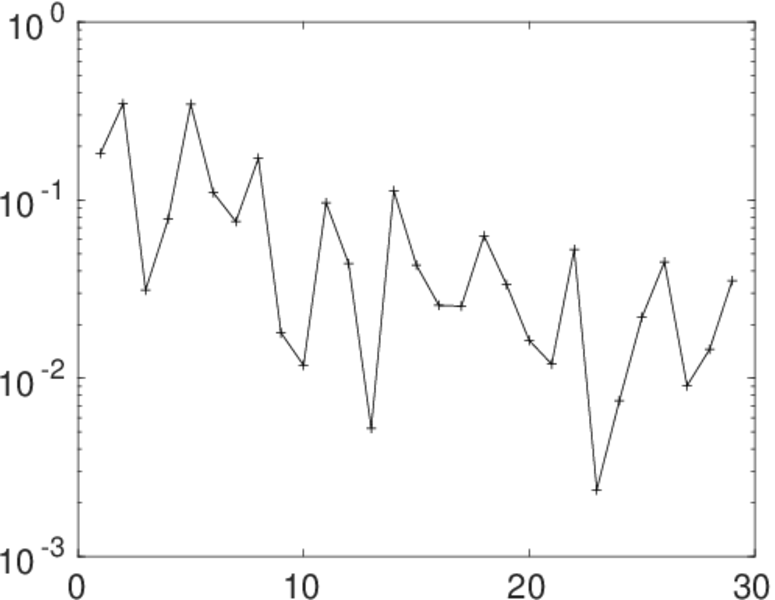
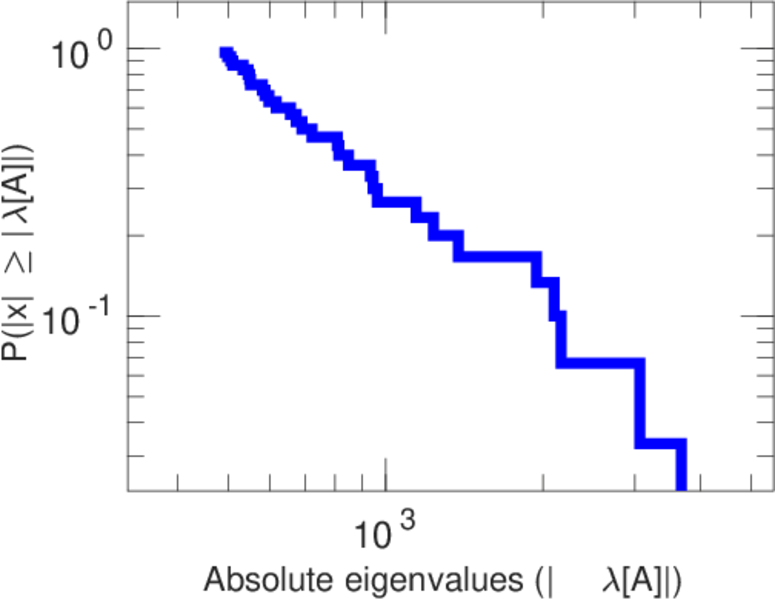
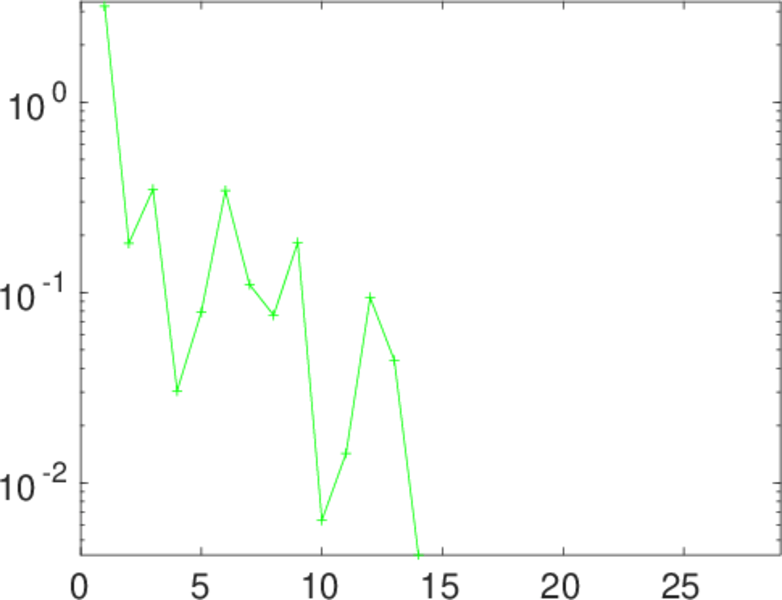
Matrix decompositions plots


Downloads
References
|
[1]
|
Jérôme Kunegis.
KONECT – The Koblenz Network Collection.
In Proc. Int. Conf. on World Wide Web Companion, pages
1343–1350, 2013.
[ http ]
|
|
[2]
|
Wikimedia Foundation.
Wikimedia downloads.
http://dumps.wikimedia.org/, January 2010.
|
 KONECT ‣ Networks ‣
Buy Me a Coffee
KONECT ‣ Networks ‣
Buy Me a Coffee