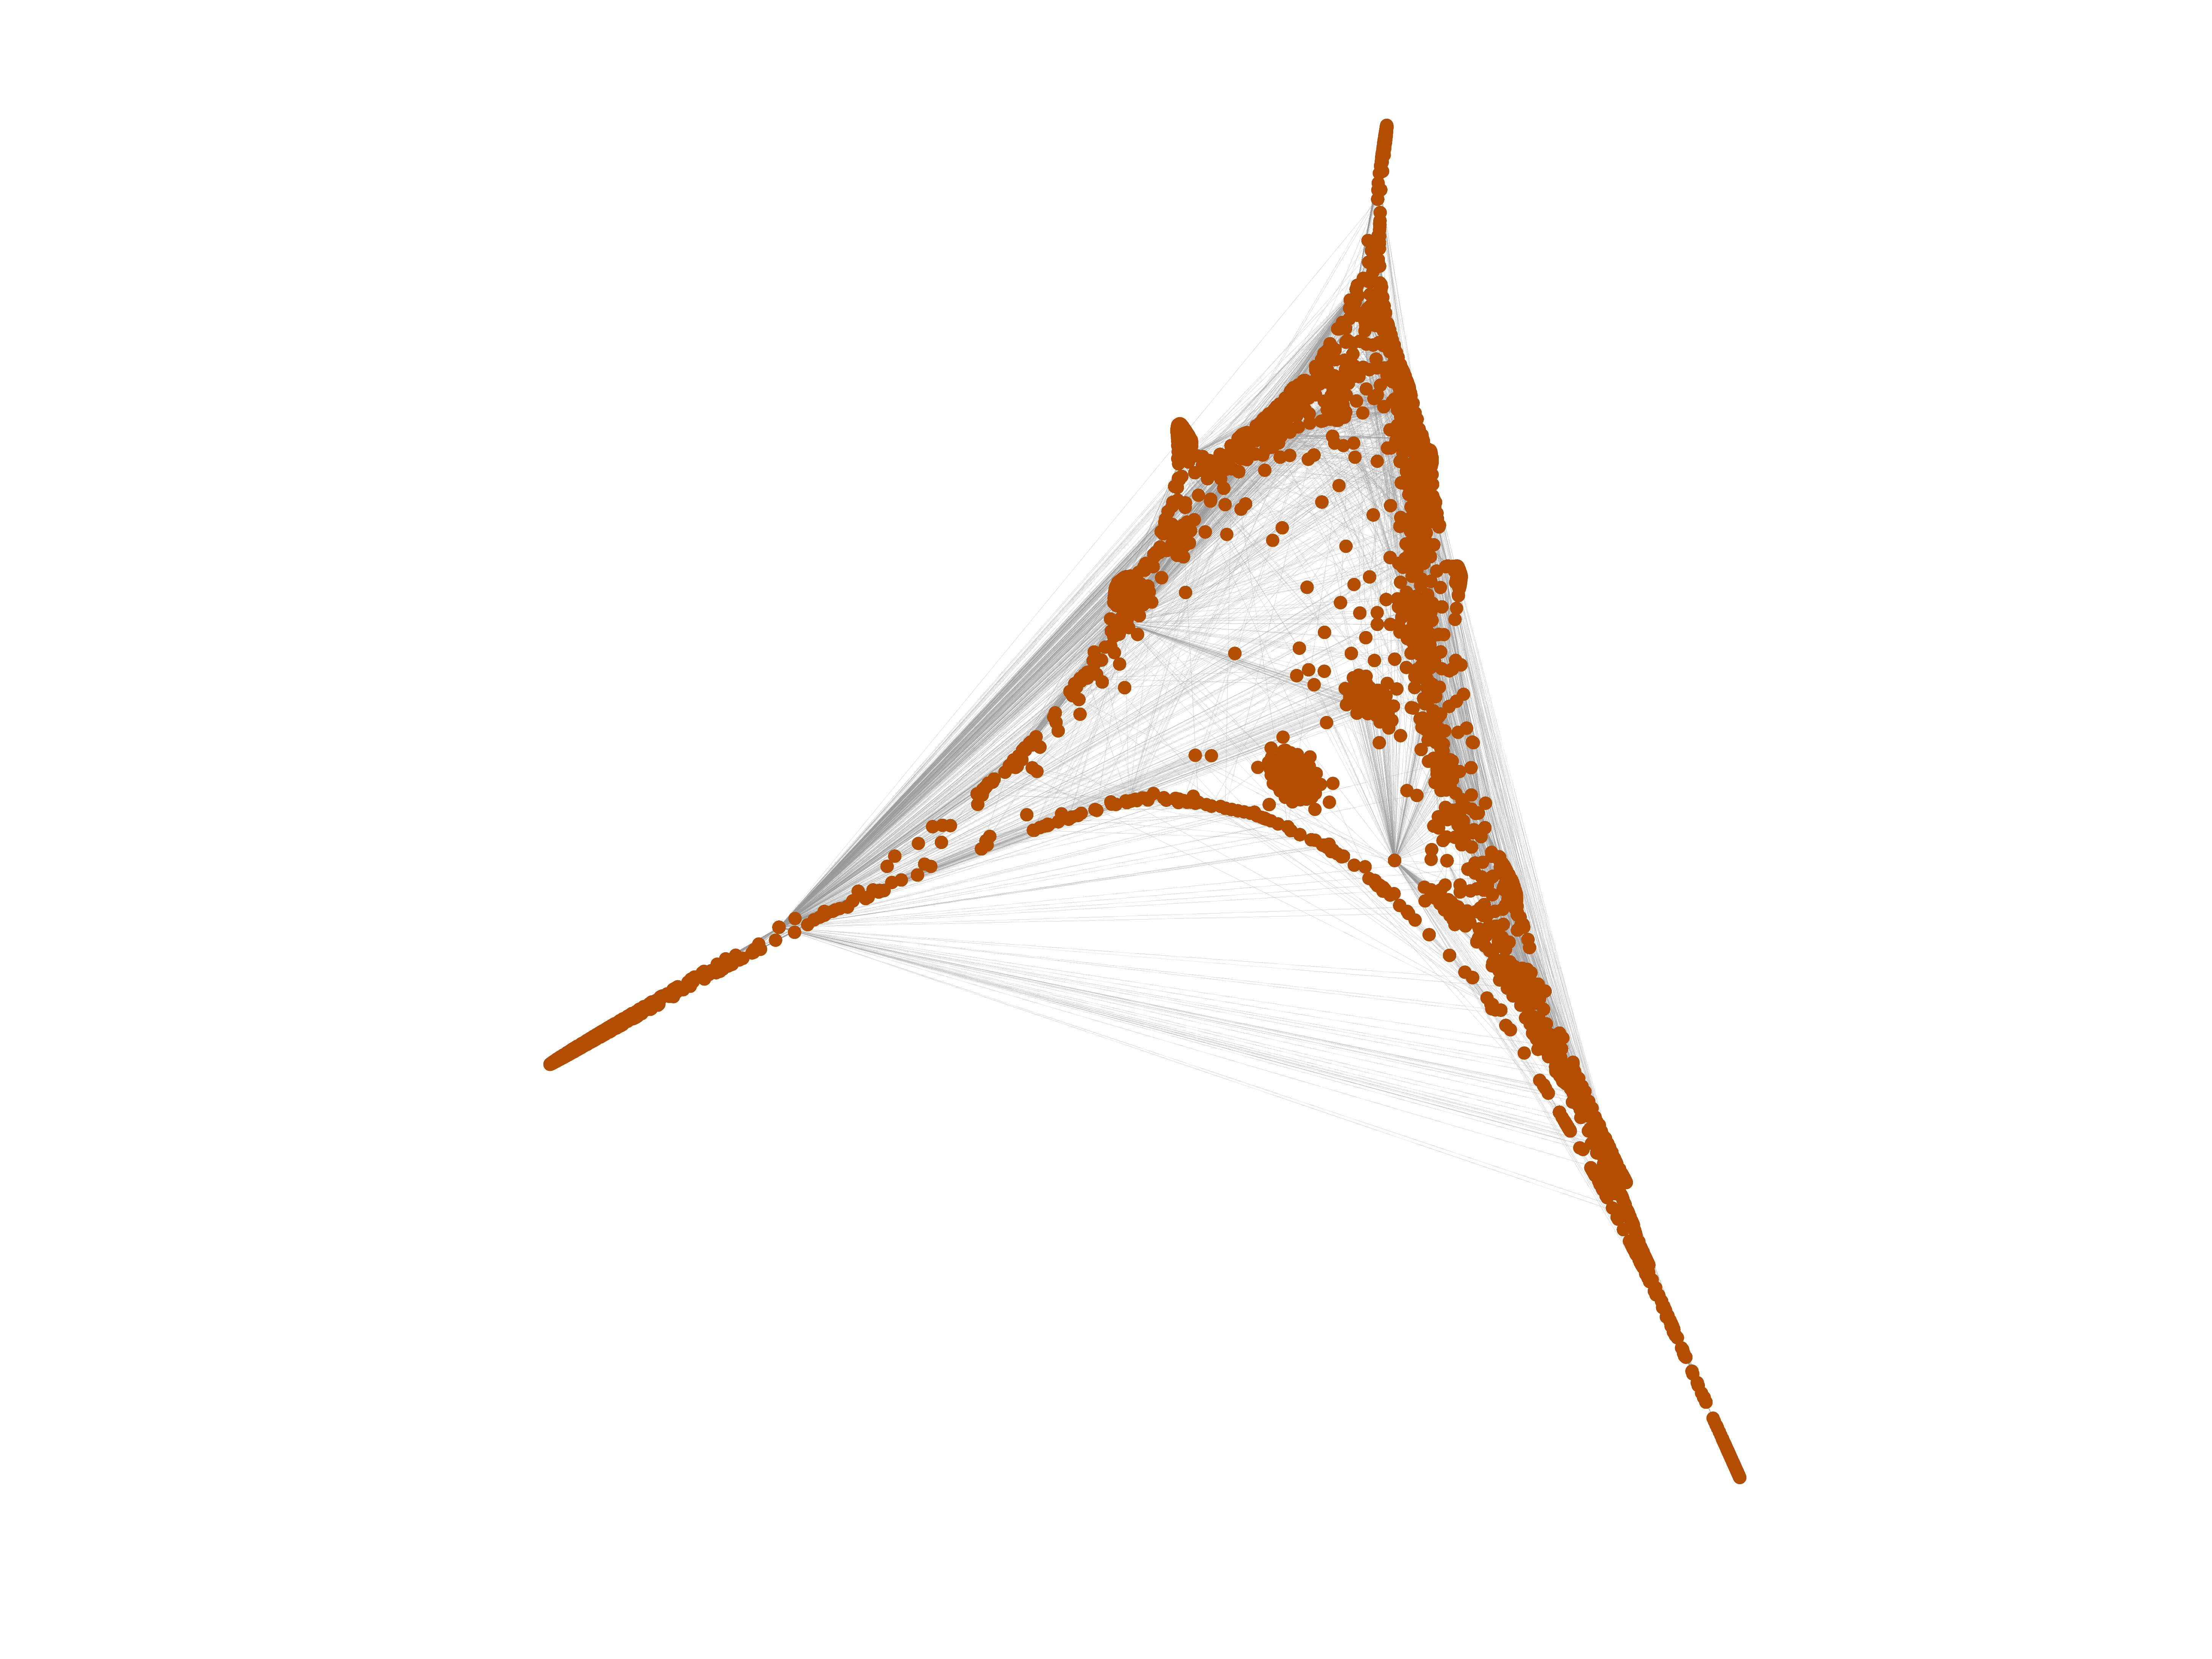
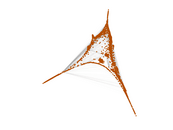
Wikibooks edits (ml)
This is the bipartite edit network of the Malayalam Wikibooks. It contains
users and pages from the Malayalam Wikibooks, connected by edit events. Each
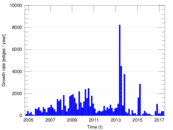
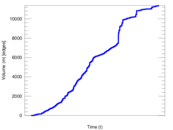
edge represents an edit. The dataset includes the timestamp of each edit.
Metadata
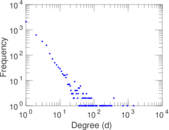
Statistics
| Size | n = | 3,955
|
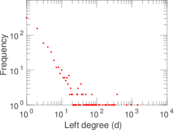
| Left size | n1 = | 783
|
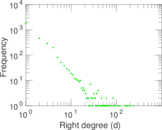
| Right size | n2 = | 3,172
|
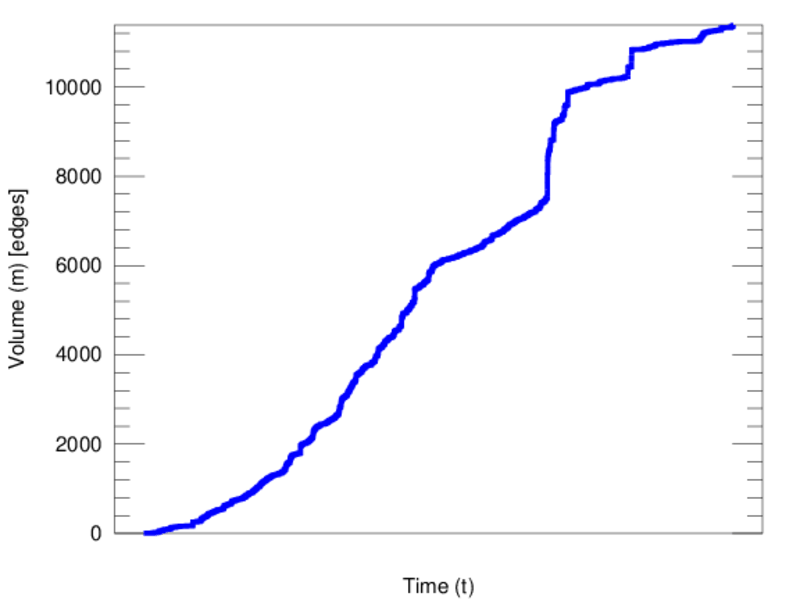
| Volume | m = | 11,388
|
| Unique edge count | m̿ = | 6,289
|
| Wedge count | s = | 954,351
|
| Claw count | z = | 245,611,330
|
| Cross count | x = | 60,829,298,332
|
| Square count | q = | 64,532
|
| 4-Tour count | T4 = | 4,351,694
|
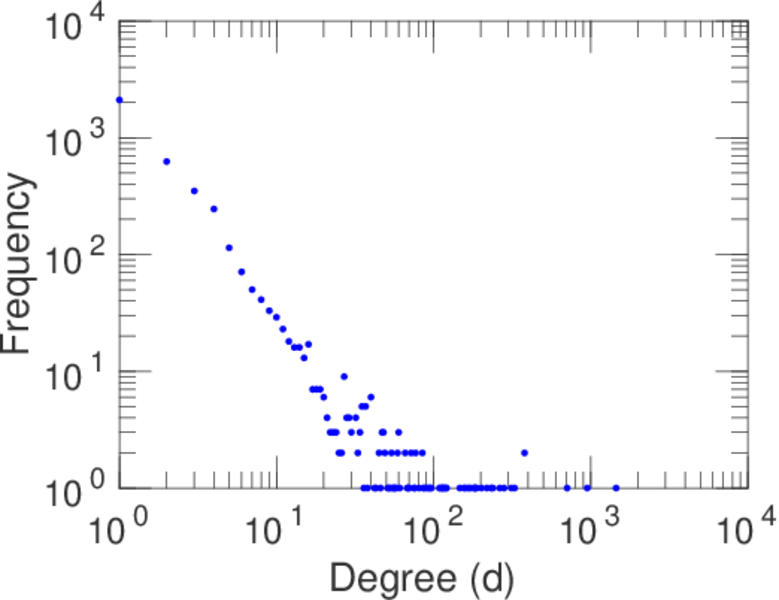
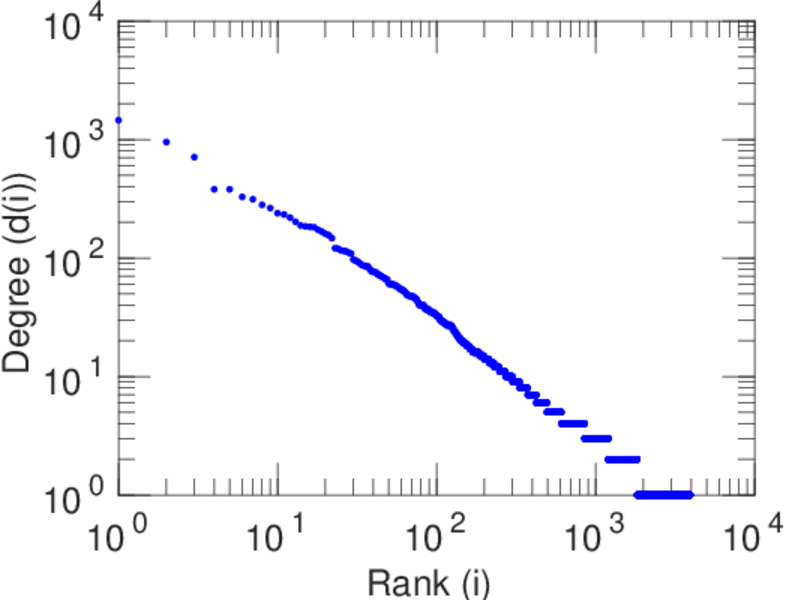
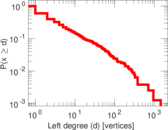
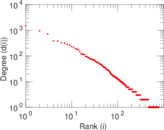
| Maximum degree | dmax = | 1,454
|
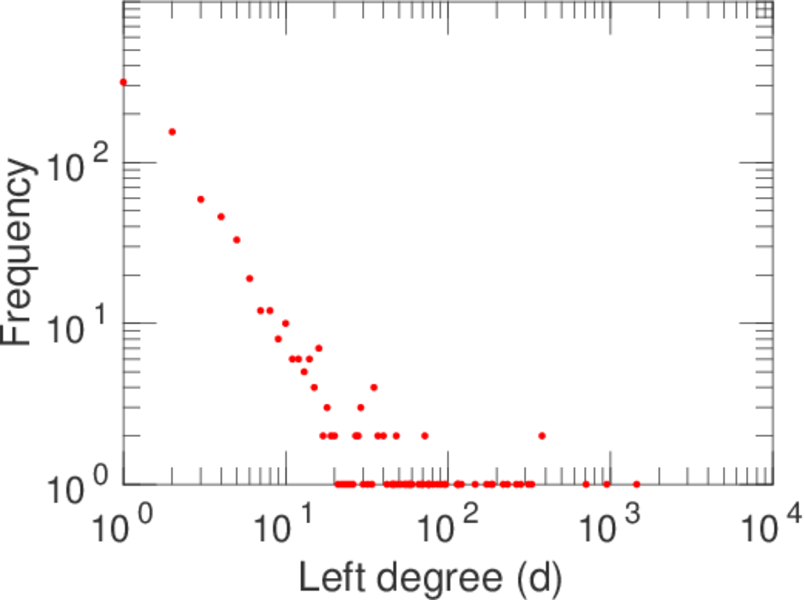
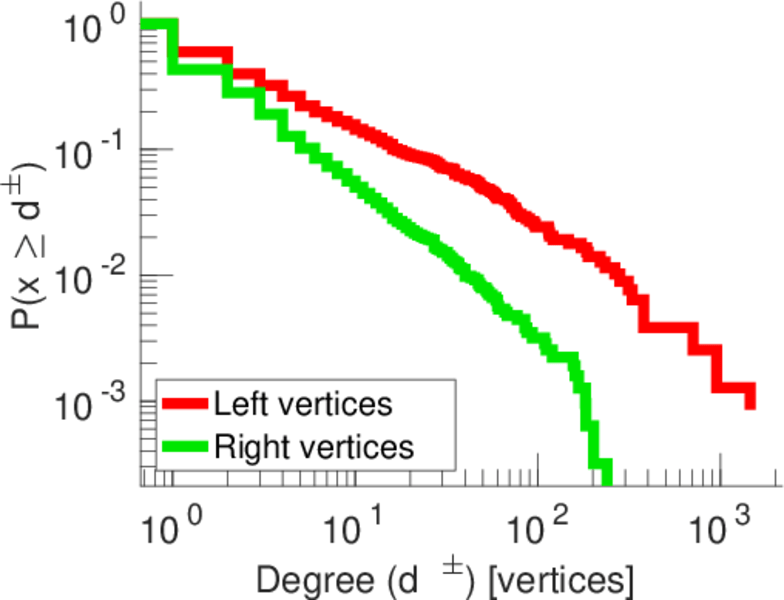
| Maximum left degree | d1max = | 1,454
|
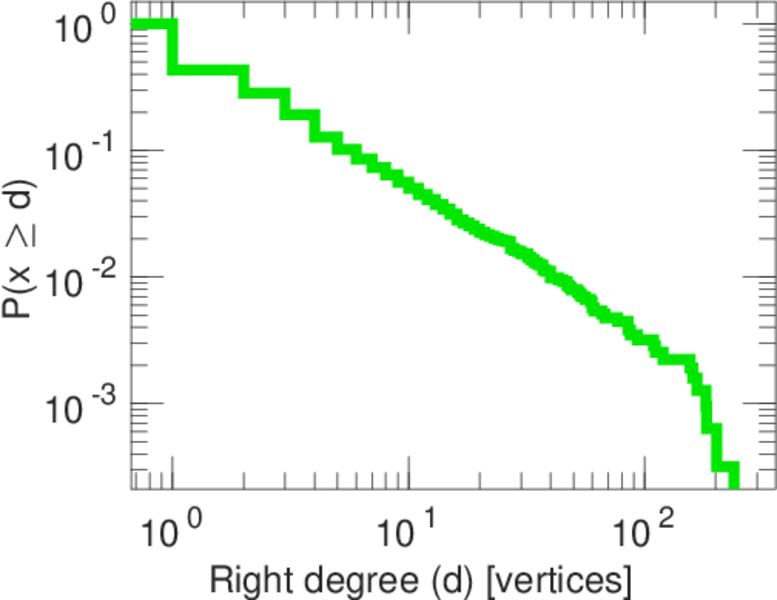
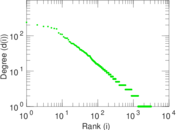
| Maximum right degree | d2max = | 239
|
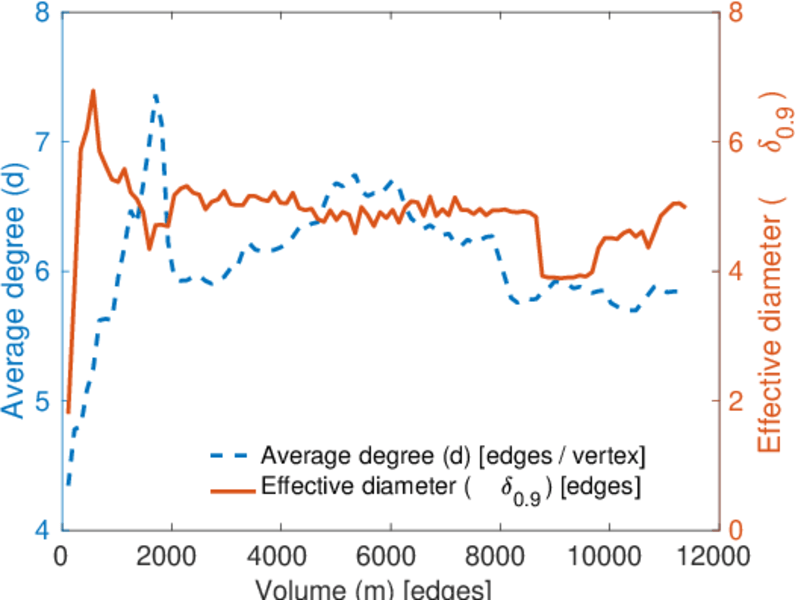
| Average degree | d = | 5.758 79
|
| Average left degree | d1 = | 14.544 1
|
| Average right degree | d2 = | 3.590 16
|
| Fill | p = | 0.002 532 13
|
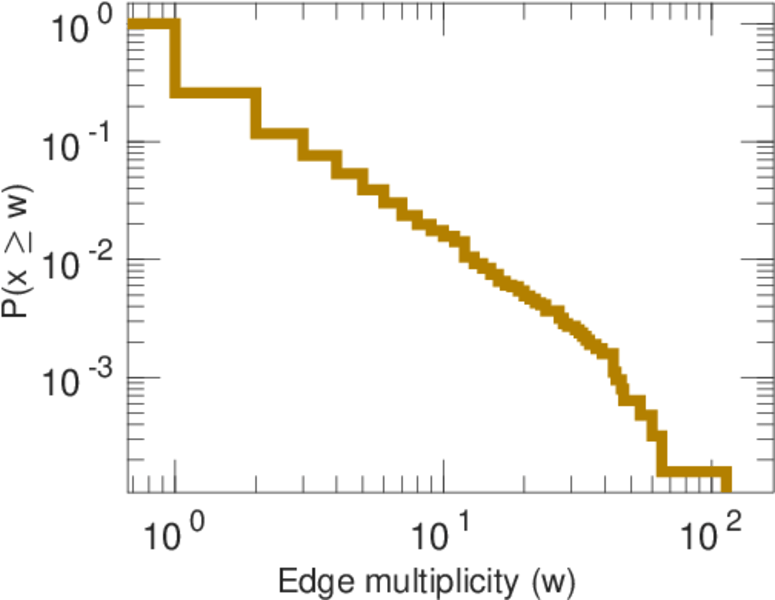
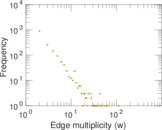
| Average edge multiplicity | m̃ = | 1.810 78
|
| Size of LCC | N = | 3,744
|
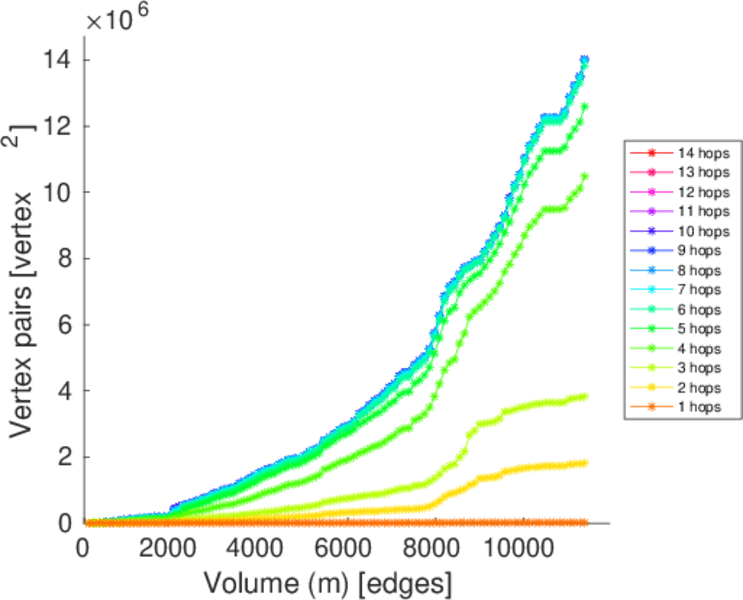
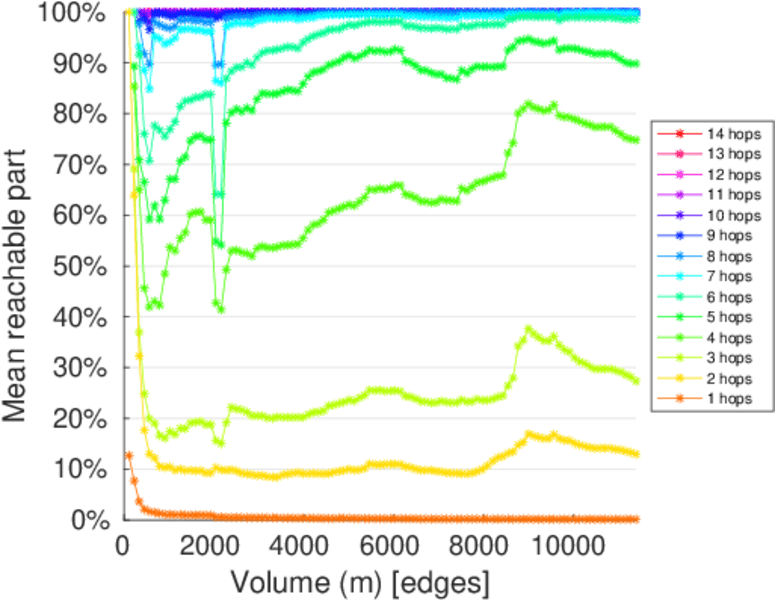
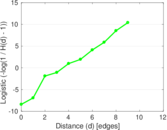
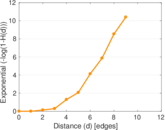
| Diameter | δ = | 12
|
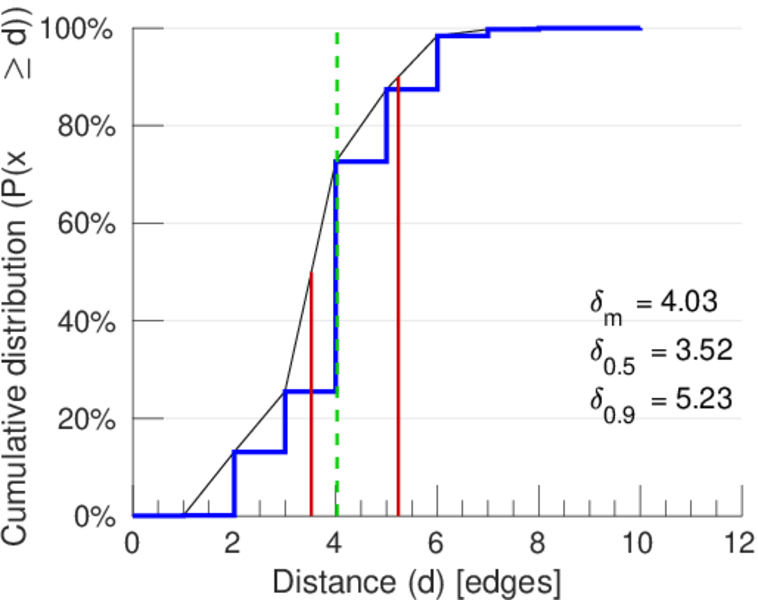
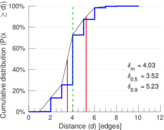
| 50-Percentile effective diameter | δ0.5 = | 3.519 82
|
| 90-Percentile effective diameter | δ0.9 = | 5.233 99
|
| Median distance | δM = | 4
|
| Mean distance | δm = | 4.030 97
|
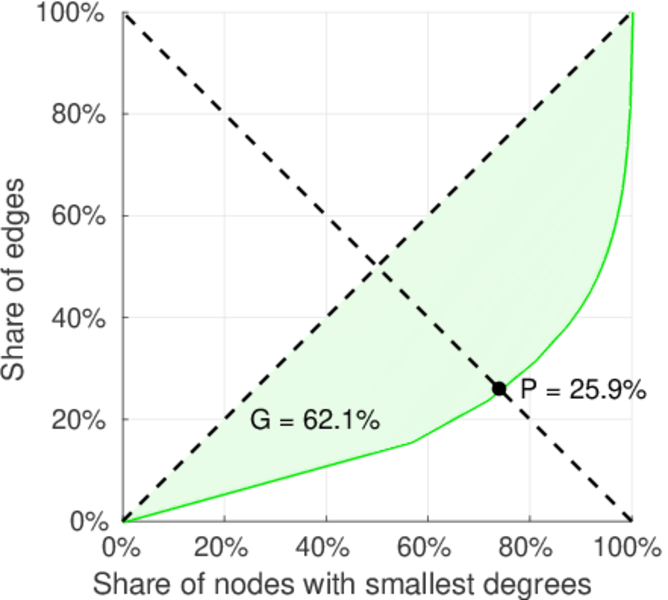
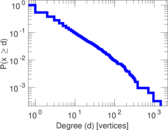
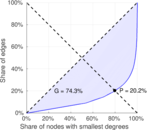
| Gini coefficient | G = | 0.756 760
|
| Balanced inequality ratio | P = | 0.196 567
|
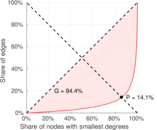
| Left balanced inequality ratio | P1 = | 0.141 201
|
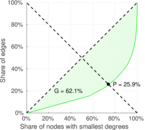
| Right balanced inequality ratio | P2 = | 0.258 781
|
| Relative edge distribution entropy | Her = | 0.807 893
|
| Power law exponent | γ = | 3.302 66
|
| Tail power law exponent | γt = | 2.051 00
|
| Tail power law exponent with p | γ3 = | 2.051 00
|
| p-value | p = | 0.409 000
|
| Left tail power law exponent with p | γ3,1 = | 1.891 00
|
| Left p-value | p1 = | 0.666 000
|
| Right tail power law exponent with p | γ3,2 = | 2.761 00
|
| Right p-value | p2 = | 0.000 00
|
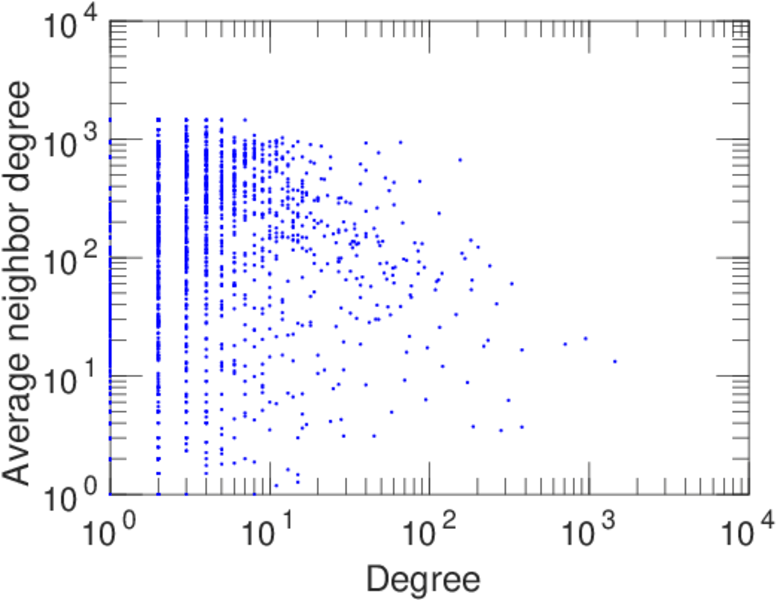
| Degree assortativity | ρ = | −0.276 632
|
| Degree assortativity p-value | pρ = | 7.469 97 × 10−111
|
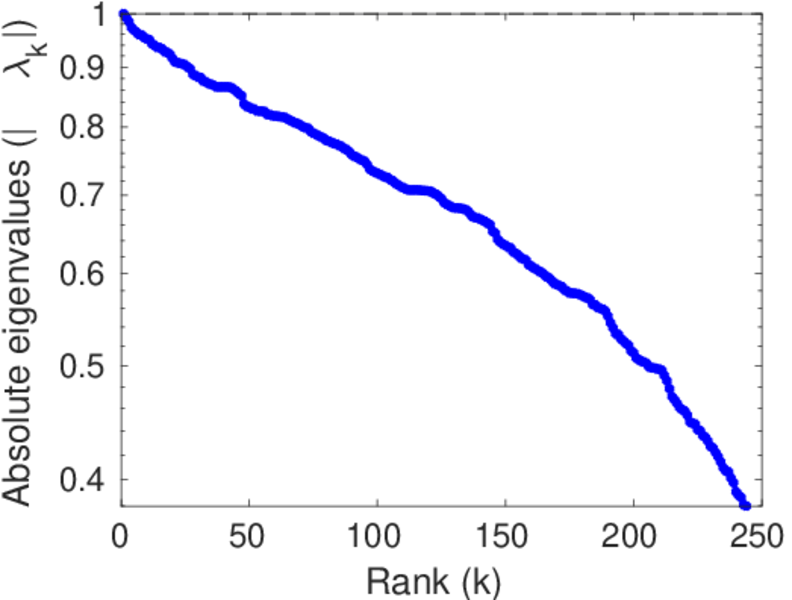
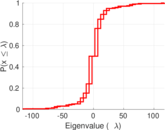
| Spectral norm | α = | 117.223
|
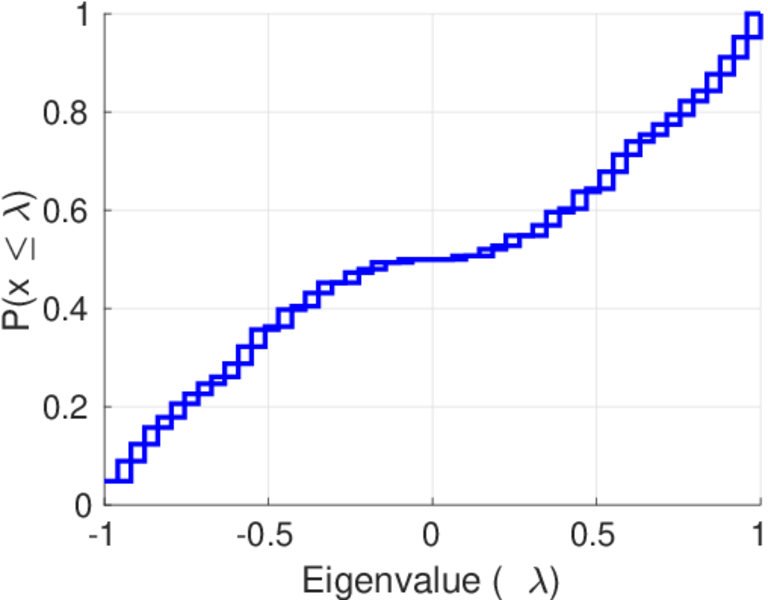
| Algebraic connectivity | a = | 0.031 642 3
|
| Spectral separation | |λ1[A] / λ2[A]| = | 1.076 65
|
| Controllability | C = | 3,154
|
| Relative controllability | Cr = | 0.801 932
|
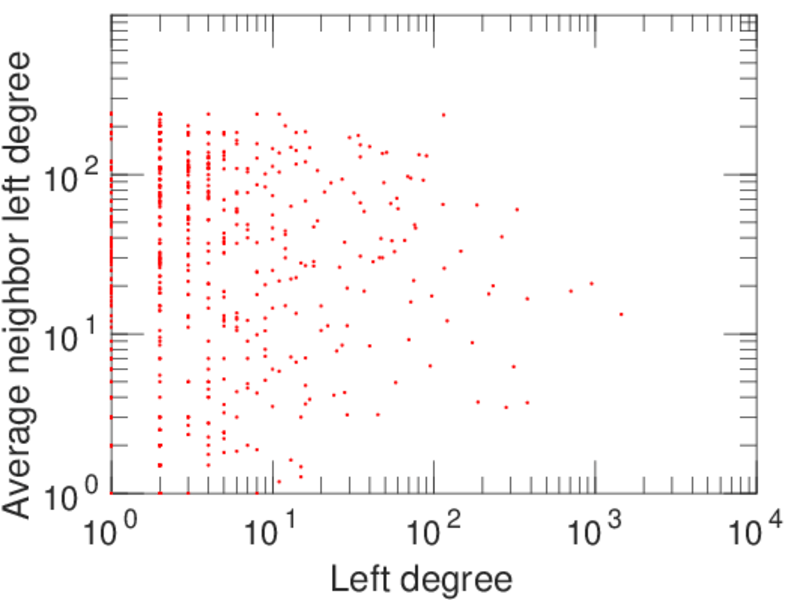
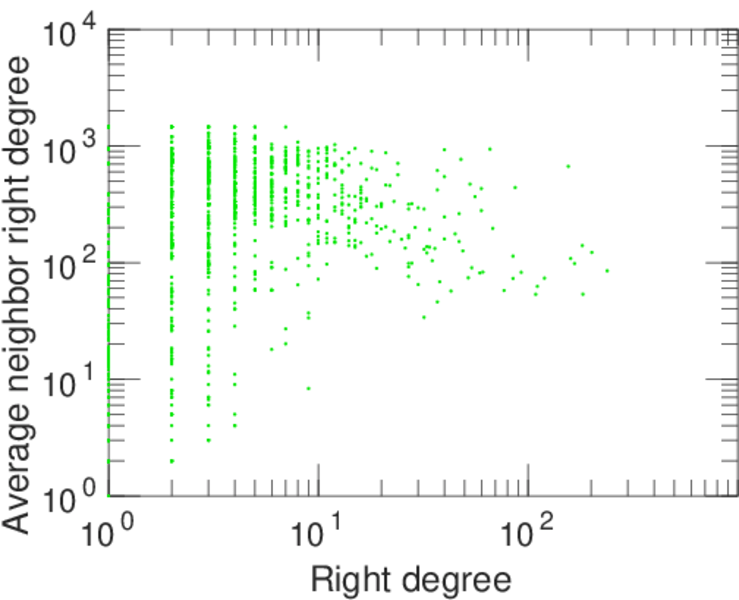
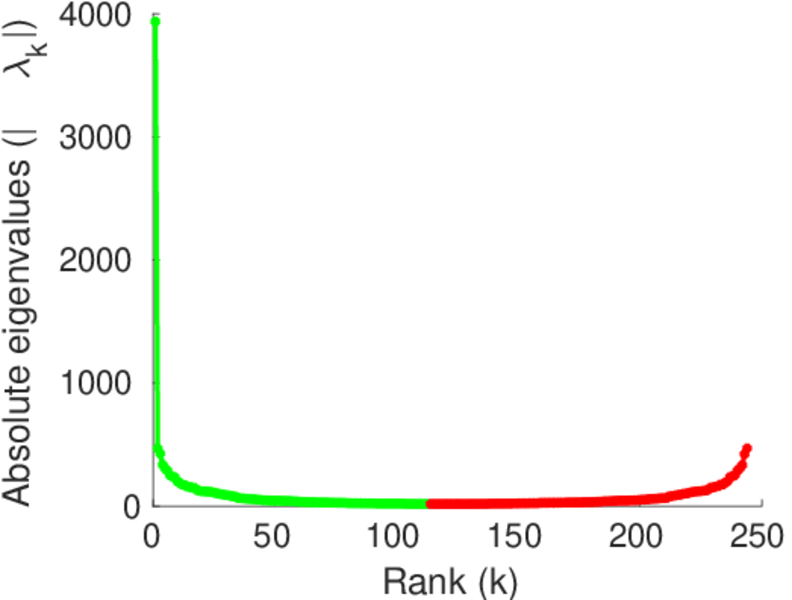
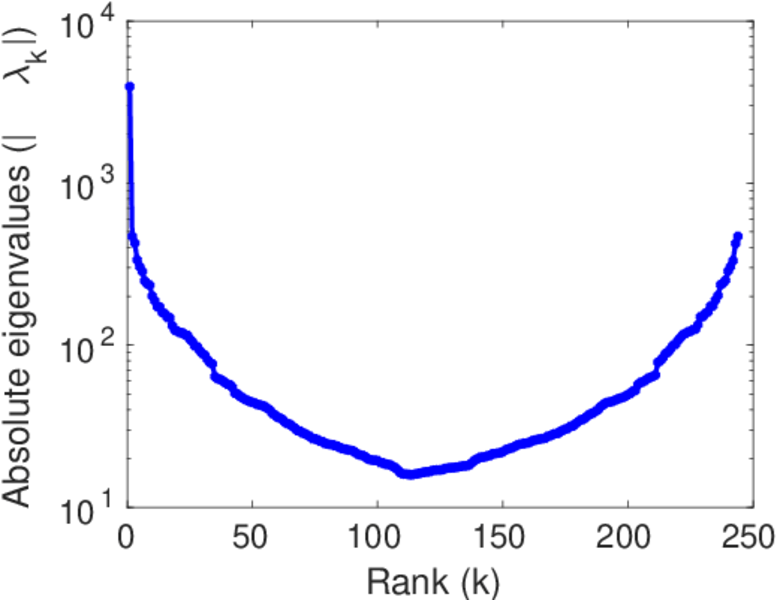
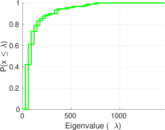
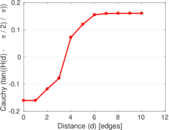
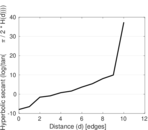
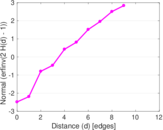
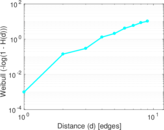
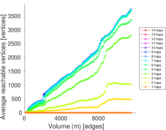
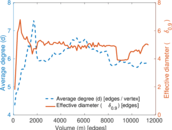
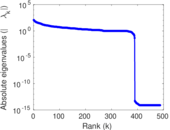
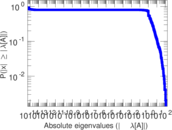
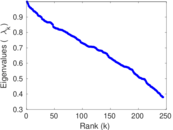
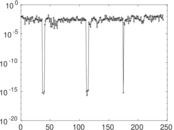
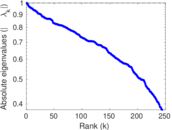
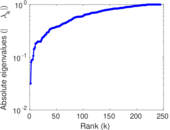
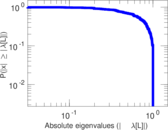
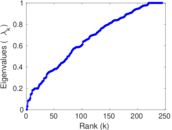
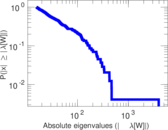
Plots


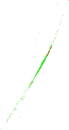
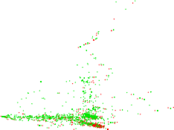


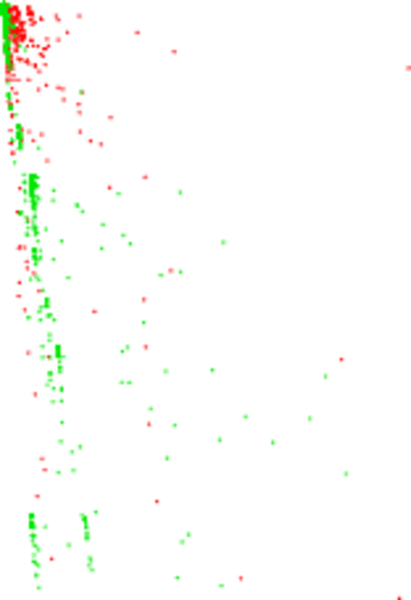
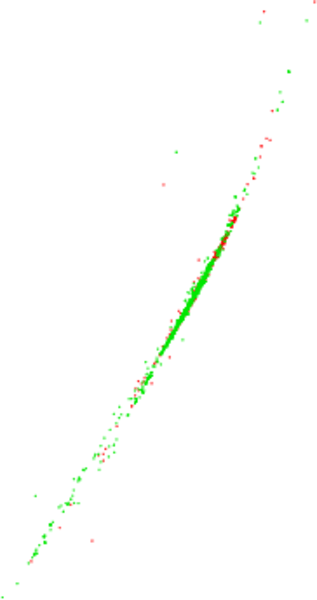
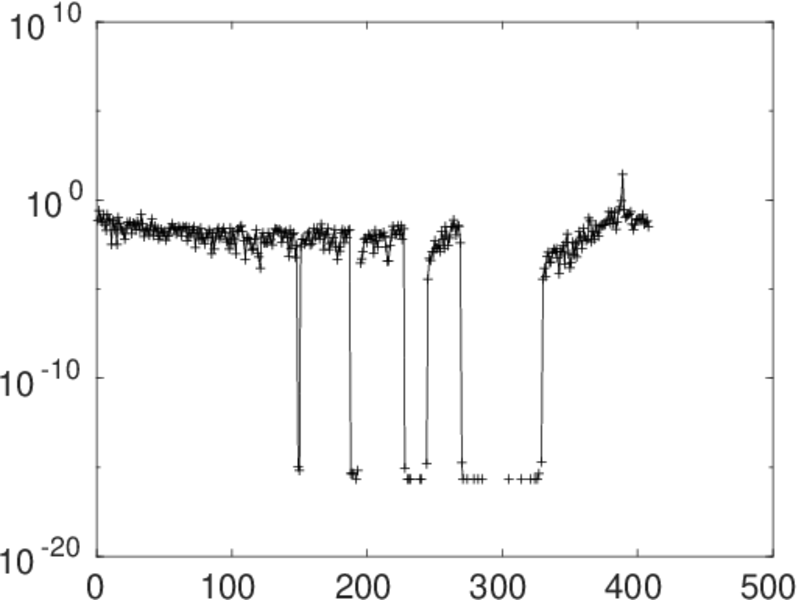
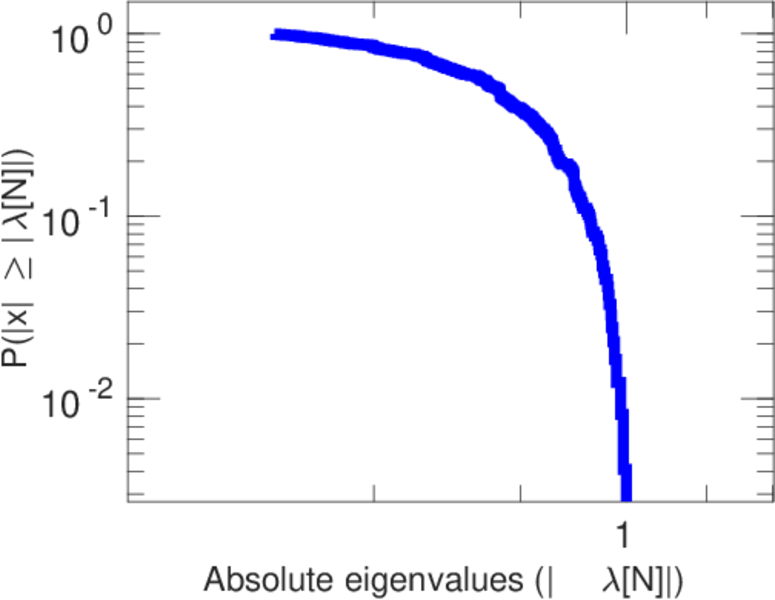
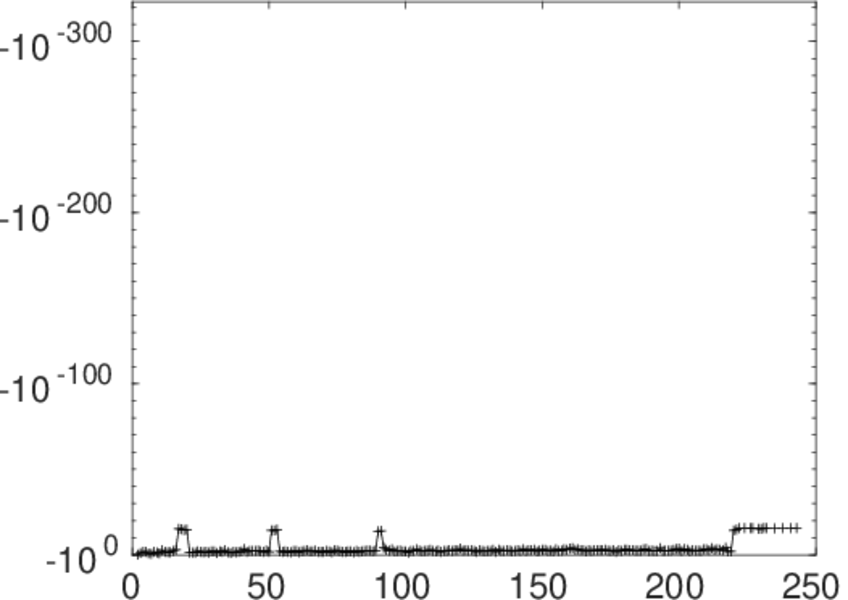
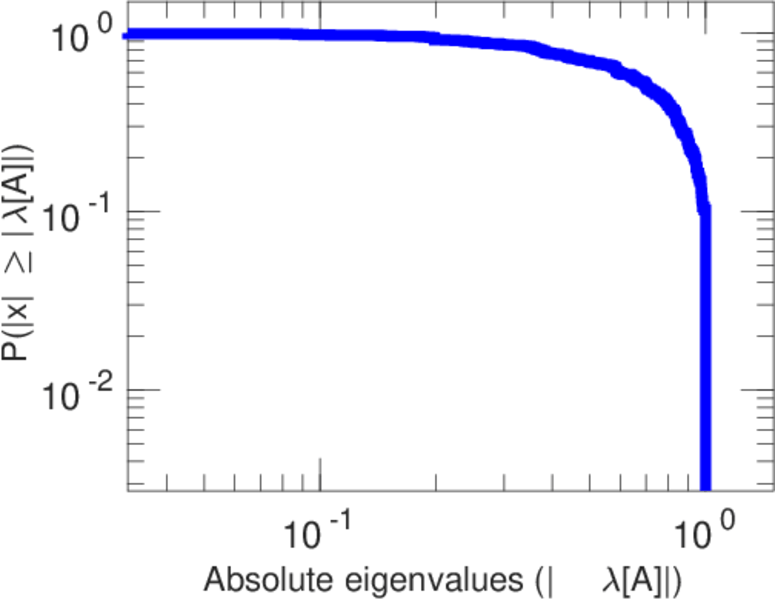
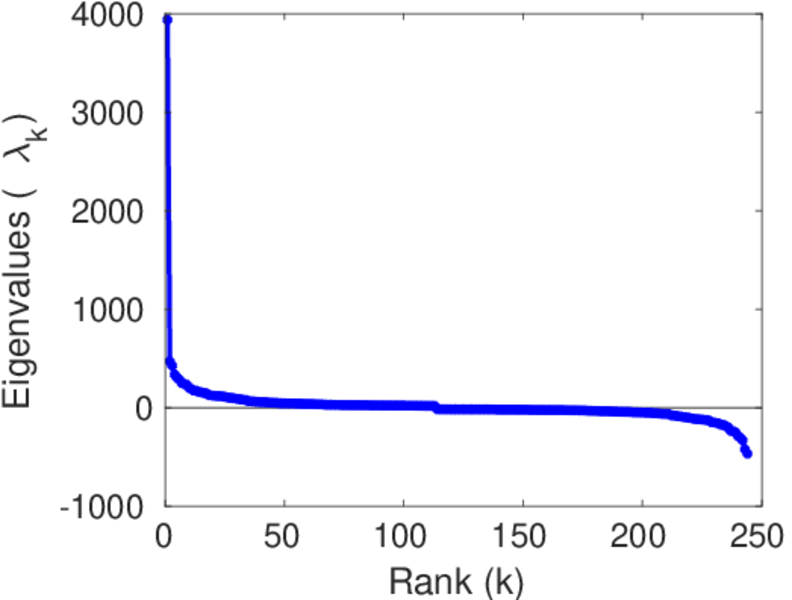
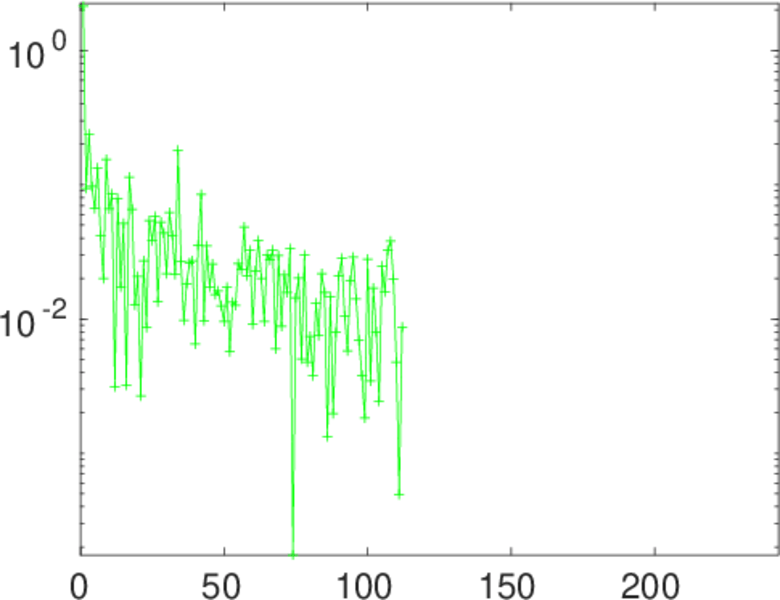
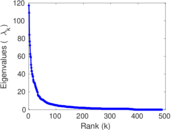
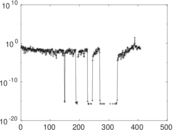
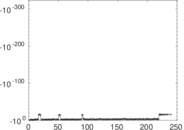
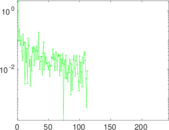
Matrix decompositions plots


Downloads
References
|
[1]
|
Jérôme Kunegis.
KONECT – The Koblenz Network Collection.
In Proc. Int. Conf. on World Wide Web Companion, pages
1343–1350, 2013.
[ http ]
|
|
[2]
|
Wikimedia Foundation.
Wikimedia downloads.
http://dumps.wikimedia.org/, January 2010.
|
 KONECT ‣ Networks ‣
Buy Me a Coffee
KONECT ‣ Networks ‣
Buy Me a Coffee