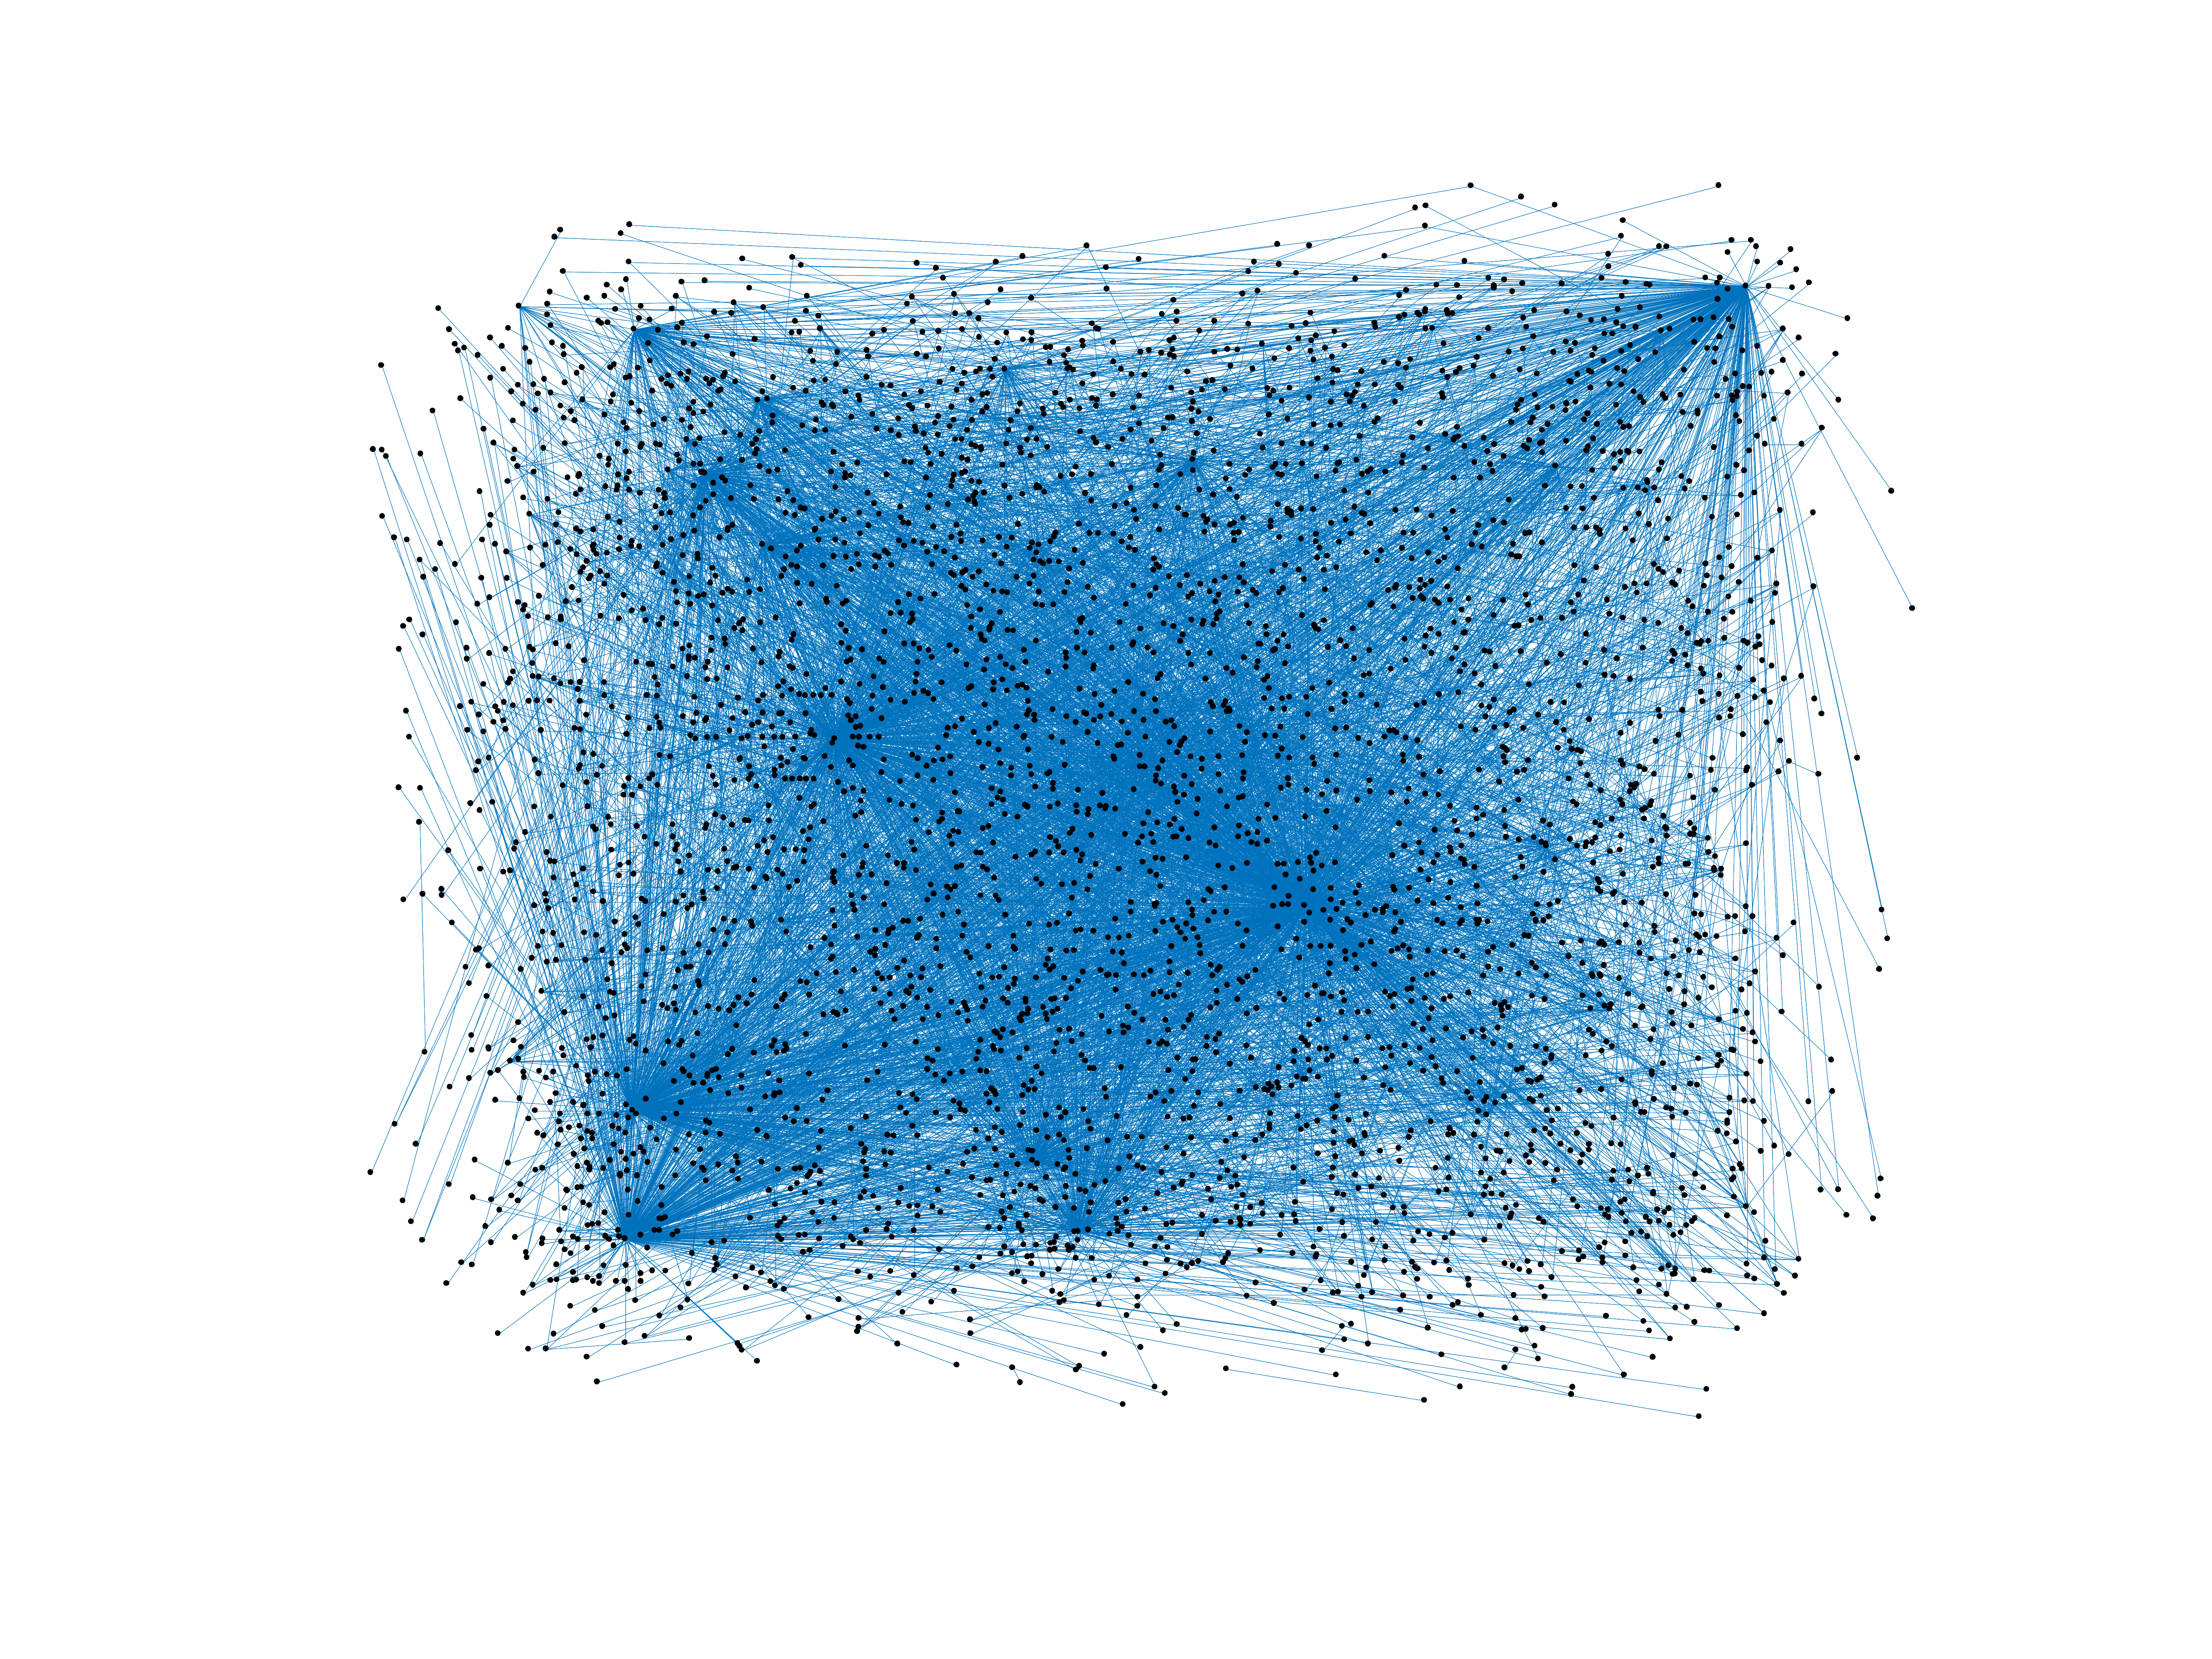
Wikiquote edits (ml)
This is the bipartite edit network of the Malayalam Wikiquote. It contains
users and pages from the Malayalam Wikiquote, connected by edit events. Each
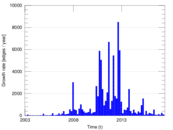
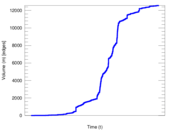
edge represents an edit. The dataset includes the timestamp of each edit.
Metadata
Statistics
| Size | n = | 3,834
|
| Left size | n1 = | 531
|
| Right size | n2 = | 3,303
|
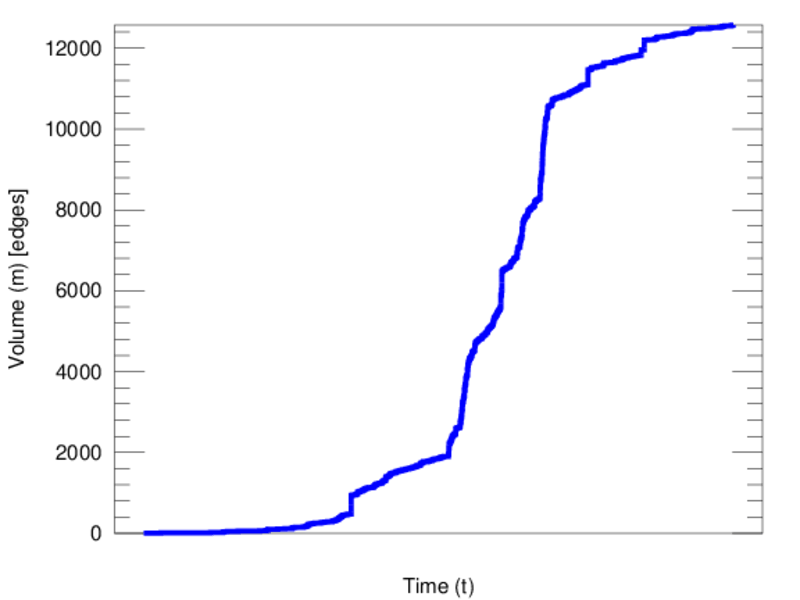
| Volume | m = | 12,574
|
| Unique edge count | m̿ = | 5,826
|
| Wedge count | s = | 816,956
|
| Claw count | z = | 143,519,023
|
| Cross count | x = | 22,304,712,911
|
| Square count | q = | 55,090
|
| 4-Tour count | T4 = | 3,720,348
|
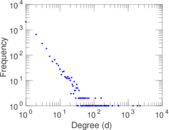
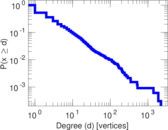
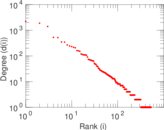
| Maximum degree | dmax = | 2,228
|
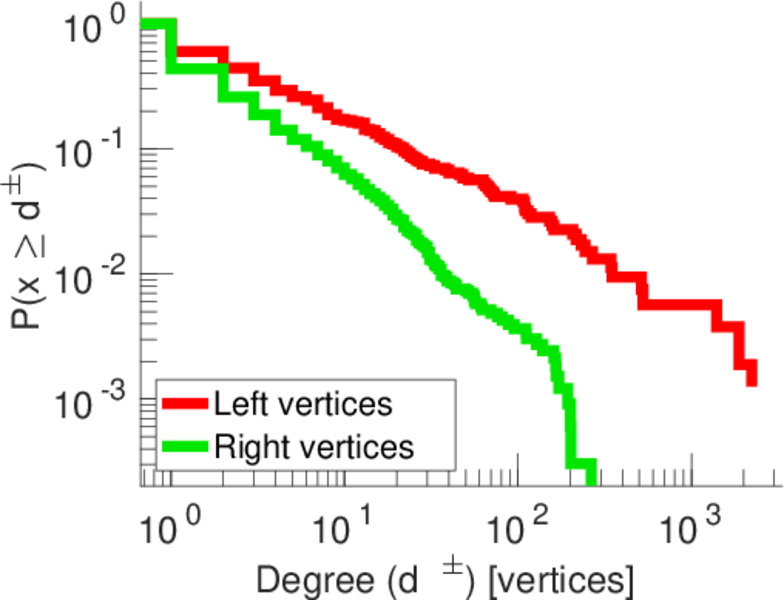
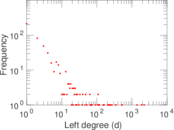
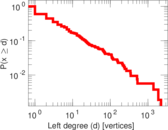
| Maximum left degree | d1max = | 2,228
|
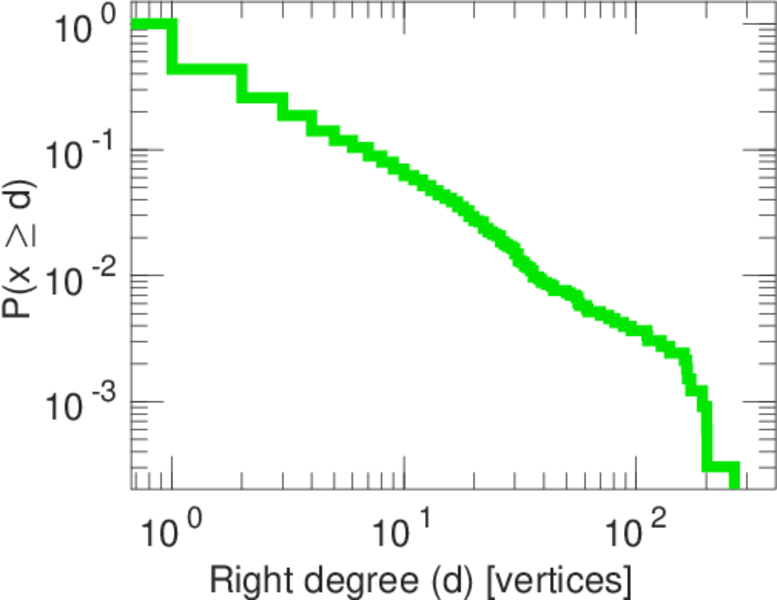
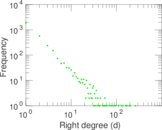
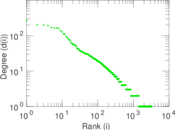
| Maximum right degree | d2max = | 265
|
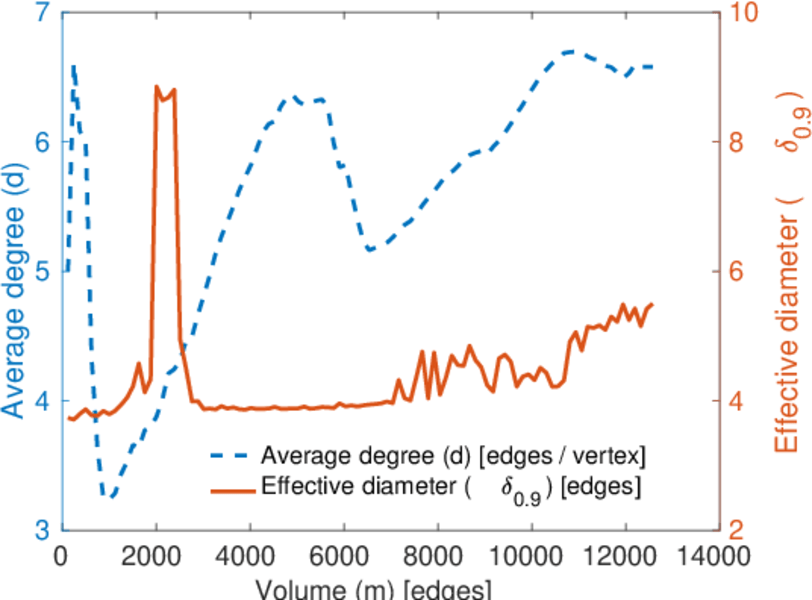
| Average degree | d = | 6.559 21
|
| Average left degree | d1 = | 23.679 8
|
| Average right degree | d2 = | 3.806 84
|
| Fill | p = | 0.003 321 75
|
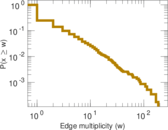
| Average edge multiplicity | m̃ = | 2.158 26
|
| Size of LCC | N = | 3,641
|
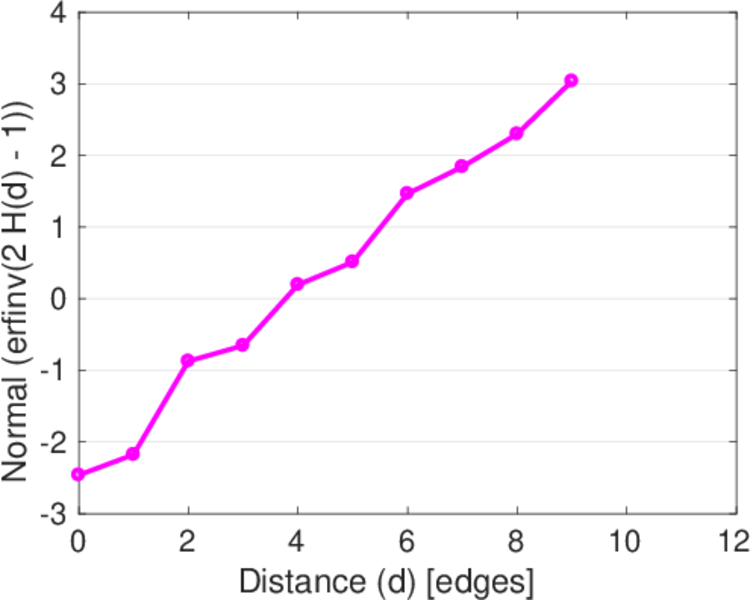
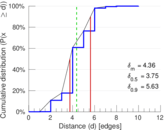
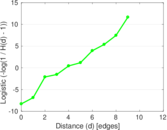
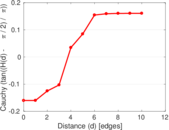
| Diameter | δ = | 12
|
| 50-Percentile effective diameter | δ0.5 = | 3.748 61
|
| 90-Percentile effective diameter | δ0.9 = | 5.625 35
|
| Median distance | δM = | 4
|
| Mean distance | δm = | 4.363 57
|
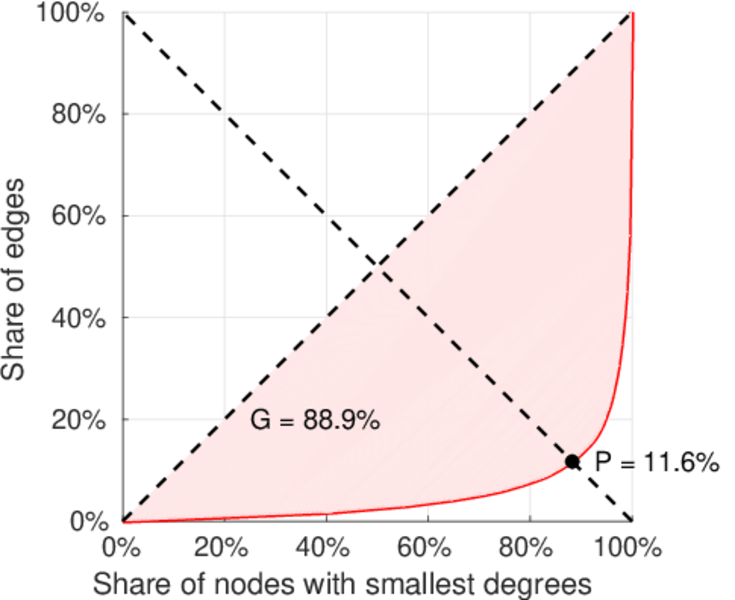
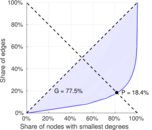
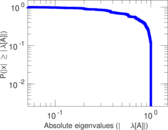
| Gini coefficient | G = | 0.778 535
|
| Balanced inequality ratio | P = | 0.182 877
|
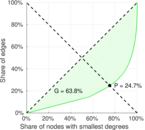
| Left balanced inequality ratio | P1 = | 0.115 715
|
| Right balanced inequality ratio | P2 = | 0.246 938
|
| Relative edge distribution entropy | Her = | 0.804 632
|
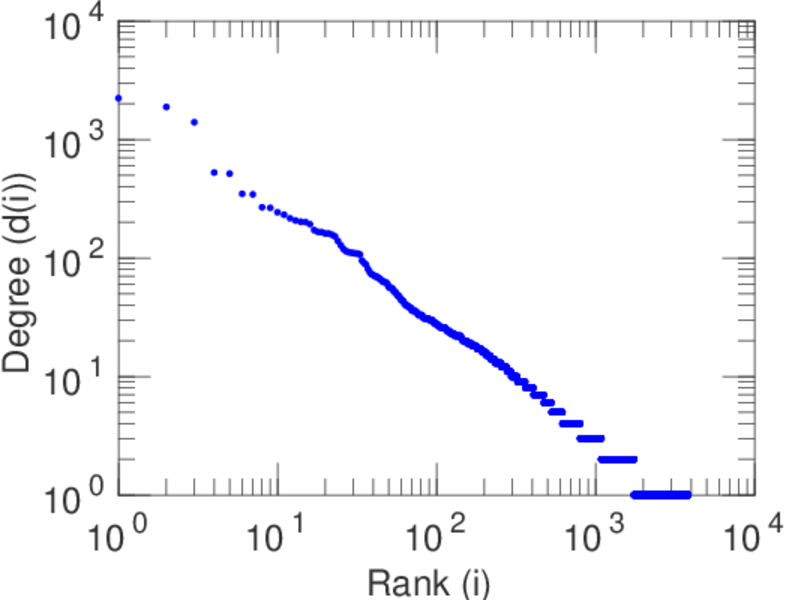
| Power law exponent | γ = | 3.395 45
|
| Tail power law exponent | γt = | 2.141 00
|
| Tail power law exponent with p | γ3 = | 2.141 00
|
| p-value | p = | 0.057 000 0
|
| Left tail power law exponent with p | γ3,1 = | 1.791 00
|
| Left p-value | p1 = | 0.542 000
|
| Right tail power law exponent with p | γ3,2 = | 3.081 00
|
| Right p-value | p2 = | 0.023 000 0
|
| Degree assortativity | ρ = | −0.249 485
|
| Degree assortativity p-value | pρ = | 2.229 09 × 10−83
|
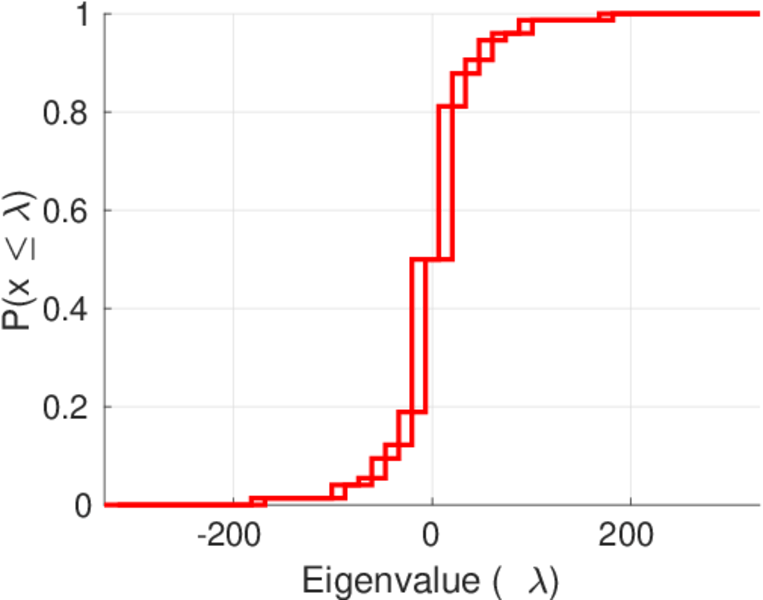
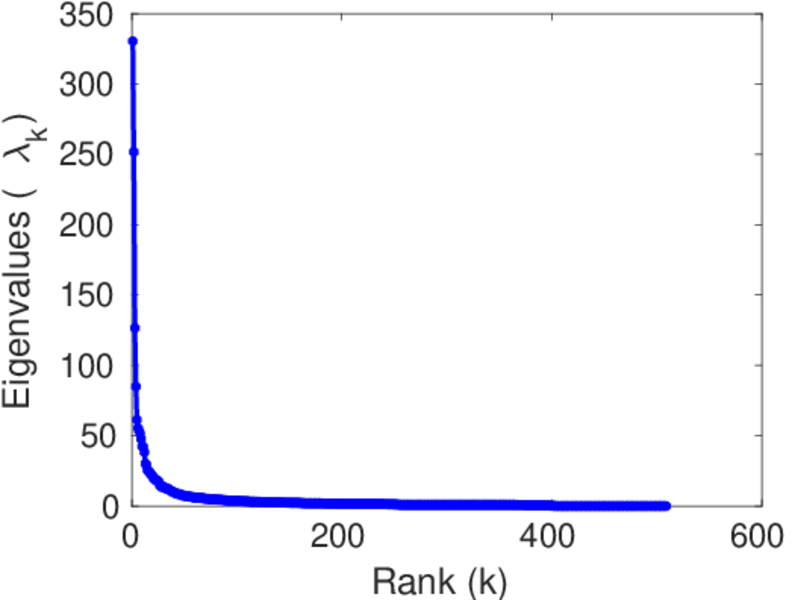
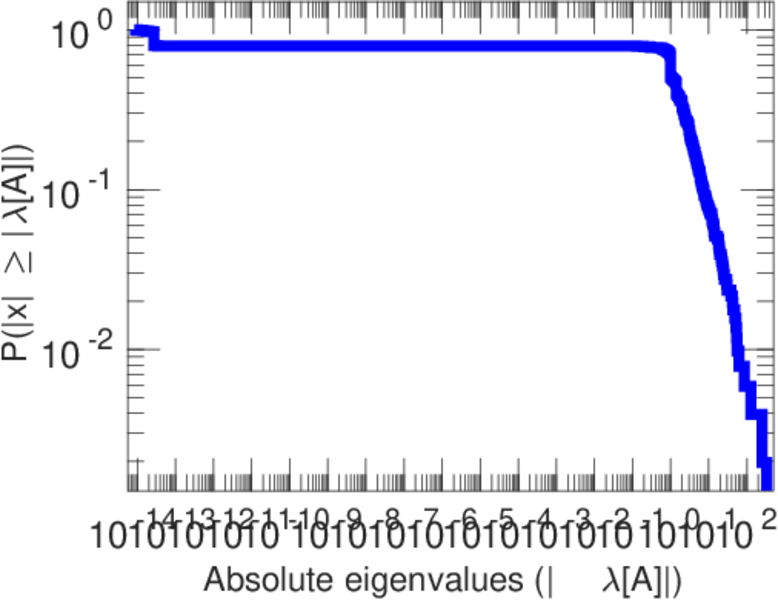
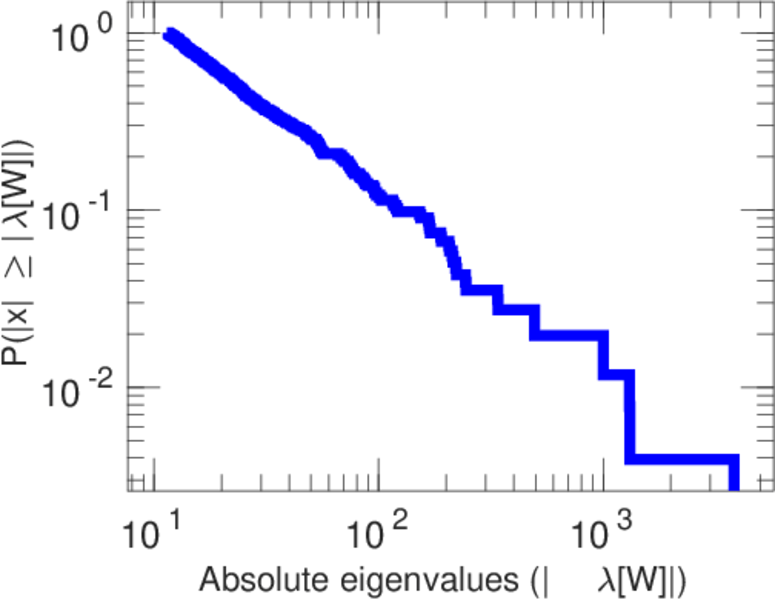
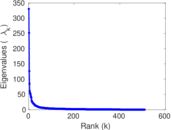
| Spectral norm | α = | 330.407
|
| Algebraic connectivity | a = | 0.051 466 1
|
| Spectral separation | |λ1[A] / λ2[A]| = | 1.312 21
|
| Controllability | C = | 3,019
|
| Relative controllability | Cr = | 0.789 694
|
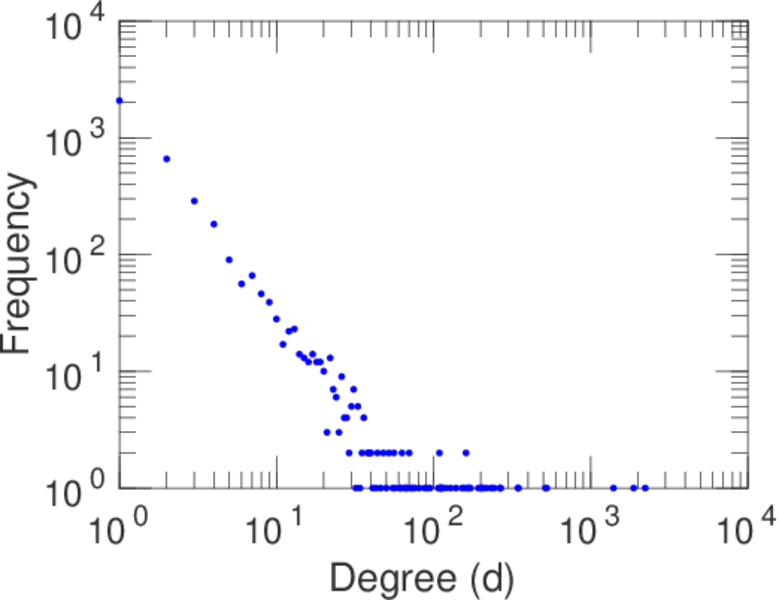
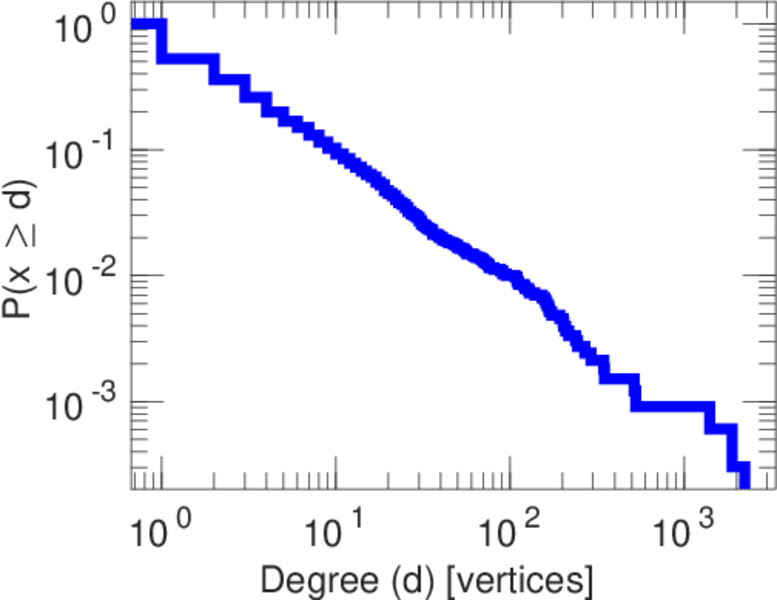
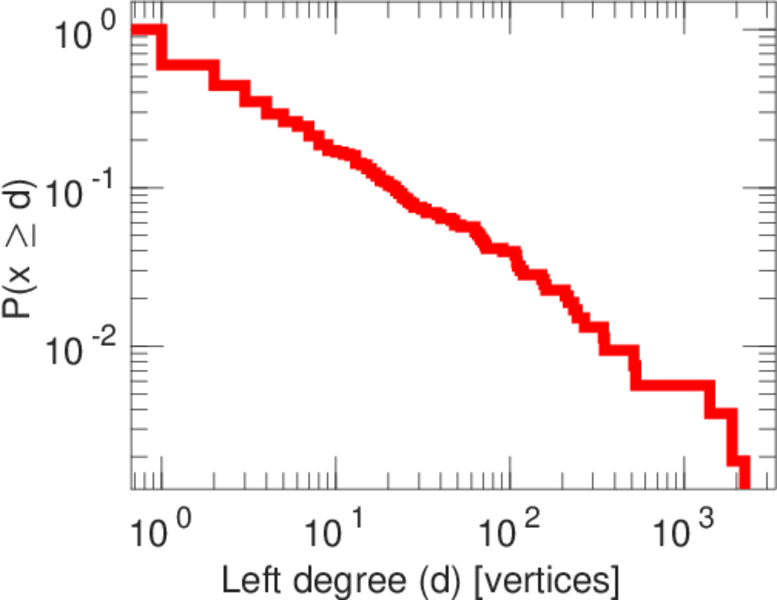
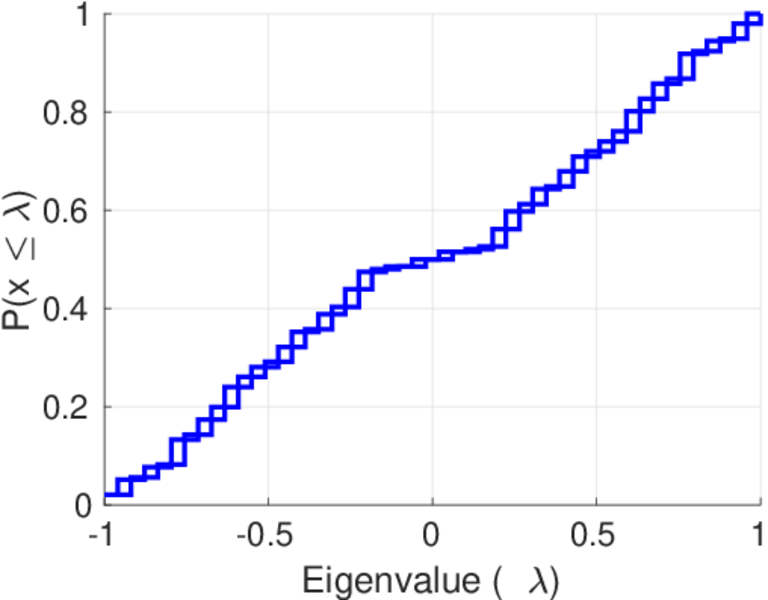
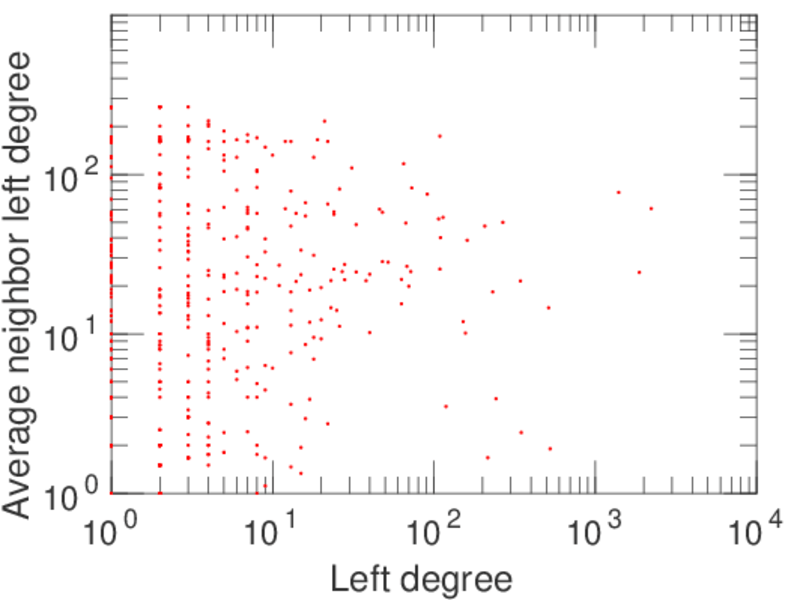
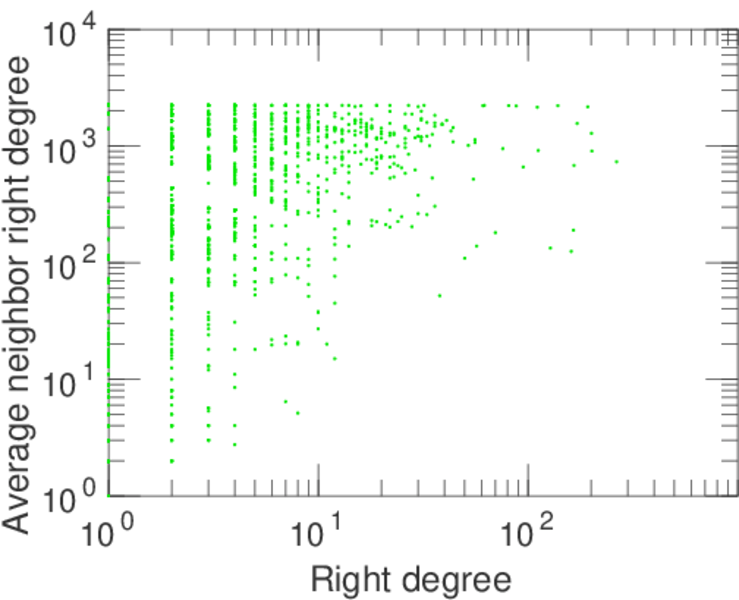
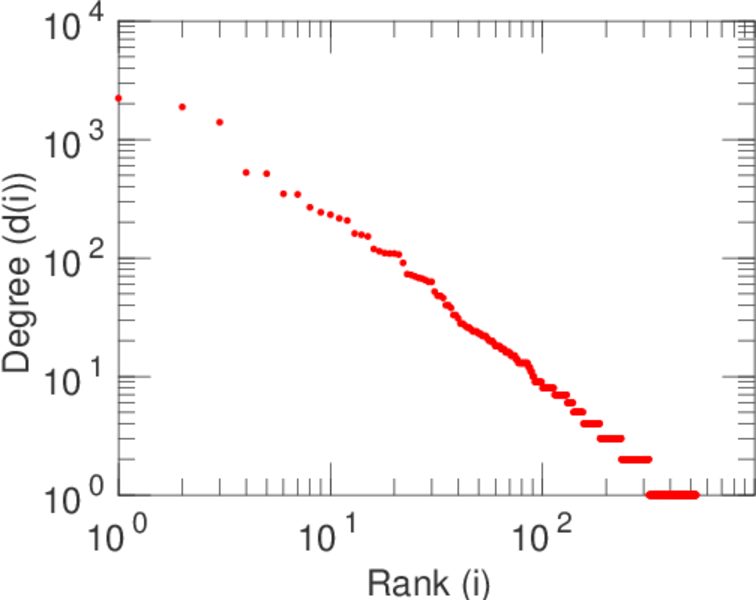
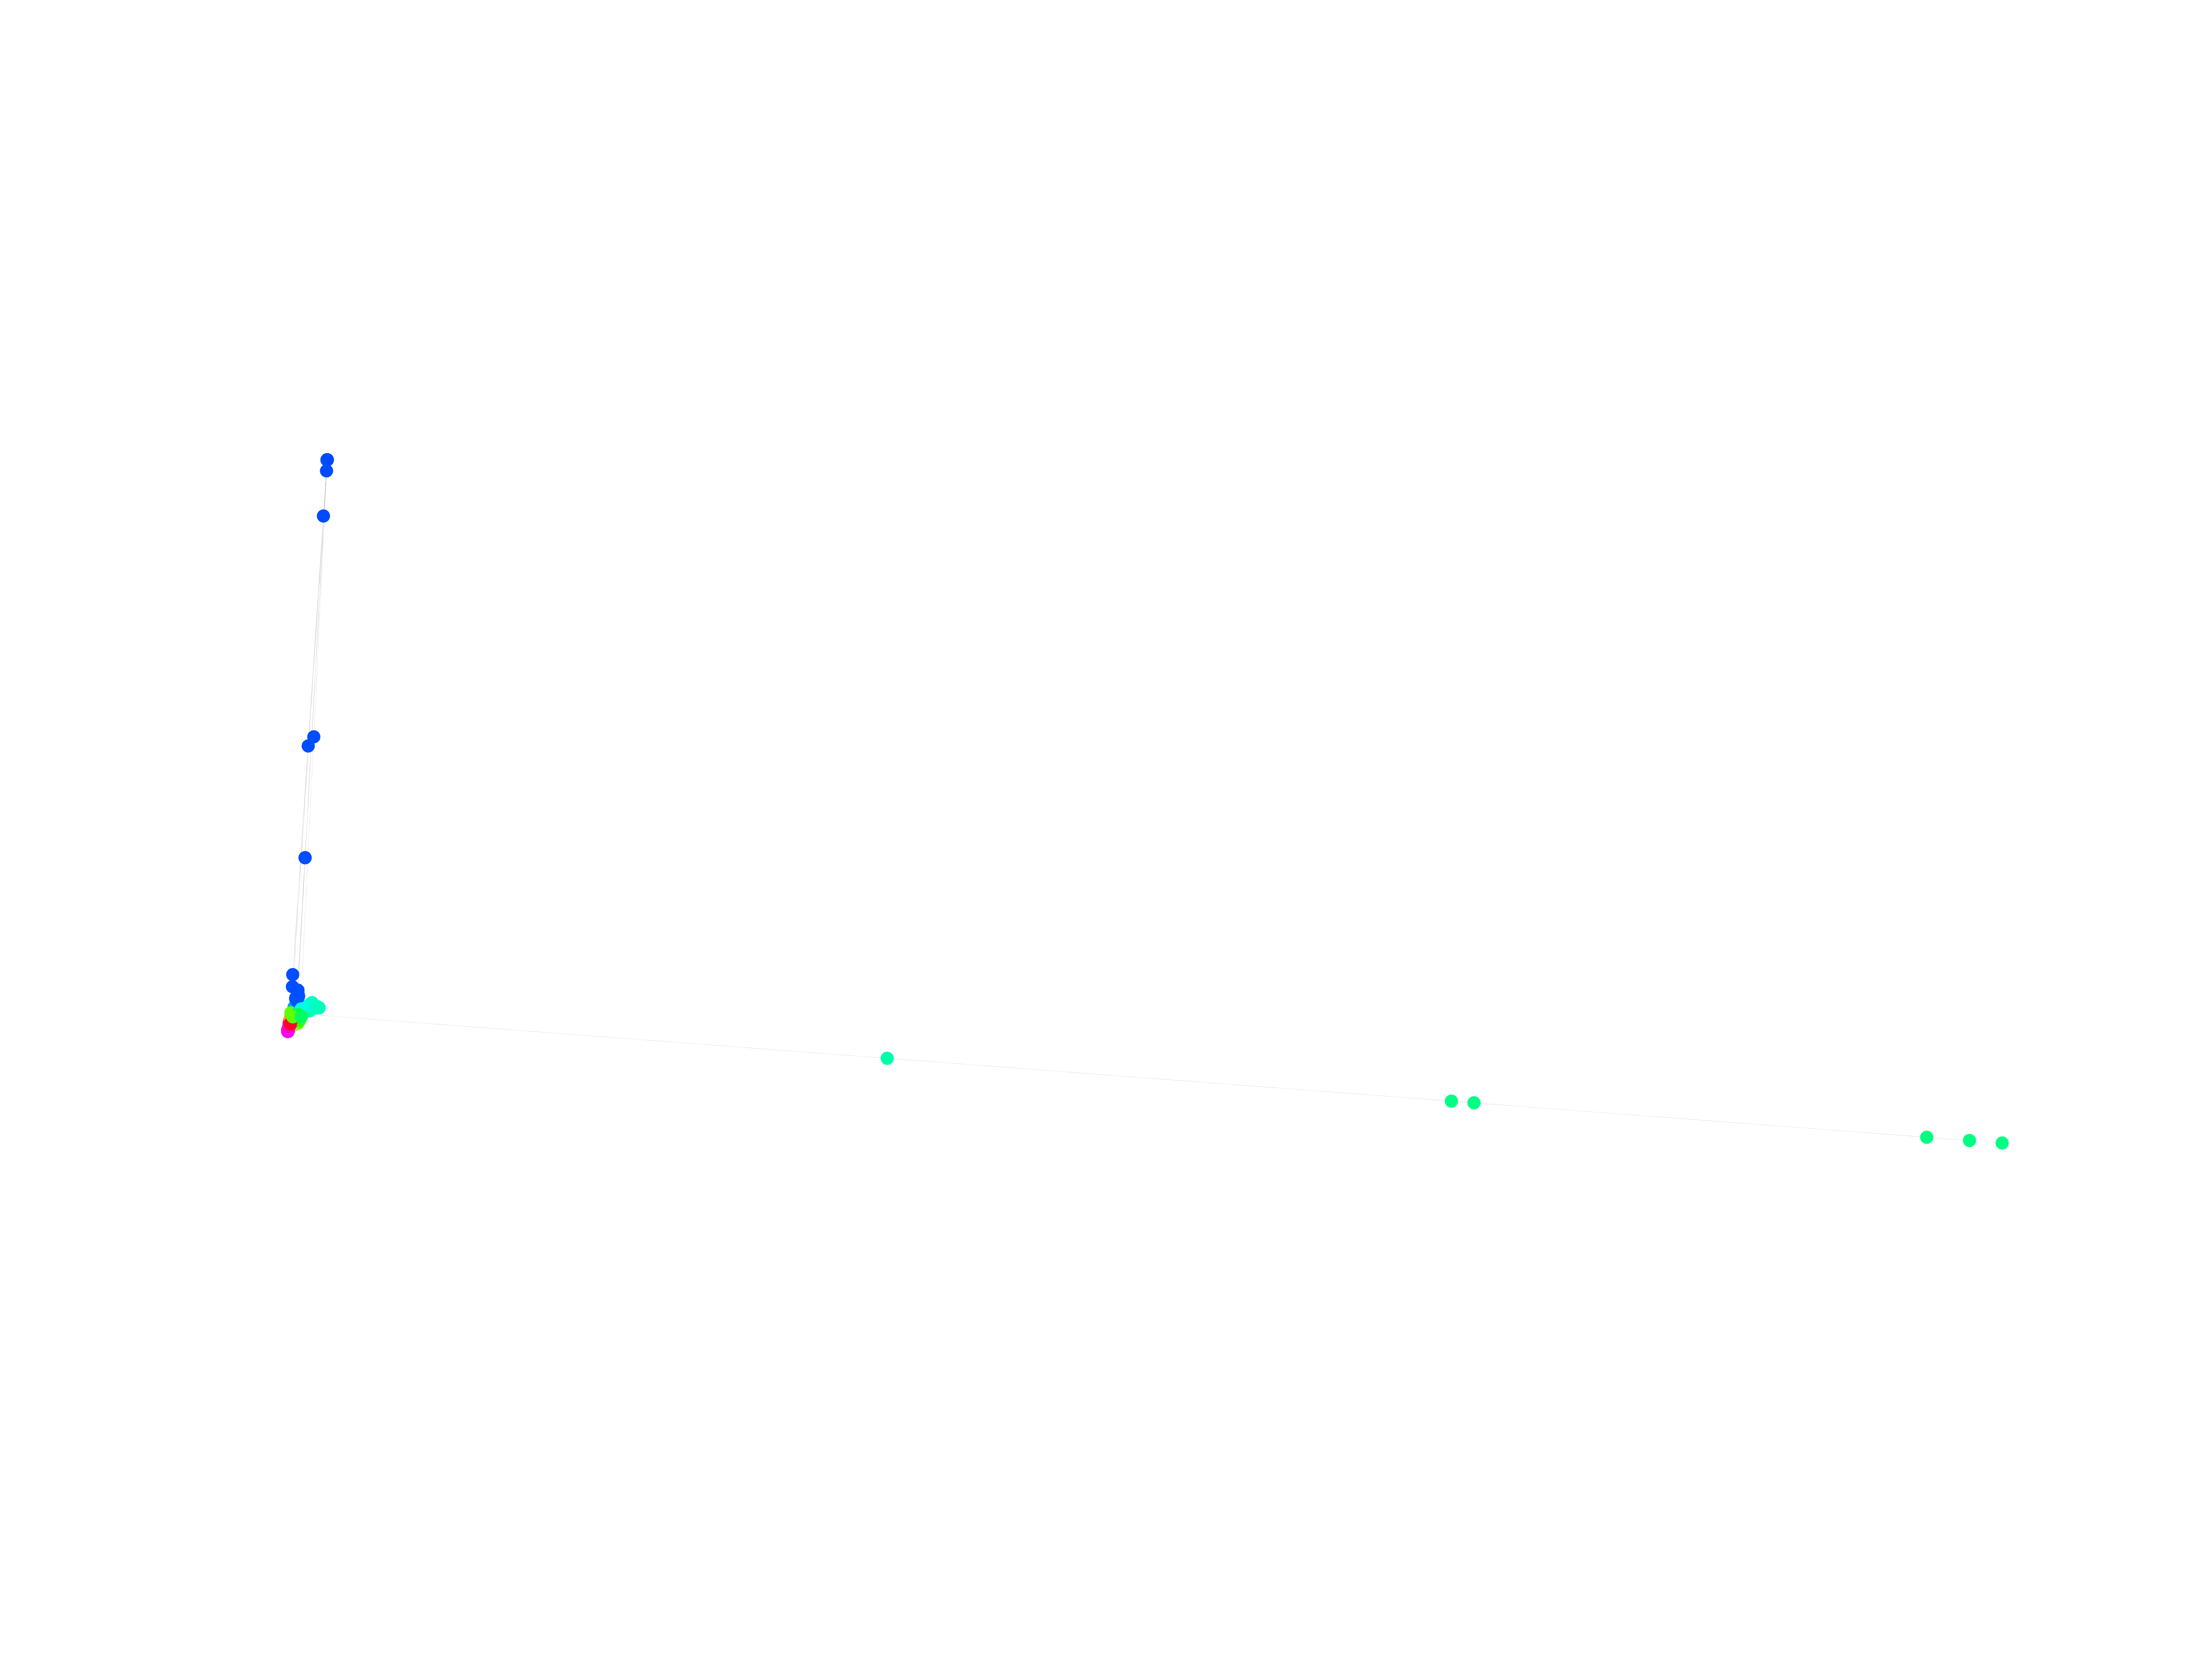
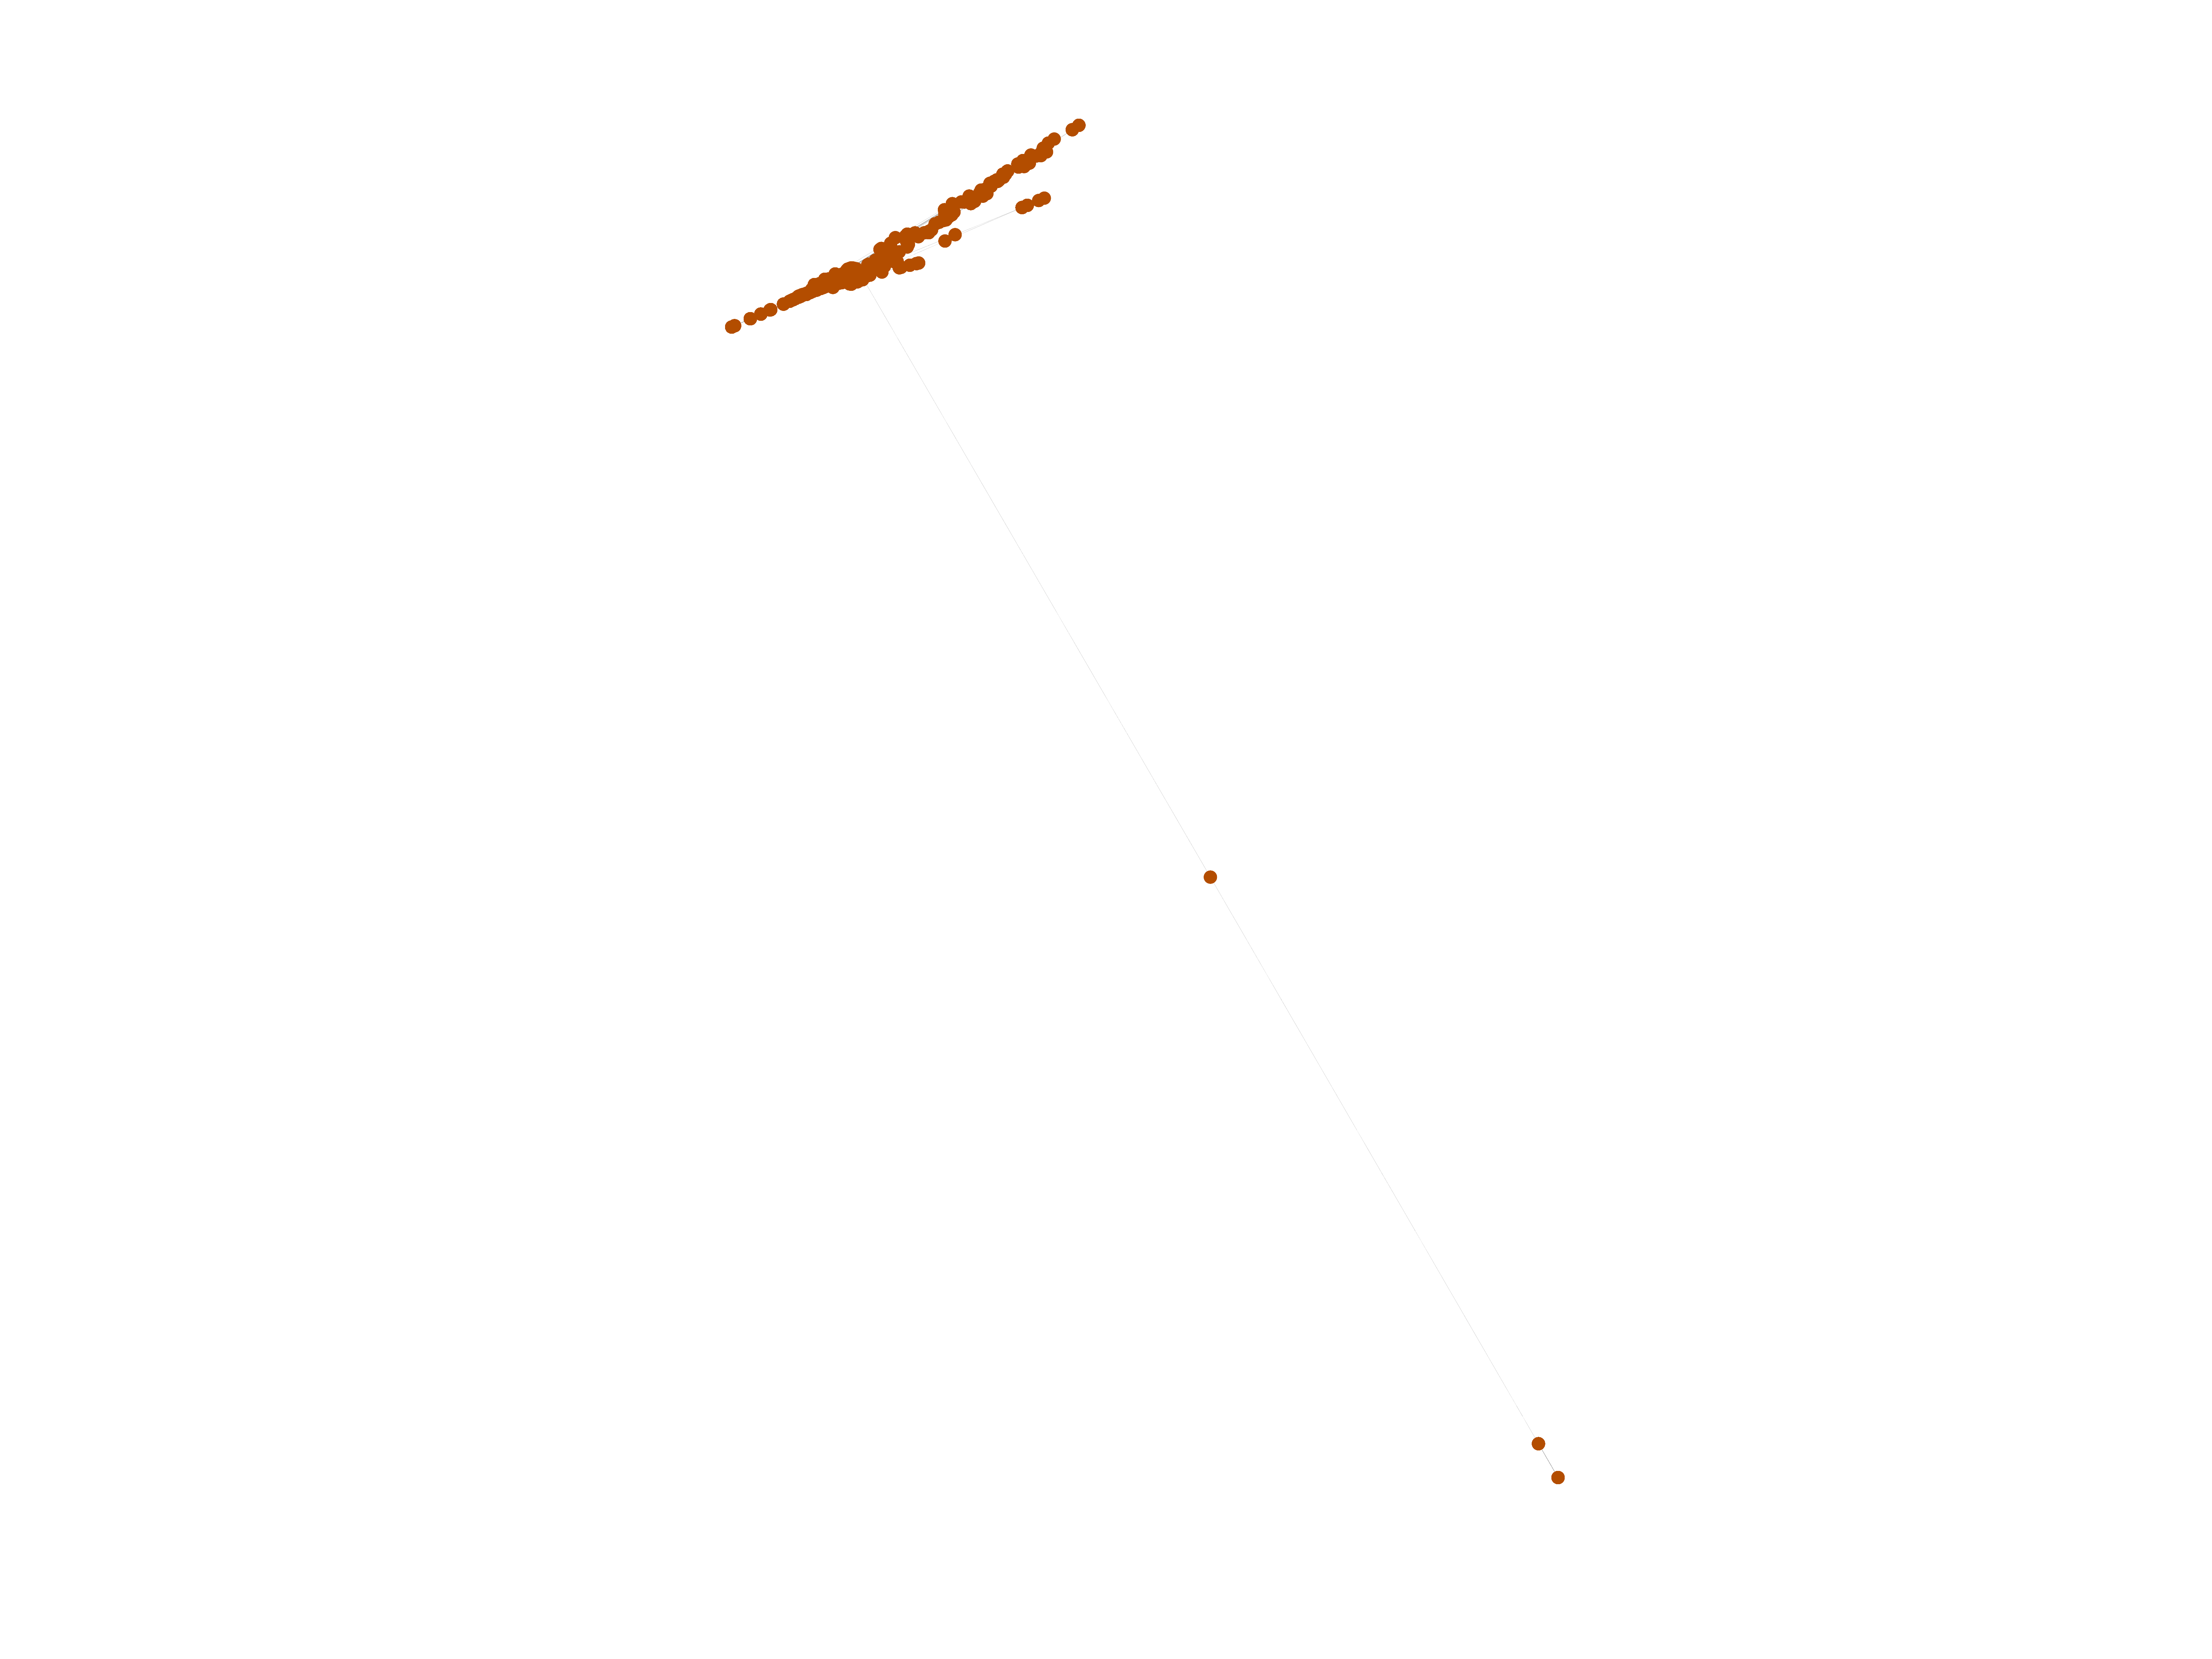
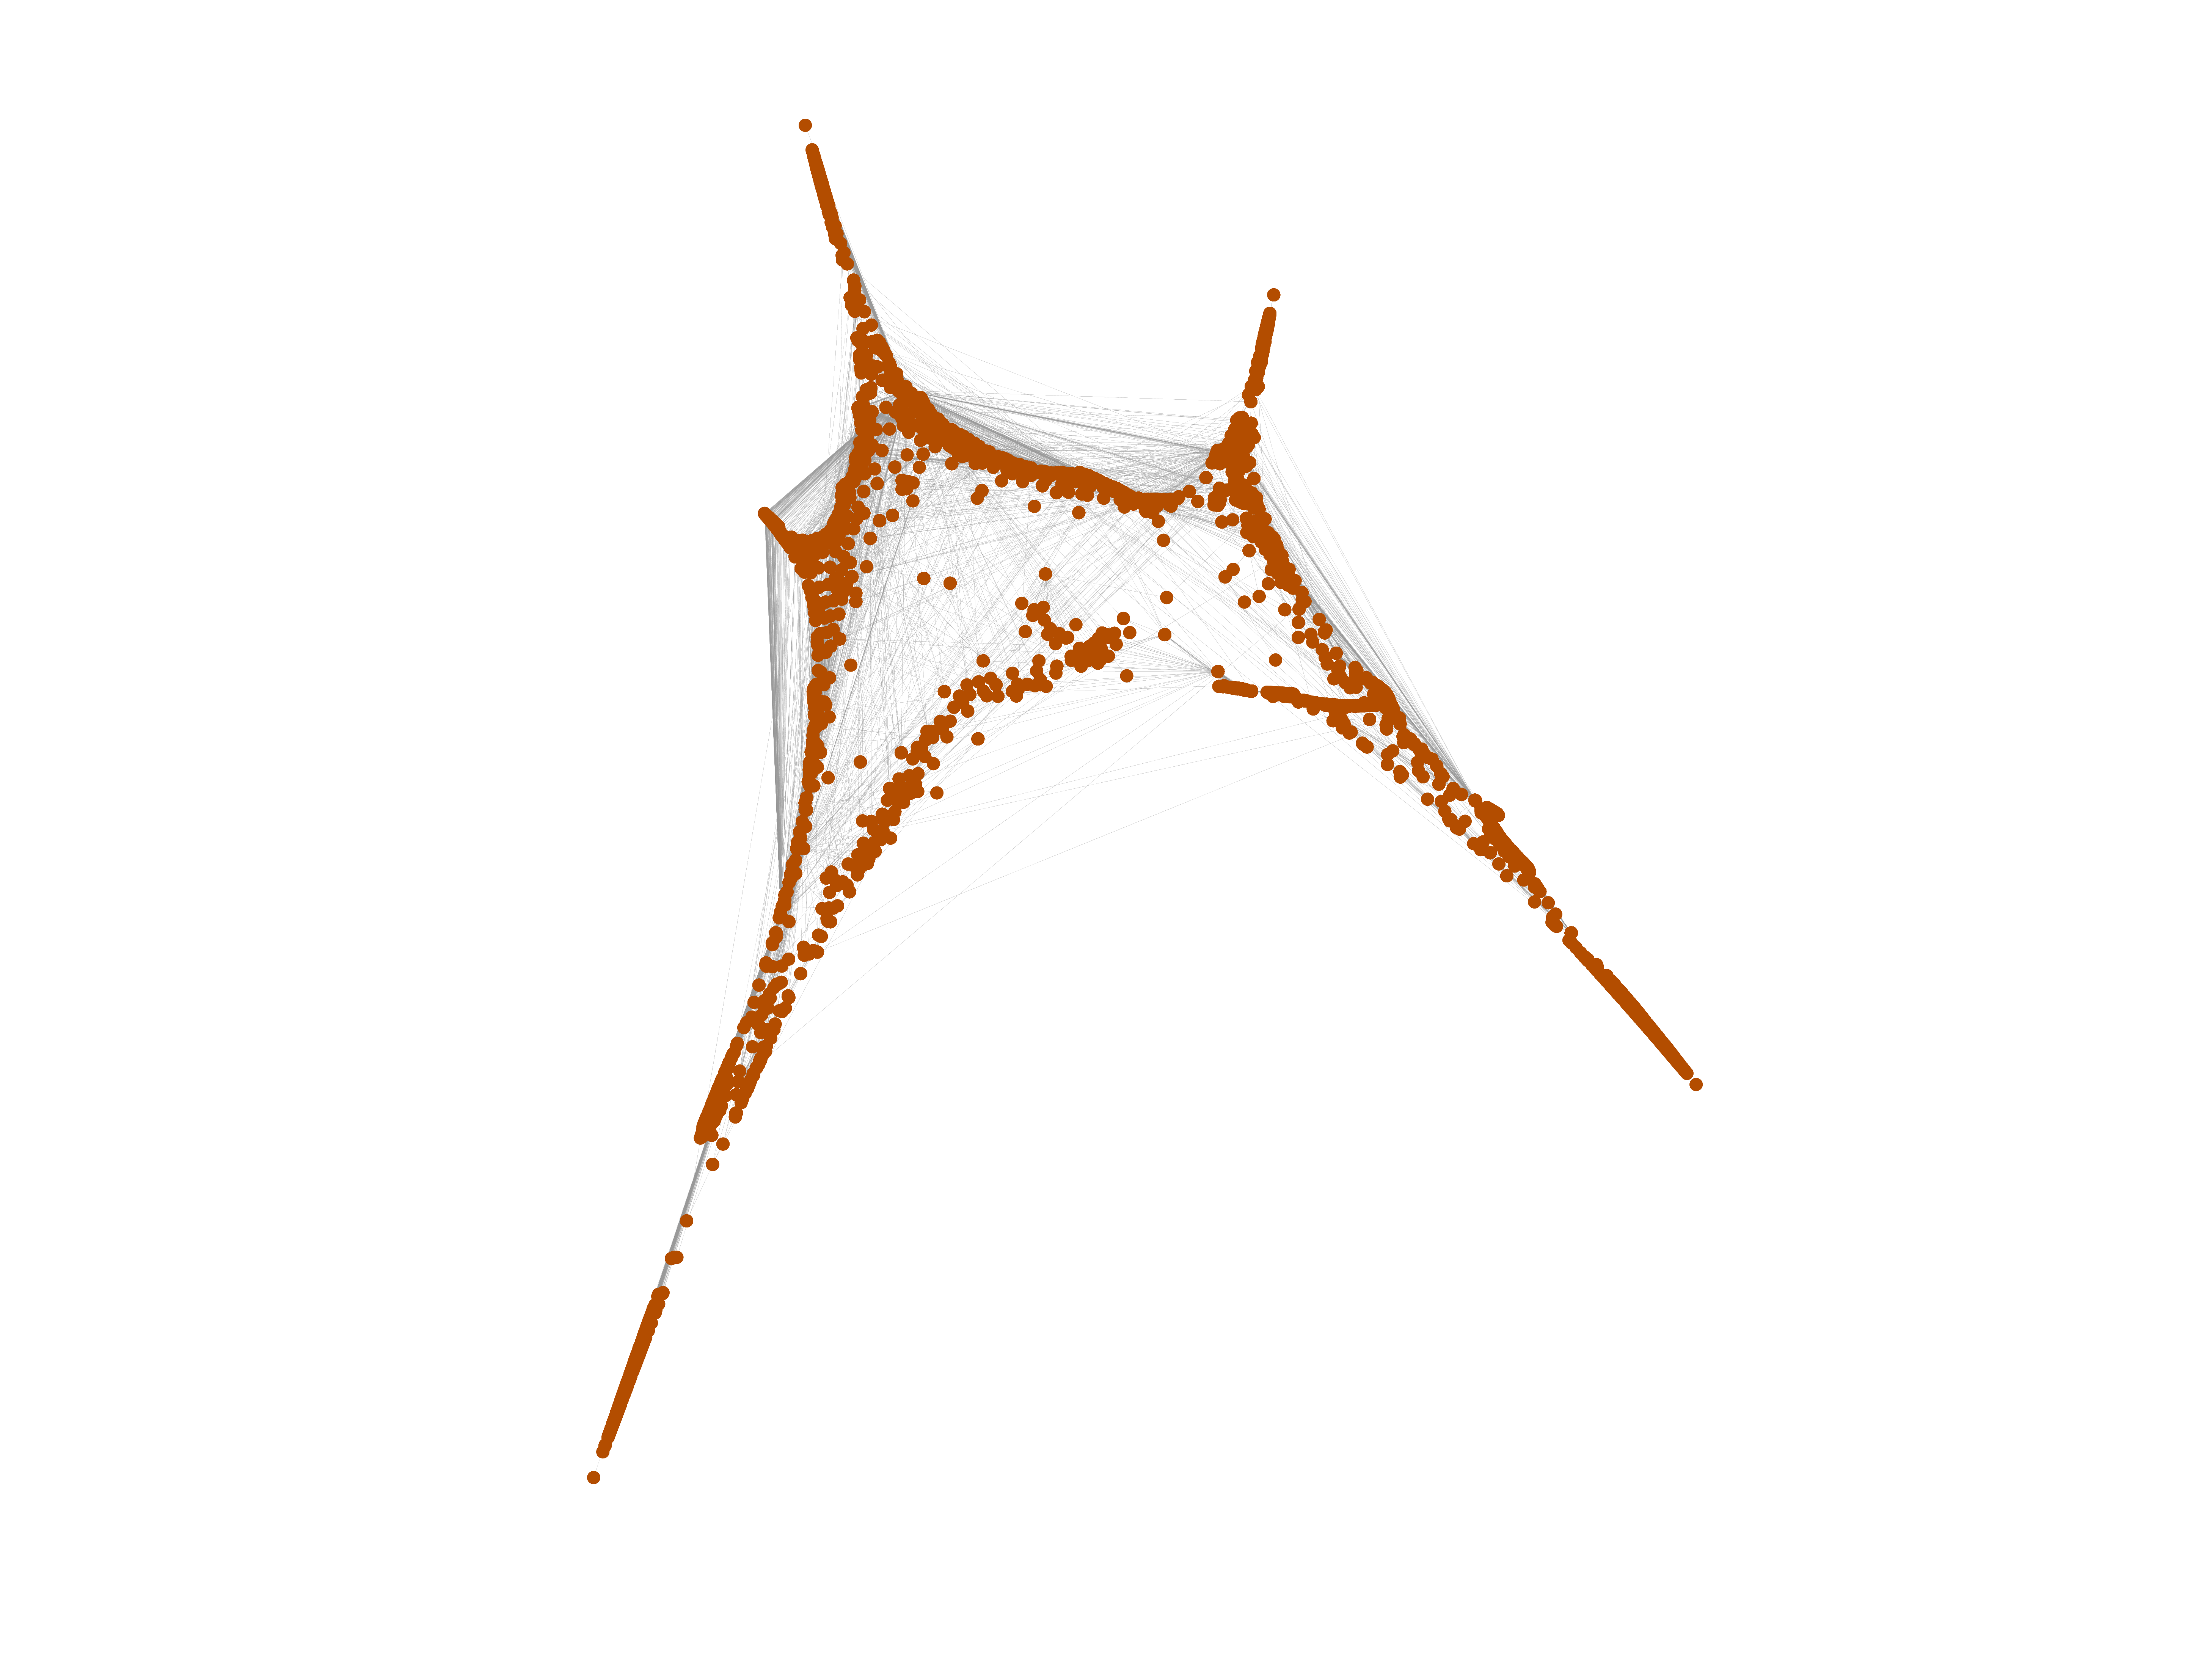
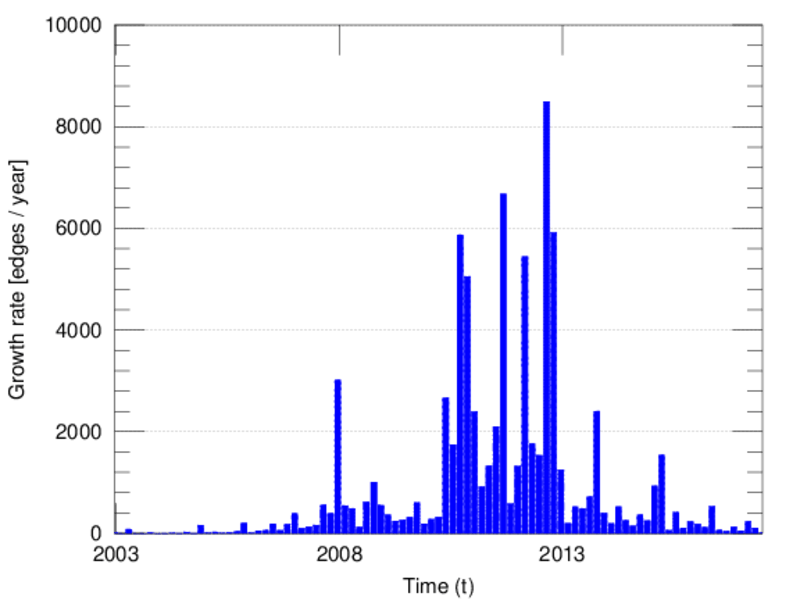
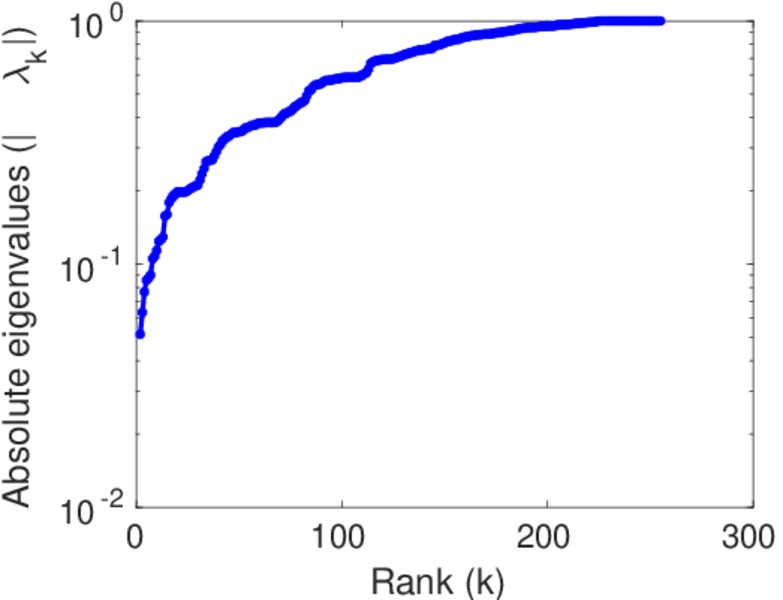
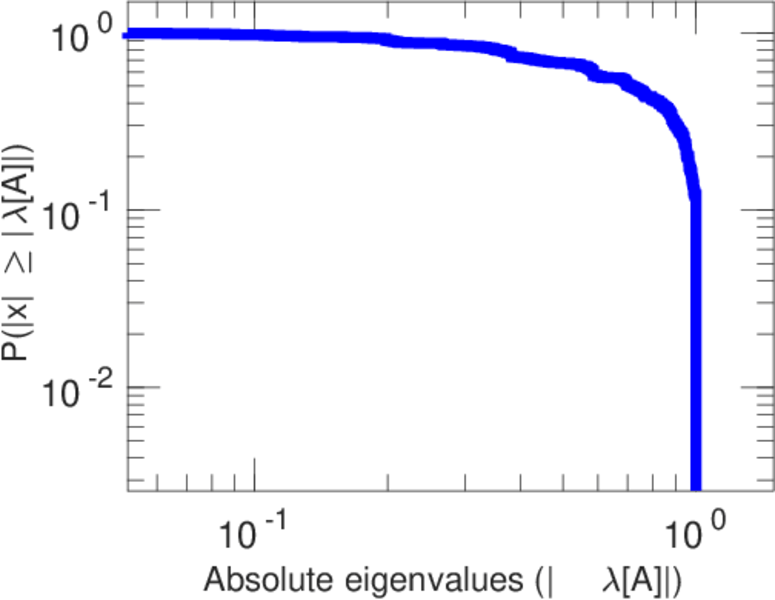
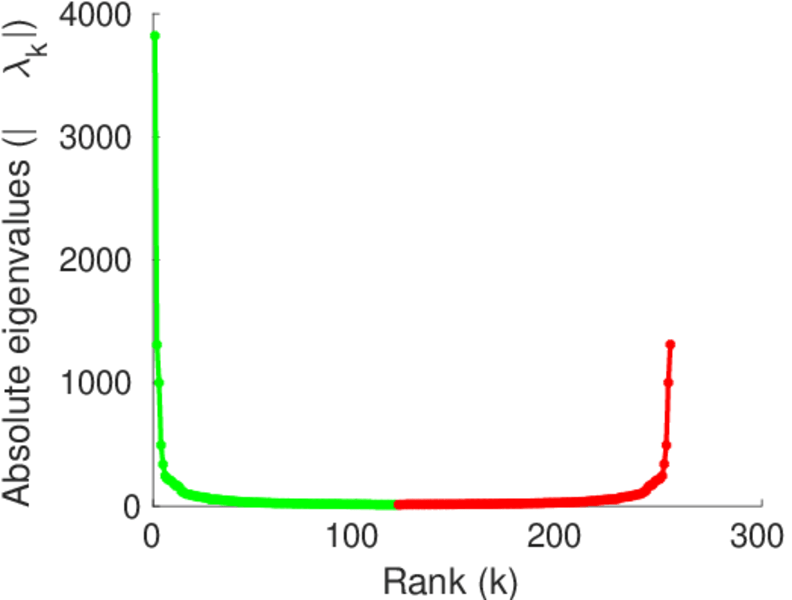
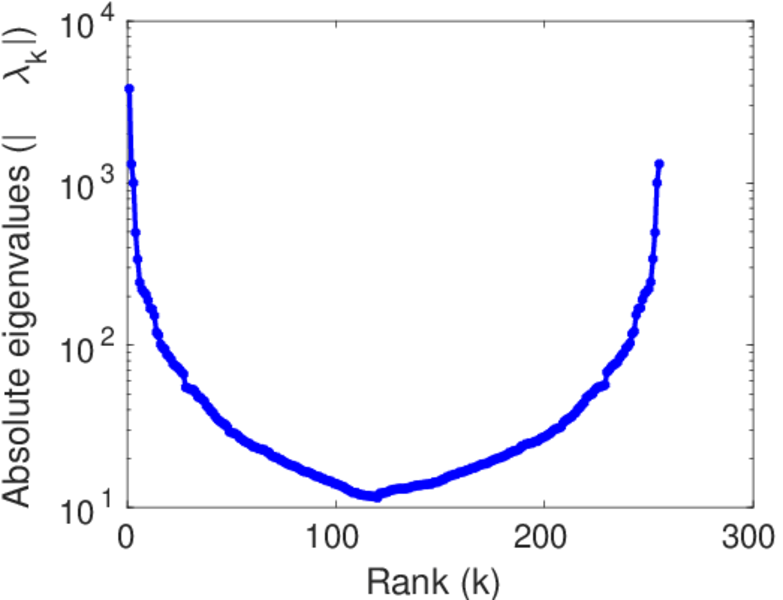
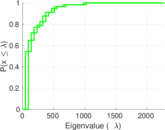
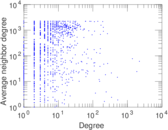
Plots


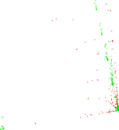
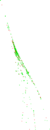


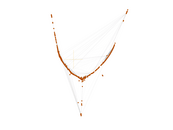
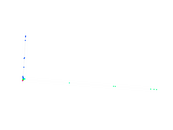
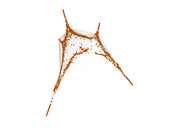


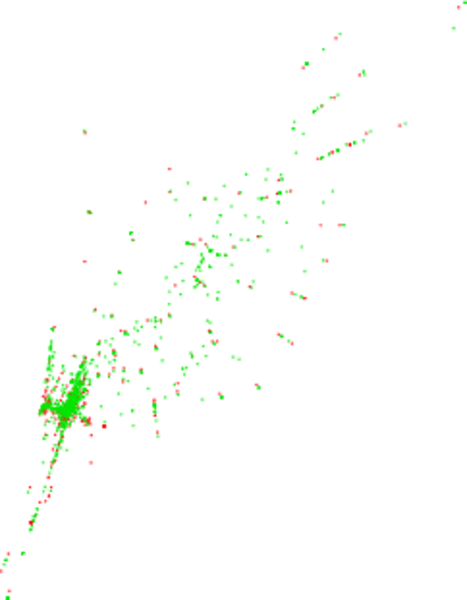
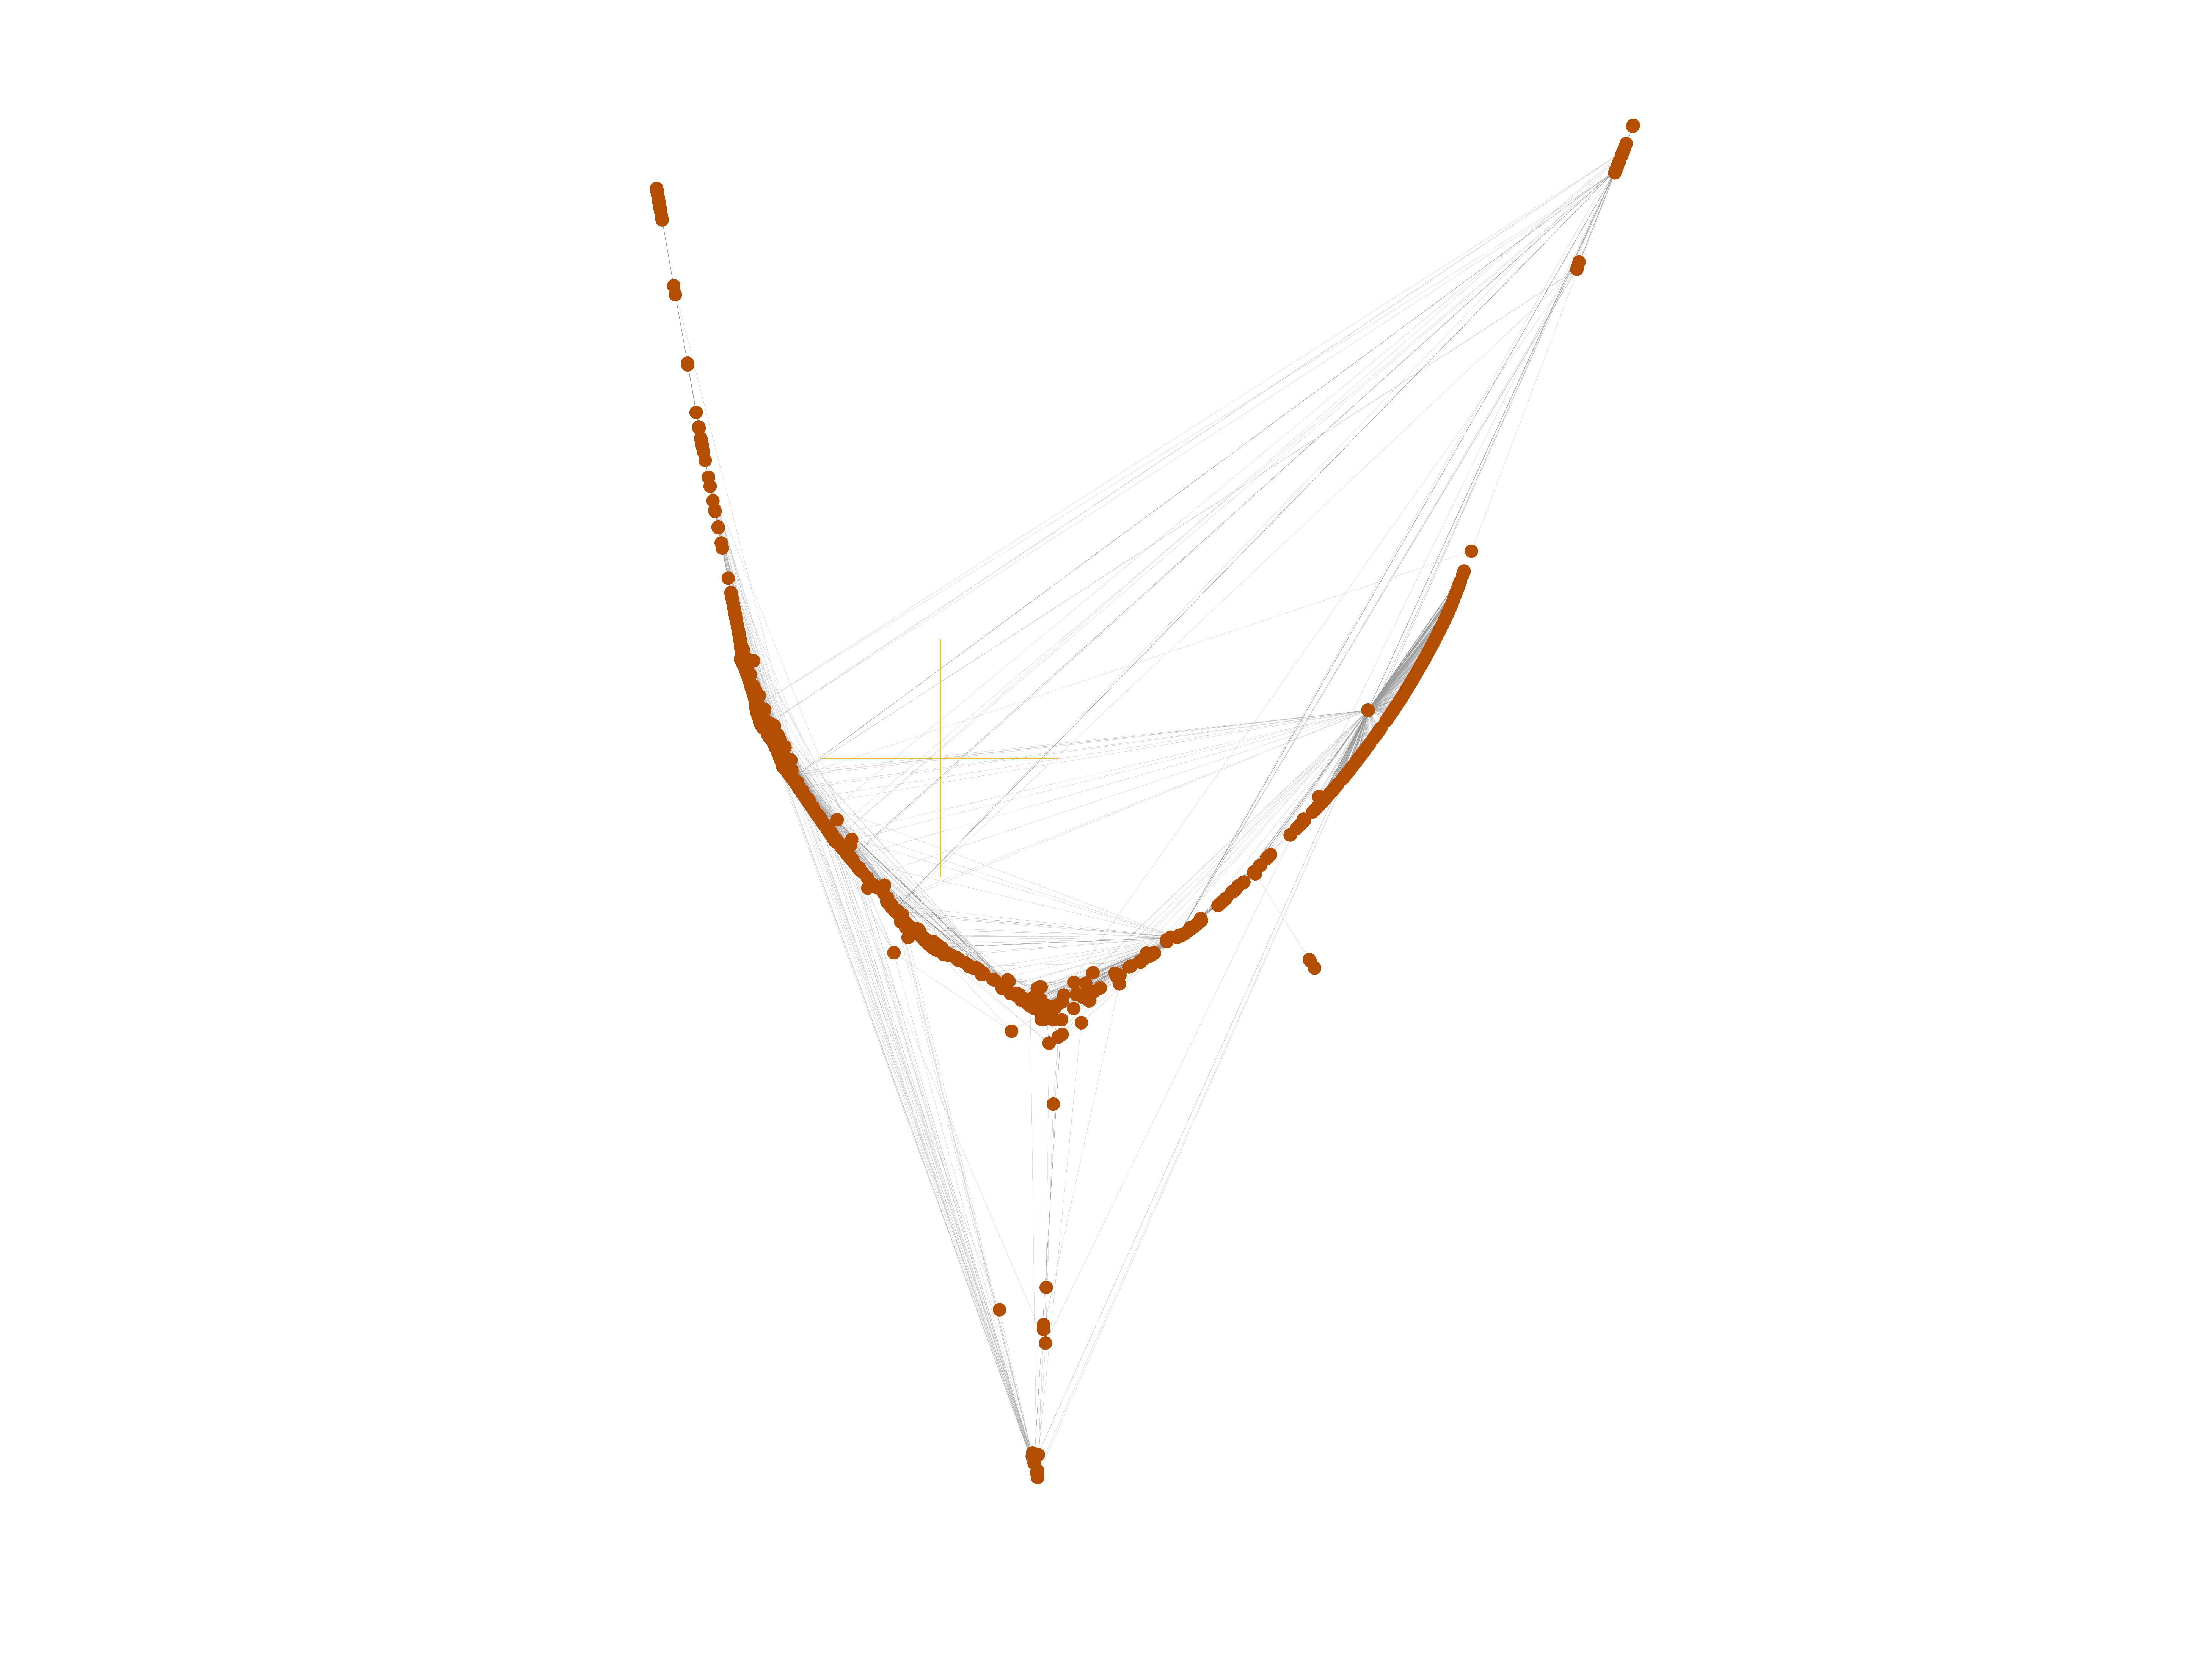
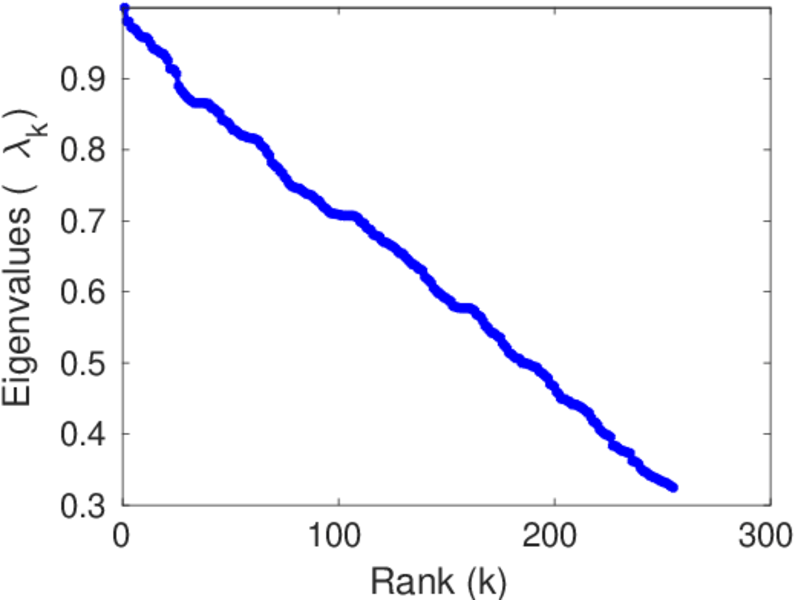
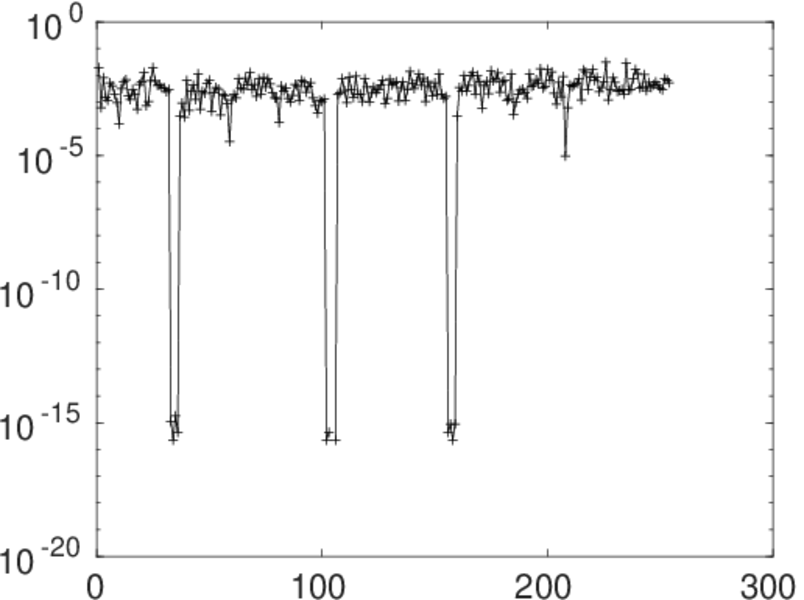
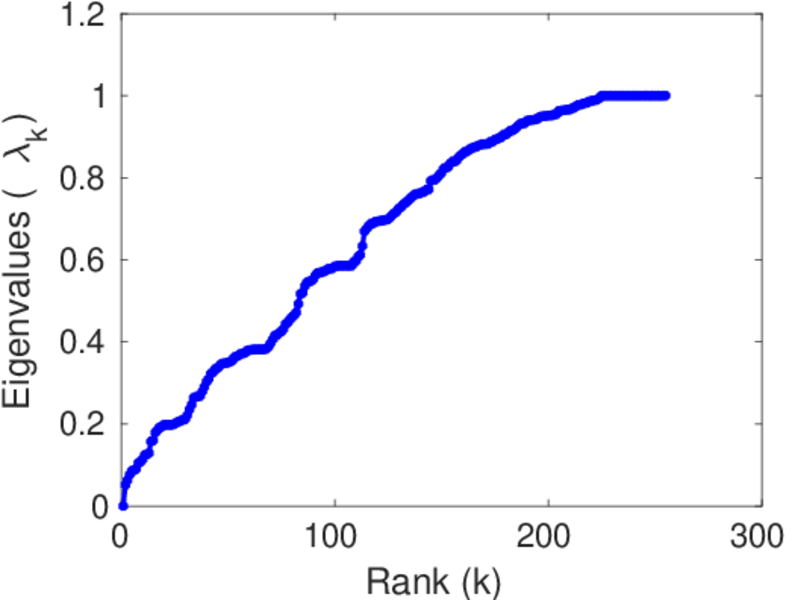
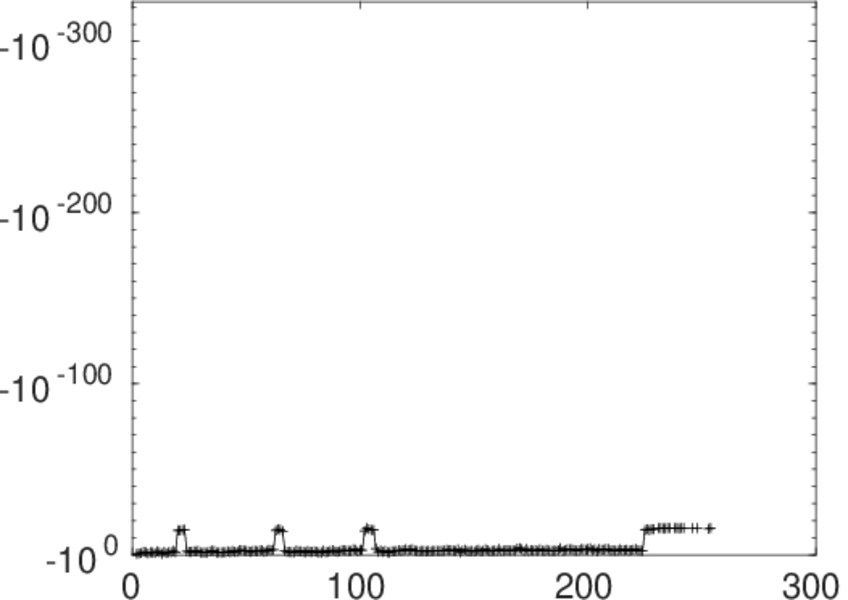
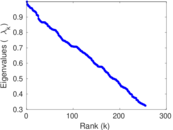
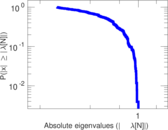
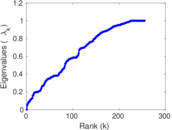
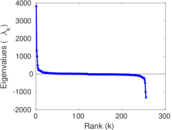
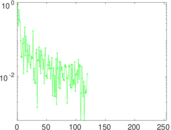
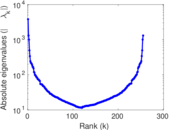
Matrix decompositions plots


Downloads
References
|
[1]
|
Jérôme Kunegis.
KONECT – The Koblenz Network Collection.
In Proc. Int. Conf. on World Wide Web Companion, pages
1343–1350, 2013.
[ http ]
|
|
[2]
|
Wikimedia Foundation.
Wikimedia downloads.
http://dumps.wikimedia.org/, January 2010.
|
 KONECT ‣ Networks ‣
Buy Me a Coffee
KONECT ‣ Networks ‣
Buy Me a Coffee