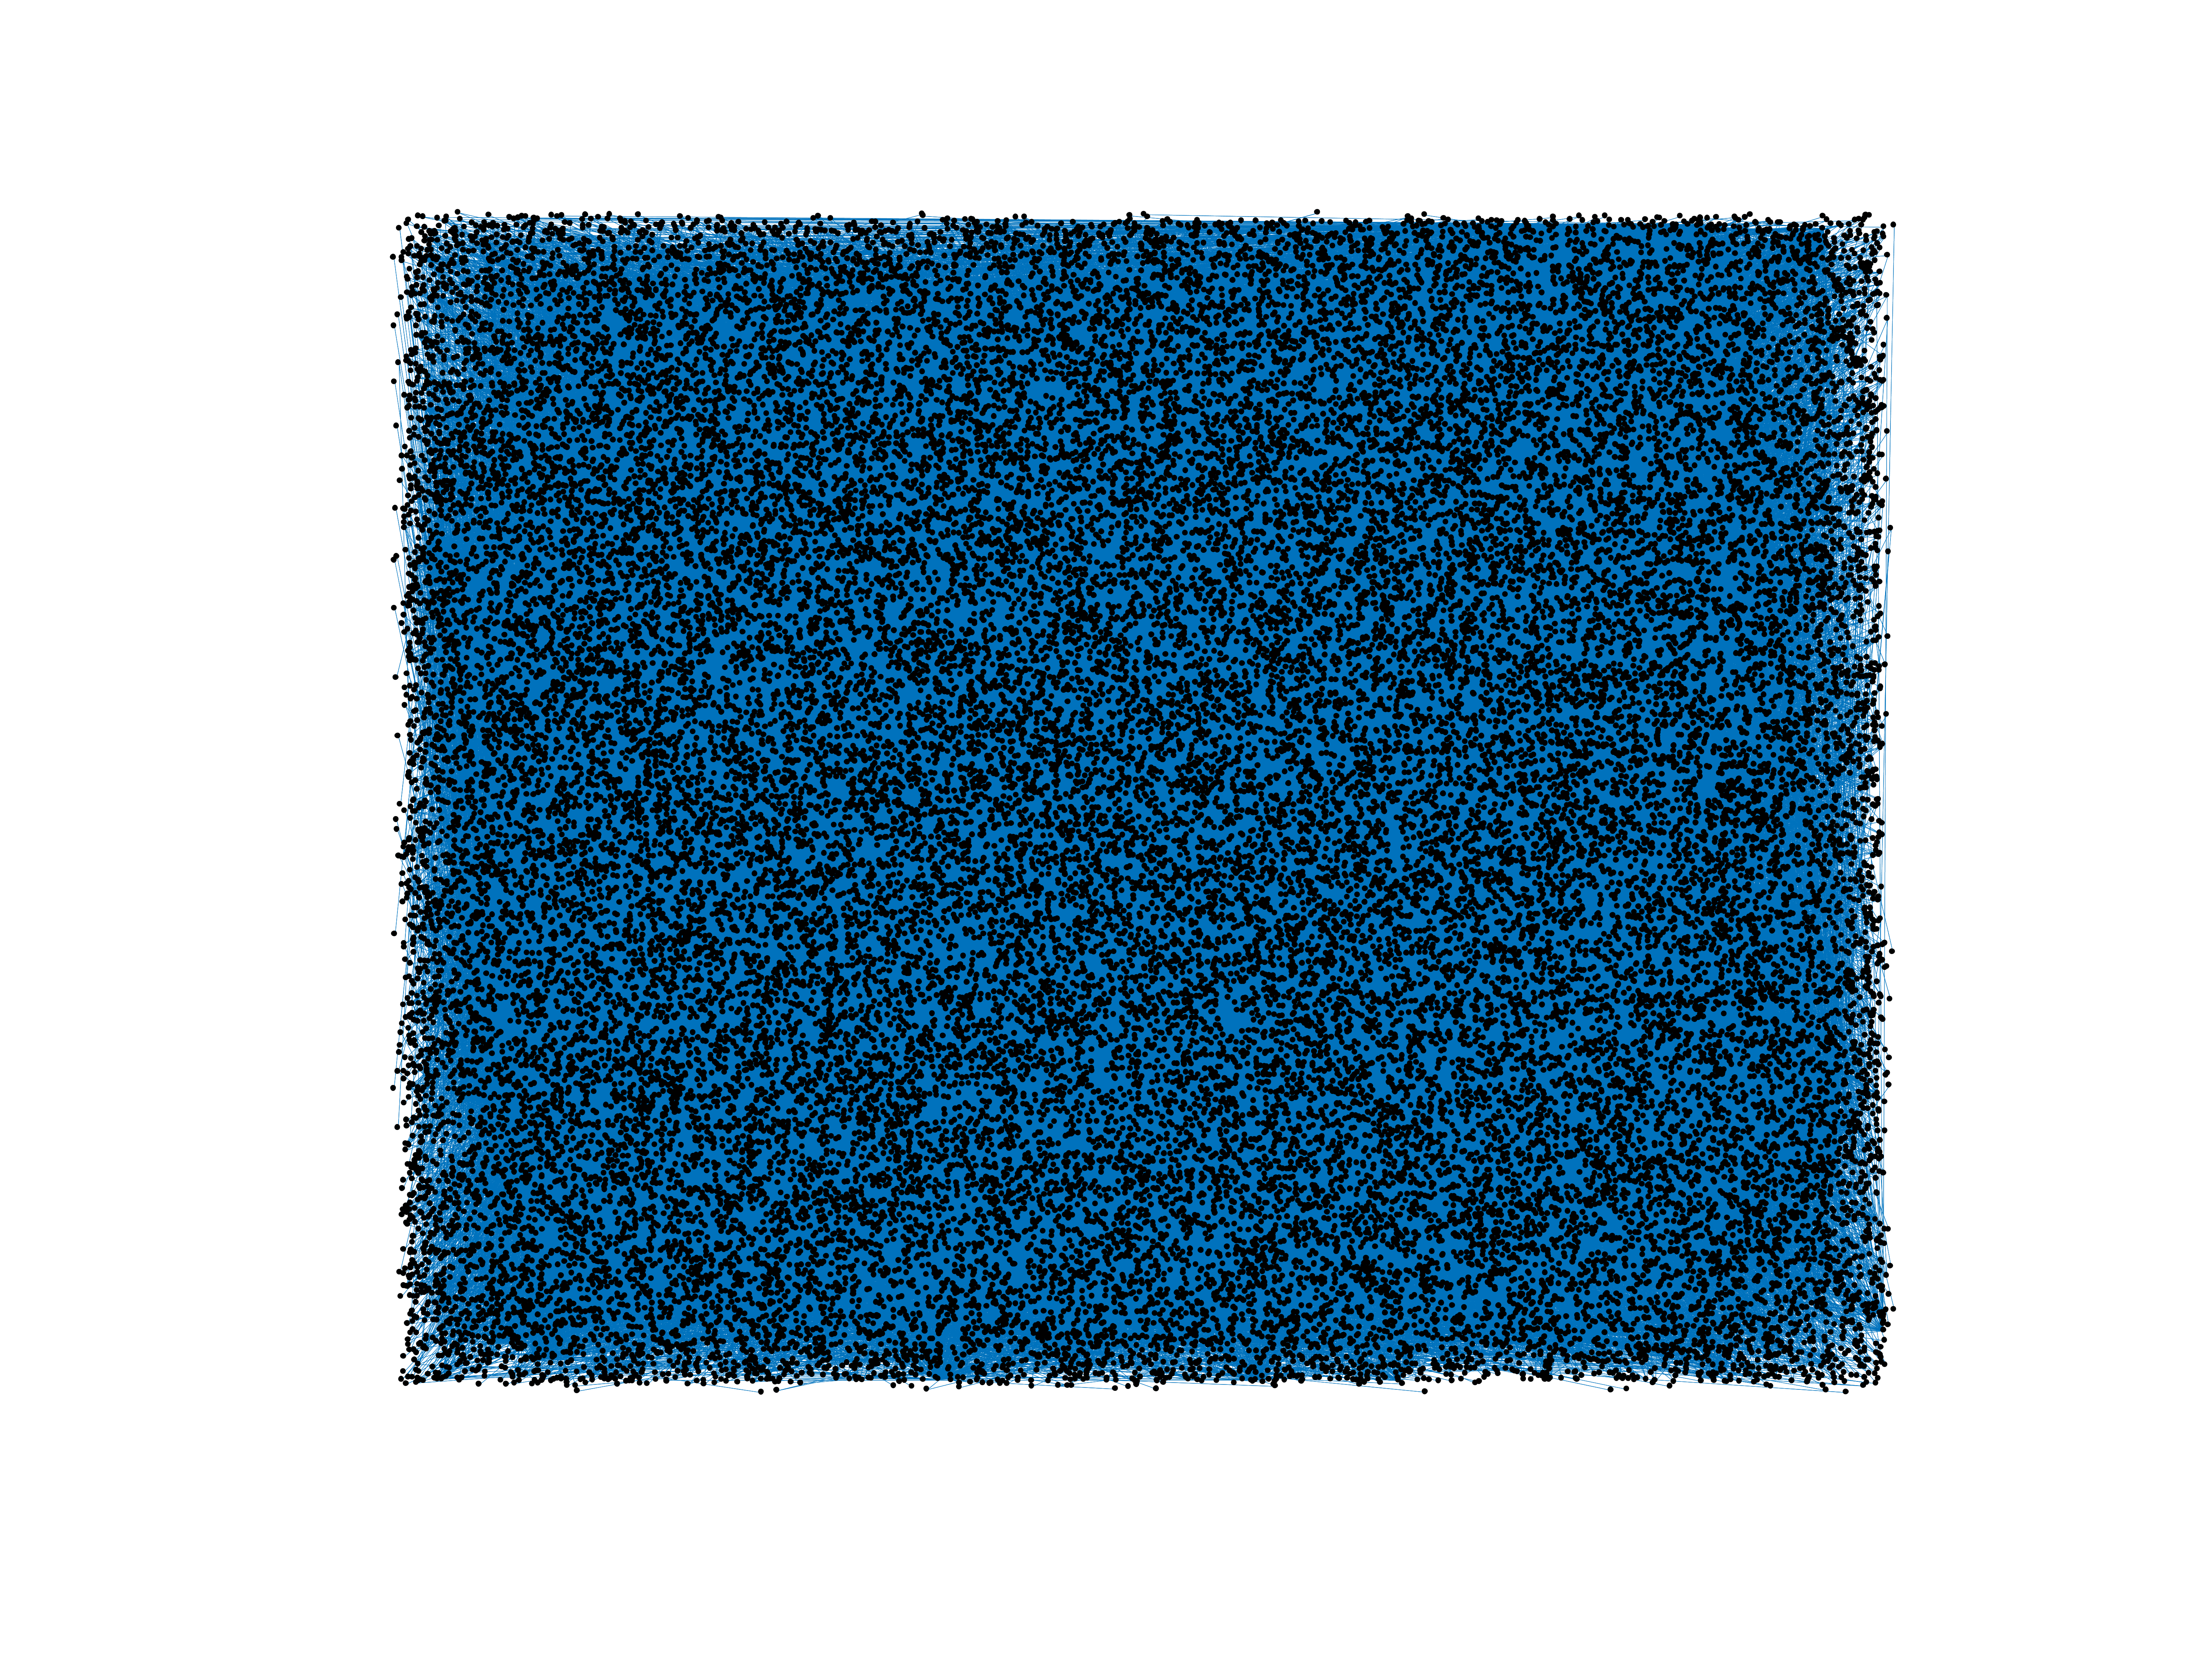
Wikiquote edits (ml)
This is the bipartite edit network of the Malayalam Wikisource. It contains
users and pages from the Malayalam Wikisource, connected by edit events. Each
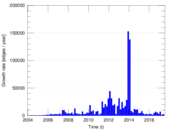
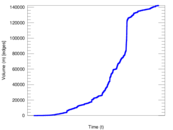
edge represents an edit. The dataset includes the timestamp of each edit.
Metadata
Statistics
| Size | n = | 43,889
|
| Left size | n1 = | 2,660
|
| Right size | n2 = | 41,229
|
| Volume | m = | 142,340
|
| Unique edge count | m̿ = | 78,582
|
| Wedge count | s = | 108,082,759
|
| Claw count | z = | 233,855,067,361
|
| Cross count | x = | 451,125,541,398,930
|
| Square count | q = | 8,696,203
|
| 4-Tour count | T4 = | 502,086,520
|
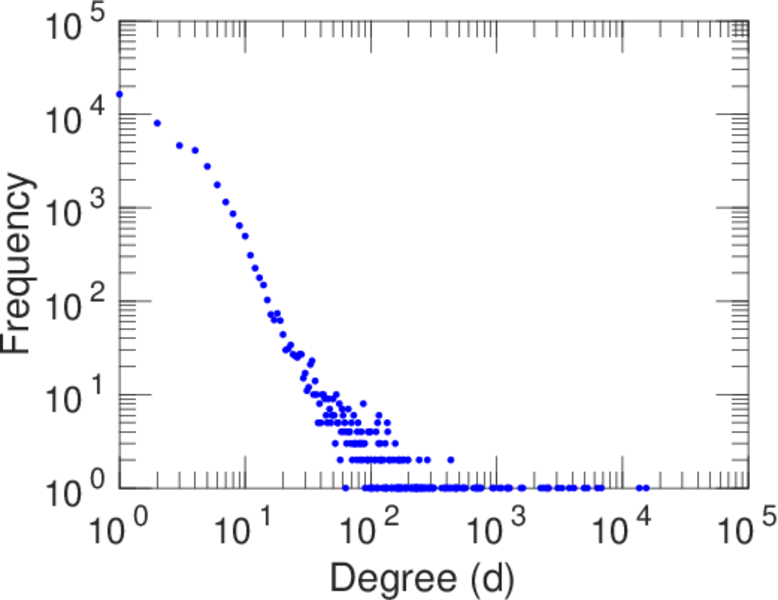
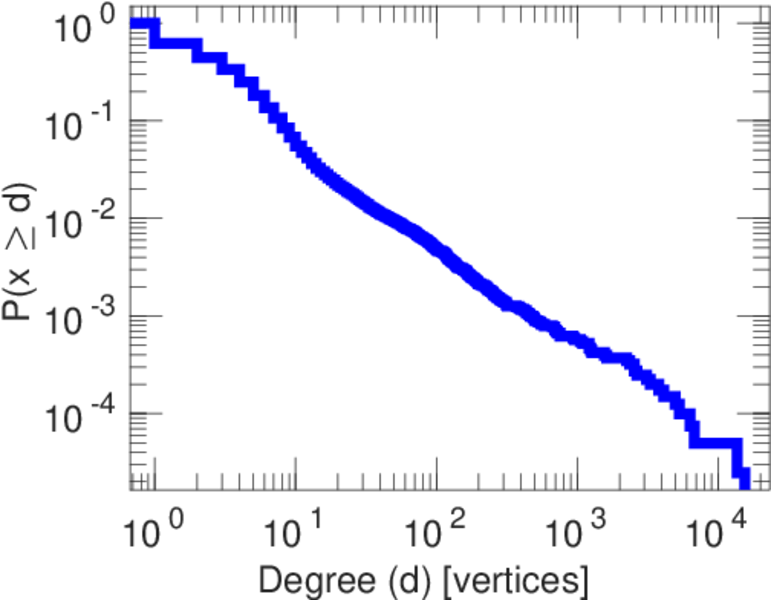
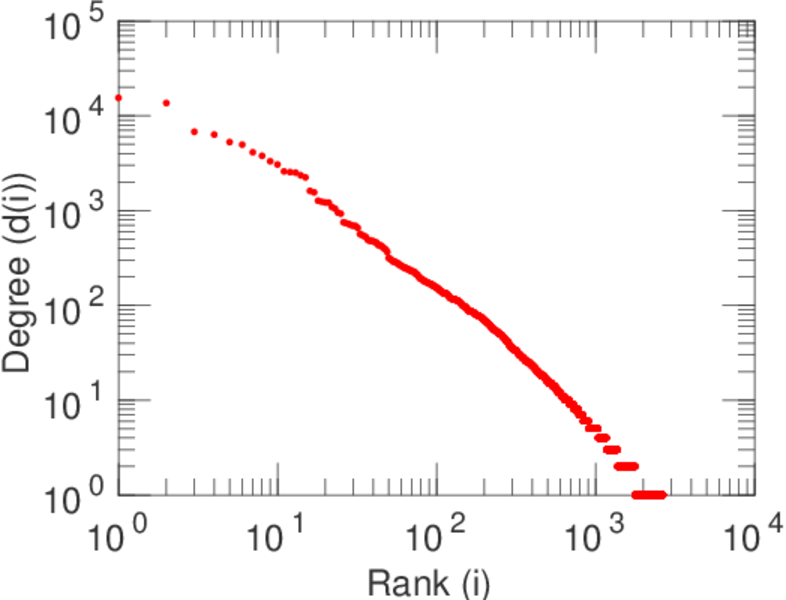
| Maximum degree | dmax = | 15,458
|
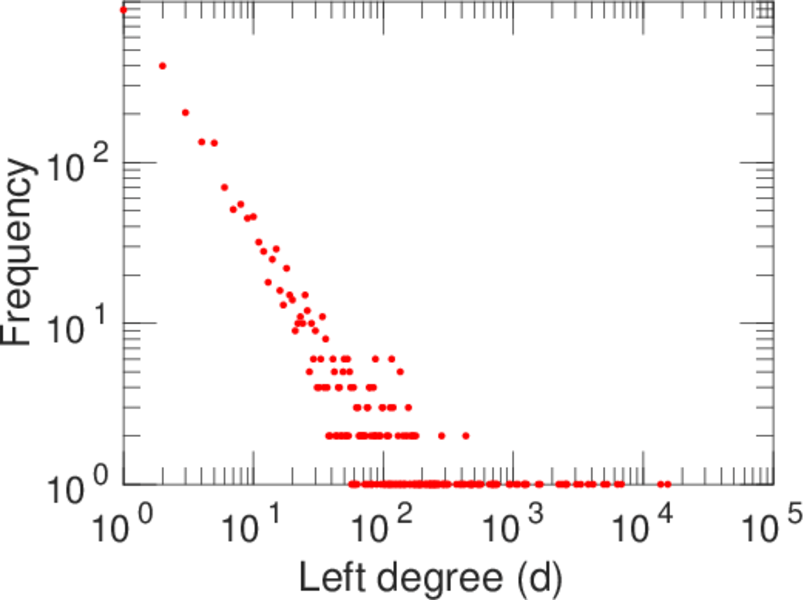
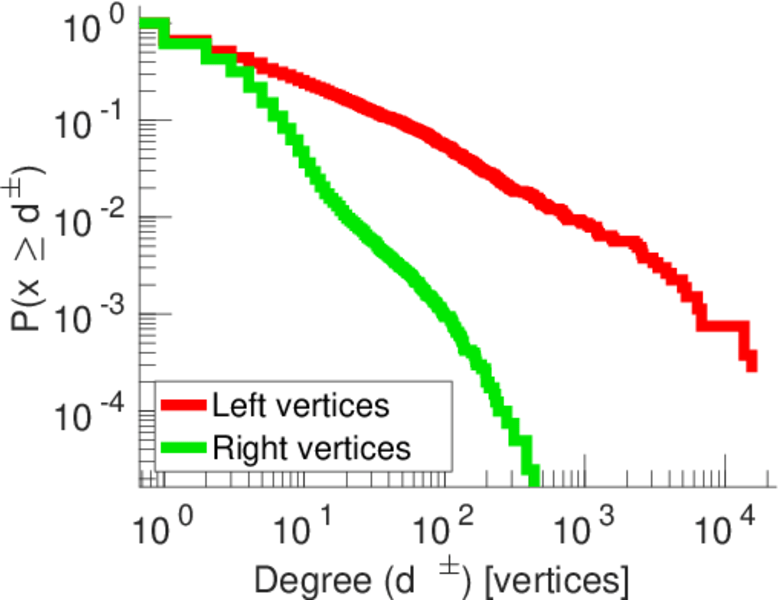
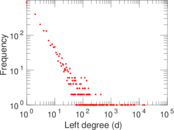
| Maximum left degree | d1max = | 15,458
|
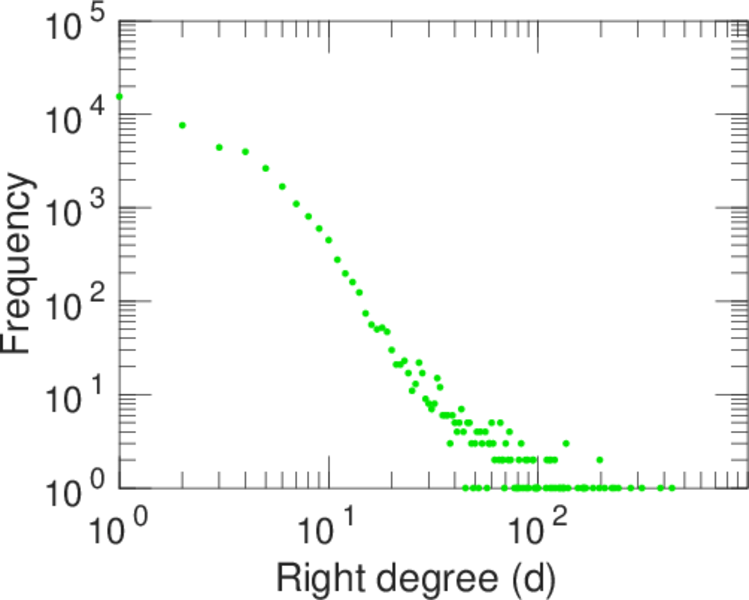
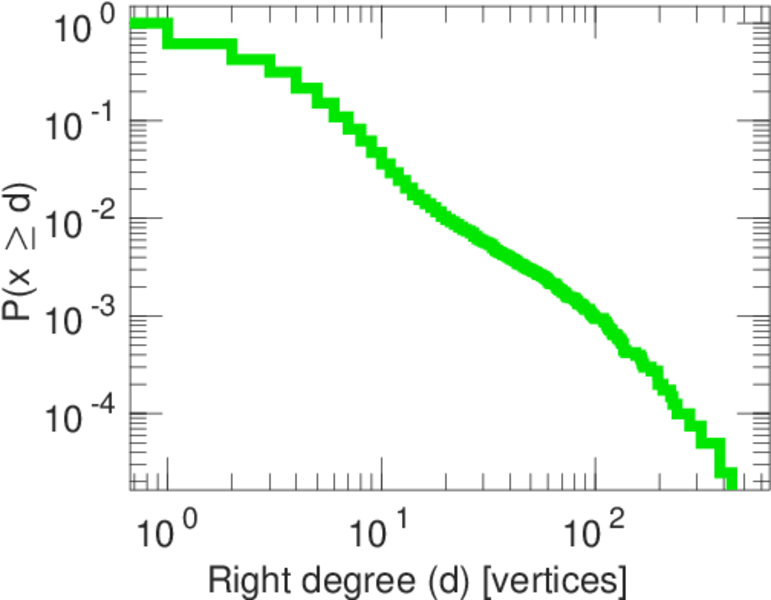
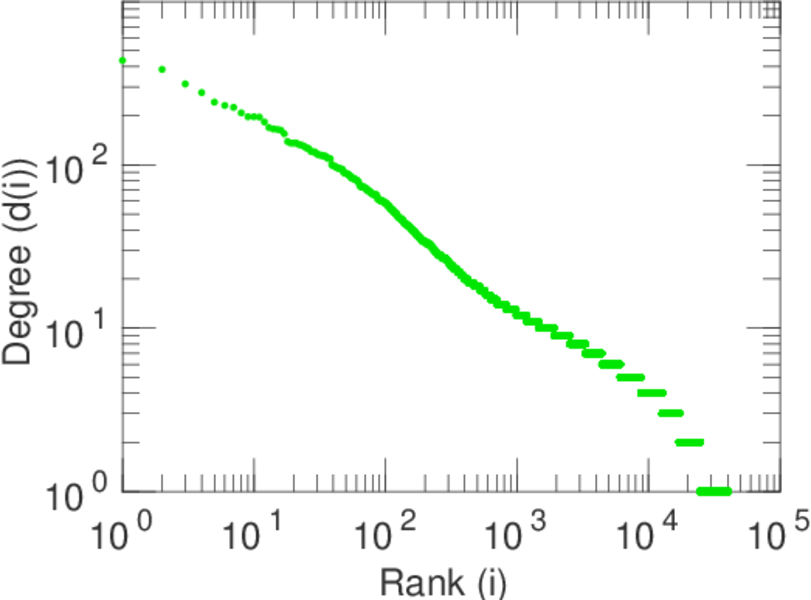
| Maximum right degree | d2max = | 436
|
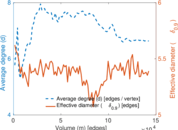
| Average degree | d = | 6.486 36
|
| Average left degree | d1 = | 53.511 3
|
| Average right degree | d2 = | 3.452 42
|
| Fill | p = | 0.000 716 537
|
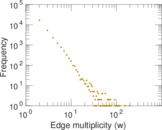
| Average edge multiplicity | m̃ = | 1.811 36
|
| Size of LCC | N = | 37,272
|
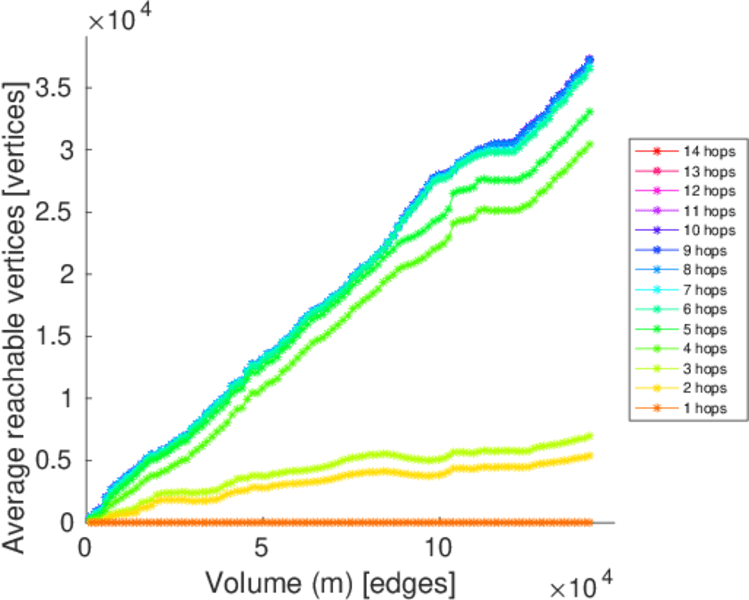
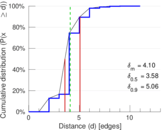
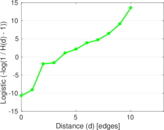
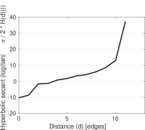
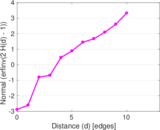
| Diameter | δ = | 13
|
| 50-Percentile effective diameter | δ0.5 = | 3.577 74
|
| 90-Percentile effective diameter | δ0.9 = | 5.064 17
|
| Median distance | δM = | 4
|
| Mean distance | δm = | 4.098 25
|
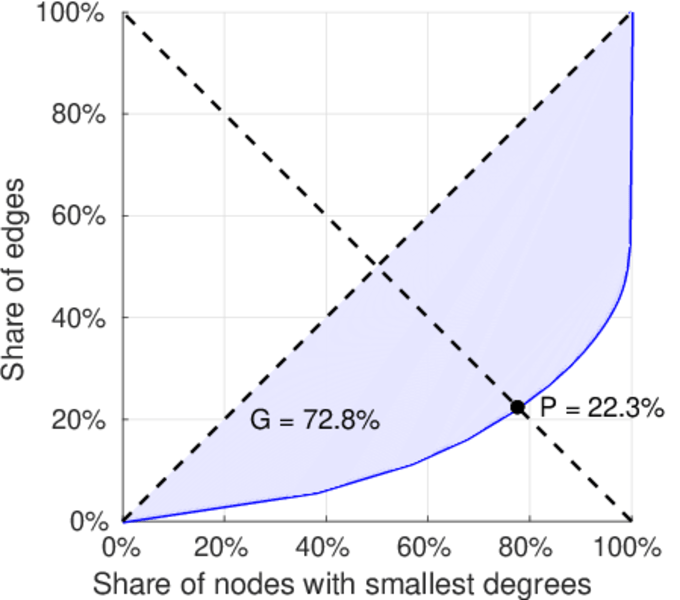
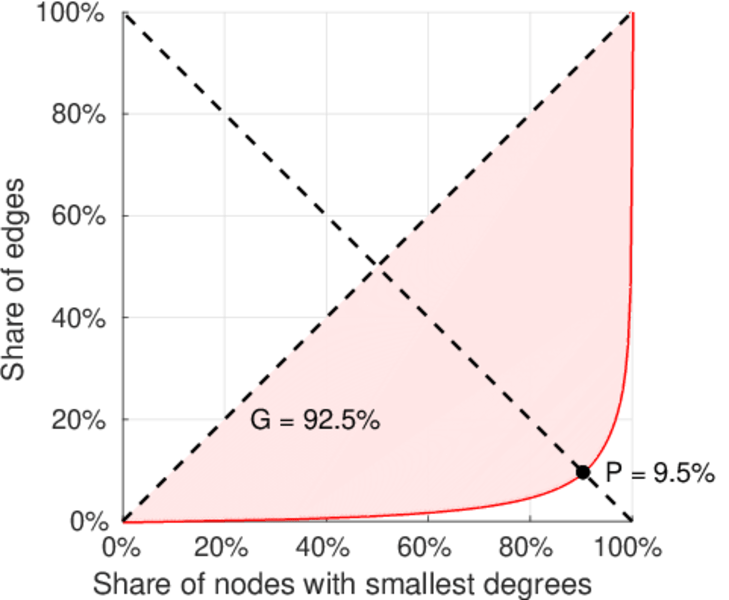
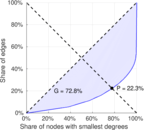
| Gini coefficient | G = | 0.737 246
|
| Balanced inequality ratio | P = | 0.219 327
|
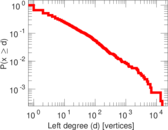
| Left balanced inequality ratio | P1 = | 0.094 738 0
|
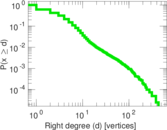
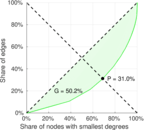
| Right balanced inequality ratio | P2 = | 0.310 363
|
| Relative edge distribution entropy | Her = | 0.772 570
|
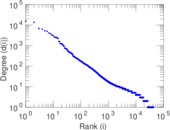
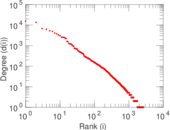
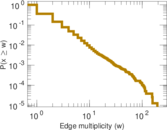
| Power law exponent | γ = | 2.979 43
|
| Tail power law exponent | γt = | 1.861 00
|
| Tail power law exponent with p | γ3 = | 1.861 00
|
| p-value | p = | 0.007 000 00
|
| Left tail power law exponent with p | γ3,1 = | 1.651 00
|
| Left p-value | p1 = | 0.018 000 0
|
| Right tail power law exponent with p | γ3,2 = | 3.761 00
|
| Right p-value | p2 = | 0.000 00
|
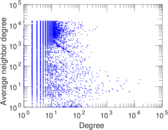
| Degree assortativity | ρ = | −0.158 987
|
| Degree assortativity p-value | pρ = | 0.000 00
|
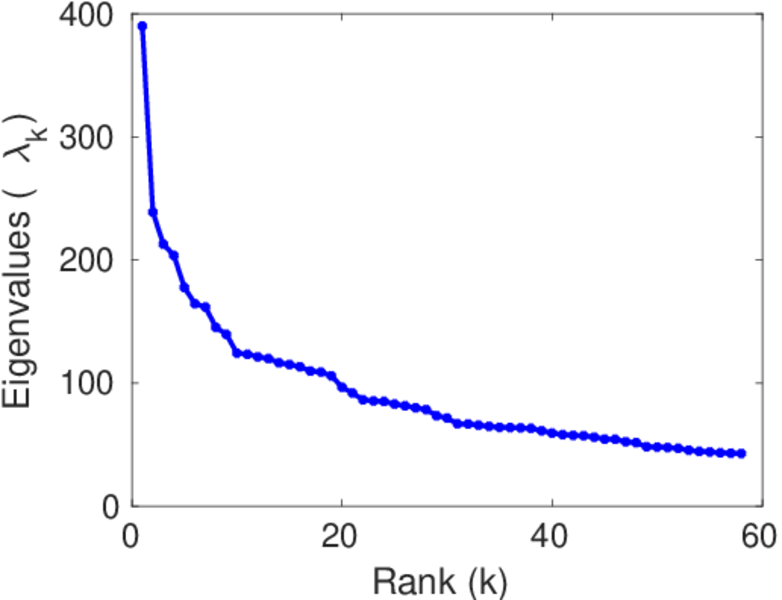
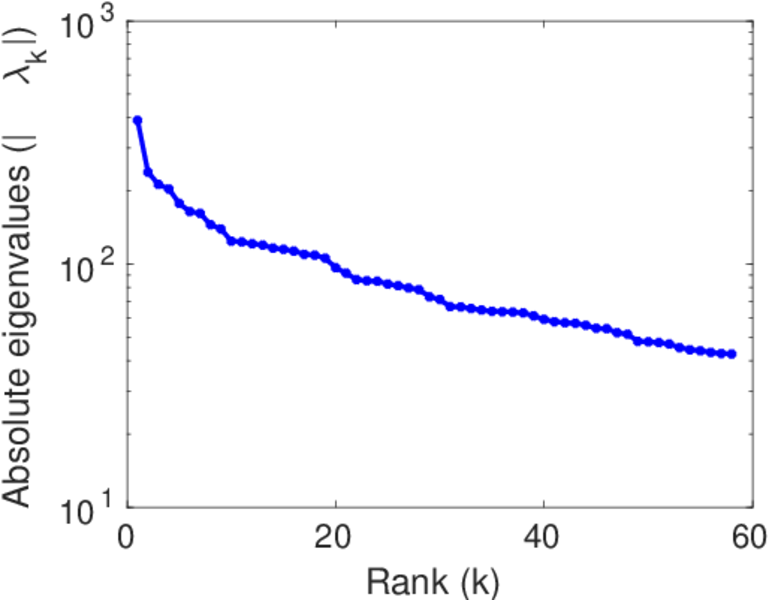
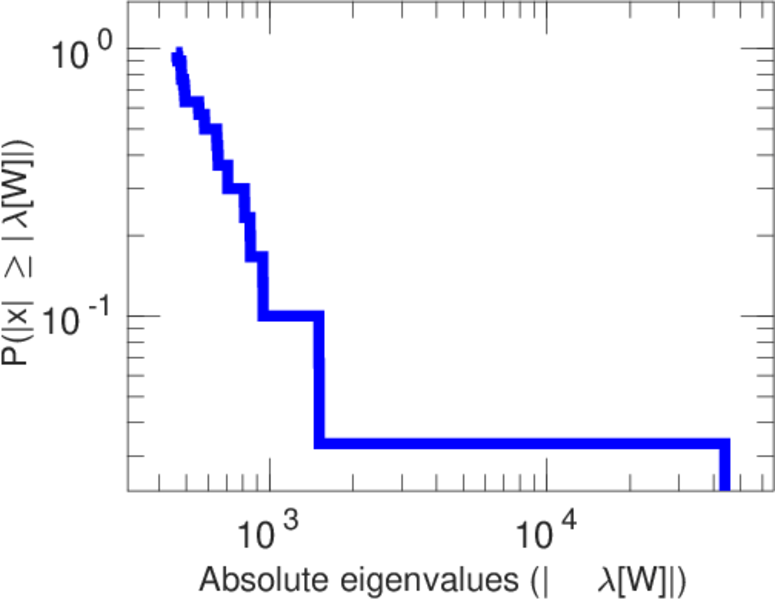
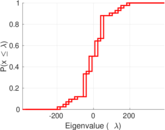
| Spectral norm | α = | 389.915
|
| Algebraic connectivity | a = | 0.004 612 21
|
| Spectral separation | |λ1[A] / λ2[A]| = | 1.632 76
|
| Controllability | C = | 39,659
|
| Relative controllability | Cr = | 0.923 226
|
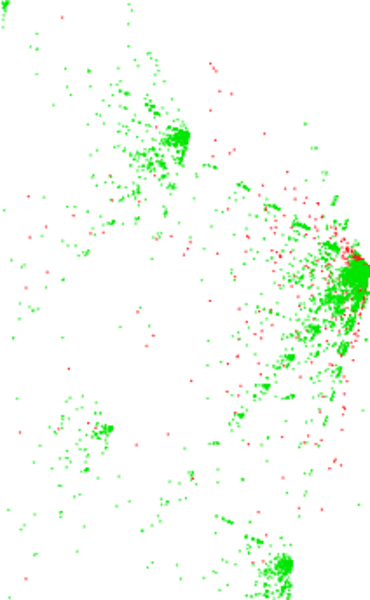
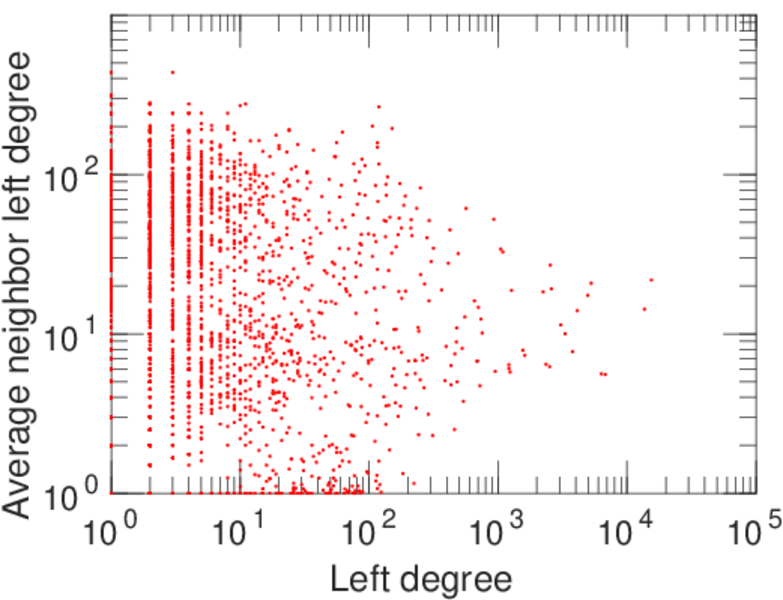
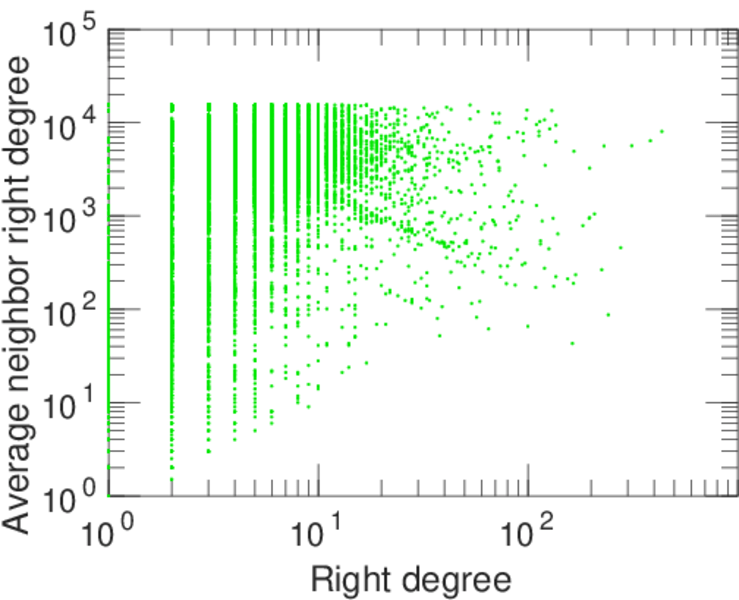
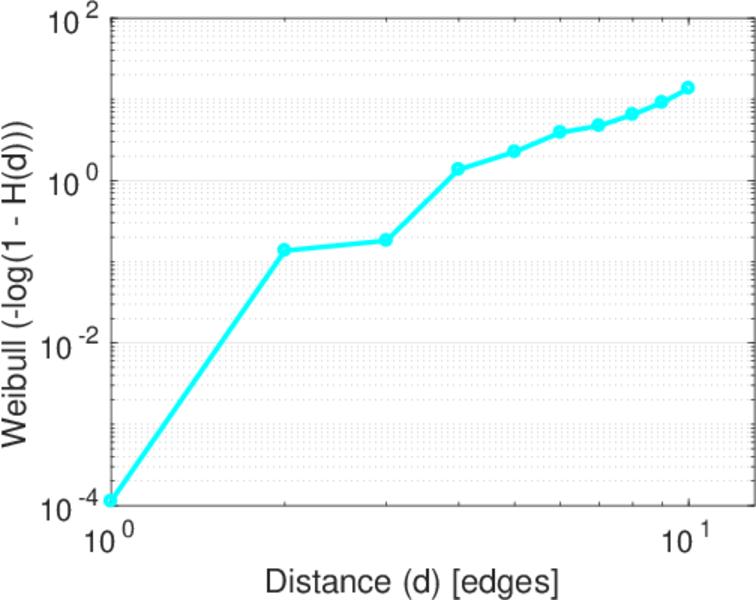
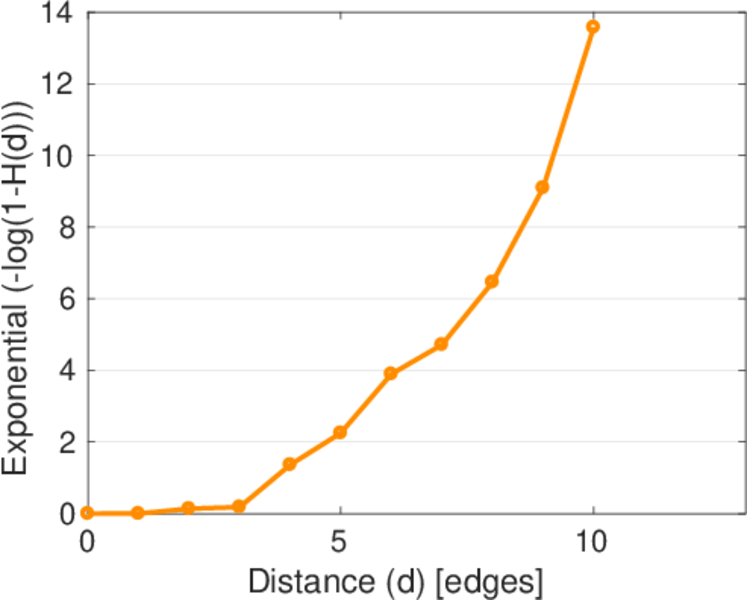
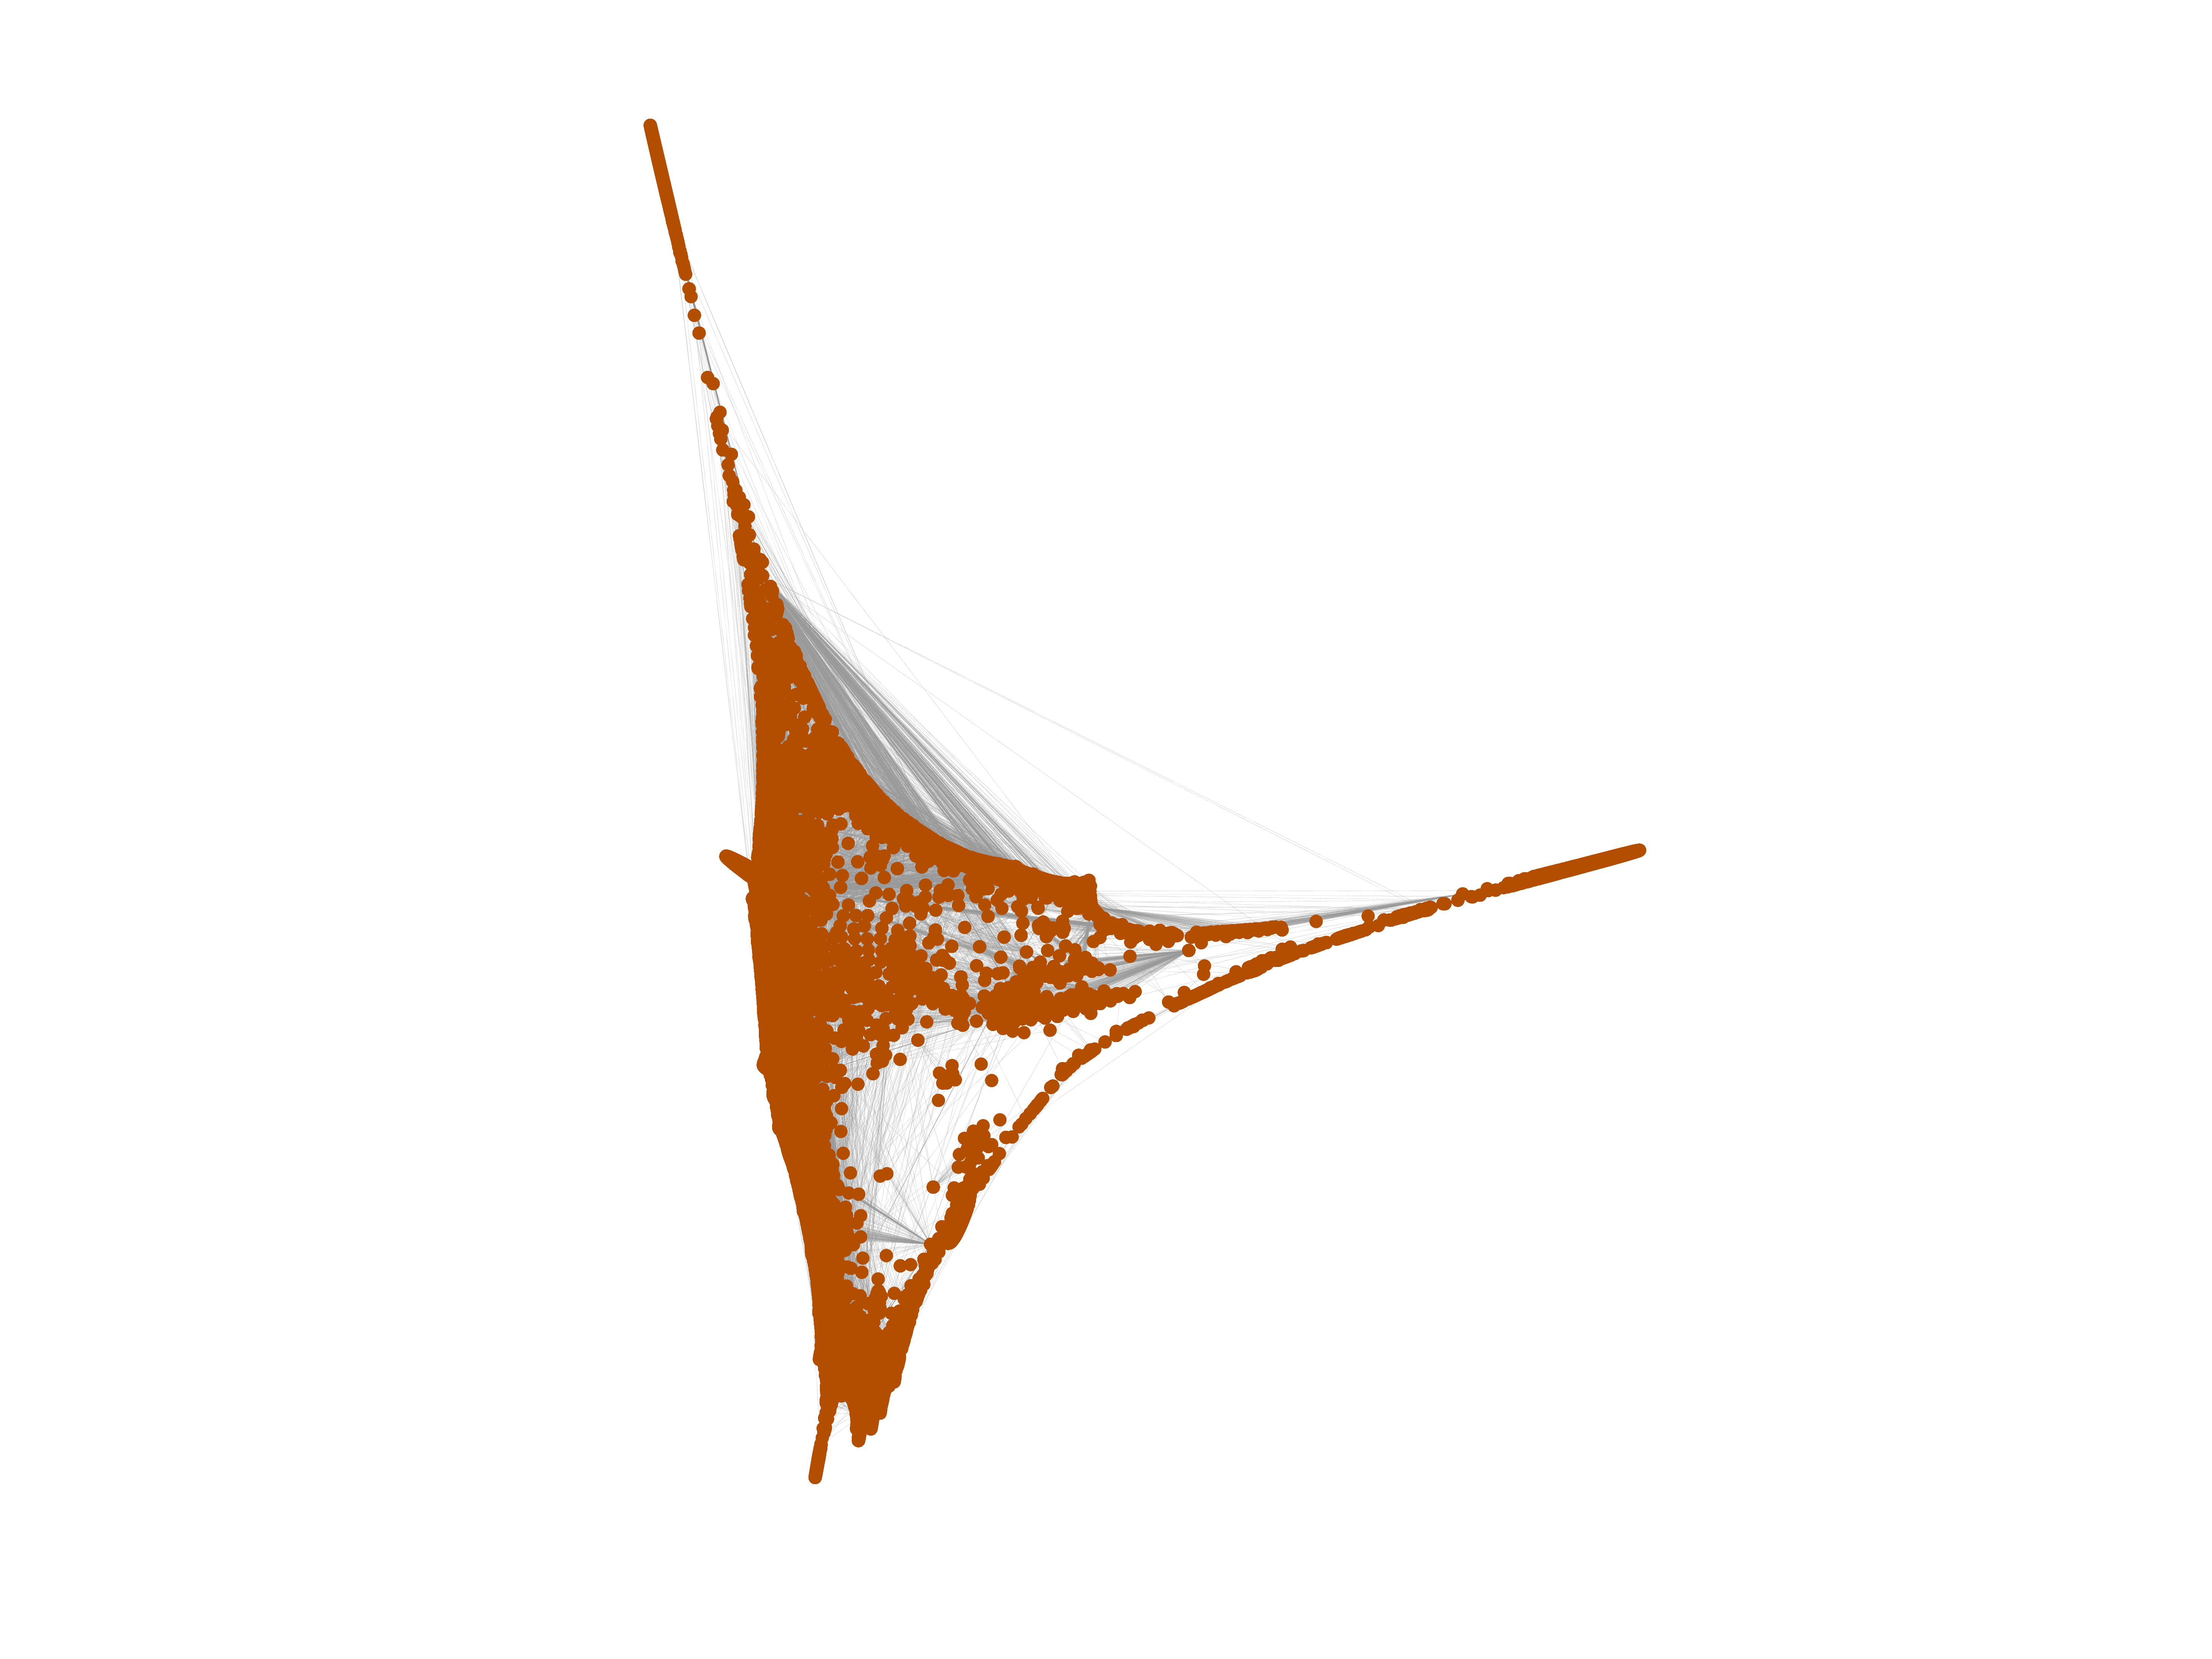
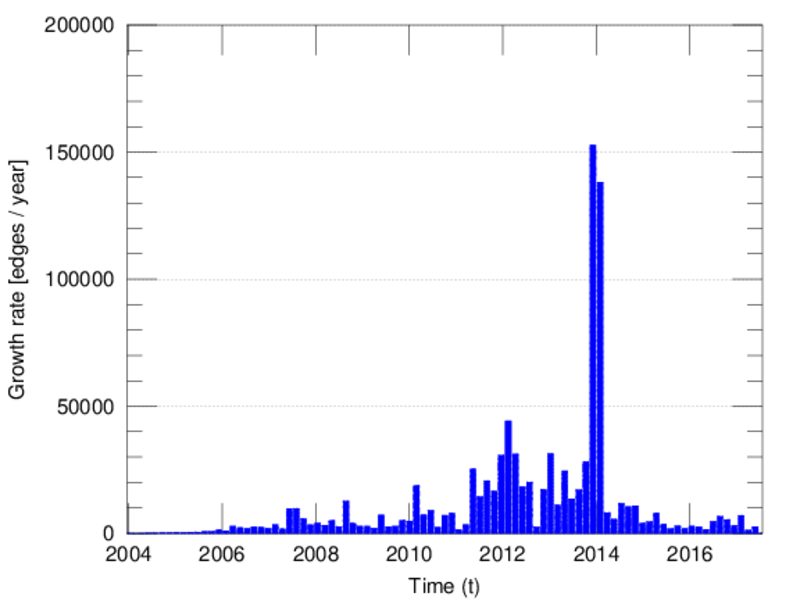
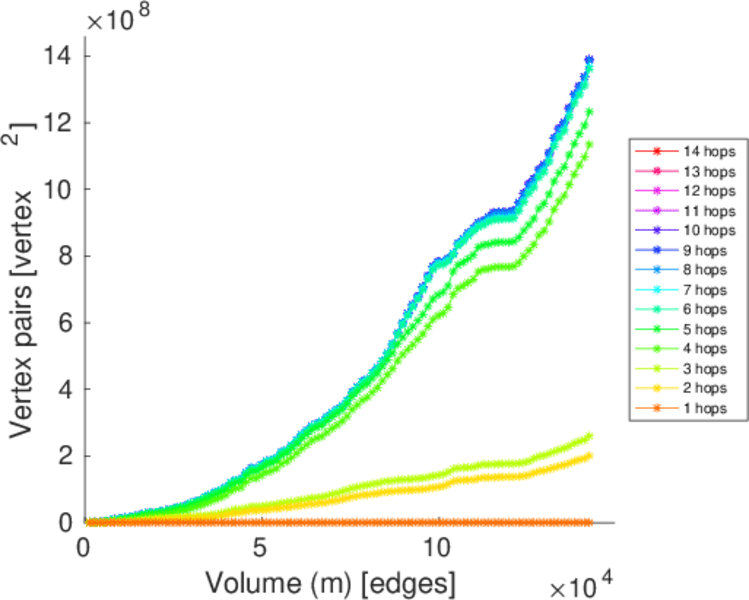
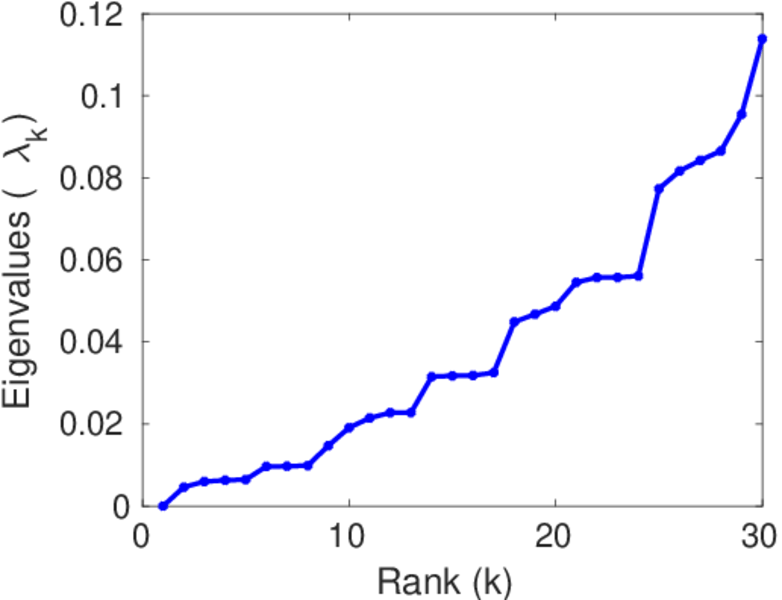
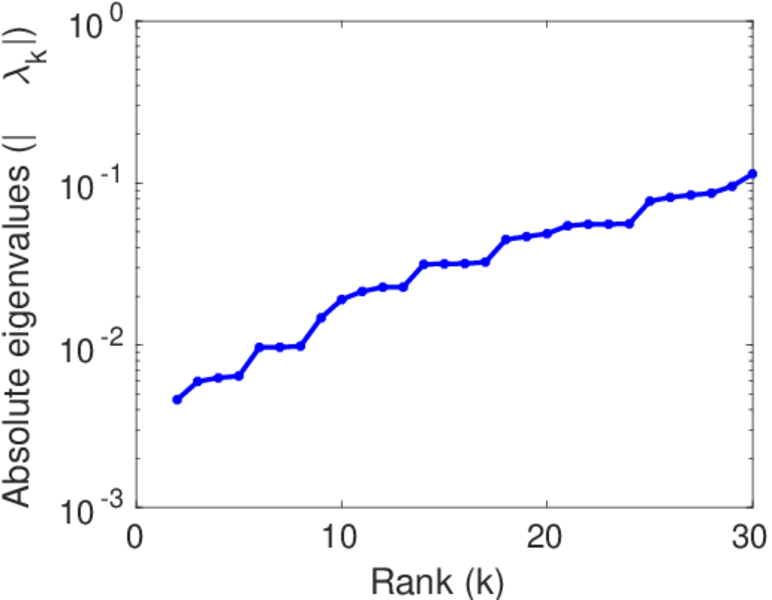
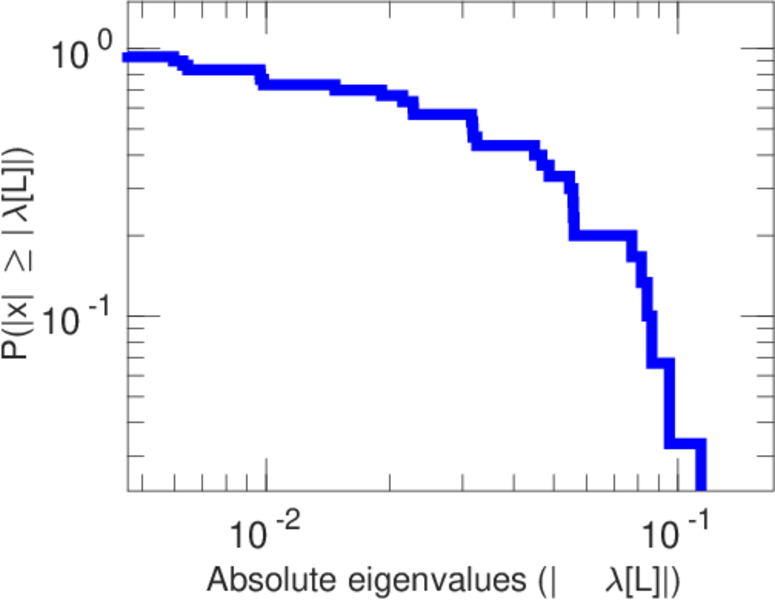
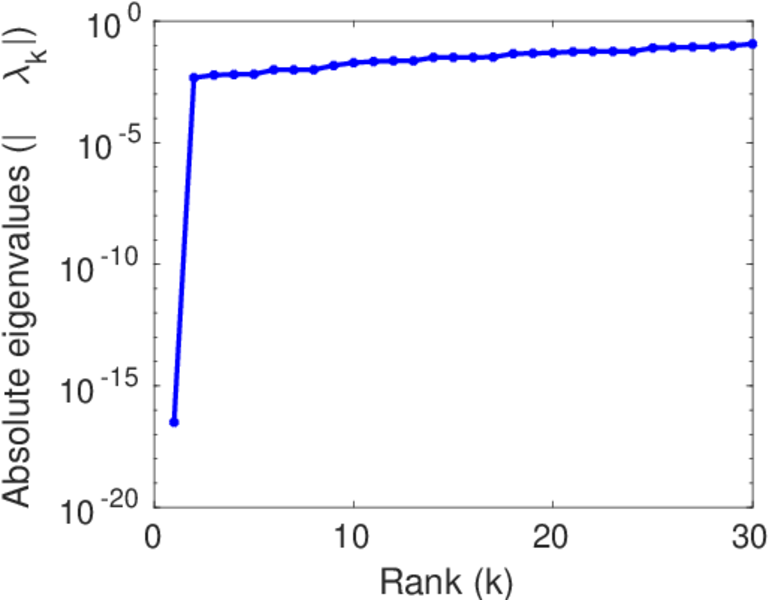
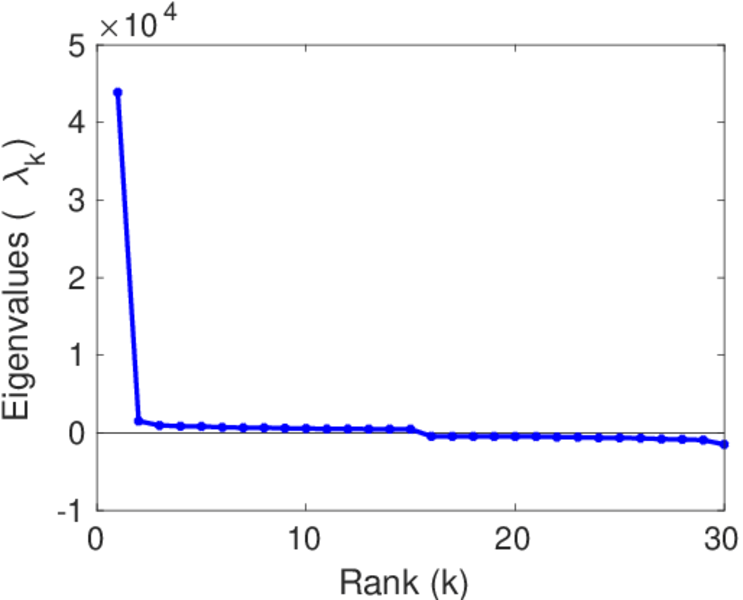
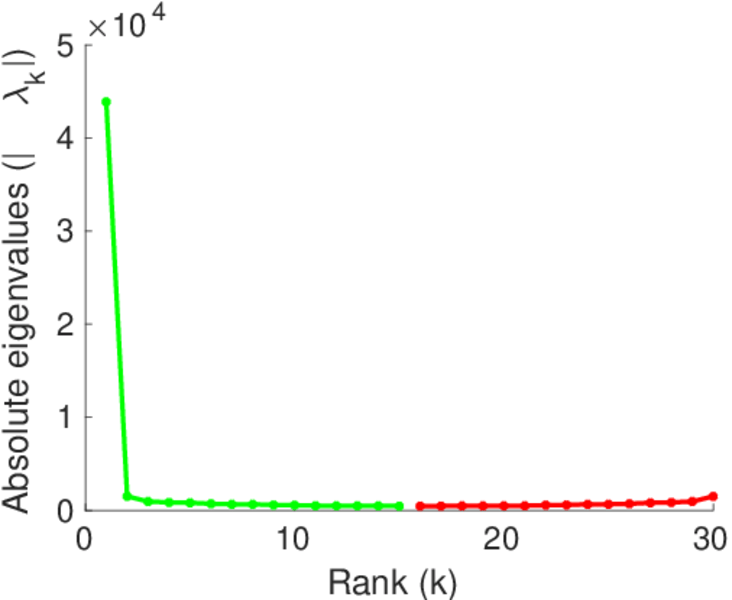
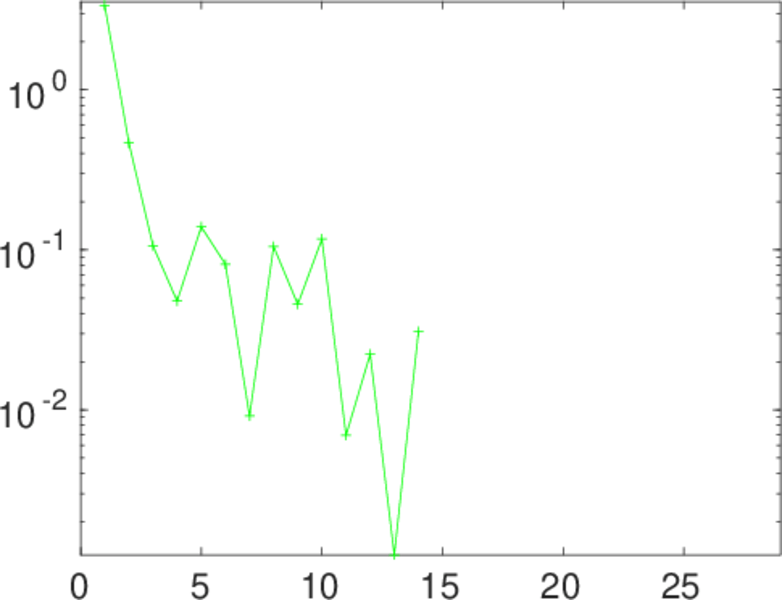
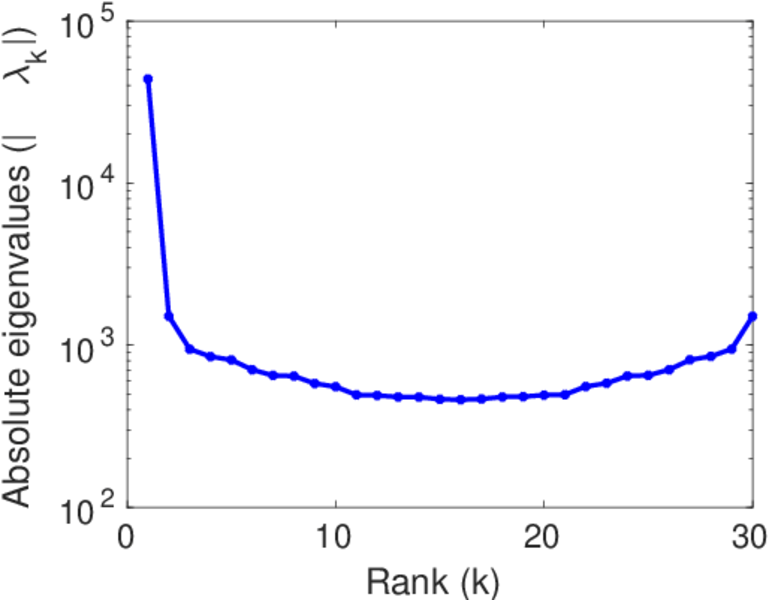
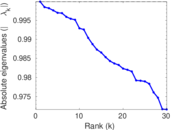
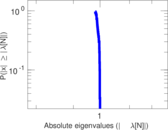
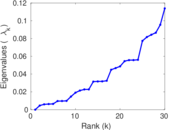
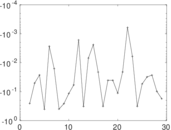
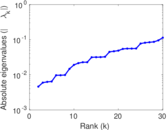
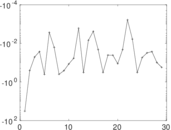
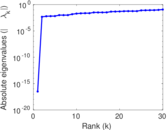
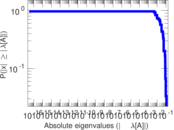
Plots


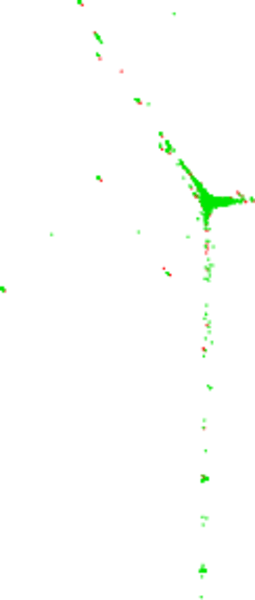
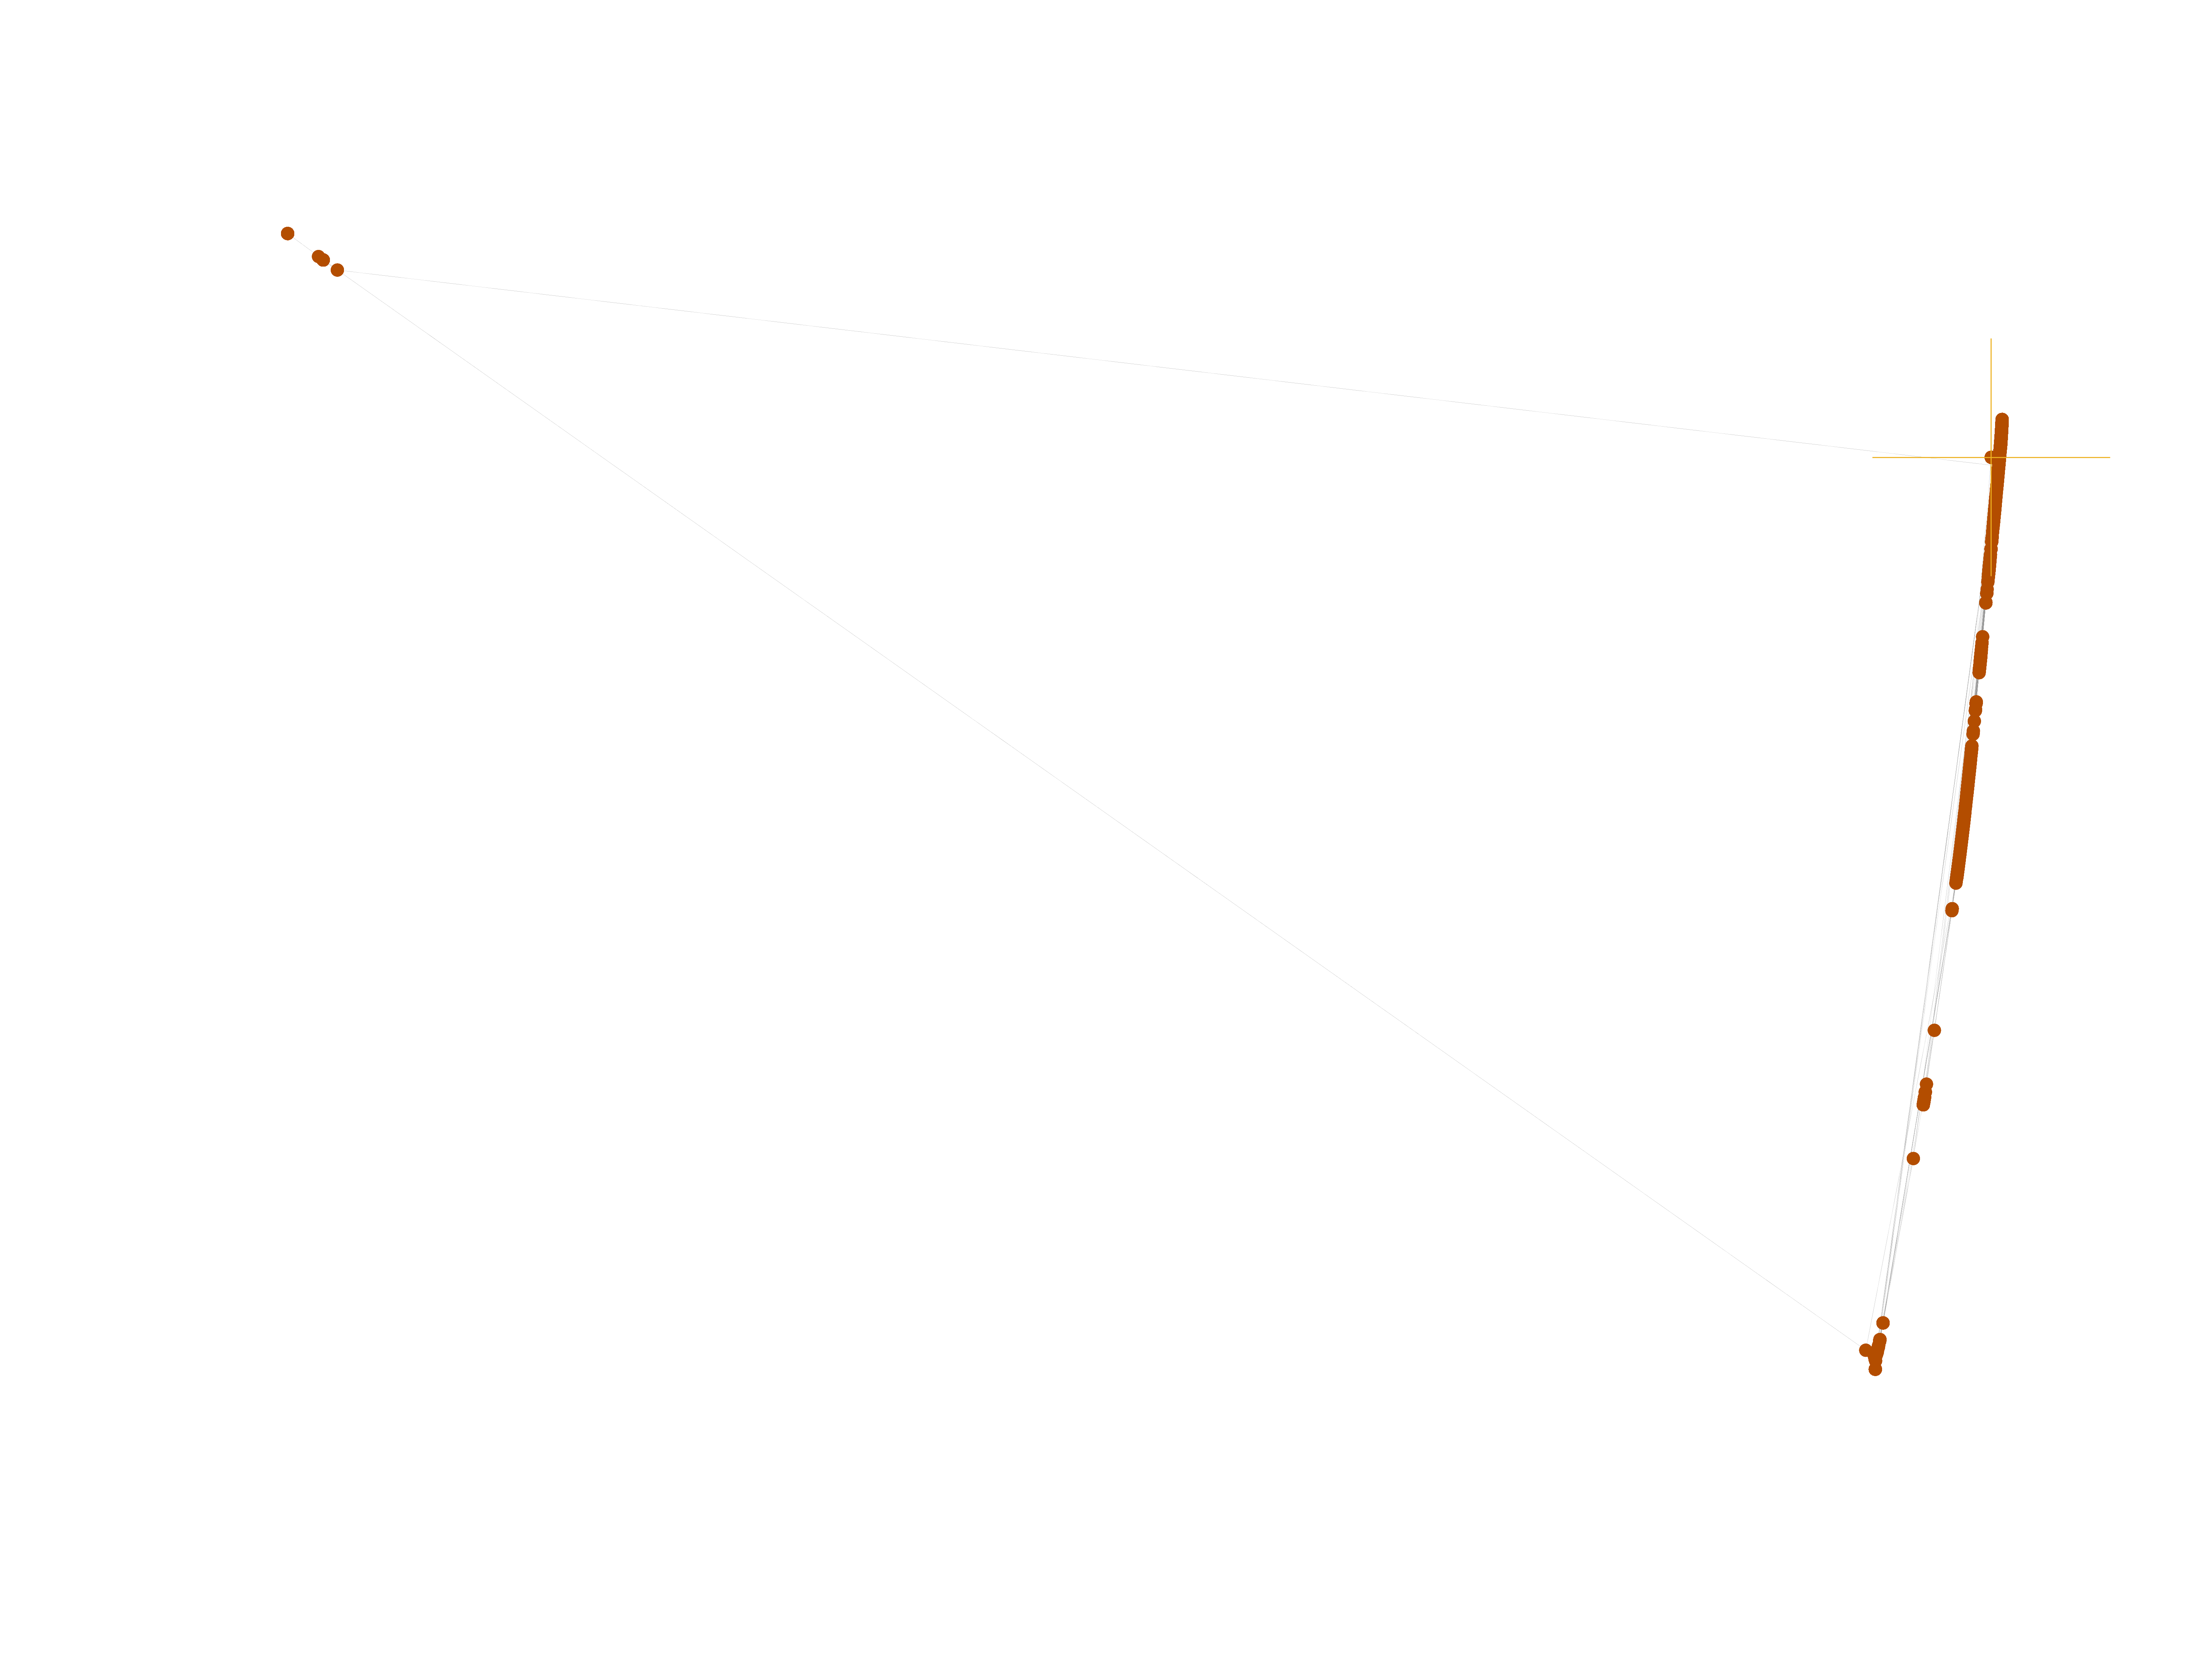
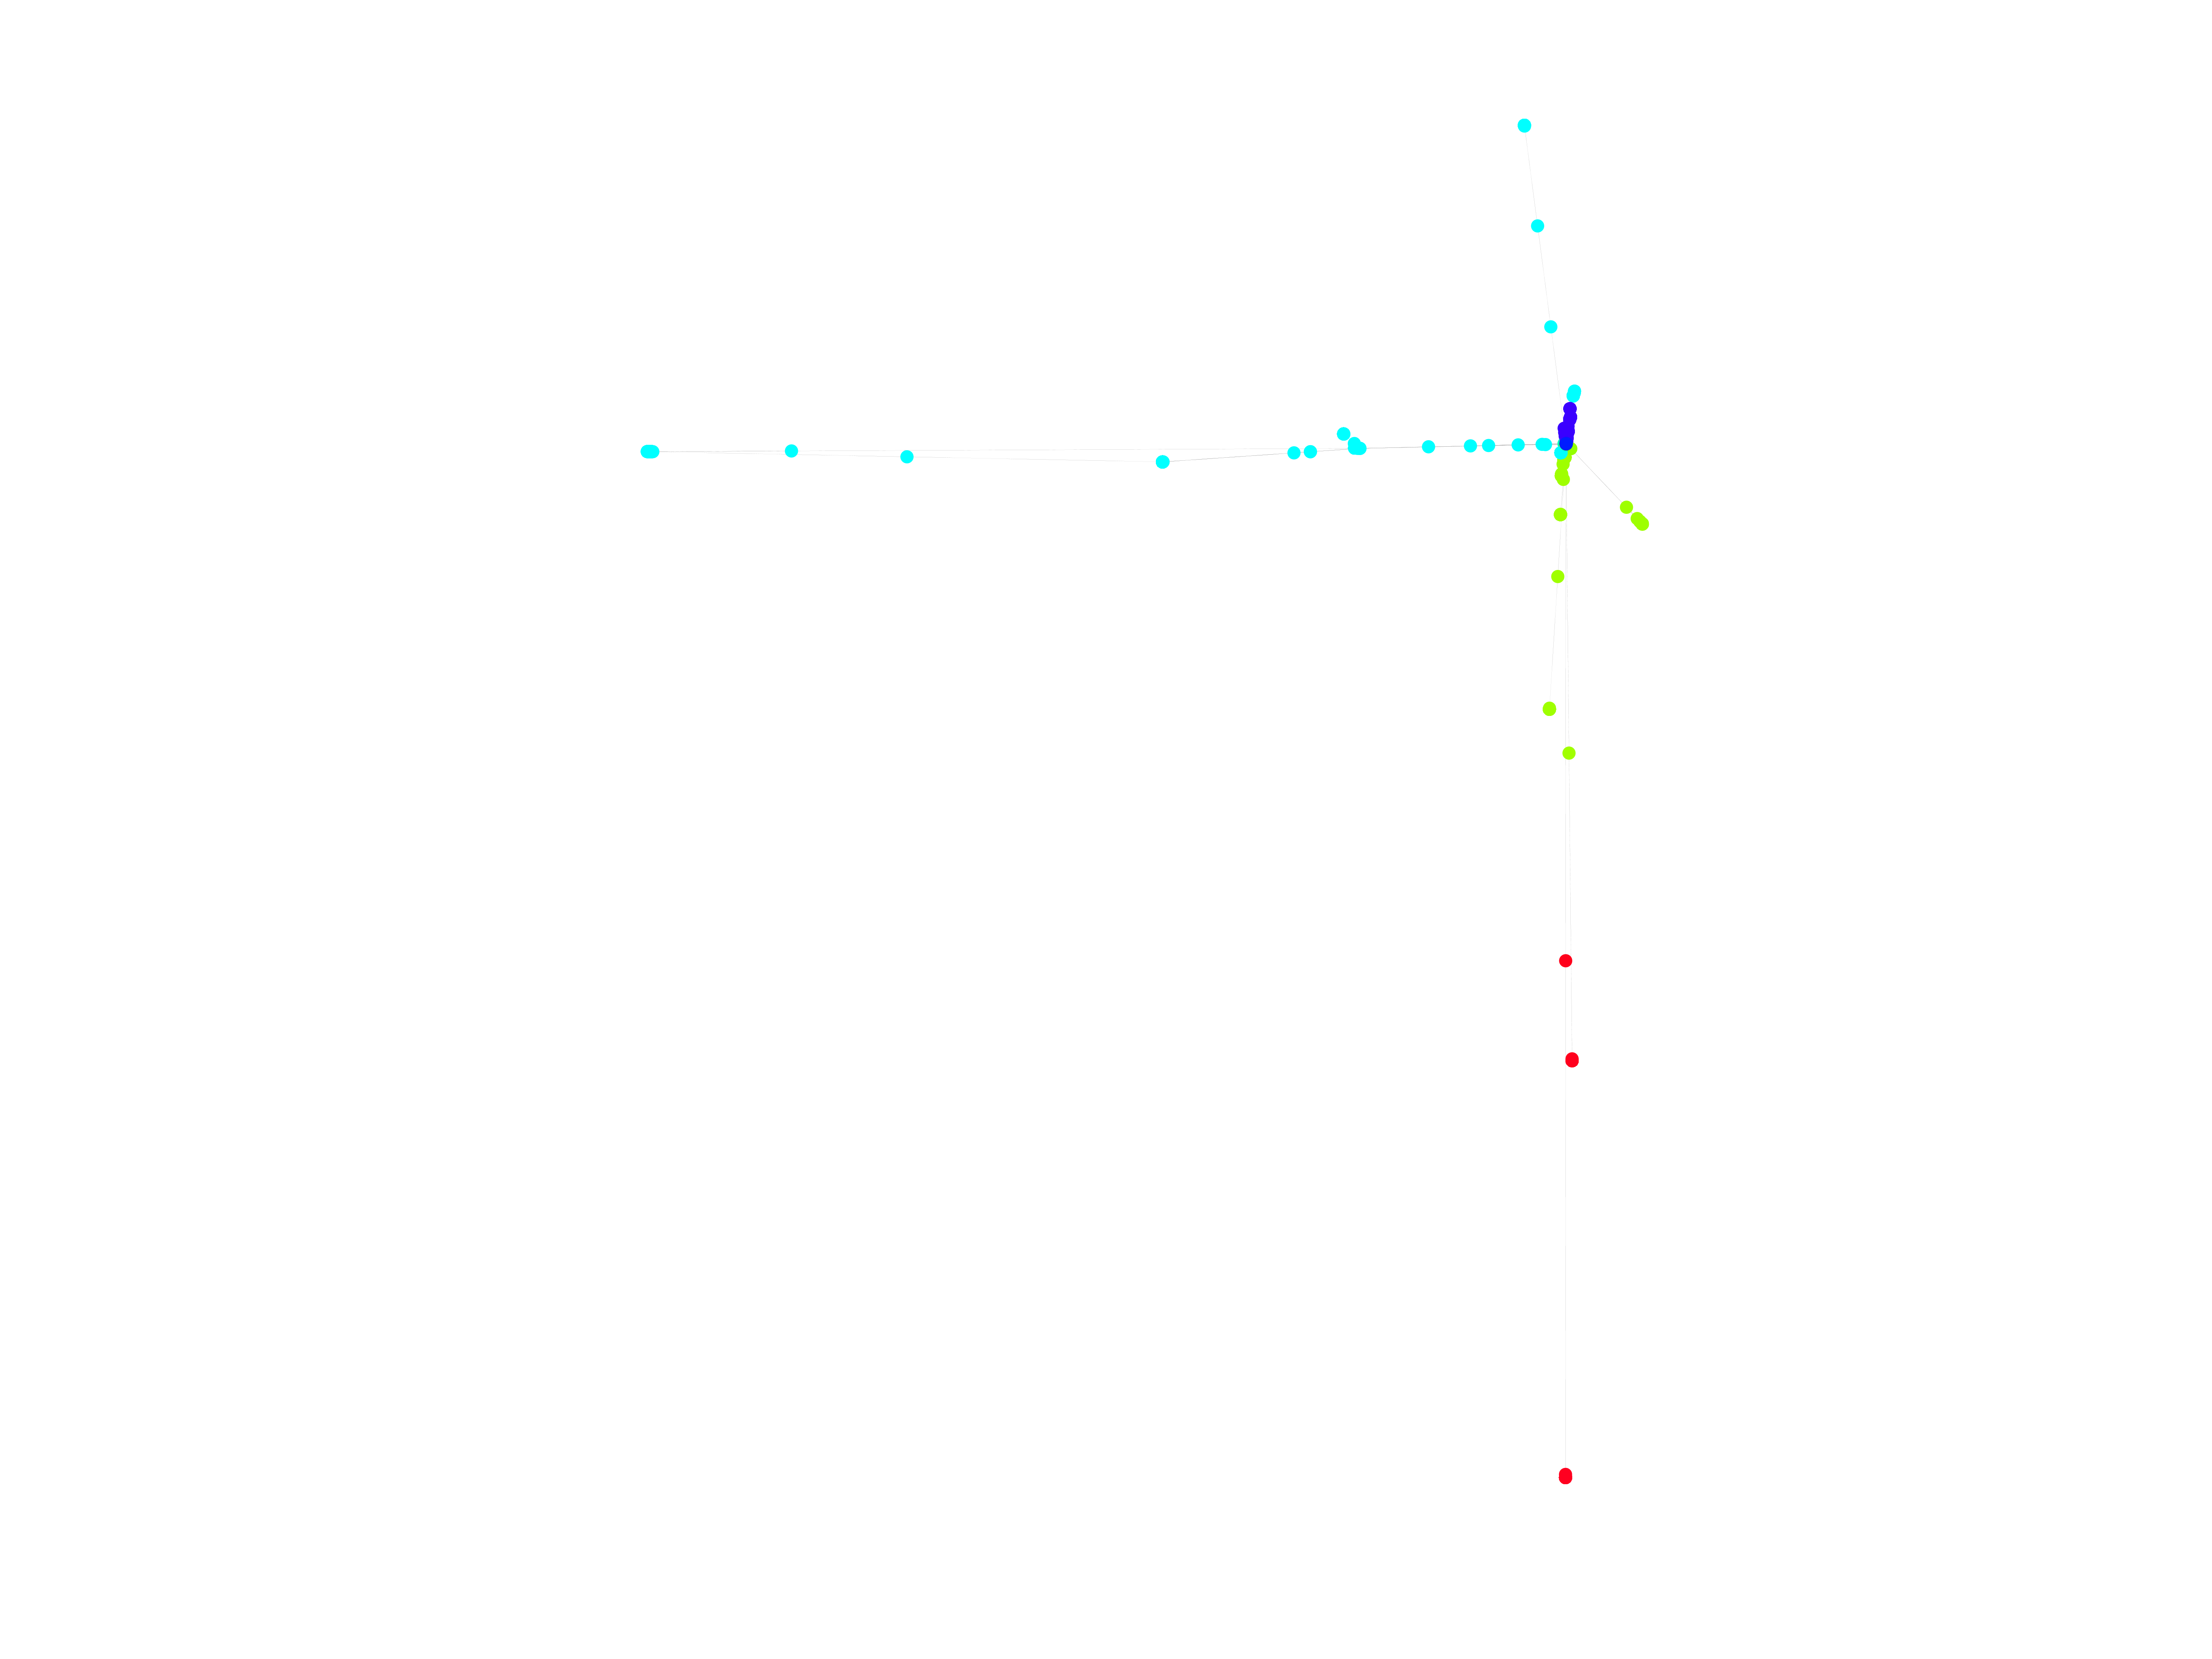
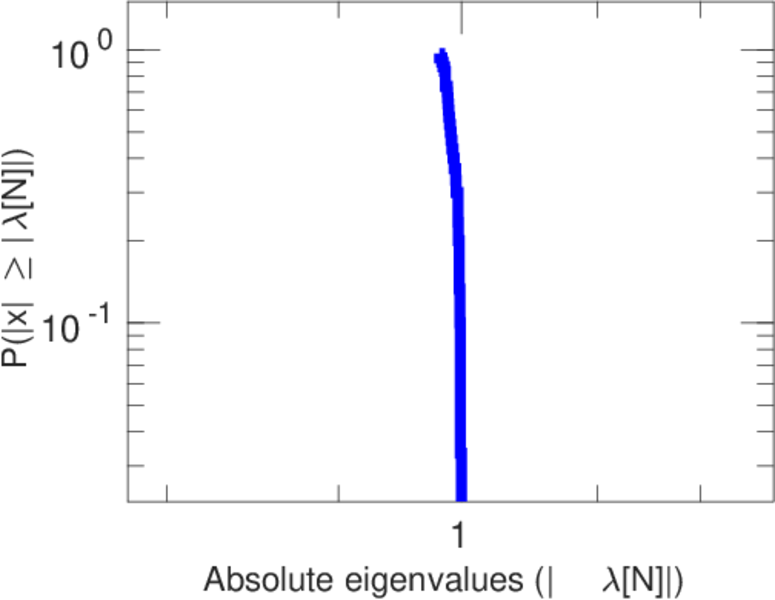
Matrix decompositions plots


Downloads
References
|
[1]
|
Jérôme Kunegis.
KONECT – The Koblenz Network Collection.
In Proc. Int. Conf. on World Wide Web Companion, pages
1343–1350, 2013.
[ http ]
|
|
[2]
|
Wikimedia Foundation.
Wikimedia downloads.
http://dumps.wikimedia.org/, January 2010.
|
 KONECT ‣ Networks ‣
Buy Me a Coffee
KONECT ‣ Networks ‣
Buy Me a Coffee