Wiktionary edits (ml)
This is the bipartite edit network of the Malayalam Wiktionary. It contains
users and pages from the Malayalam Wiktionary, connected by edit events. Each
edge represents an edit. The dataset includes the timestamp of each edit.
Metadata
Statistics
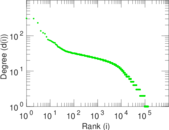
| Size | n = | 137,011
|
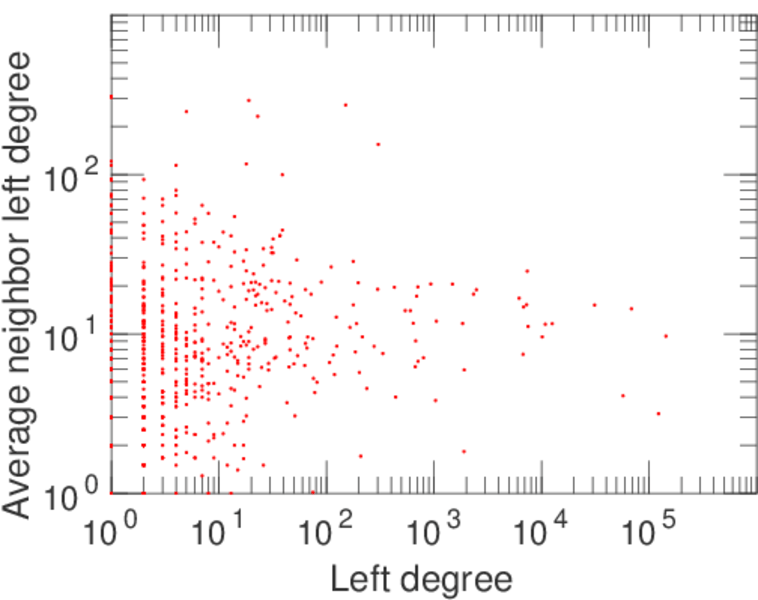
| Left size | n1 = | 811
|
| Right size | n2 = | 136,200
|
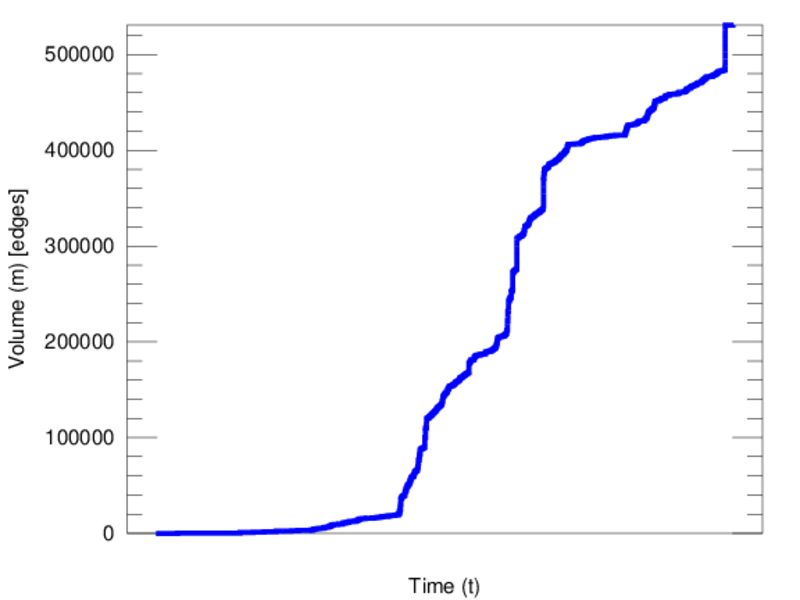
| Volume | m = | 530,712
|
| Unique edge count | m̿ = | 324,416
|
| Wedge count | s = | 8,258,174,198
|
| Claw count | z = | 216,345,894,498,146
|
| Cross count | x = | 4,783,835,502,491,454,464
|
| Square count | q = | 2,178,576,967
|
| 4-Tour count | T4 = | 50,461,961,656
|
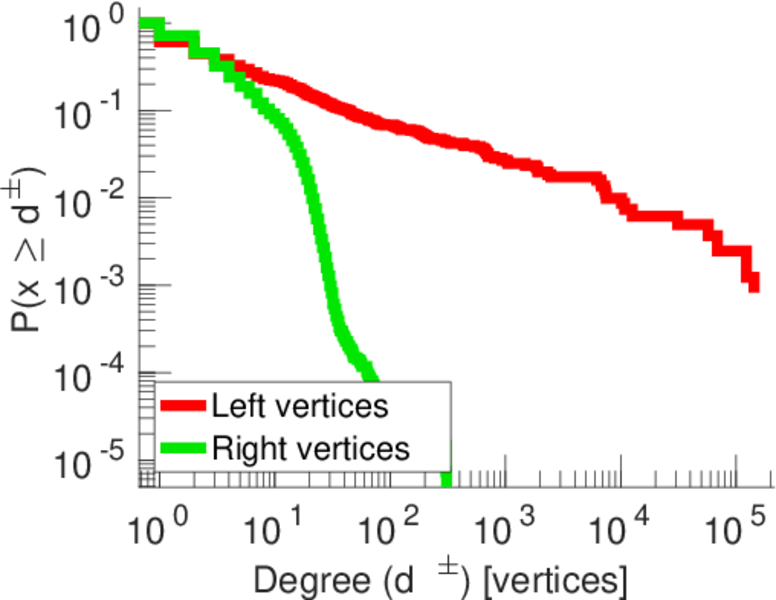
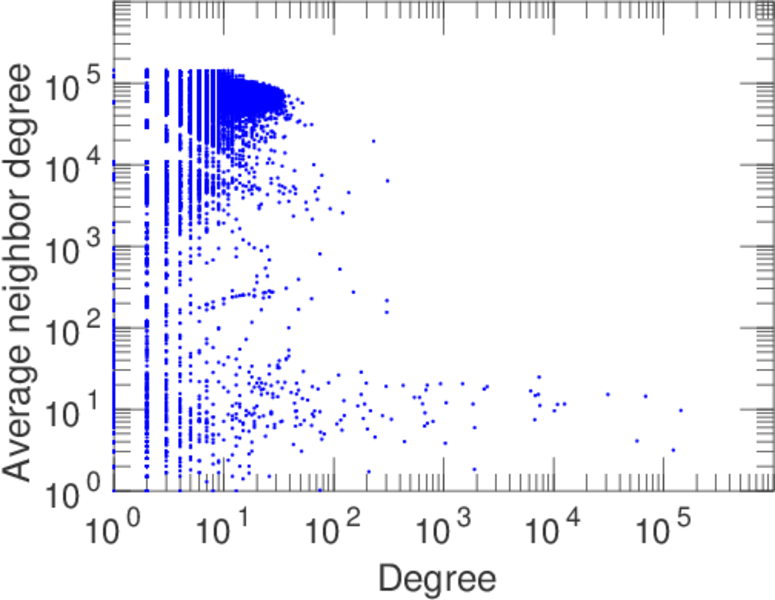
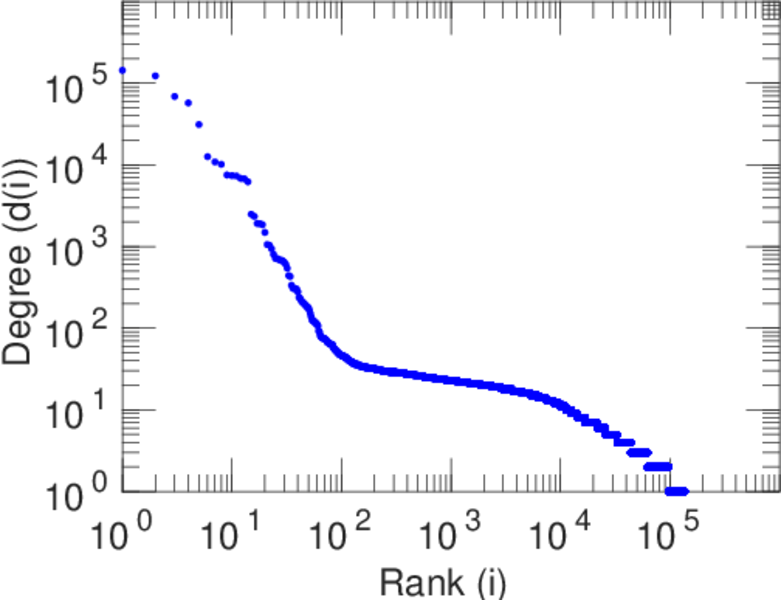
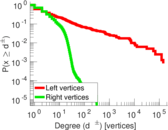
| Maximum degree | dmax = | 143,792
|
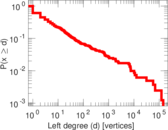
| Maximum left degree | d1max = | 143,792
|
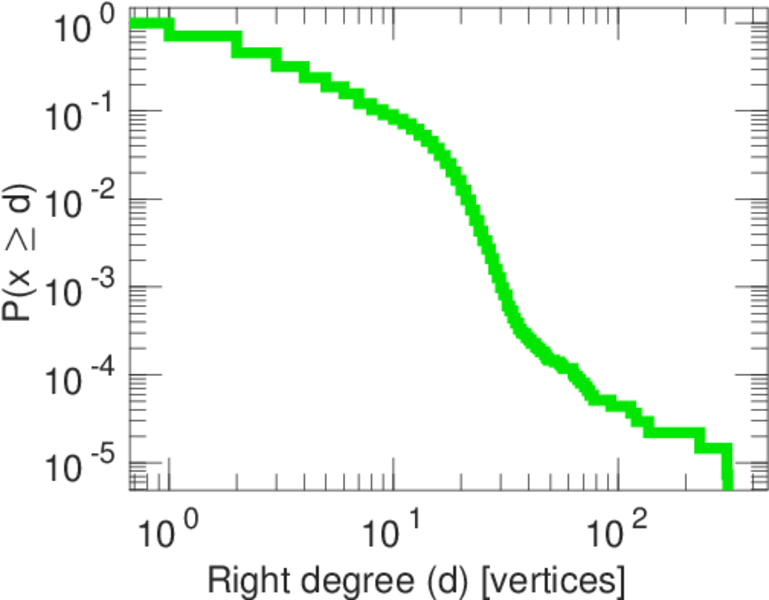
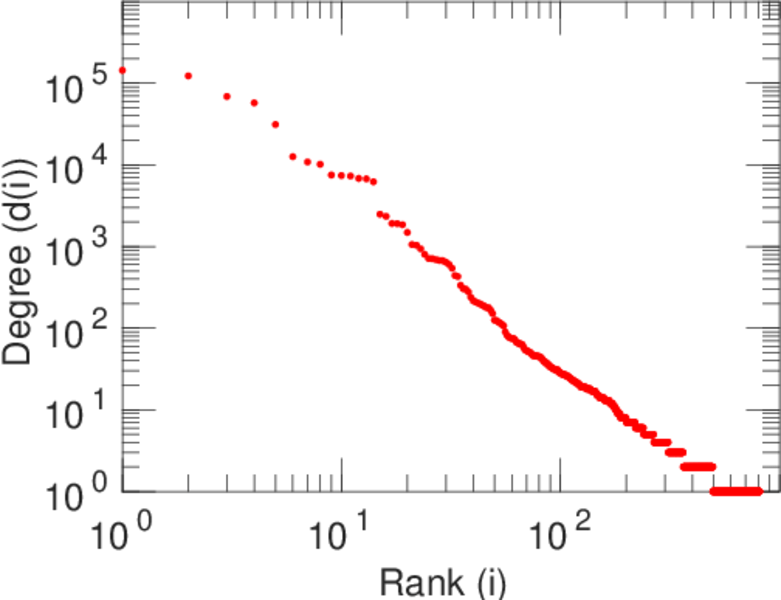
| Maximum right degree | d2max = | 309
|
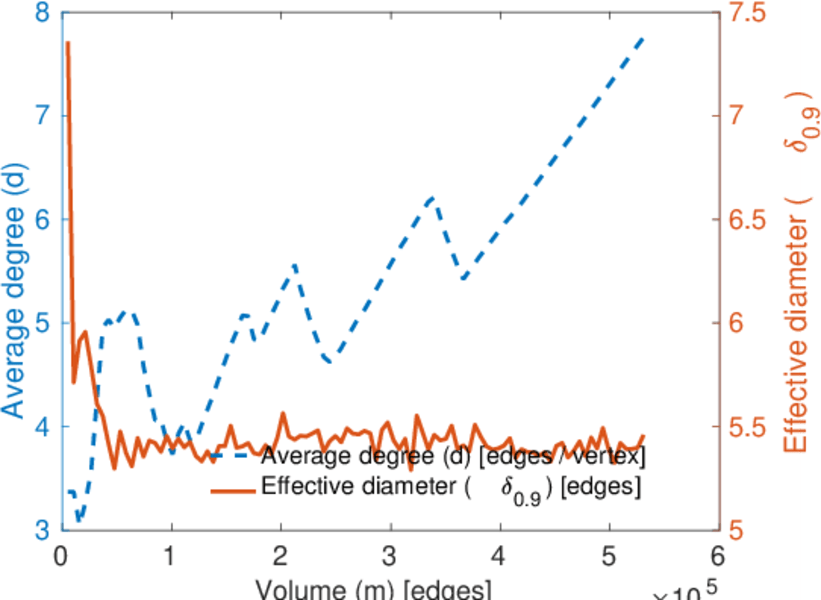
| Average degree | d = | 7.747 00
|
| Average left degree | d1 = | 654.392
|
| Average right degree | d2 = | 3.896 56
|
| Fill | p = | 0.002 937 00
|
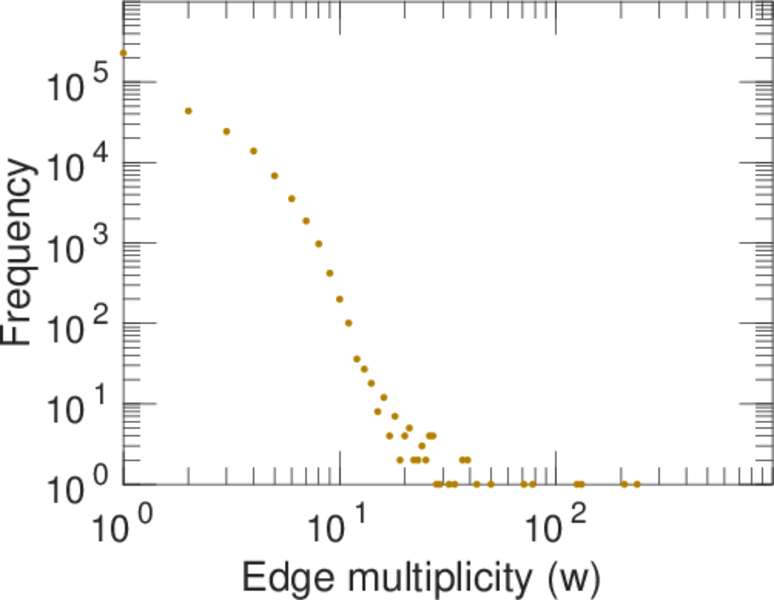
| Average edge multiplicity | m̃ = | 1.635 90
|
| Size of LCC | N = | 136,548
|
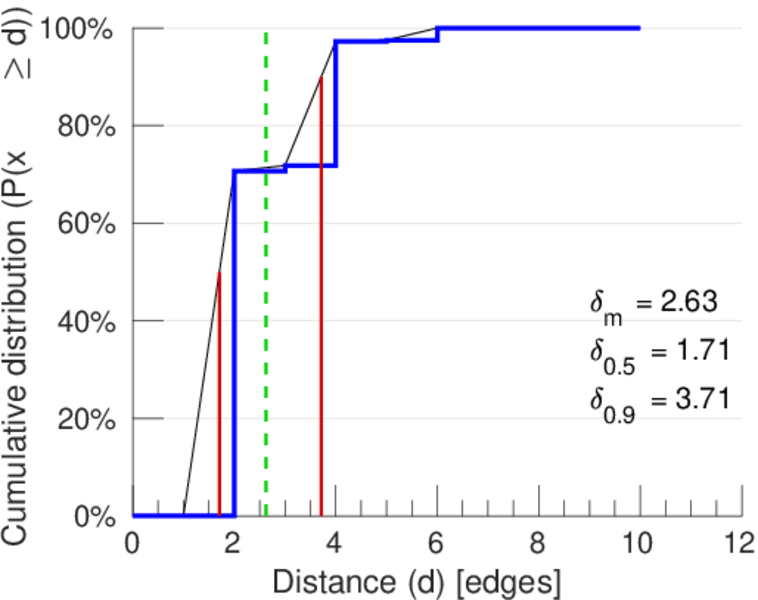
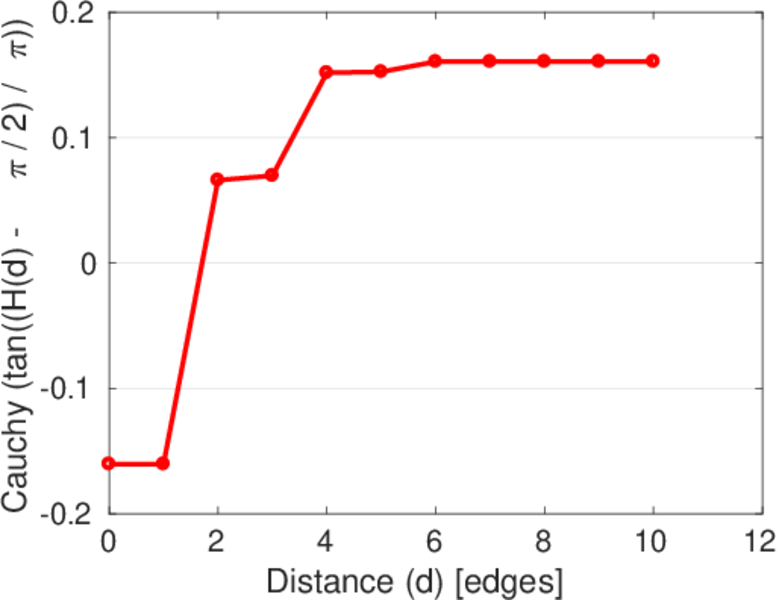
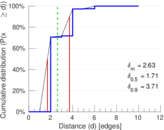
| Diameter | δ = | 11
|
| 50-Percentile effective diameter | δ0.5 = | 1.707 41
|
| 90-Percentile effective diameter | δ0.9 = | 3.714 40
|
| Median distance | δM = | 2
|
| Mean distance | δm = | 2.627 65
|
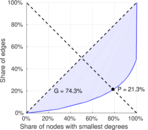
| Gini coefficient | G = | 0.743 087
|
| Balanced inequality ratio | P = | 0.212 898
|
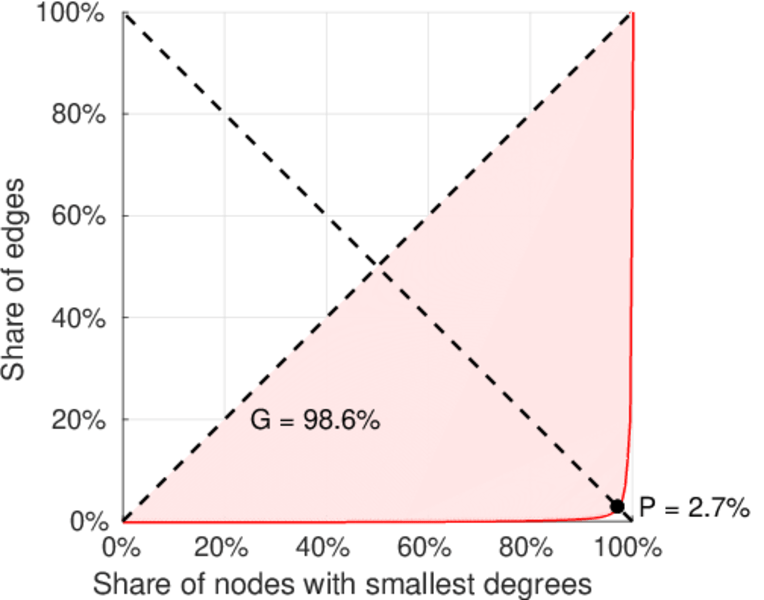
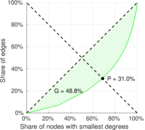
| Left balanced inequality ratio | P1 = | 0.027 338 7
|
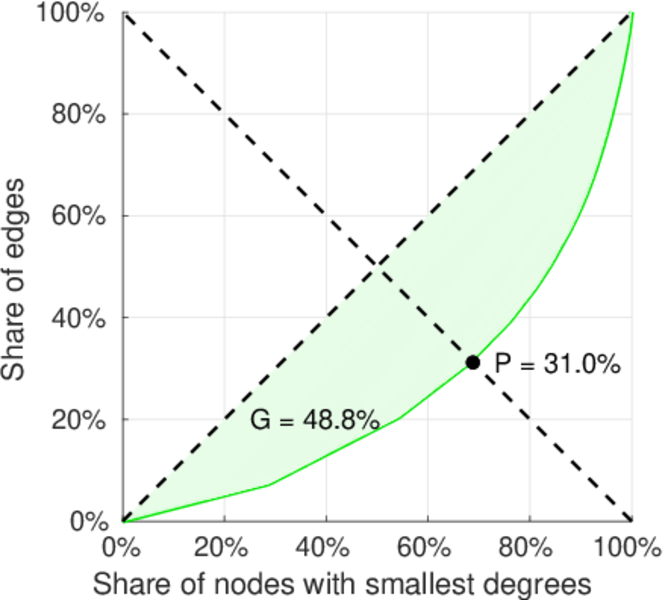
| Right balanced inequality ratio | P2 = | 0.310 259
|
| Relative edge distribution entropy | Her = | 0.654 324
|
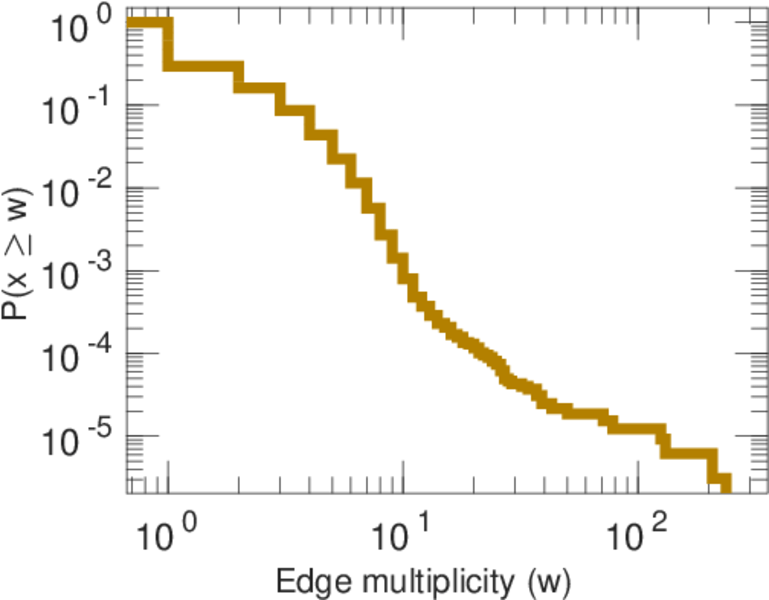
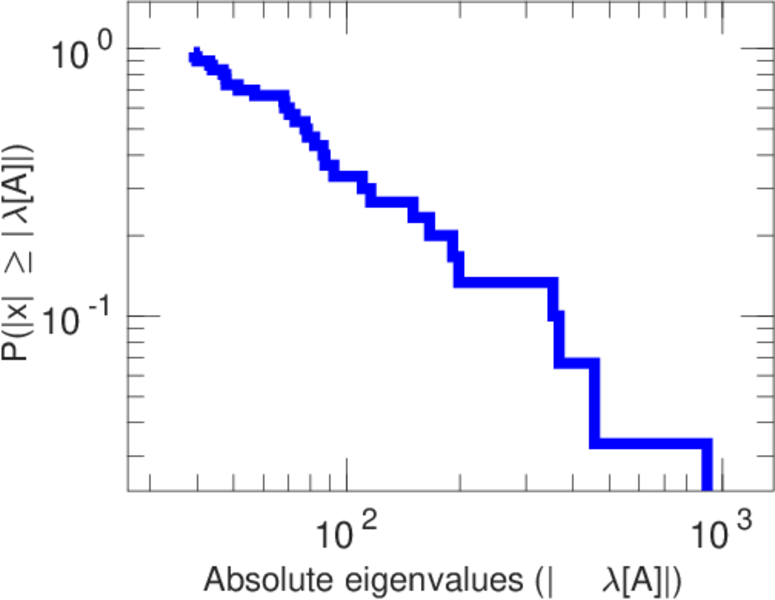
| Power law exponent | γ = | 2.479 37
|
| Tail power law exponent | γt = | 2.921 00
|
| Tail power law exponent with p | γ3 = | 2.921 00
|
| p-value | p = | 0.000 00
|
| Left tail power law exponent with p | γ3,1 = | 1.501 00
|
| Left p-value | p1 = | 0.094 000 0
|
| Right tail power law exponent with p | γ3,2 = | 8.761 00
|
| Right p-value | p2 = | 0.000 00
|
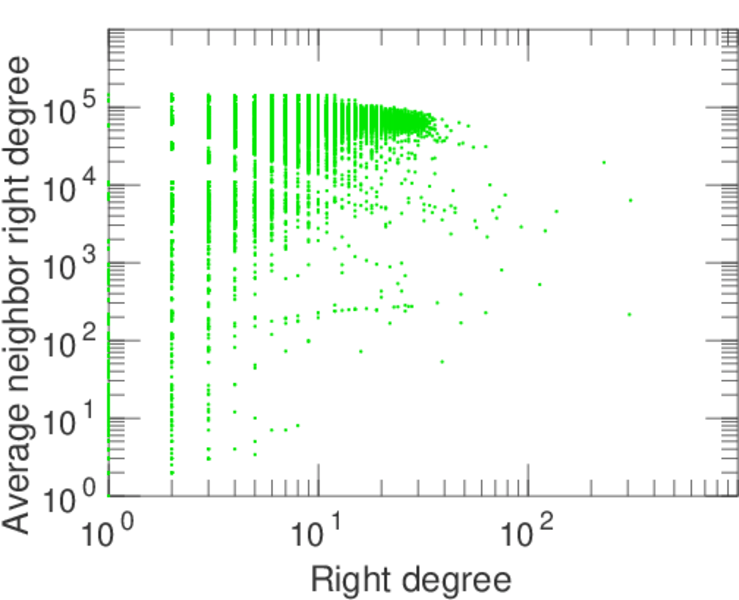
| Degree assortativity | ρ = | −0.552 887
|
| Degree assortativity p-value | pρ = | 0.000 00
|
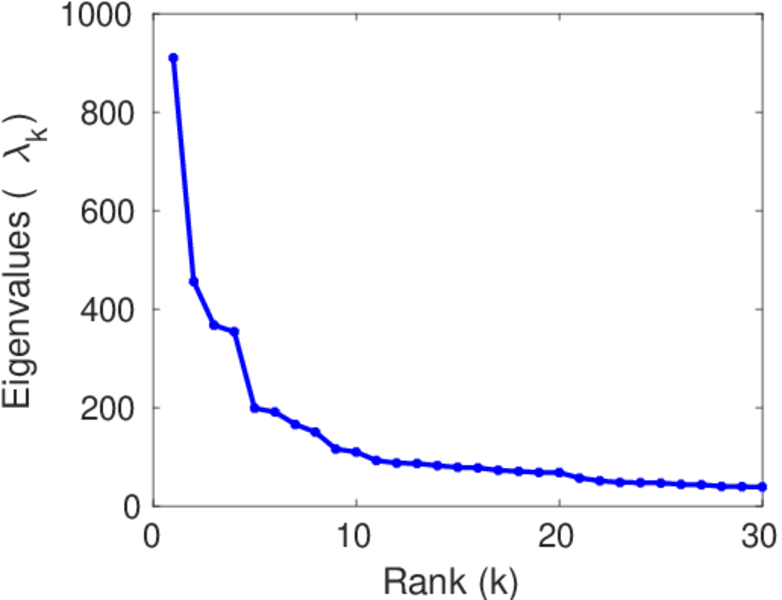
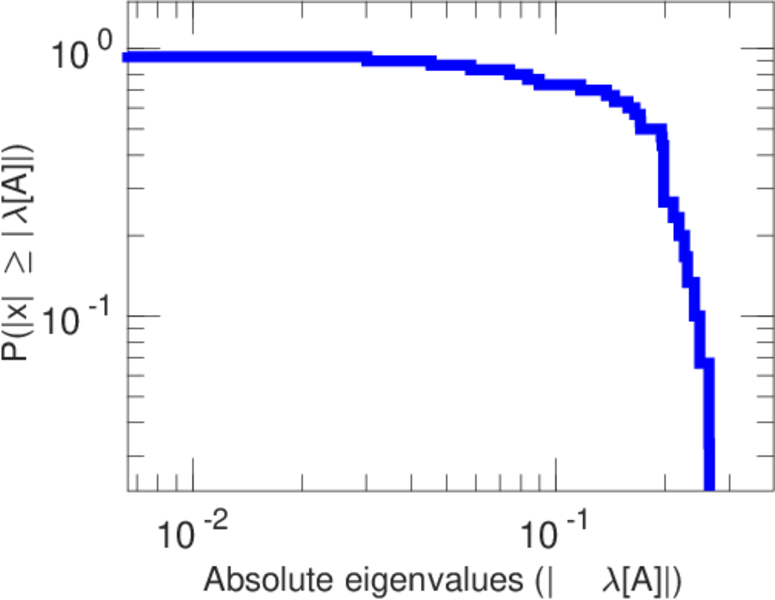
| Spectral norm | α = | 910.140
|
| Algebraic connectivity | a = | 0.006 601 94
|
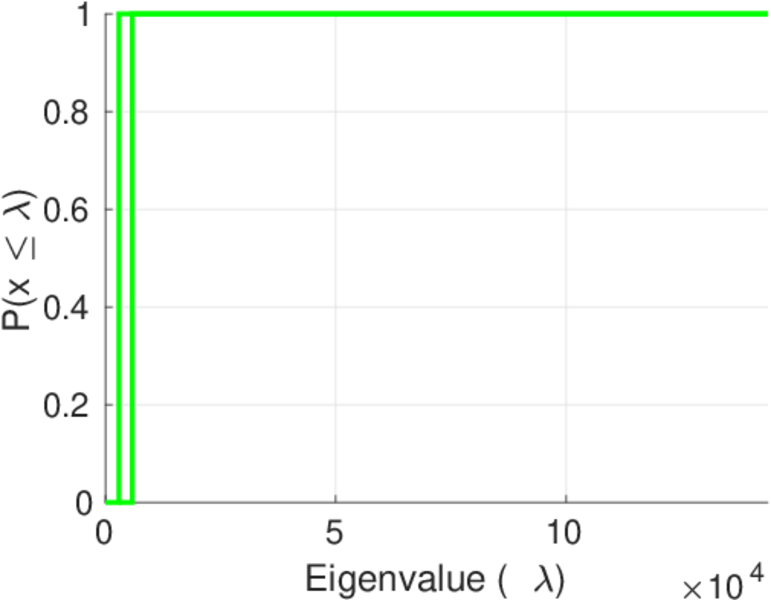
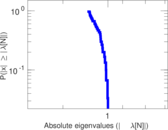
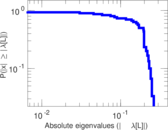
| Spectral separation | |λ1[A] / λ2[A]| = | 1.995 51
|
| Controllability | C = | 135,285
|
| Relative controllability | Cr = | 0.988 586
|
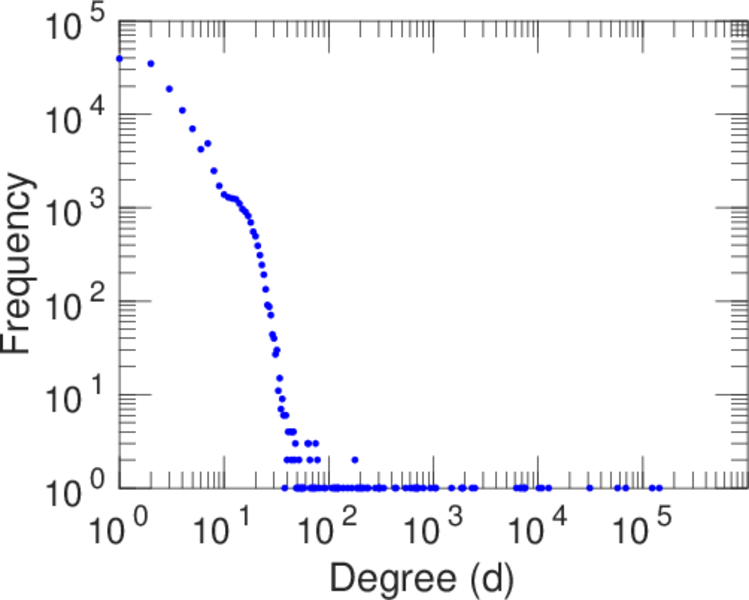
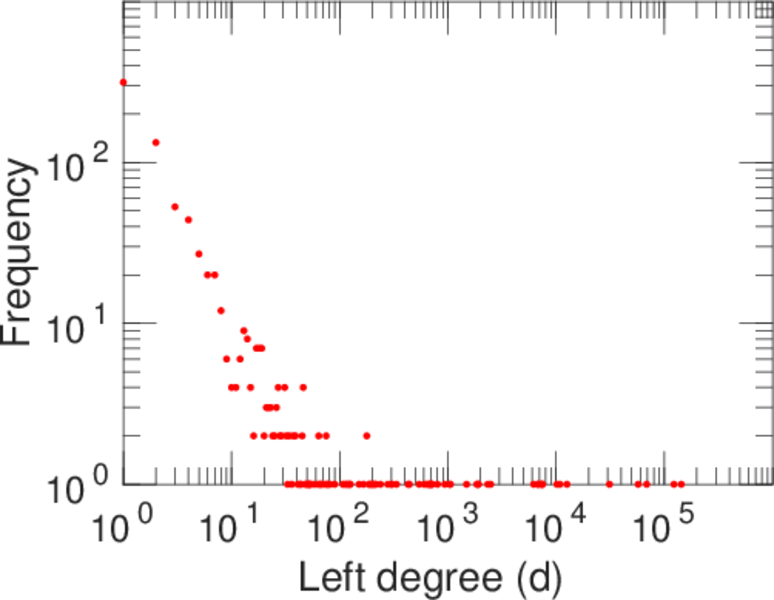
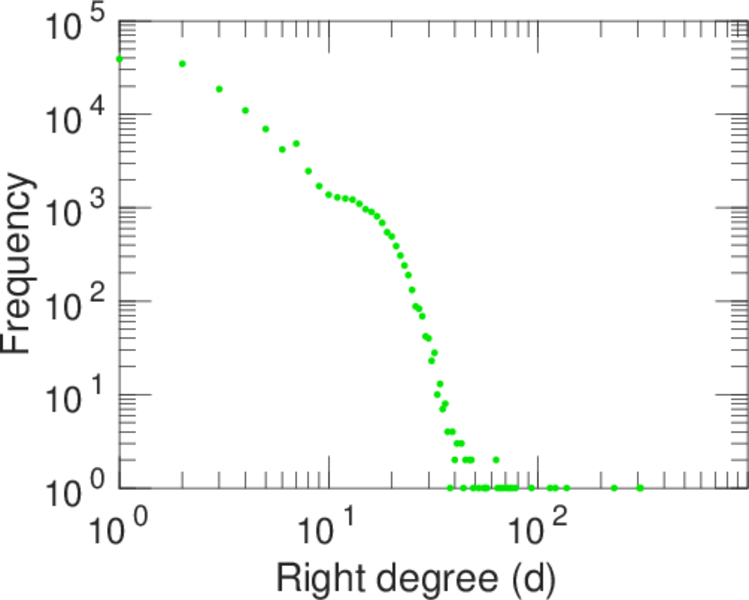
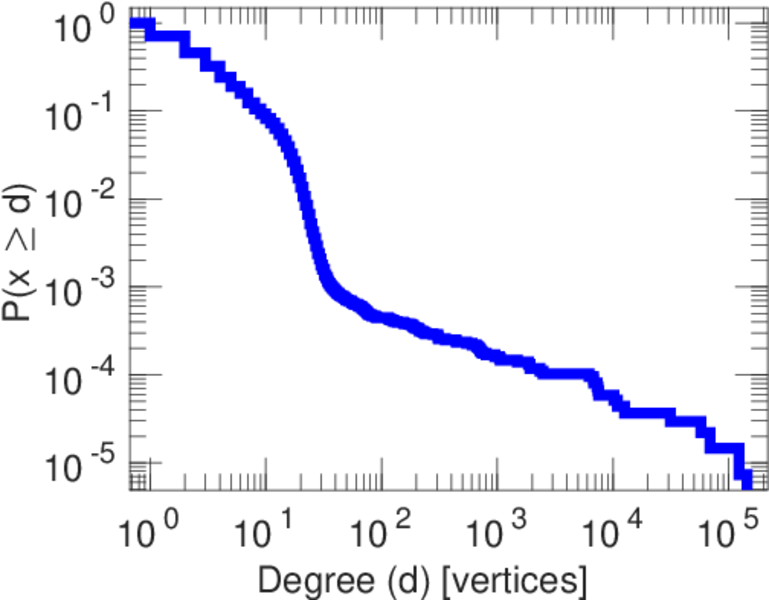
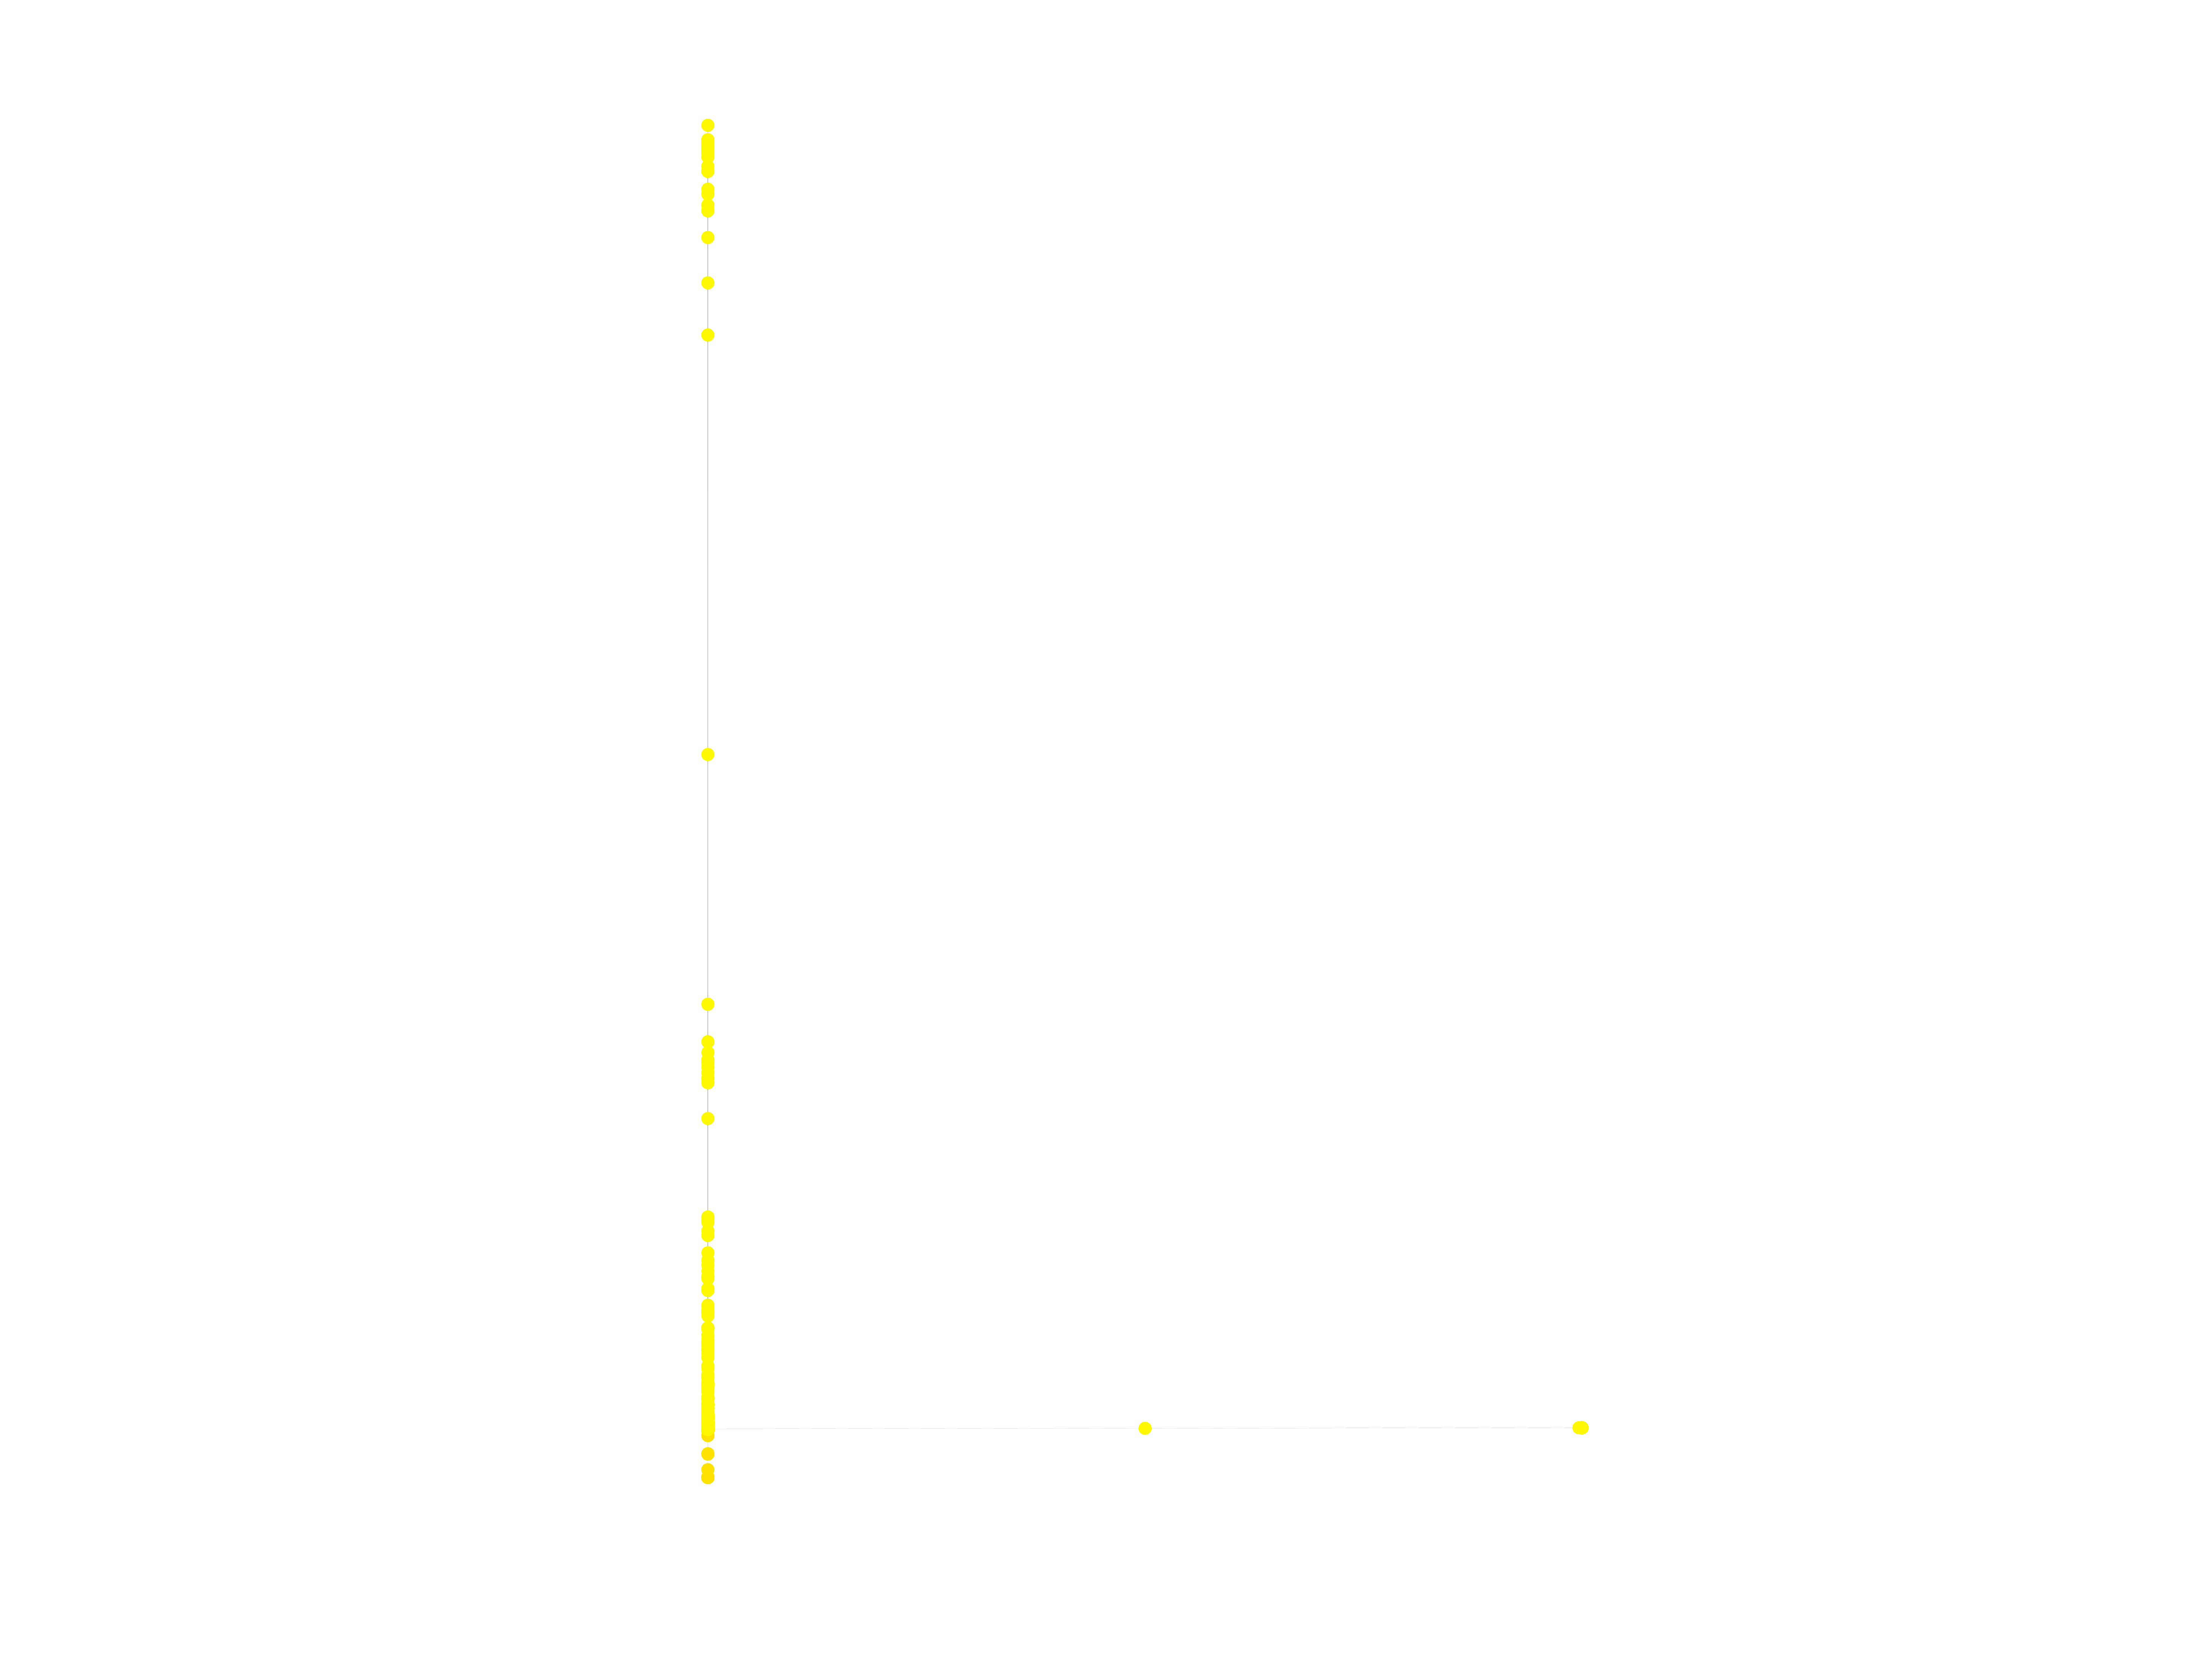
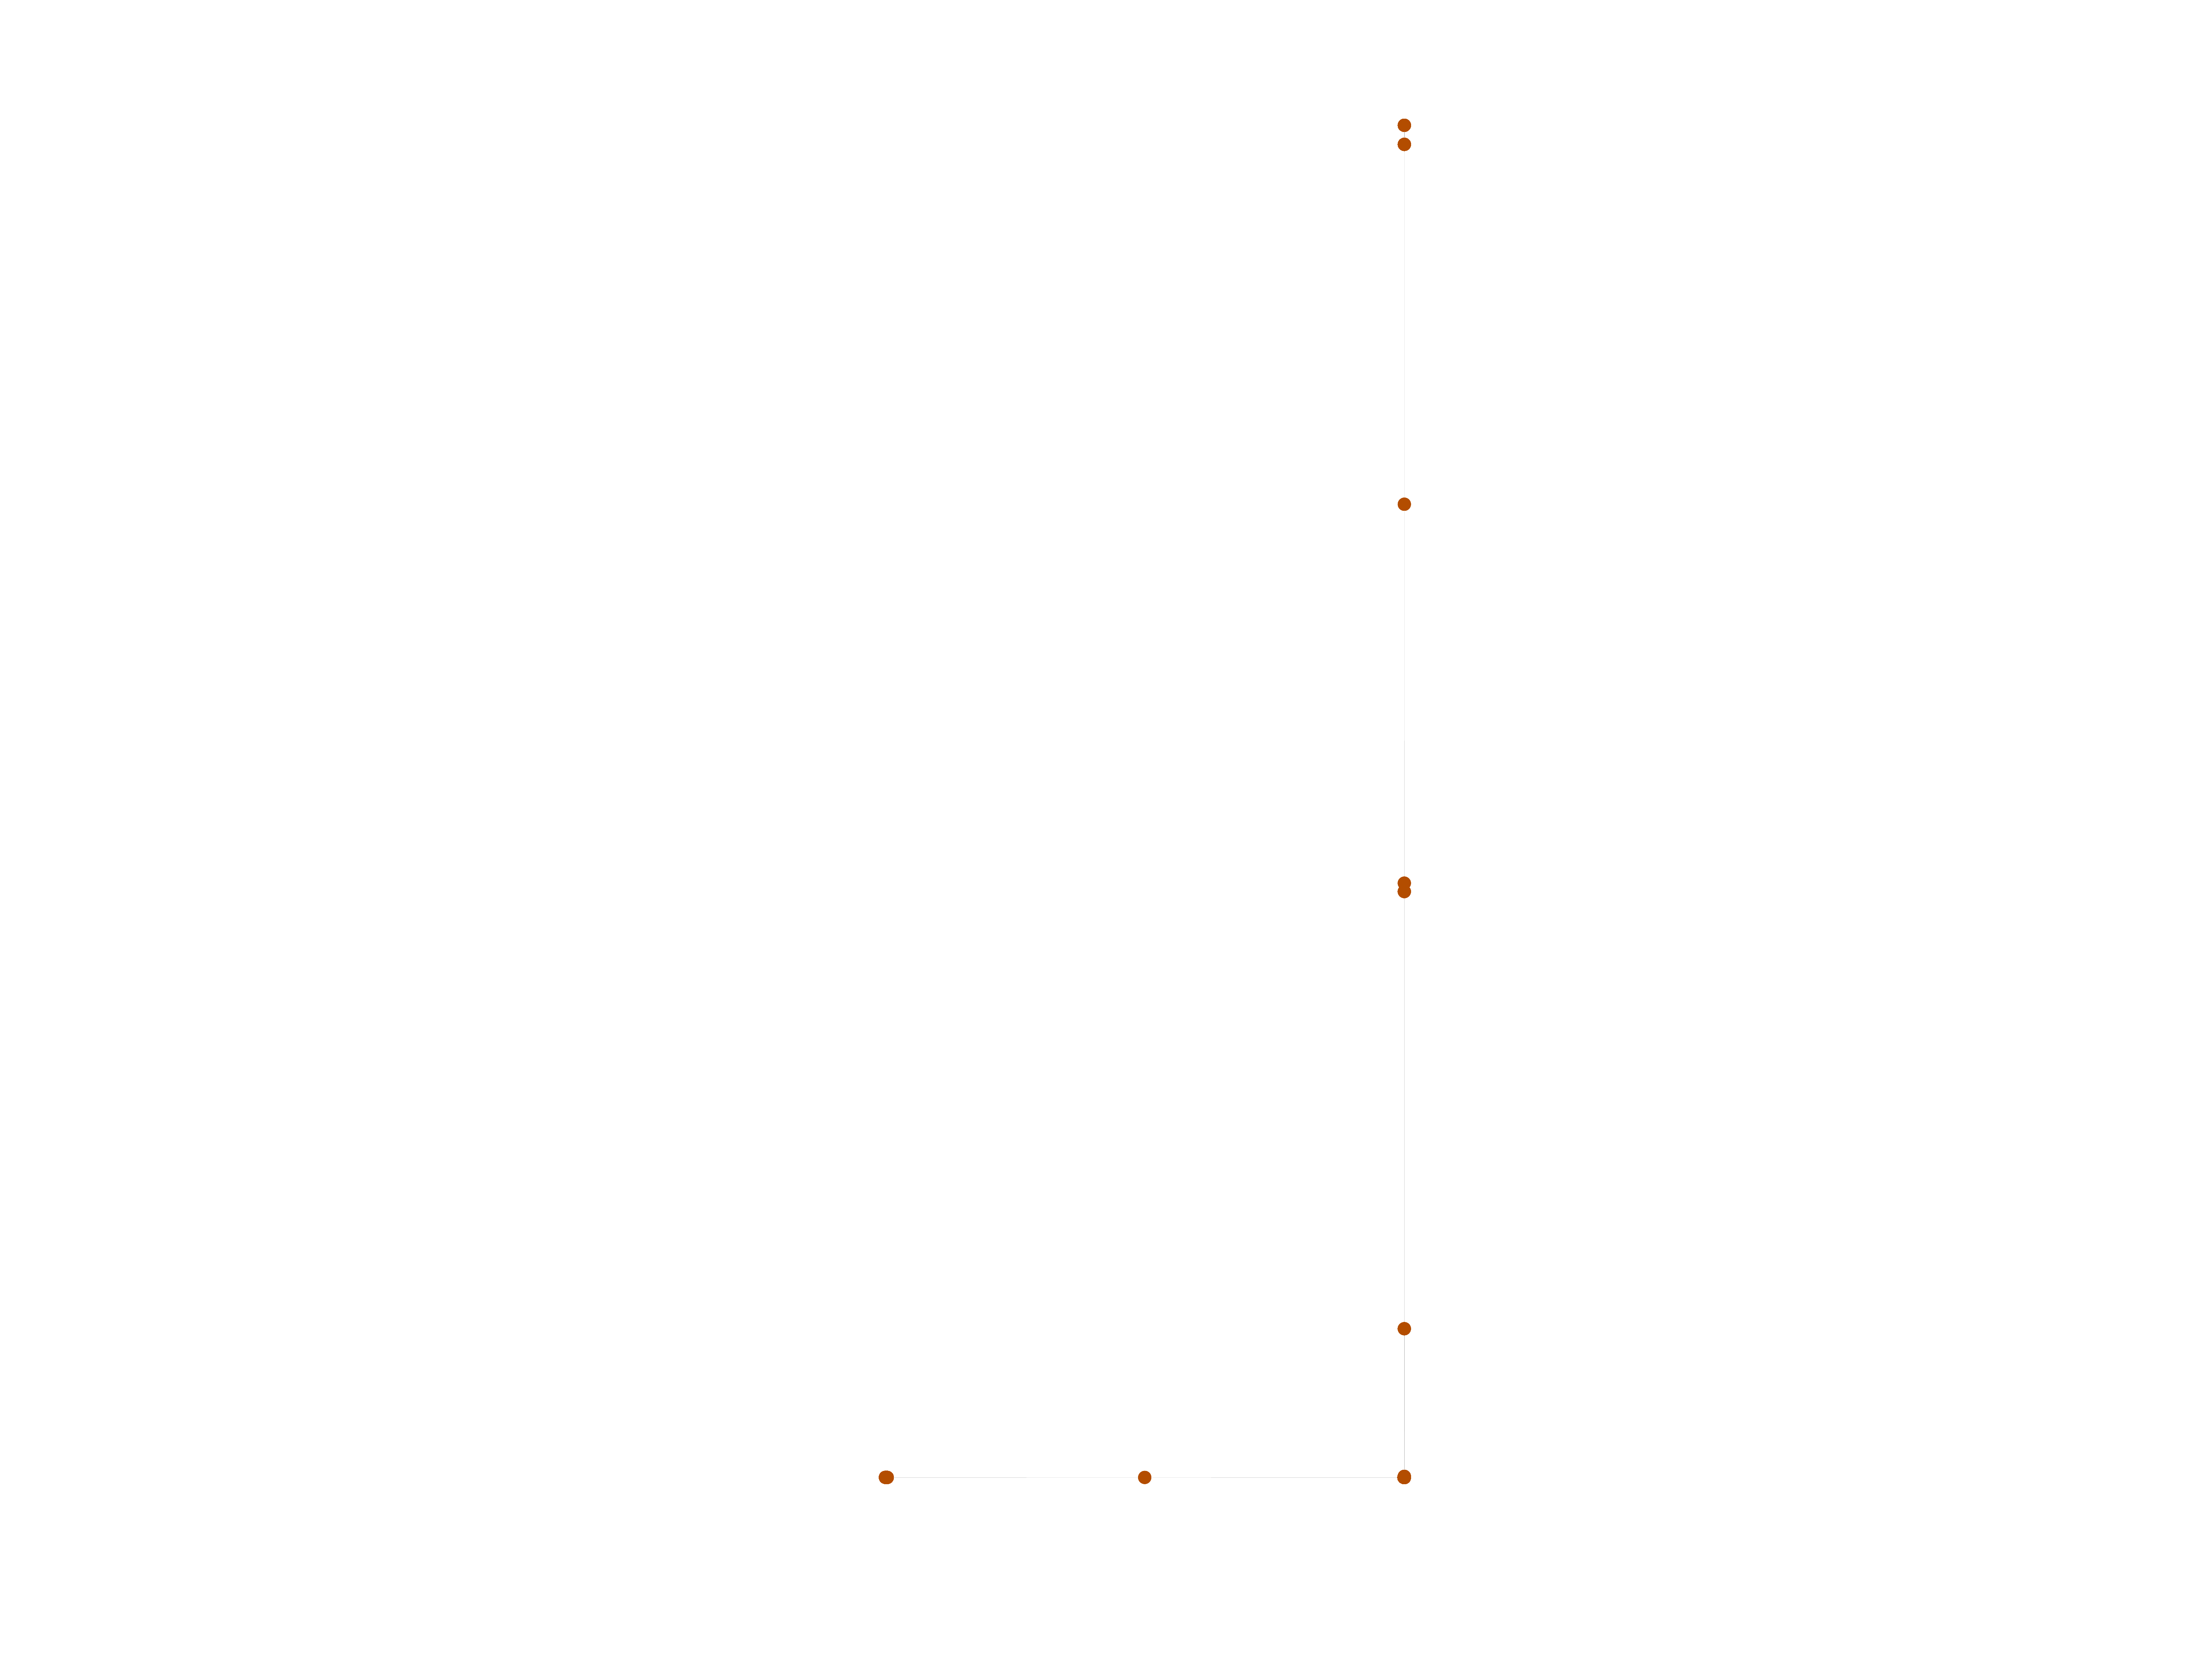
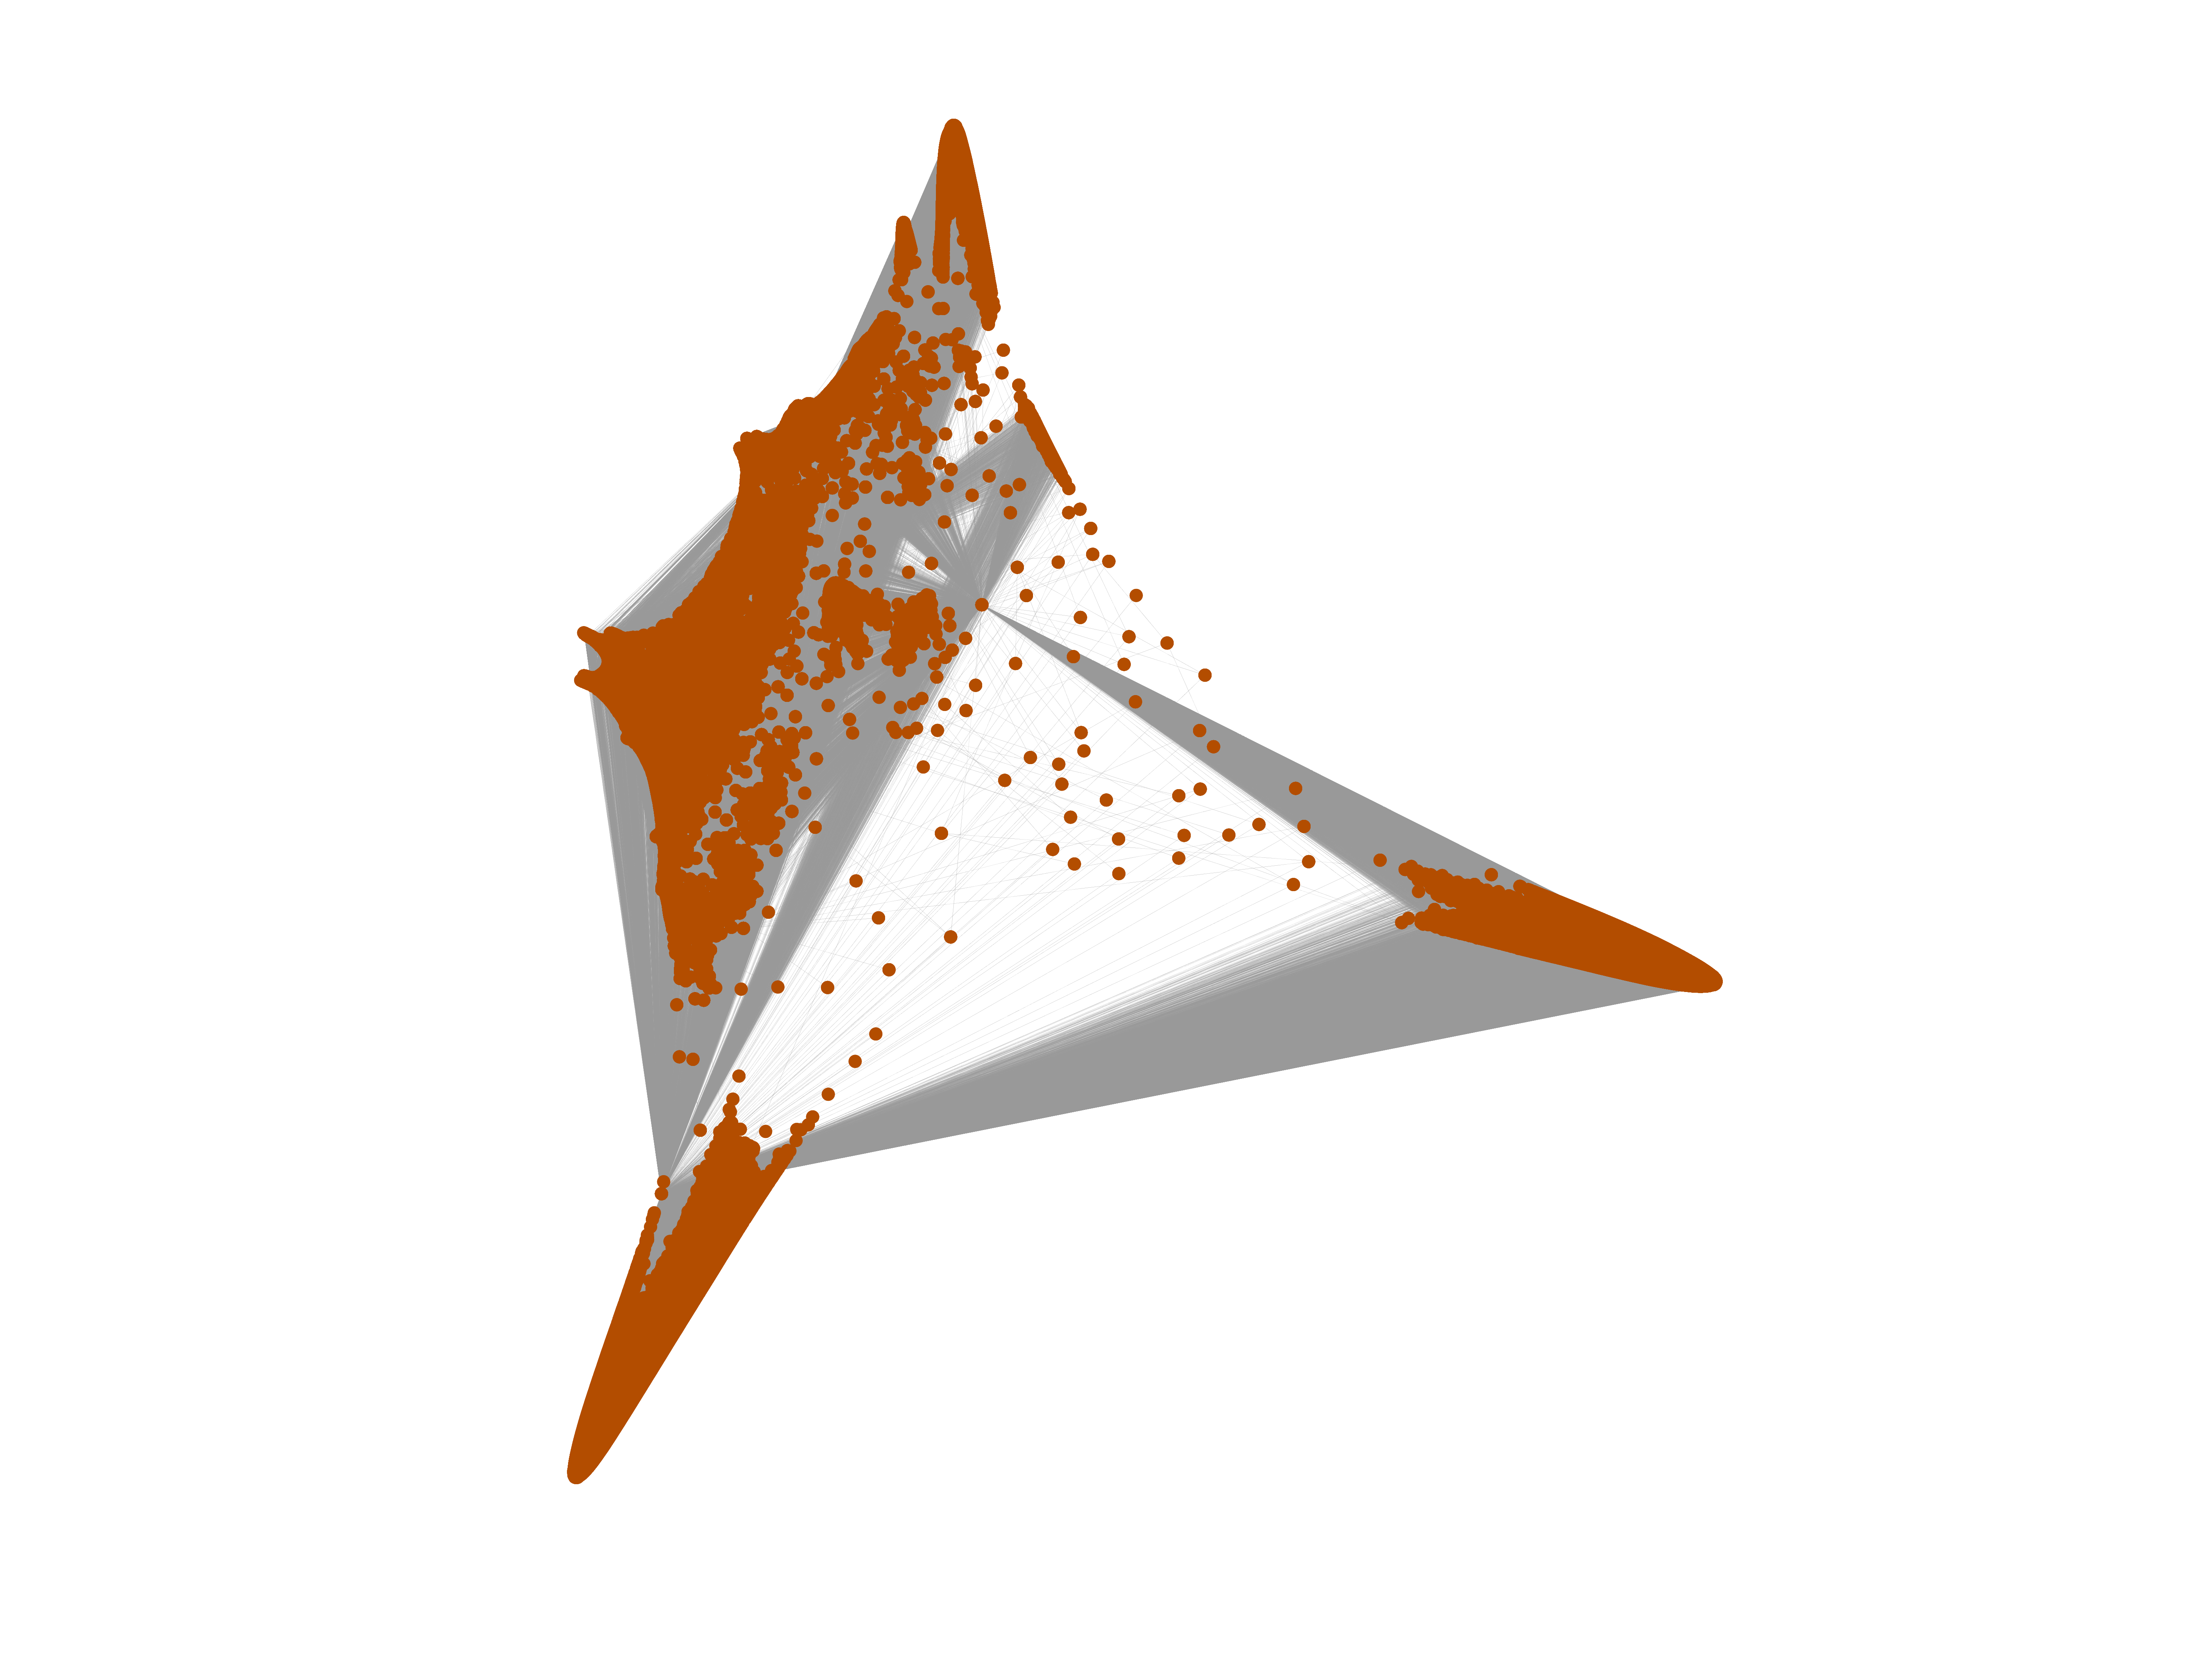
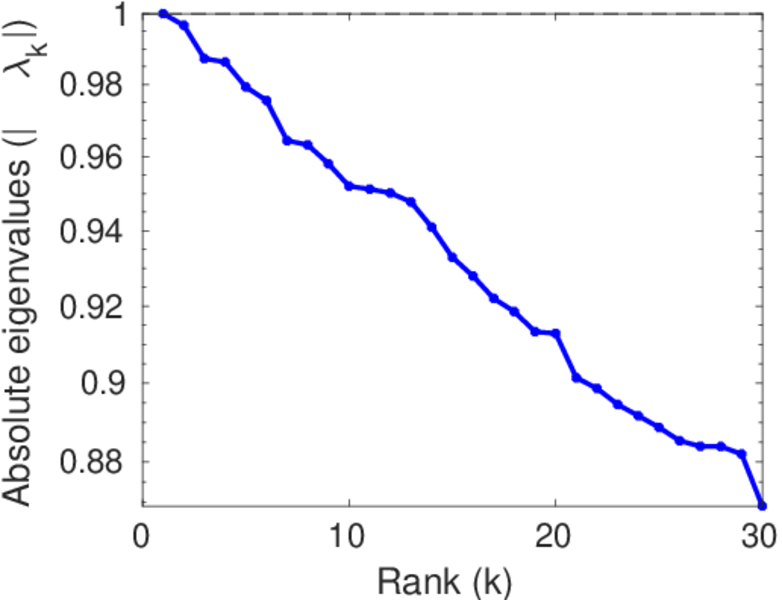
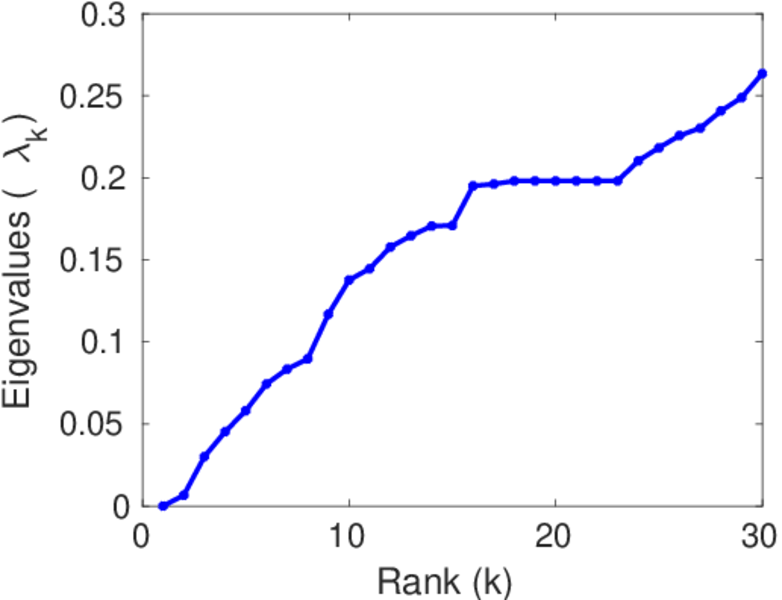
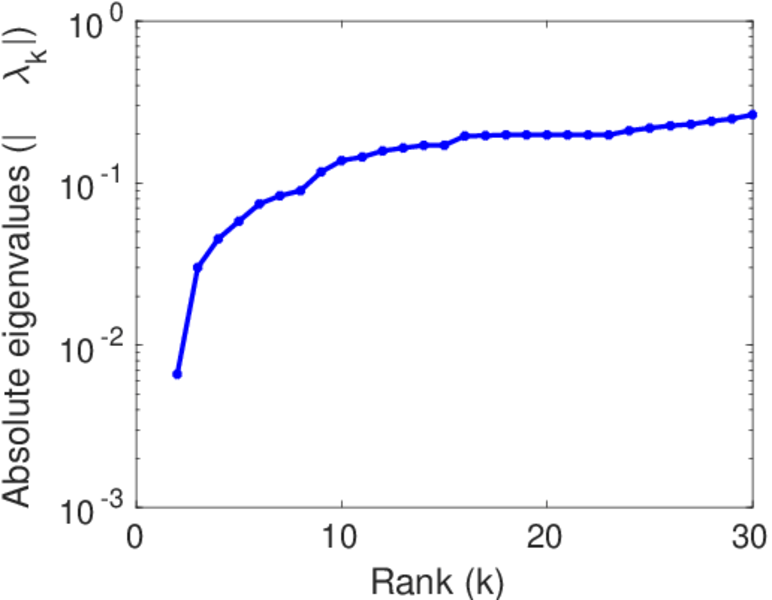
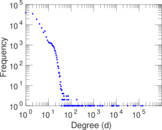
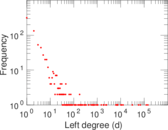
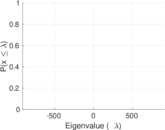
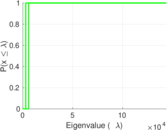
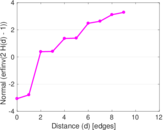
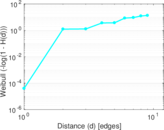
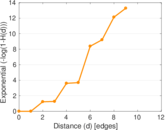
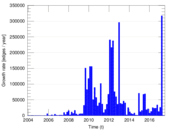
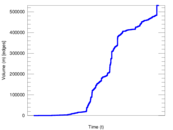
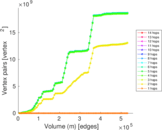
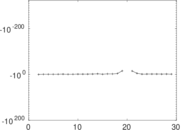
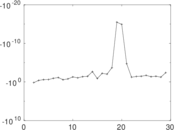
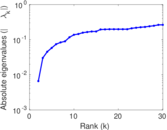
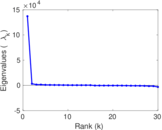
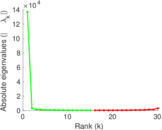
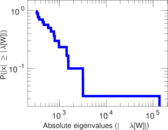
Plots


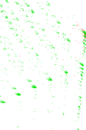
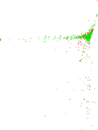


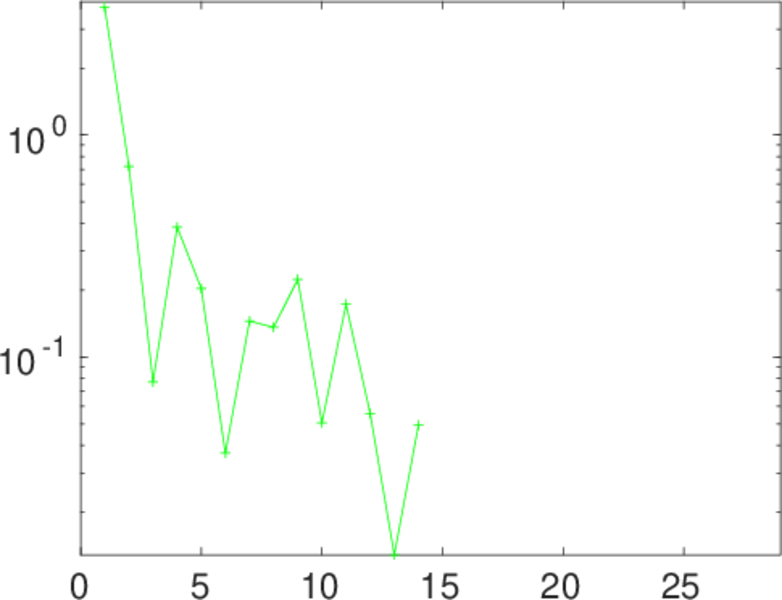
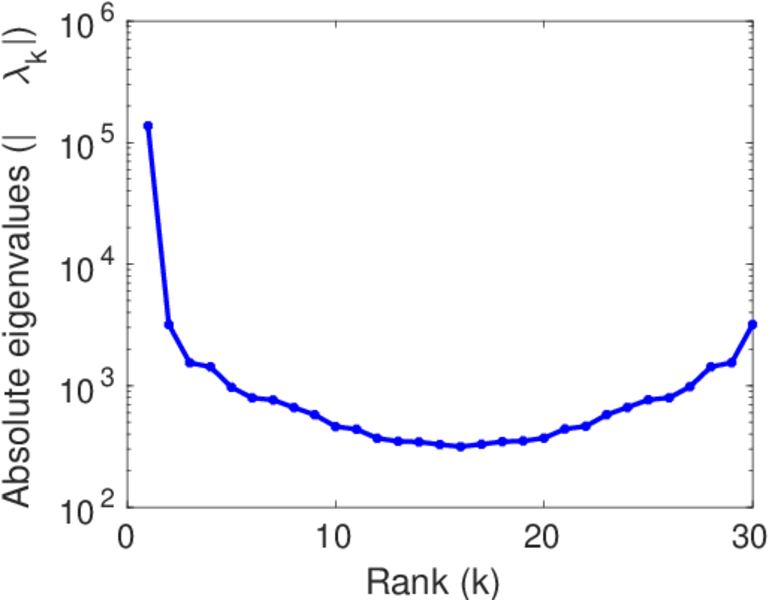
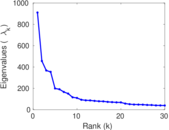
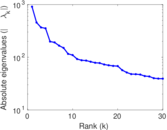
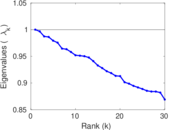
Matrix decompositions plots


Downloads
References
|
[1]
|
Jérôme Kunegis.
KONECT – The Koblenz Network Collection.
In Proc. Int. Conf. on World Wide Web Companion, pages
1343–1350, 2013.
[ http ]
|
|
[2]
|
Wikimedia Foundation.
Wikimedia downloads.
http://dumps.wikimedia.org/, January 2010.
|
 KONECT ‣ Networks ‣
Buy Me a Coffee
KONECT ‣ Networks ‣
Buy Me a Coffee