Wikipedia edits (mn)
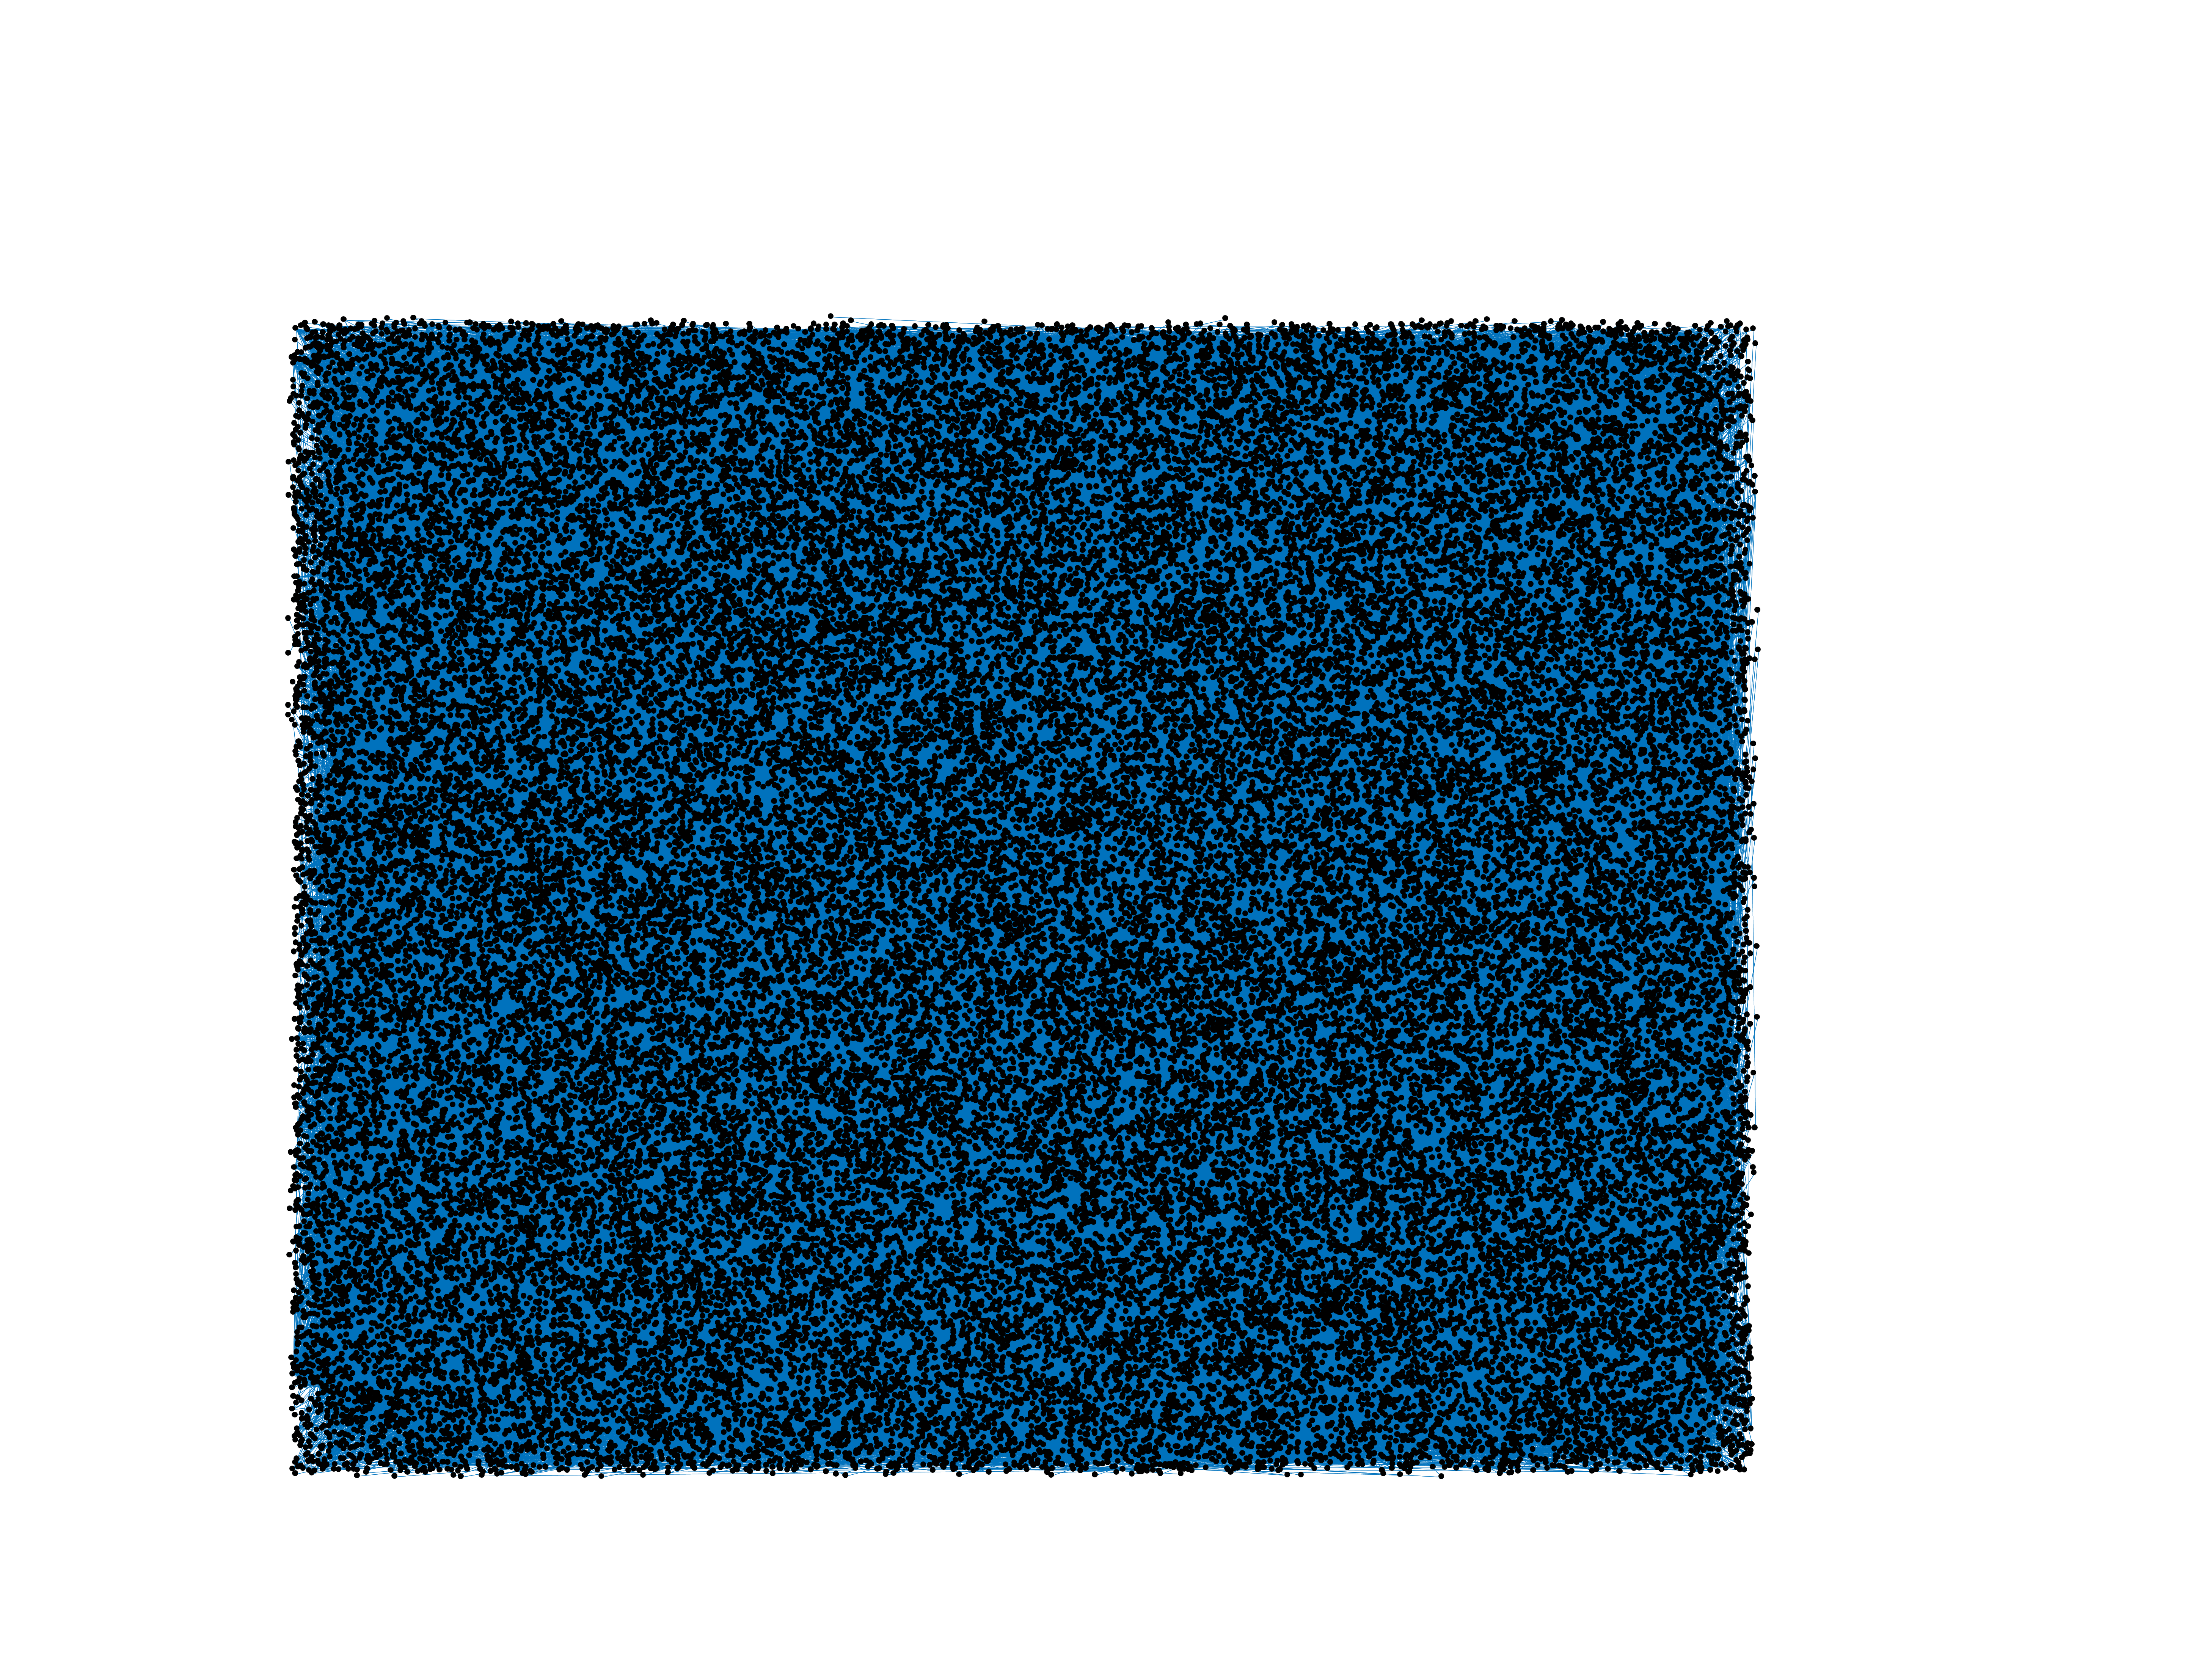
This is the bipartite edit network of the Mongolian Wikipedia. It contains
users and pages from the Mongolian Wikipedia, connected by edit events. Each
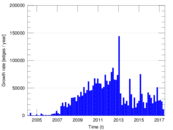
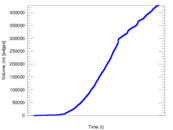
edge represents an edit. The dataset includes the timestamp of each edit.
Metadata
Statistics
| Size | n = | 60,257
|
| Left size | n1 = | 5,619
|
| Right size | n2 = | 54,638
|
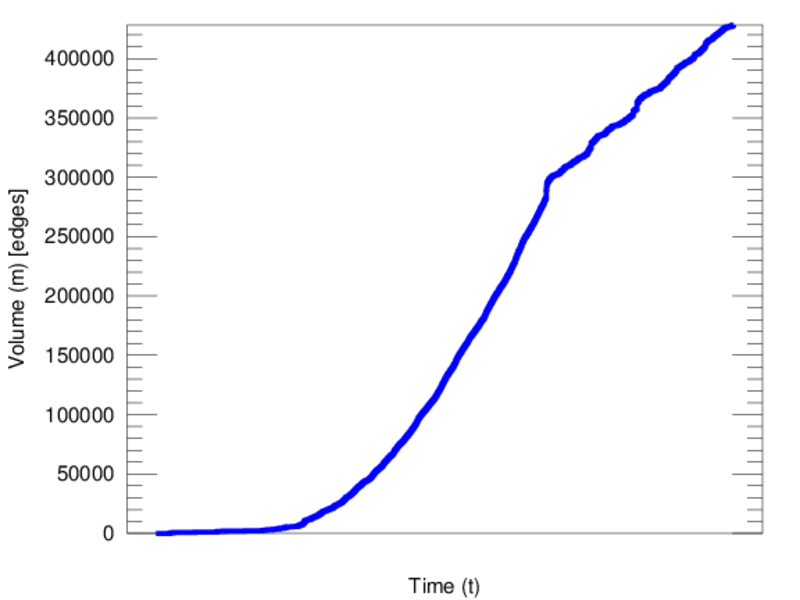
| Volume | m = | 428,262
|
| Unique edge count | m̿ = | 205,550
|
| Wedge count | s = | 529,389,925
|
| Claw count | z = | 1,733,308,898,584
|
| Cross count | x = | 5,116,165,813,977,355
|
| Square count | q = | 663,021,833
|
| 4-Tour count | T4 = | 7,422,157,760
|
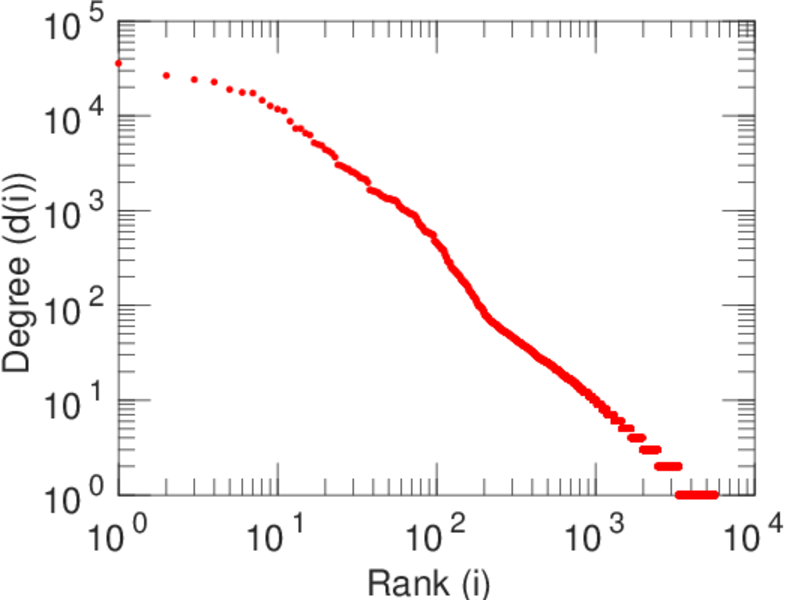
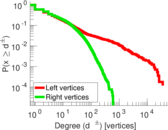
| Maximum degree | dmax = | 35,722
|
| Maximum left degree | d1max = | 35,722
|
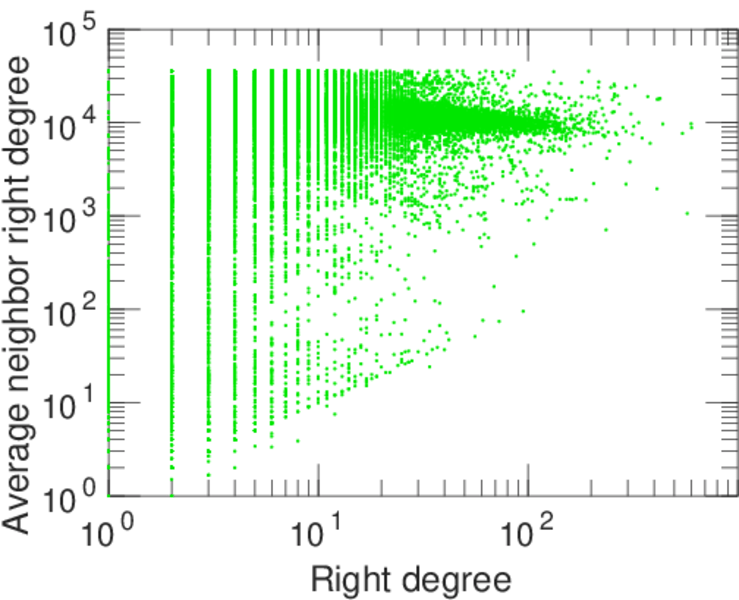
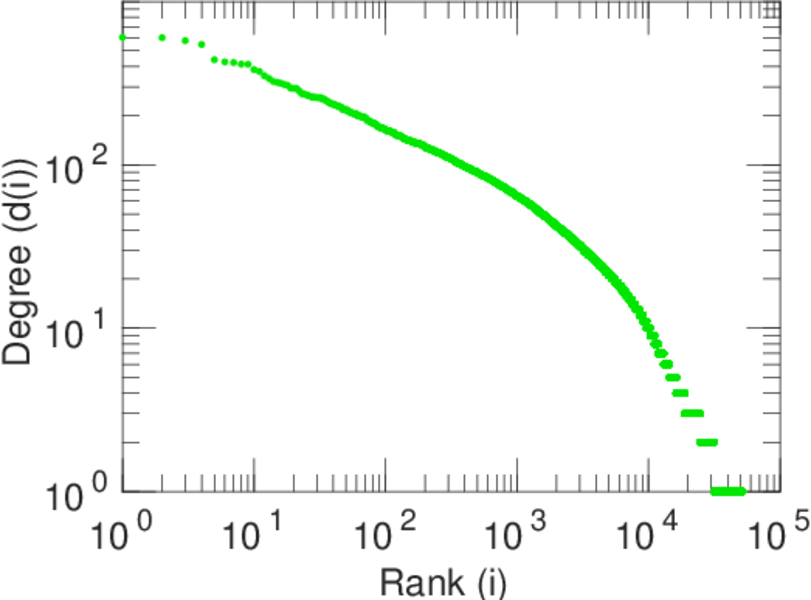
| Maximum right degree | d2max = | 604
|
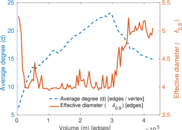
| Average degree | d = | 14.214 5
|
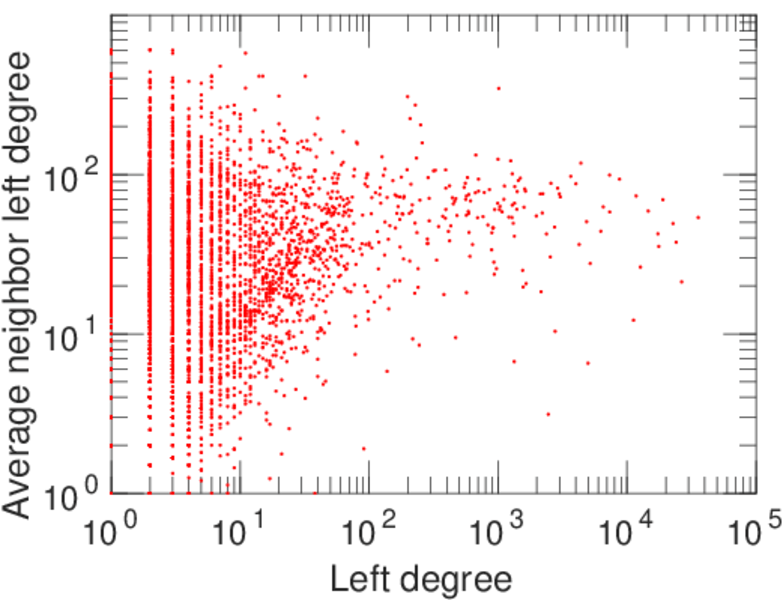
| Average left degree | d1 = | 76.216 8
|
| Average right degree | d2 = | 7.838 17
|
| Fill | p = | 0.000 669 520
|
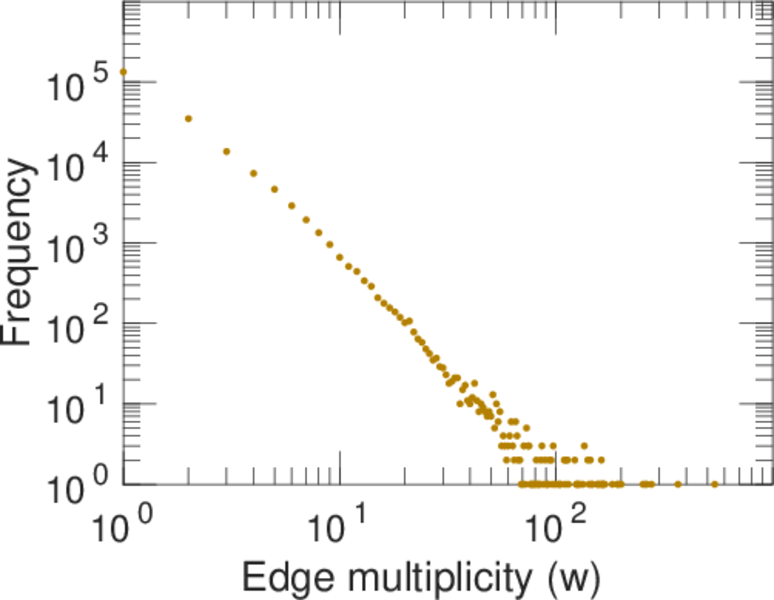
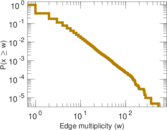
| Average edge multiplicity | m̃ = | 2.083 49
|
| Size of LCC | N = | 55,361
|
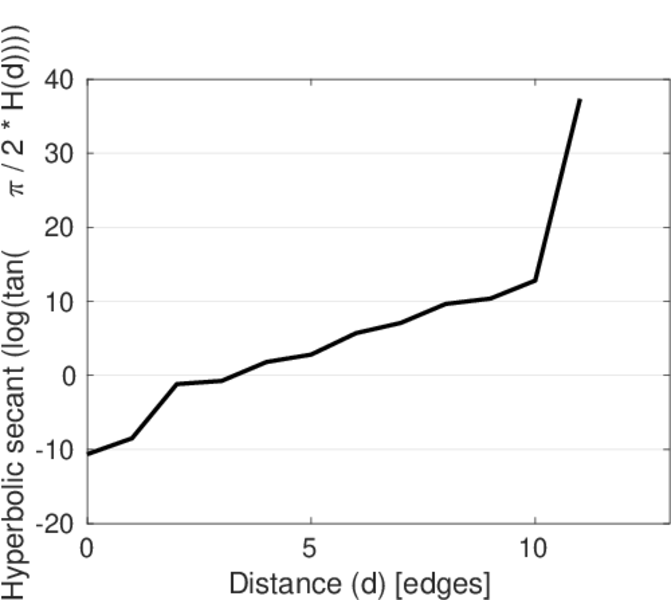
| Diameter | δ = | 14
|
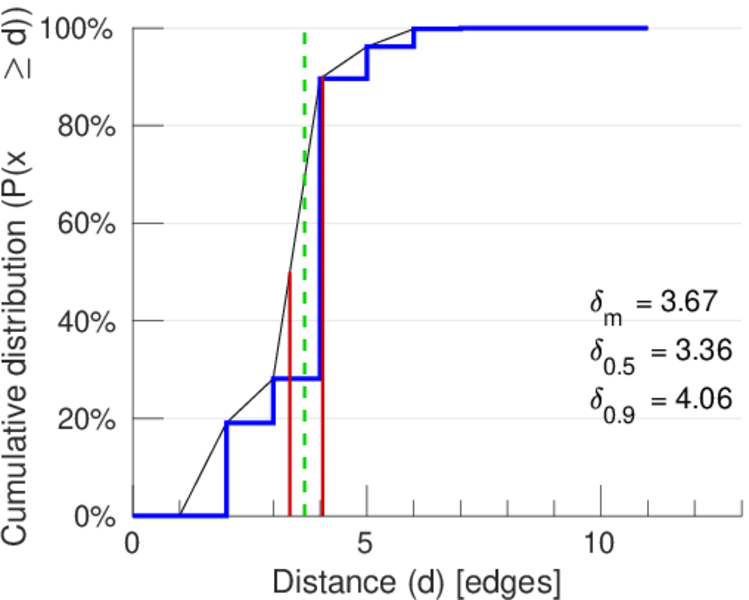
| 50-Percentile effective diameter | δ0.5 = | 3.355 93
|
| 90-Percentile effective diameter | δ0.9 = | 4.060 11
|
| Median distance | δM = | 4
|
| Mean distance | δm = | 3.673 04
|
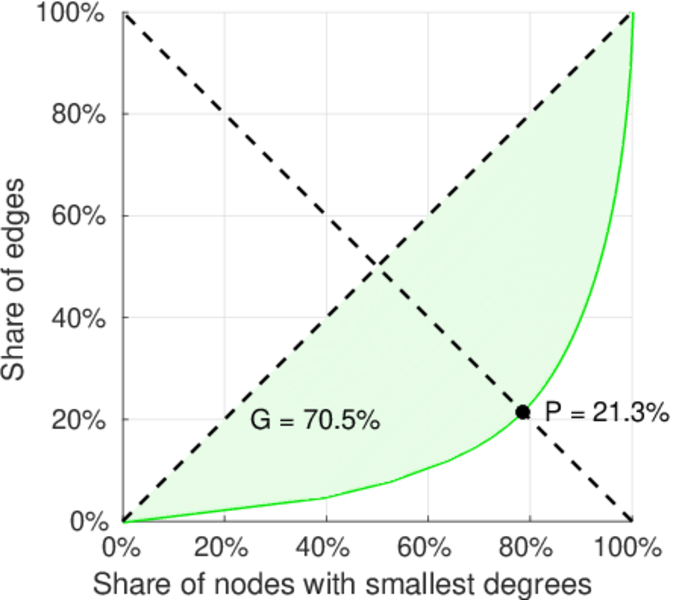
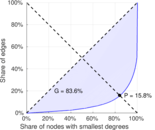
| Gini coefficient | G = | 0.838 854
|
| Balanced inequality ratio | P = | 0.158 191
|
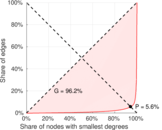
| Left balanced inequality ratio | P1 = | 0.055 844 3
|
| Right balanced inequality ratio | P2 = | 0.212 989
|
| Relative edge distribution entropy | Her = | 0.737 586
|
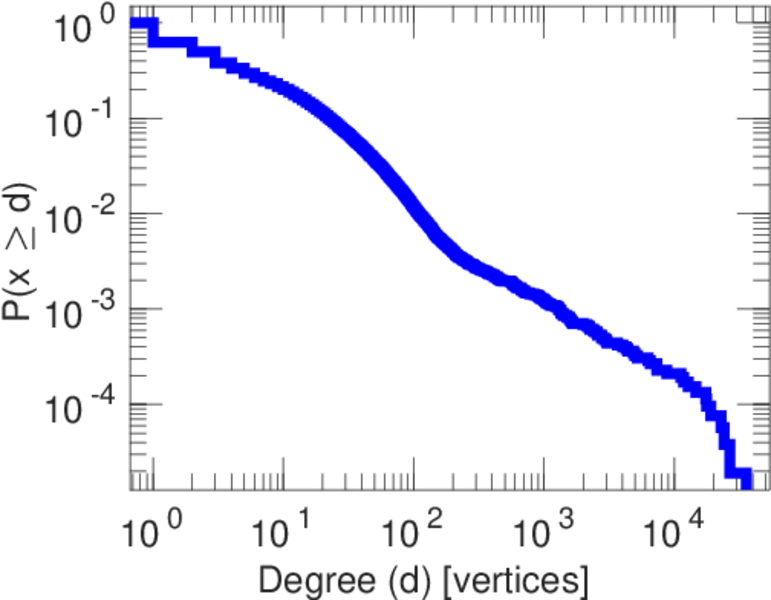
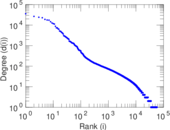
| Power law exponent | γ = | 2.384 23
|
| Tail power law exponent | γt = | 1.851 00
|
| Tail power law exponent with p | γ3 = | 1.851 00
|
| p-value | p = | 0.000 00
|
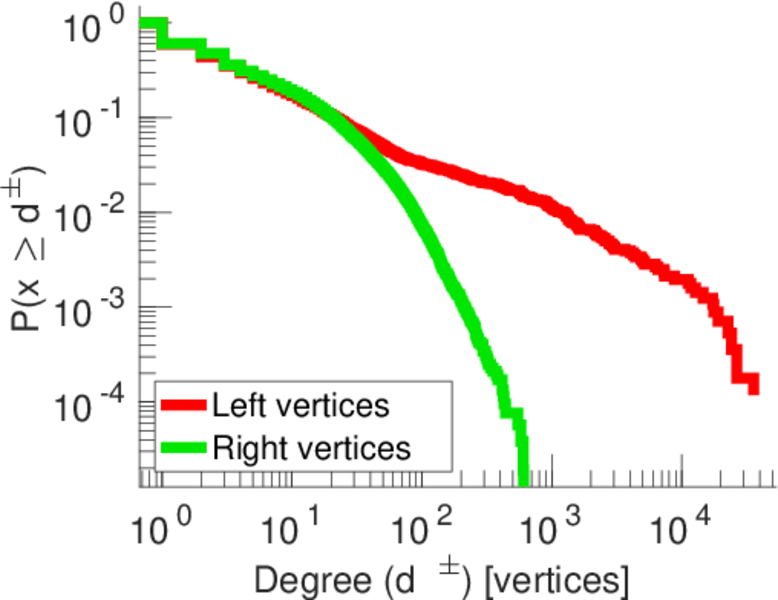
| Left tail power law exponent with p | γ3,1 = | 1.901 00
|
| Left p-value | p1 = | 0.000 00
|
| Right tail power law exponent with p | γ3,2 = | 1.851 00
|
| Right p-value | p2 = | 0.000 00
|
| Degree assortativity | ρ = | −0.297 047
|
| Degree assortativity p-value | pρ = | 0.000 00
|
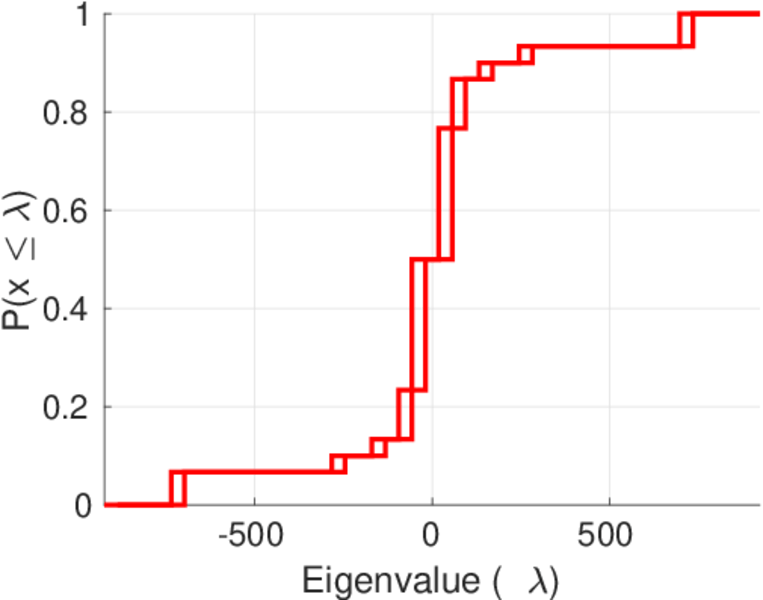
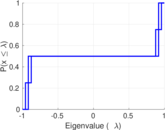
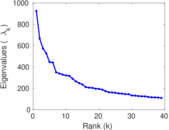
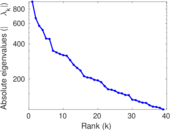
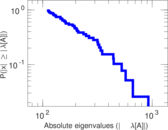
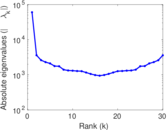
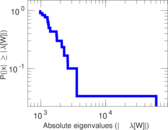
| Spectral norm | α = | 925.115
|
| Algebraic connectivity | a = | 0.032 041 9
|
| Spectral separation | |λ1[A] / λ2[A]| = | 1.387 24
|
| Controllability | C = | 47,895
|
| Relative controllability | Cr = | 0.827 359
|
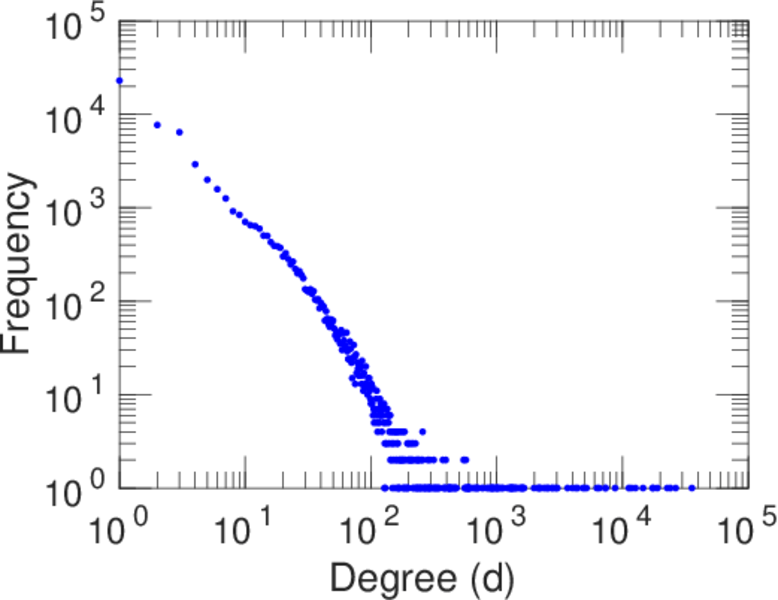
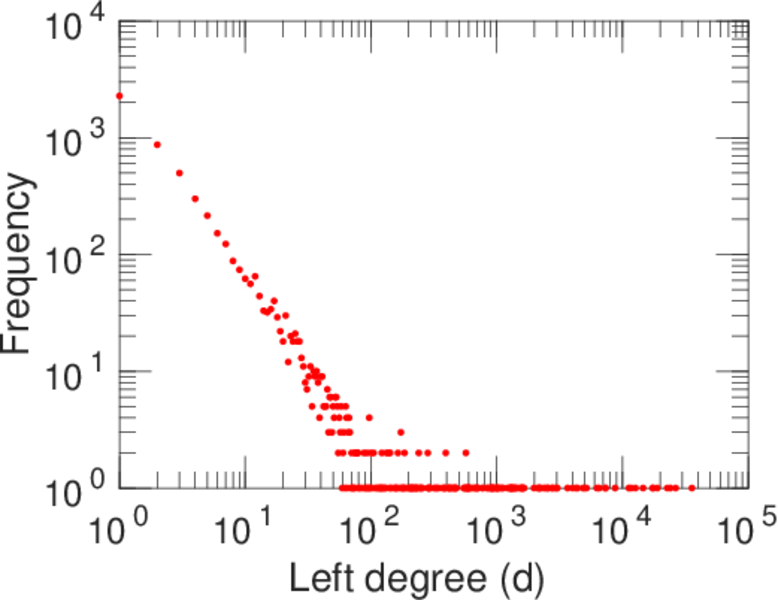
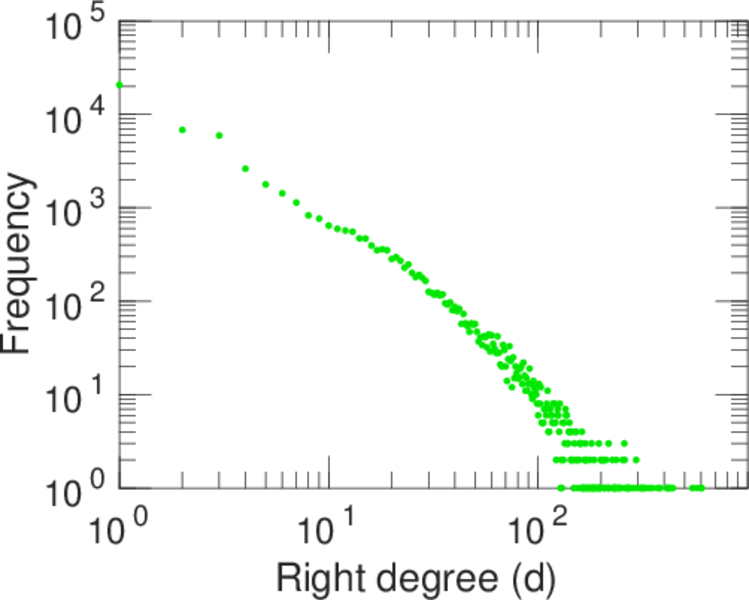
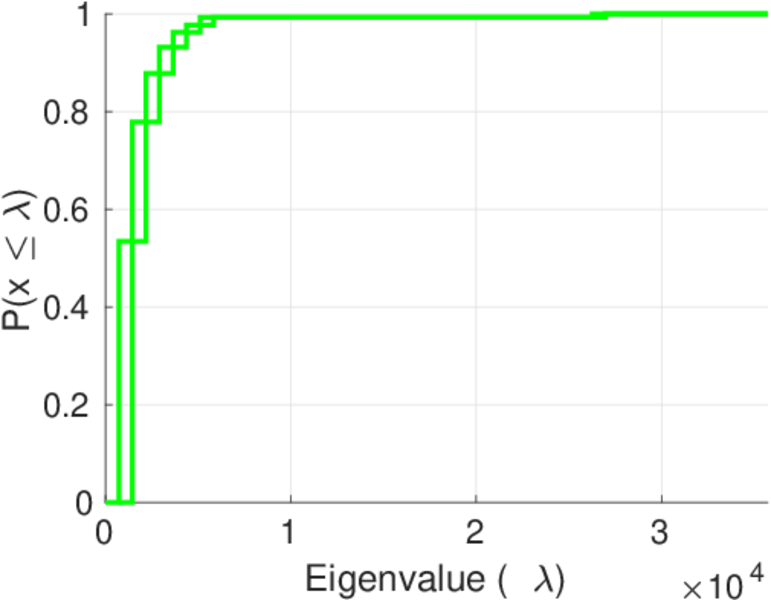
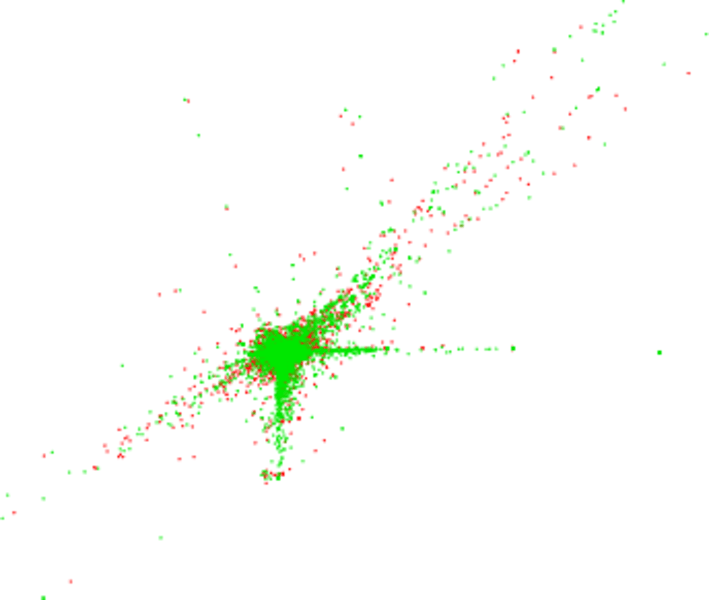
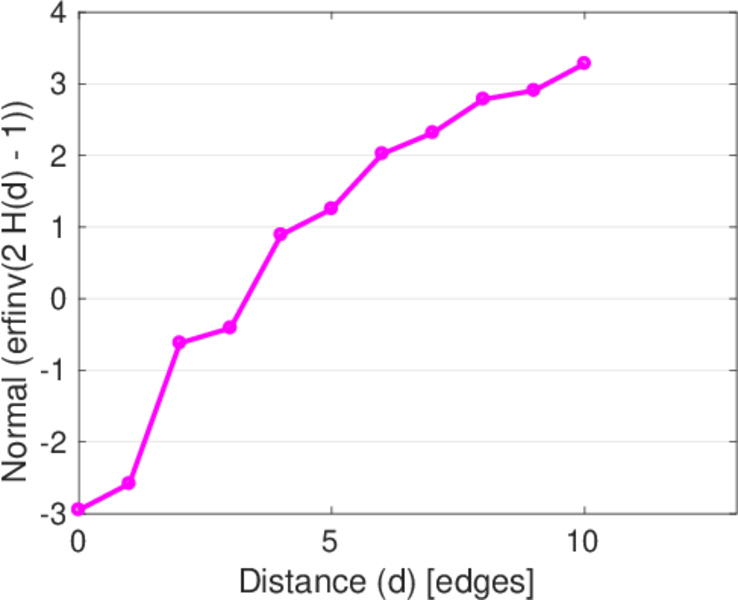
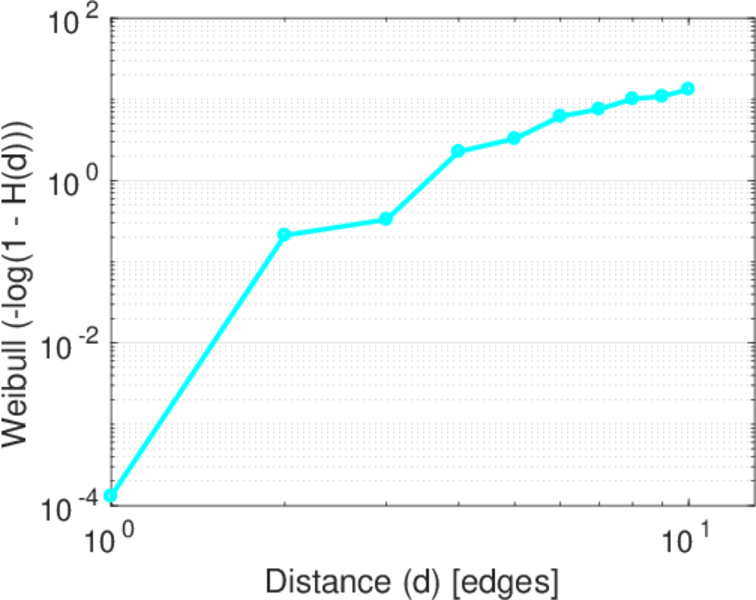
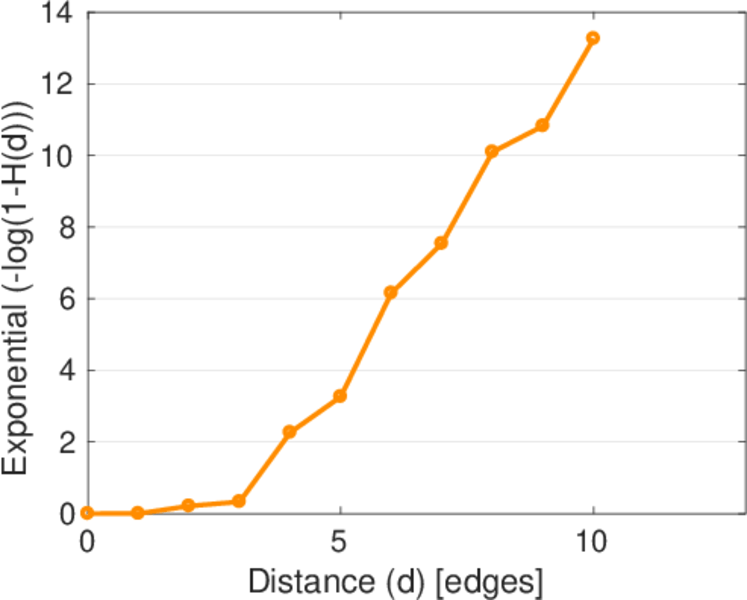
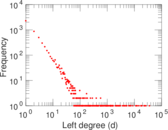
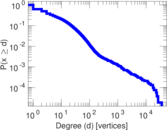
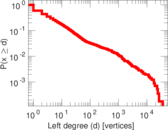
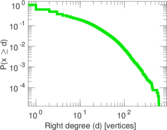
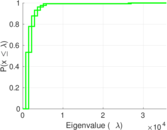
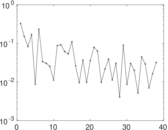
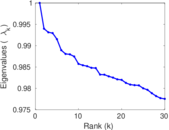
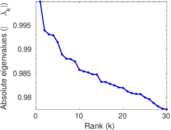
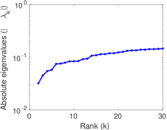
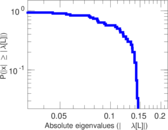
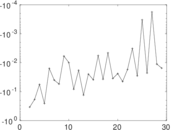
Plots


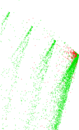
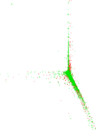
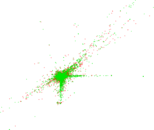


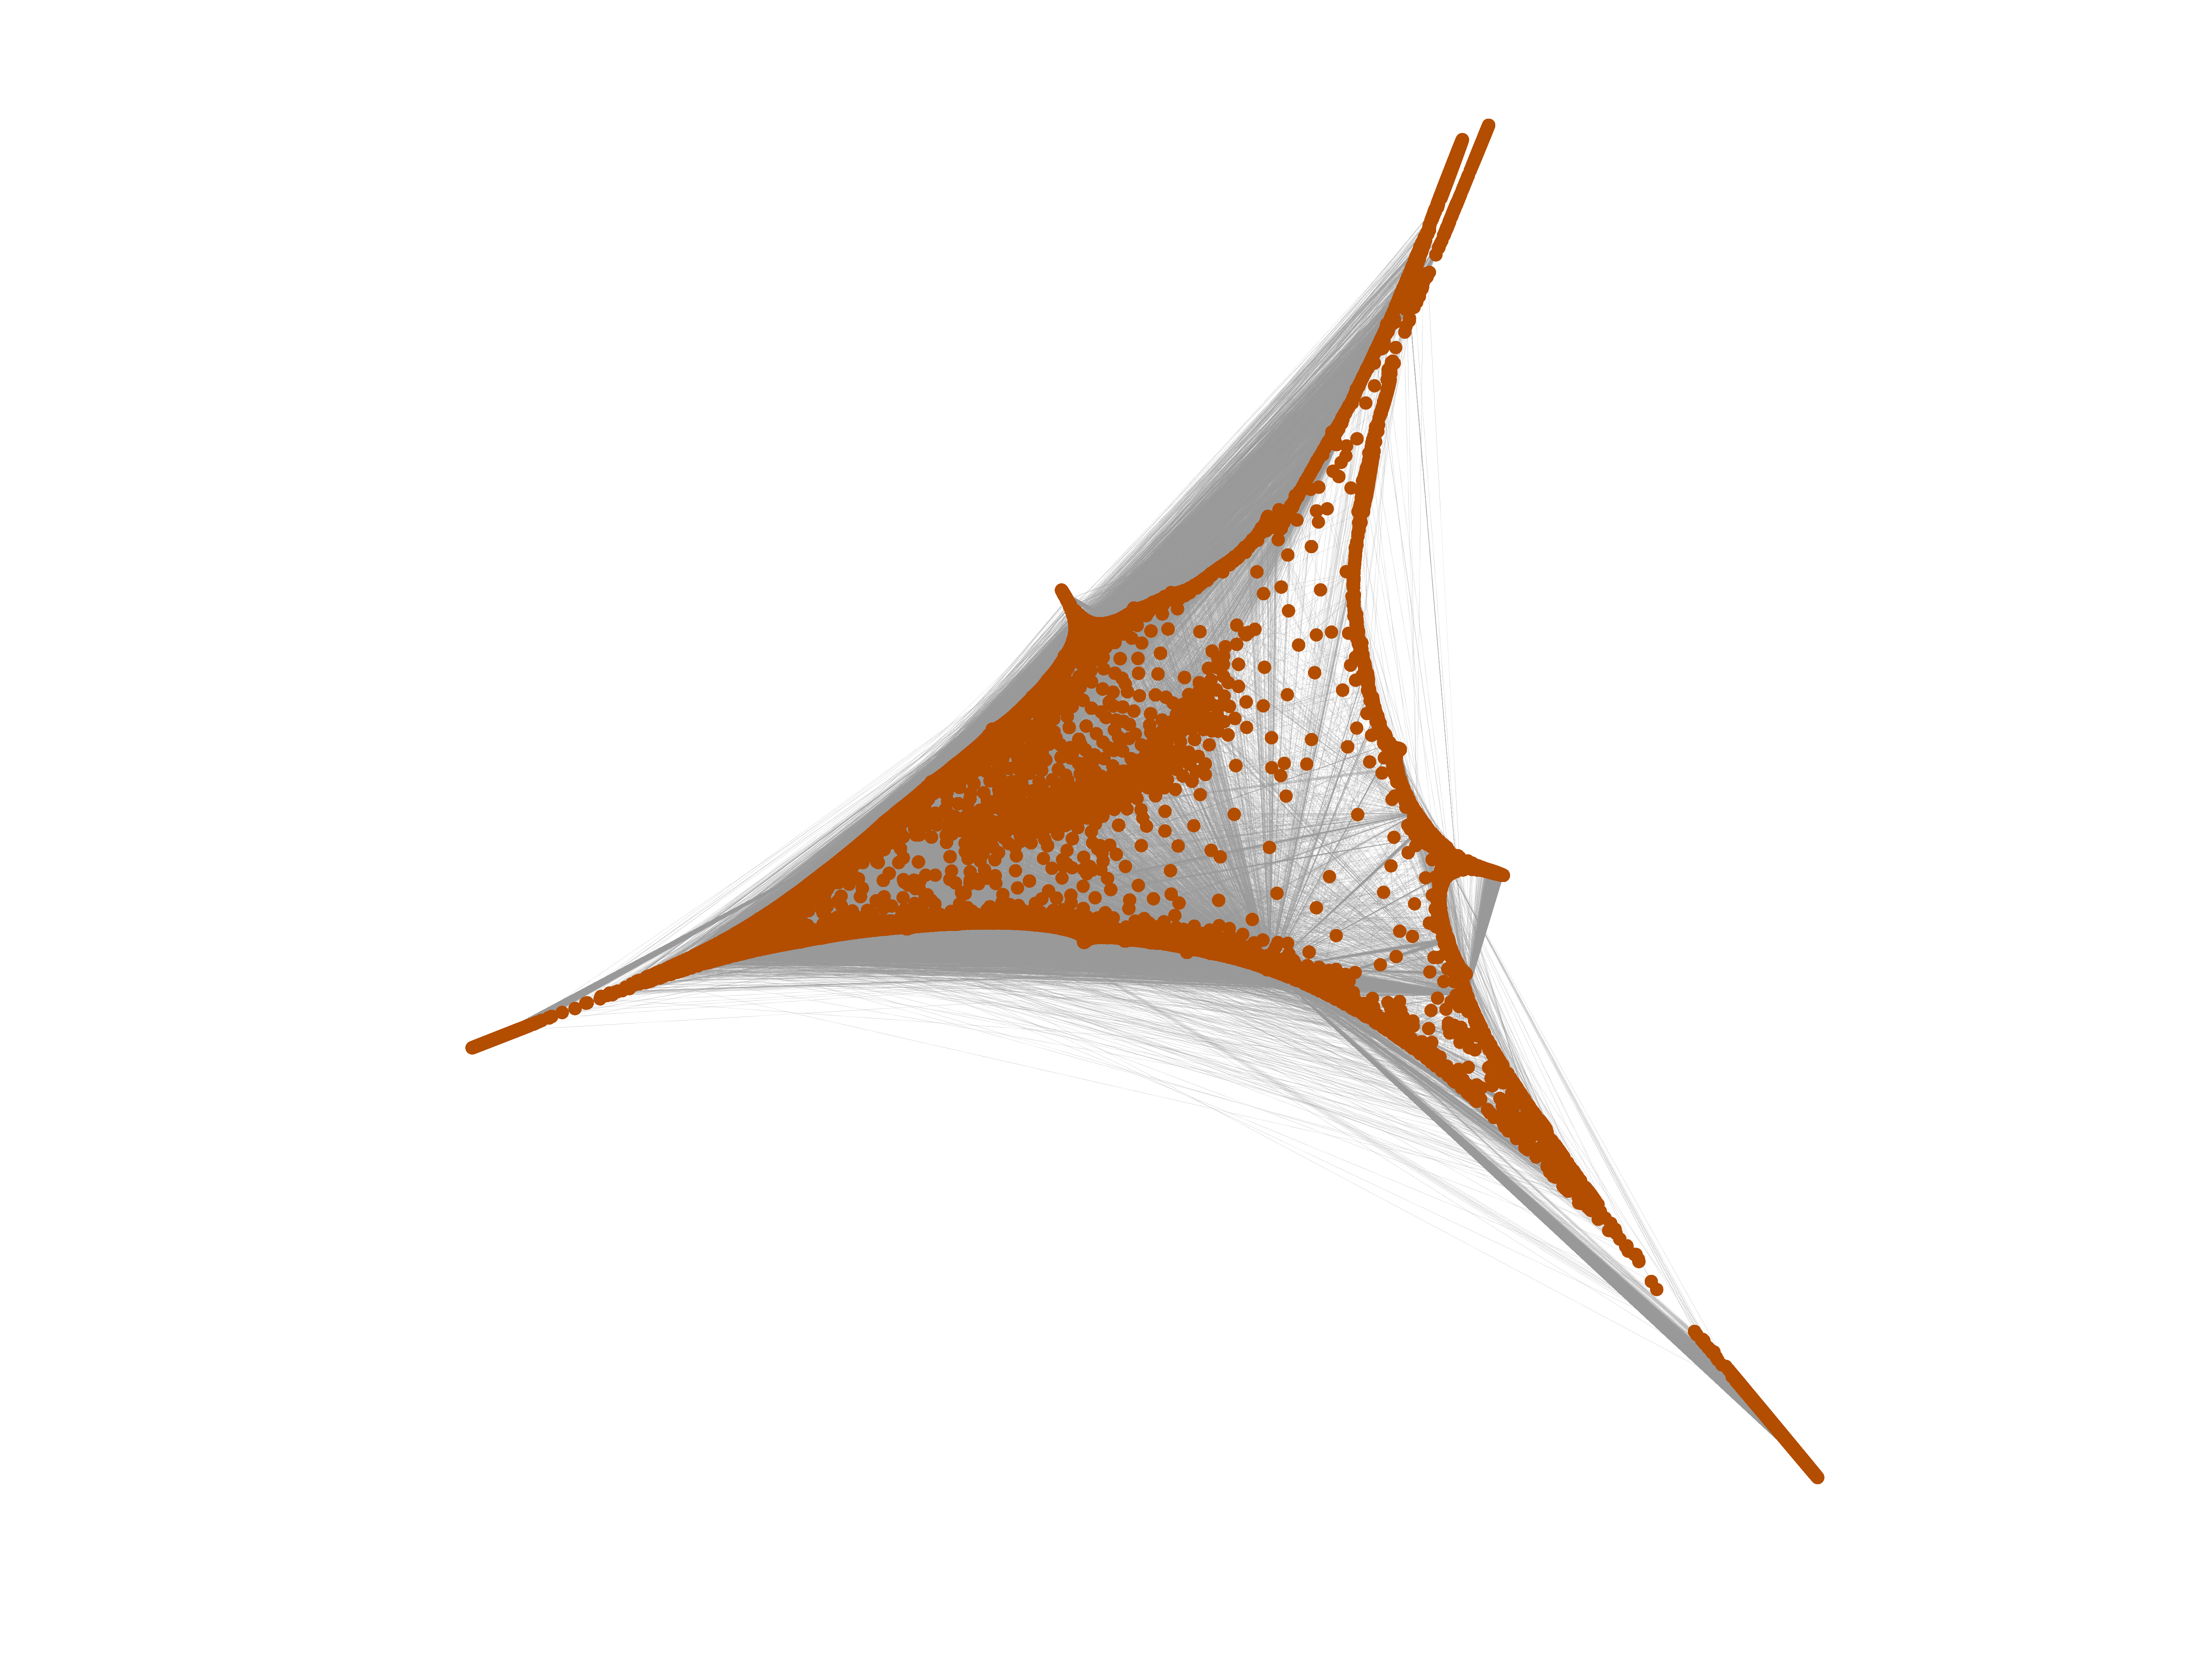
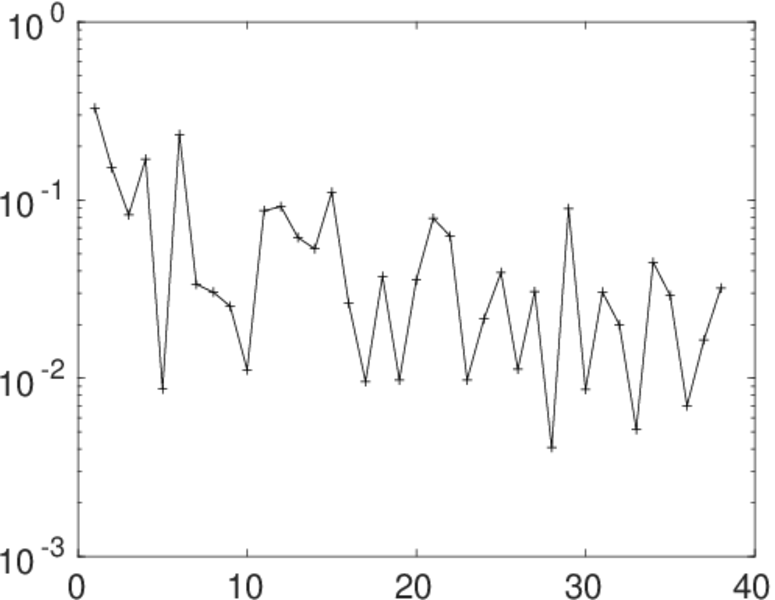
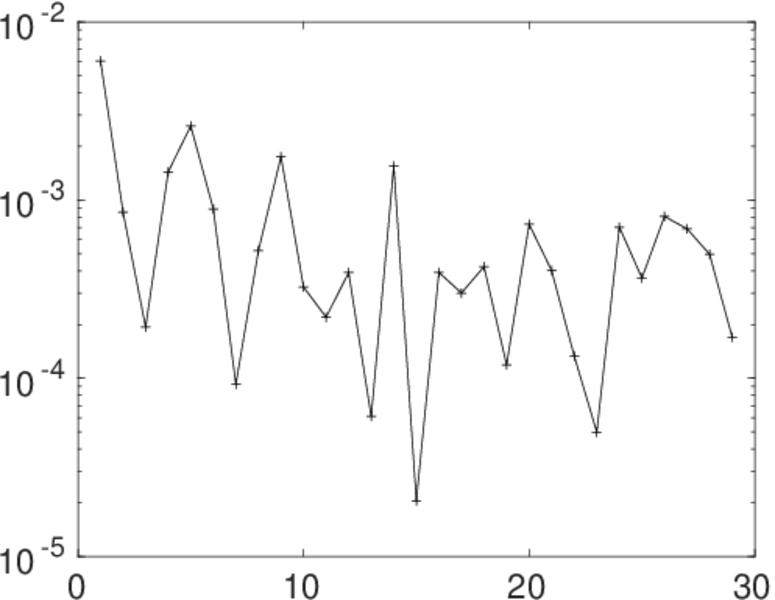
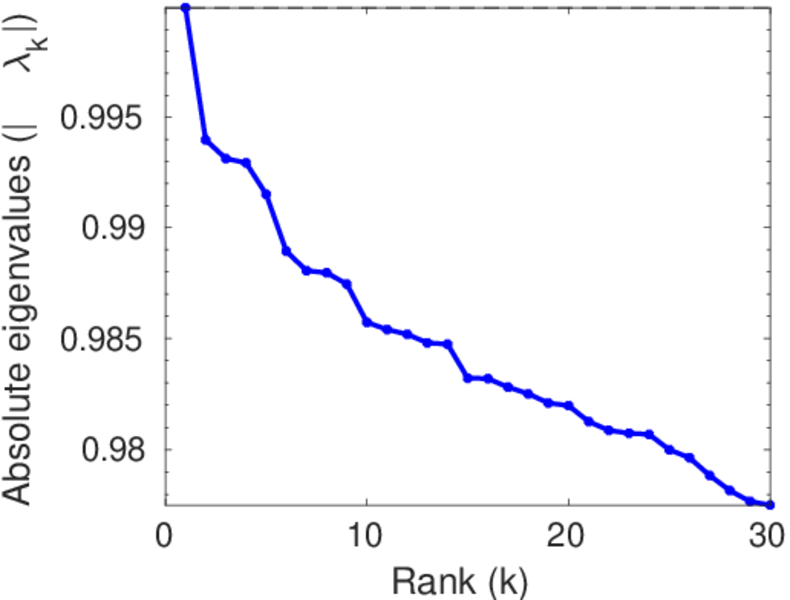
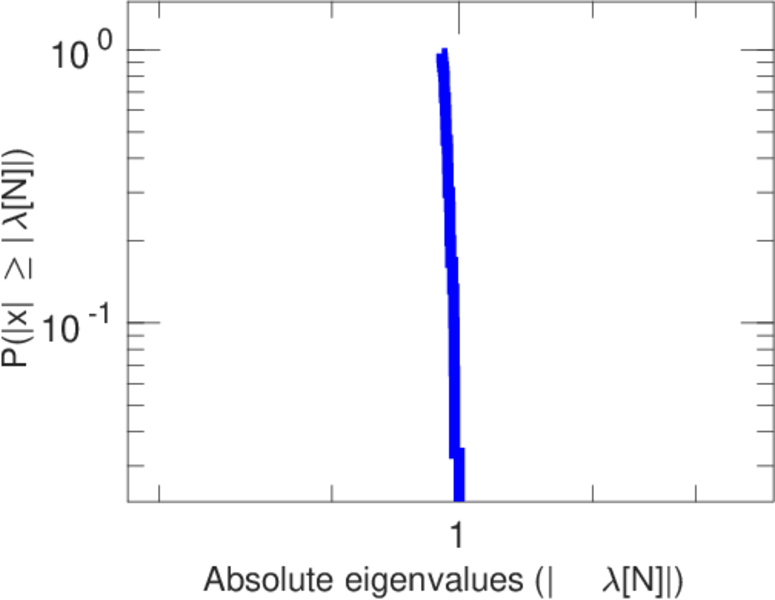
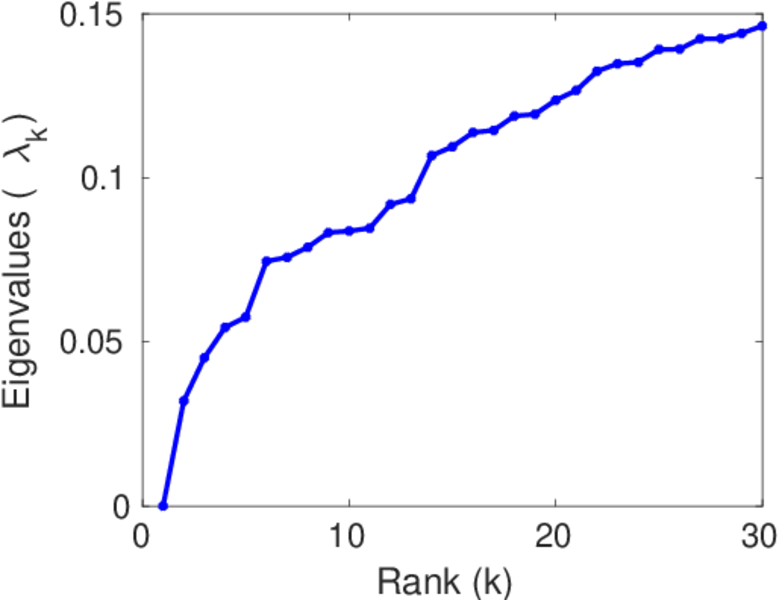
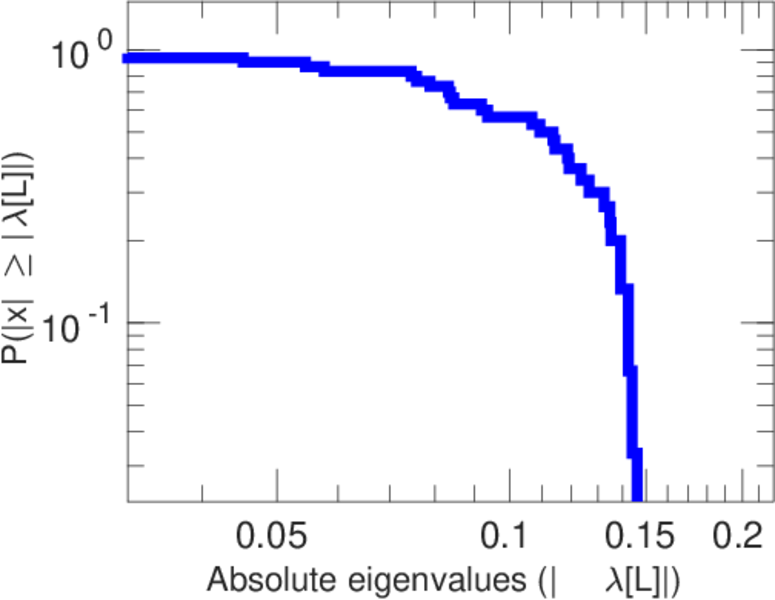
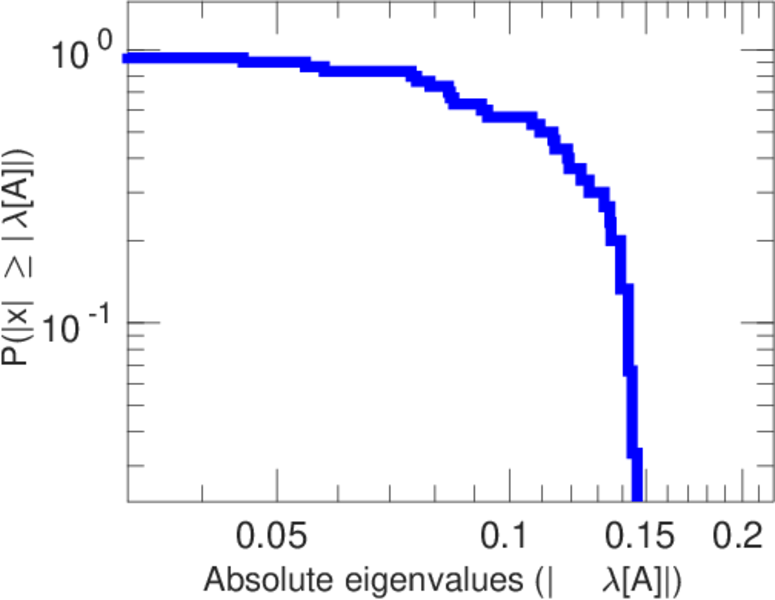
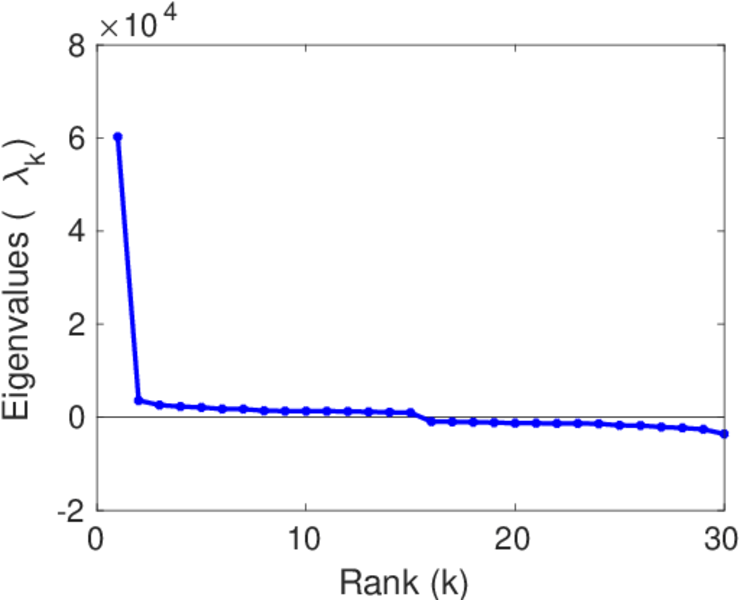
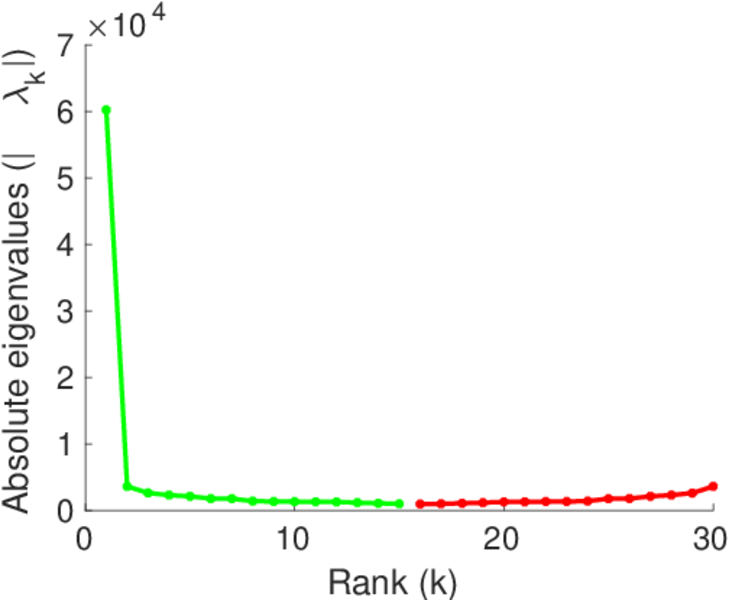
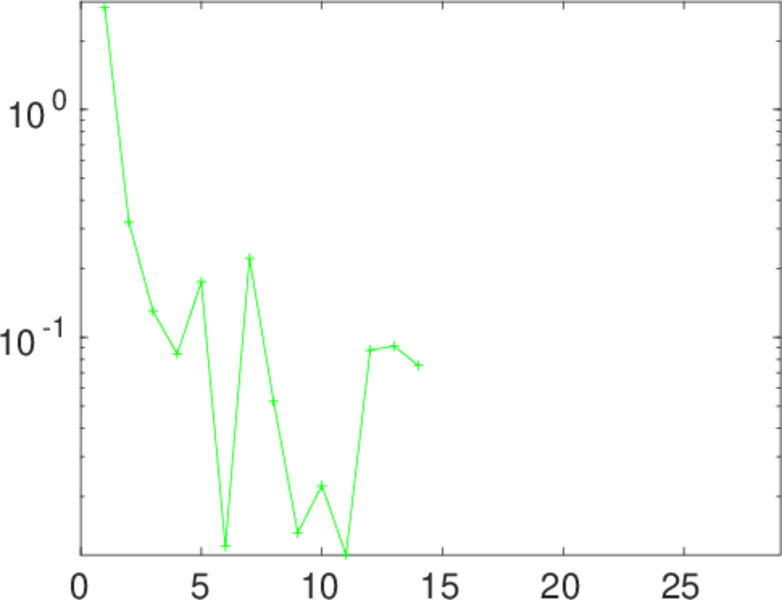
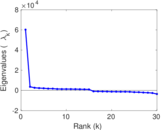
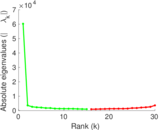
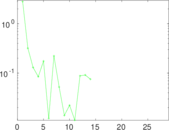
Matrix decompositions plots


Downloads
References
|
[1]
|
Jérôme Kunegis.
KONECT – The Koblenz Network Collection.
In Proc. Int. Conf. on World Wide Web Companion, pages
1343–1350, 2013.
[ http ]
|
|
[2]
|
Wikimedia Foundation.
Wikimedia downloads.
http://dumps.wikimedia.org/, January 2010.
|
 KONECT ‣ Networks ‣
Buy Me a Coffee
KONECT ‣ Networks ‣
Buy Me a Coffee