Wikipedia edits (mo)
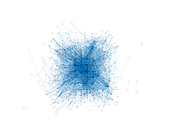
This is the bipartite edit network of the молдовеняскэ Wikipedia.
It contains users and pages from the молдовеняскэ Wikipedia,
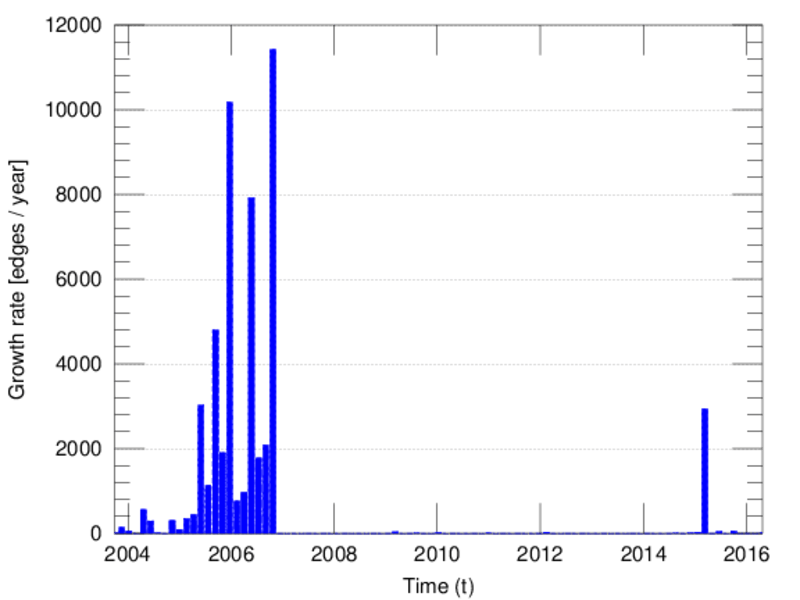
connected by edit events. Each edge represents an edit. The dataset includes
the timestamp of each edit.
Metadata
Statistics
| Size | n = | 1,643
|
| Left size | n1 = | 167
|
| Right size | n2 = | 1,476
|
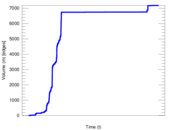
| Volume | m = | 7,181
|
| Unique edge count | m̿ = | 3,021
|
| Wedge count | s = | 209,463
|
| Claw count | z = | 16,828,614
|
| Cross count | x = | 1,258,962,857
|
| Square count | q = | 36,878
|
| 4-Tour count | T4 = | 1,141,354
|
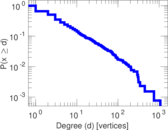
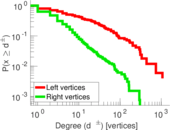
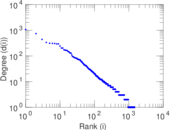
| Maximum degree | dmax = | 1,068
|
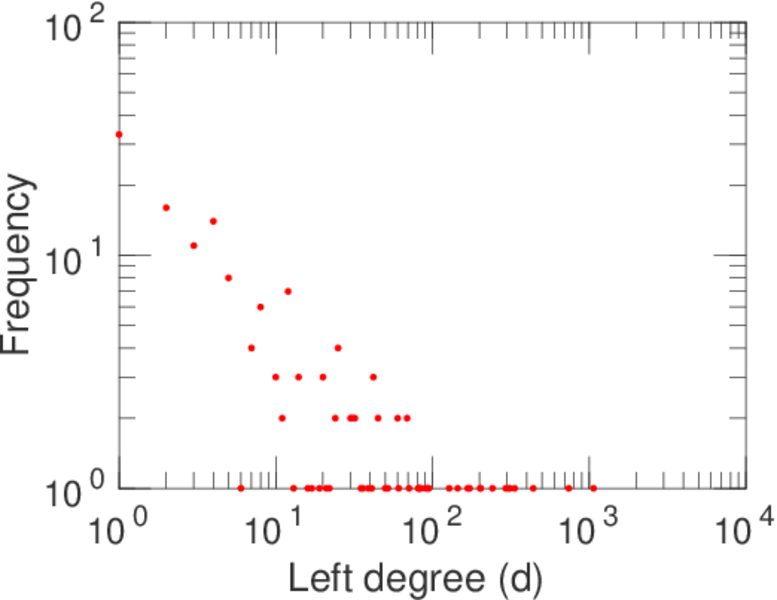
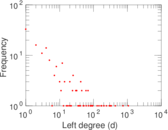
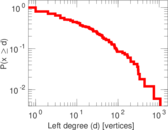
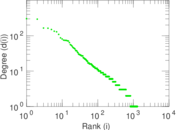
| Maximum left degree | d1max = | 1,068
|
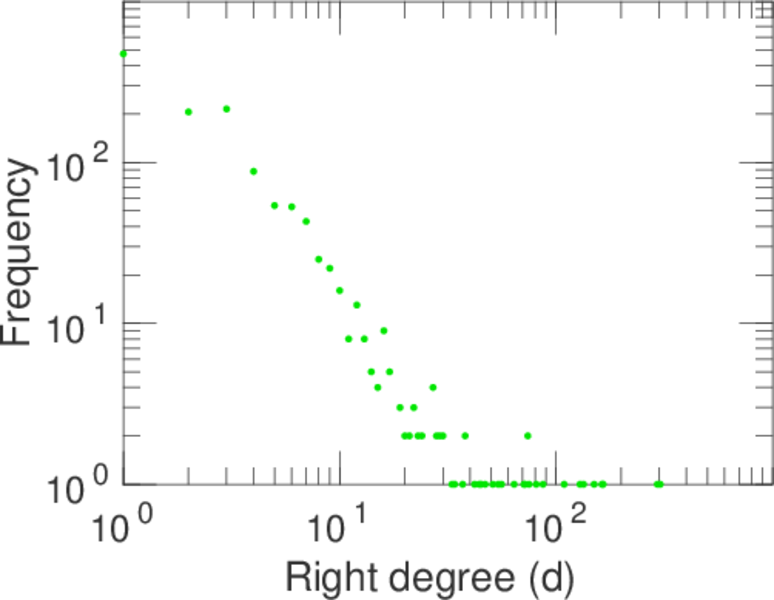
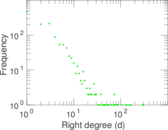
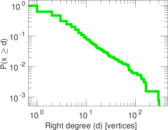
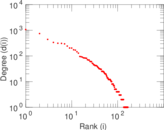
| Maximum right degree | d2max = | 303
|
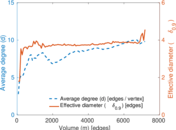
| Average degree | d = | 8.741 33
|
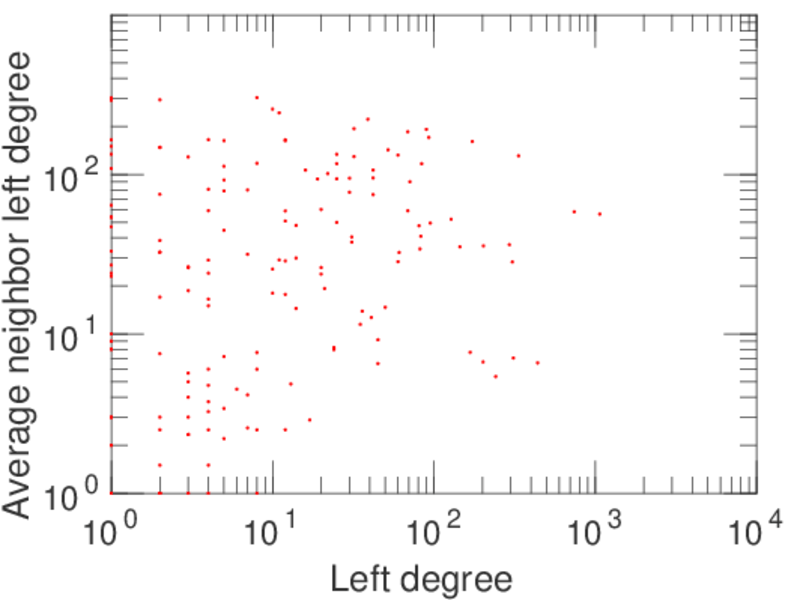
| Average left degree | d1 = | 43.000 0
|
| Average right degree | d2 = | 4.865 18
|
| Fill | p = | 0.012 256 0
|
| Average edge multiplicity | m̃ = | 2.377 03
|
| Size of LCC | N = | 1,414
|
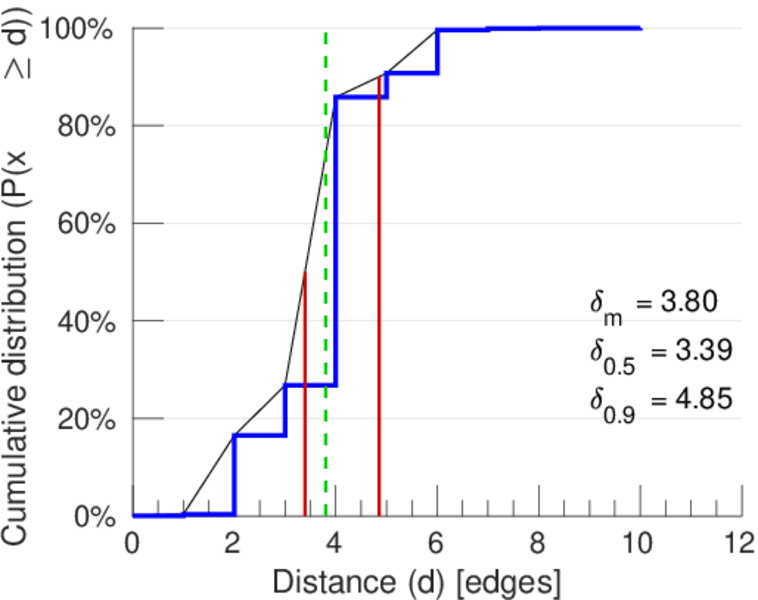
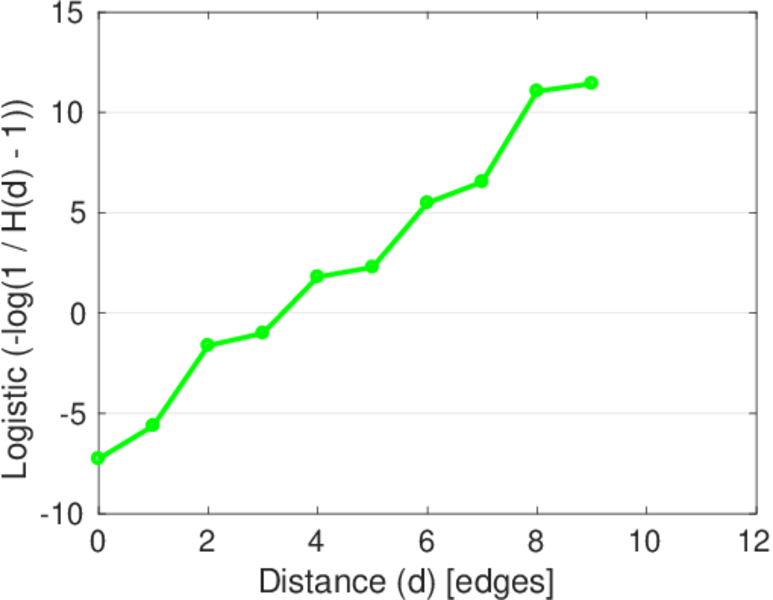
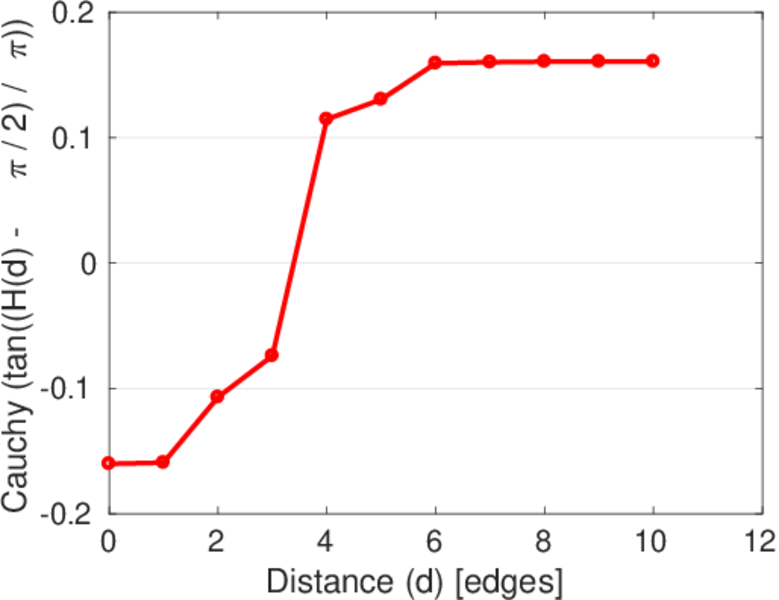
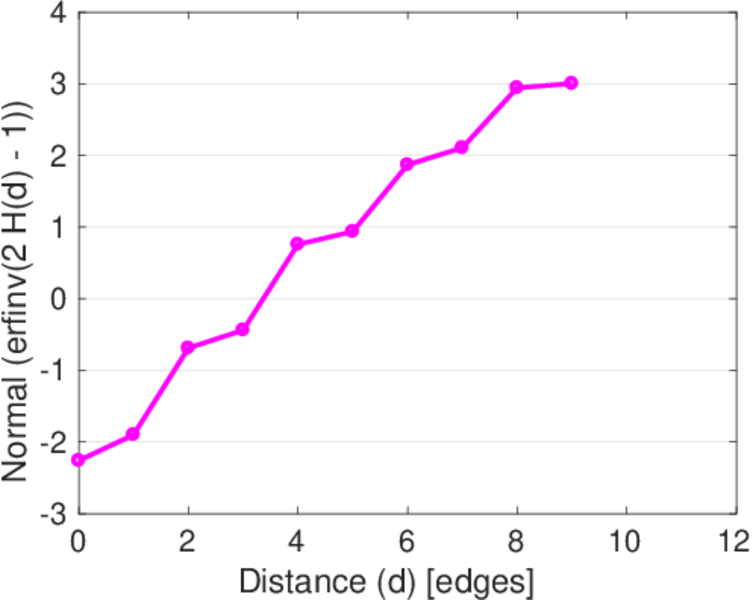
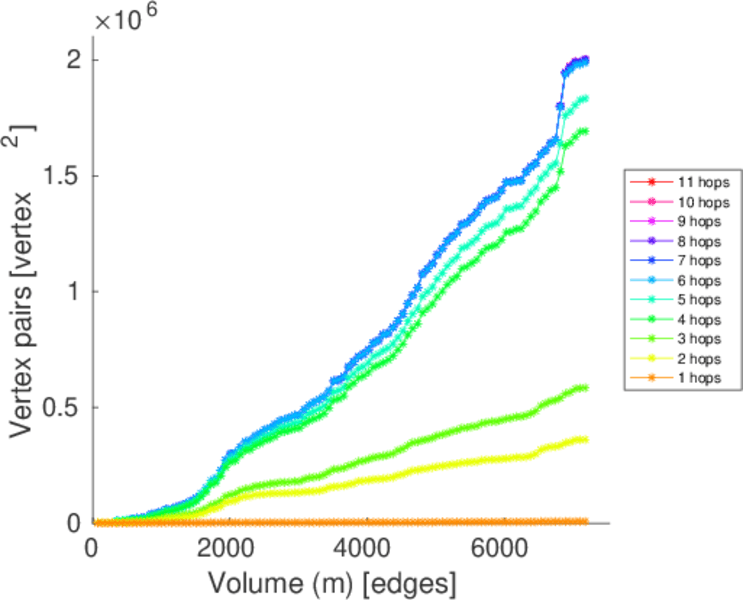
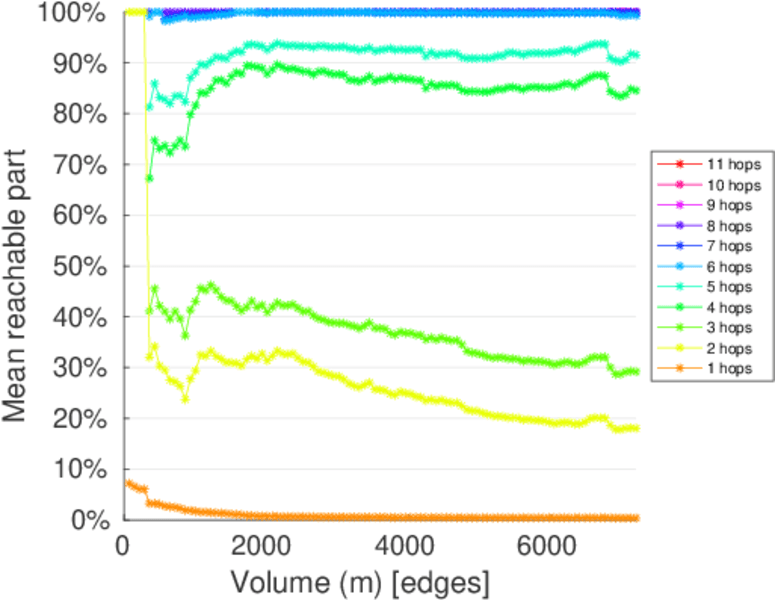
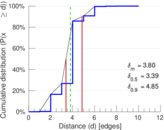
| Diameter | δ = | 10
|
| 50-Percentile effective diameter | δ0.5 = | 3.393 66
|
| 90-Percentile effective diameter | δ0.9 = | 4.852 60
|
| Median distance | δM = | 4
|
| Mean distance | δm = | 3.803 74
|
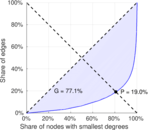
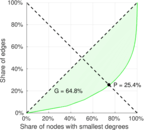
| Gini coefficient | G = | 0.785 543
|
| Balanced inequality ratio | P = | 0.177 900
|
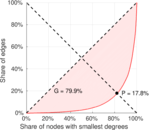
| Left balanced inequality ratio | P1 = | 0.177 970
|
| Right balanced inequality ratio | P2 = | 0.253 725
|
| Relative edge distribution entropy | Her = | 0.825 489
|
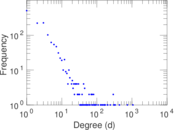
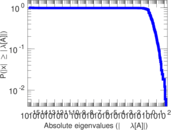
| Power law exponent | γ = | 2.433 80
|
| Tail power law exponent | γt = | 2.321 00
|
| Tail power law exponent with p | γ3 = | 2.321 00
|
| p-value | p = | 0.030 000 0
|
| Left tail power law exponent with p | γ3,1 = | 1.851 00
|
| Left p-value | p1 = | 0.778 000
|
| Right tail power law exponent with p | γ3,2 = | 2.711 00
|
| Right p-value | p2 = | 0.004 000 00
|
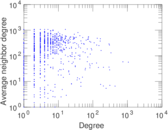
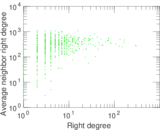
| Degree assortativity | ρ = | −0.255 399
|
| Degree assortativity p-value | pρ = | 3.408 47 × 10−46
|
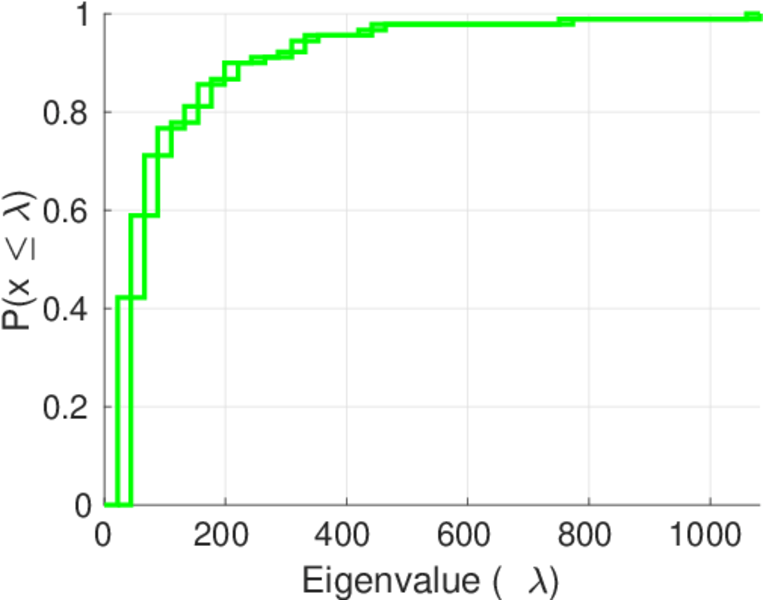
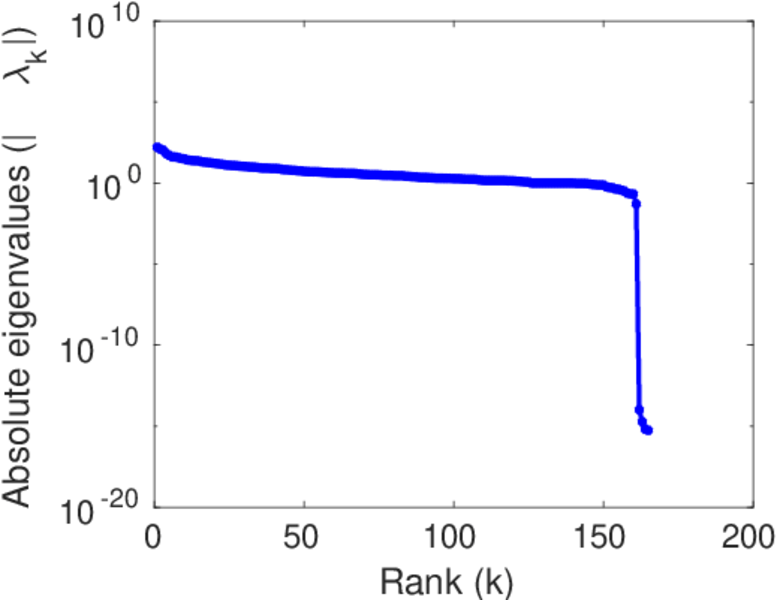
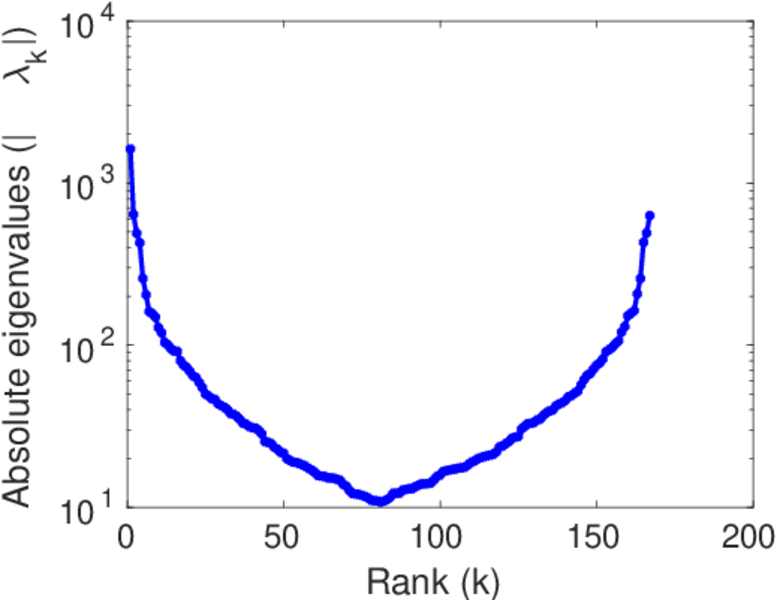
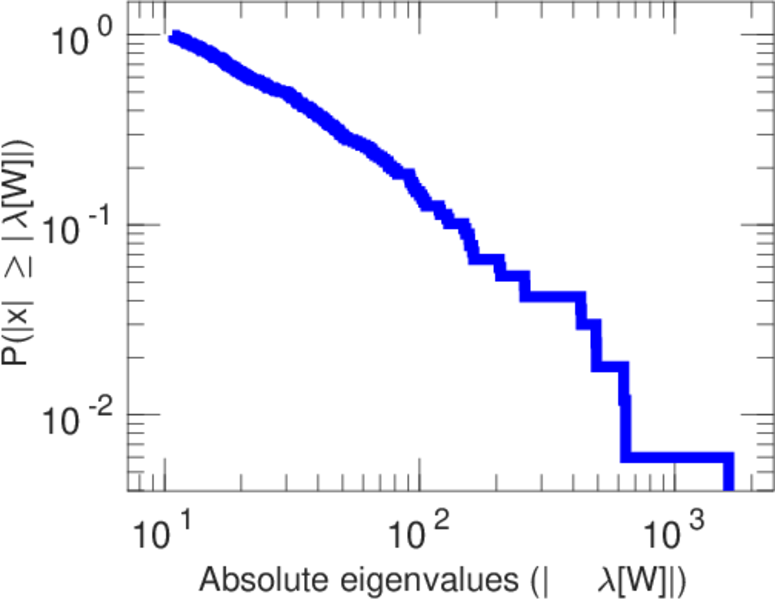
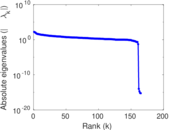
| Spectral norm | α = | 162.235
|
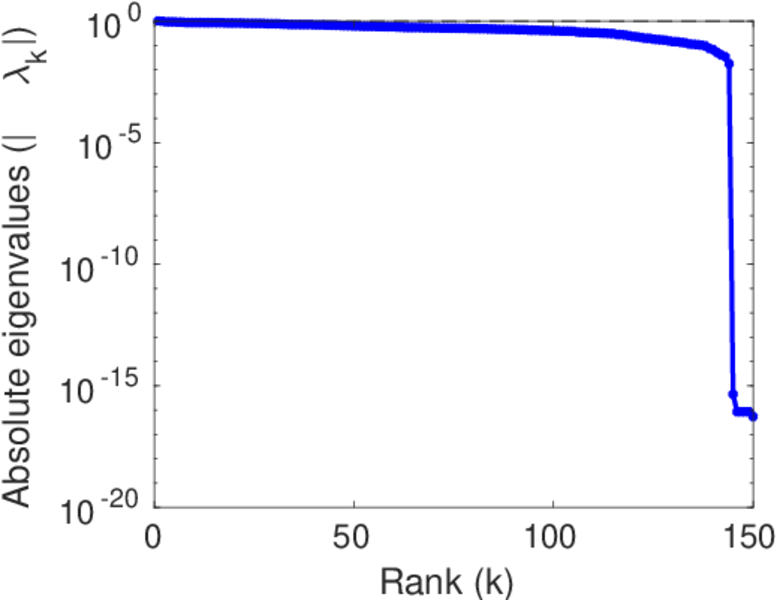
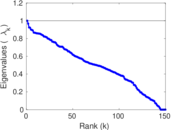
| Algebraic connectivity | a = | 0.071 819 7
|
| Spectral separation | |λ1[A] / λ2[A]| = | 1.319 94
|
| Controllability | C = | 1,144
|
| Relative controllability | Cr = | 0.780 355
|
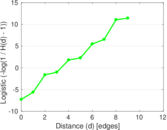
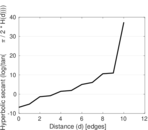
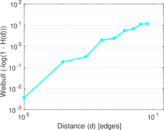
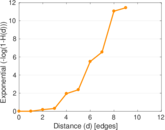
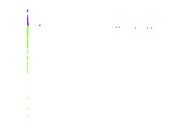
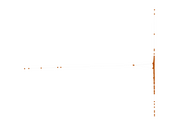
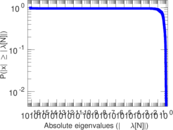
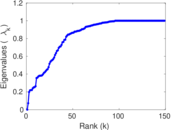
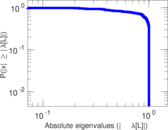
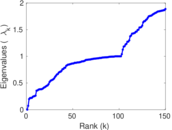
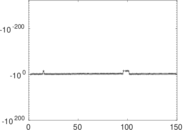
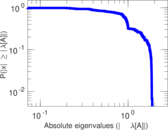
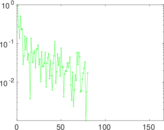
Plots


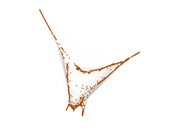


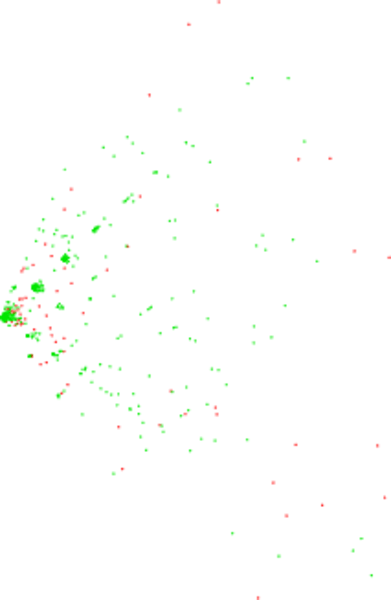
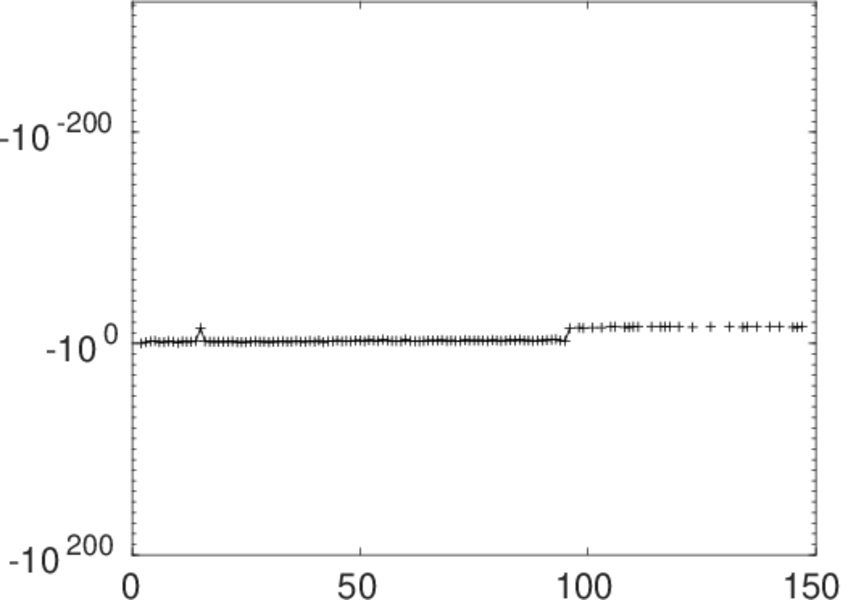
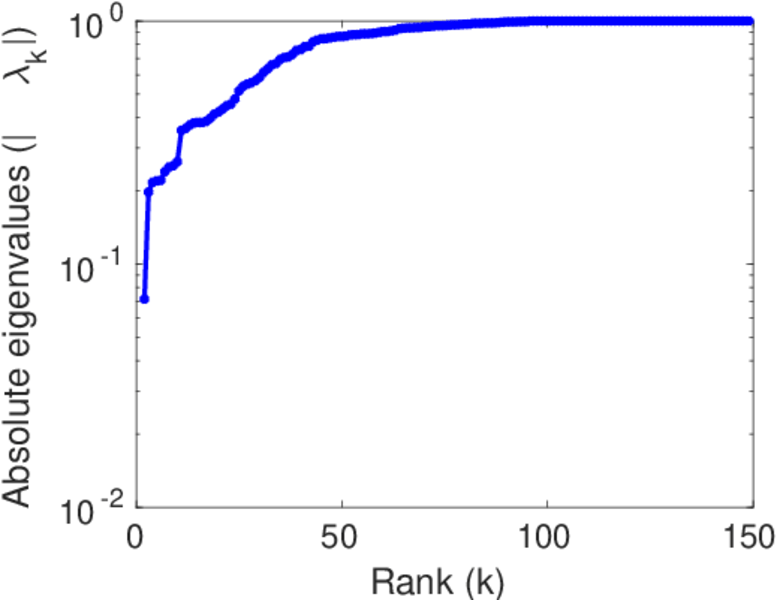
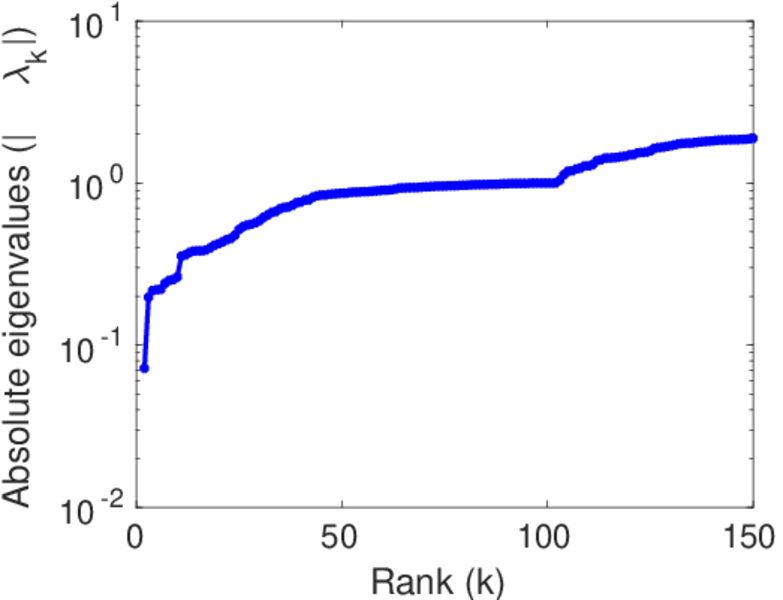
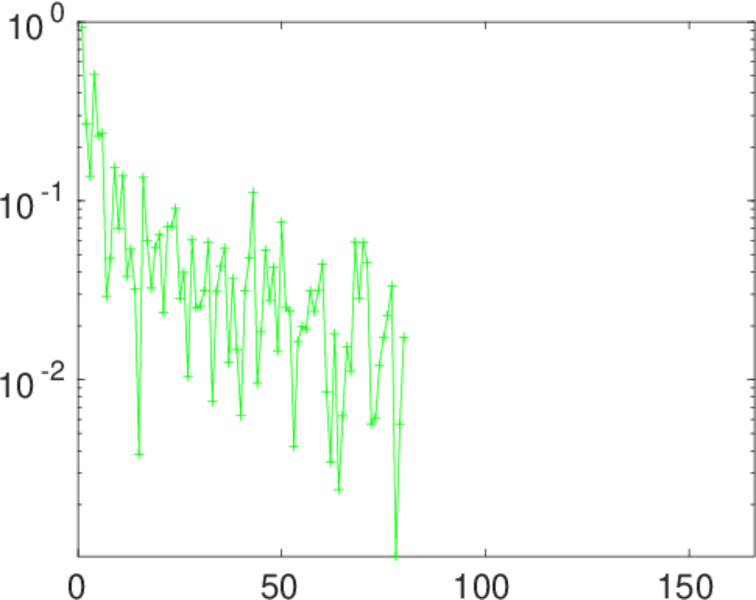
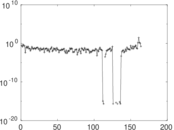
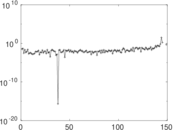
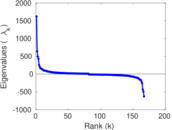
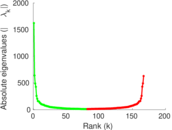
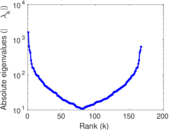
Matrix decompositions plots


Downloads
References
|
[1]
|
Jérôme Kunegis.
KONECT – The Koblenz Network Collection.
In Proc. Int. Conf. on World Wide Web Companion, pages
1343–1350, 2013.
[ http ]
|
|
[2]
|
Wikimedia Foundation.
Wikimedia downloads.
http://dumps.wikimedia.org/, January 2010.
|
 KONECT ‣ Networks ‣
Buy Me a Coffee
KONECT ‣ Networks ‣
Buy Me a Coffee