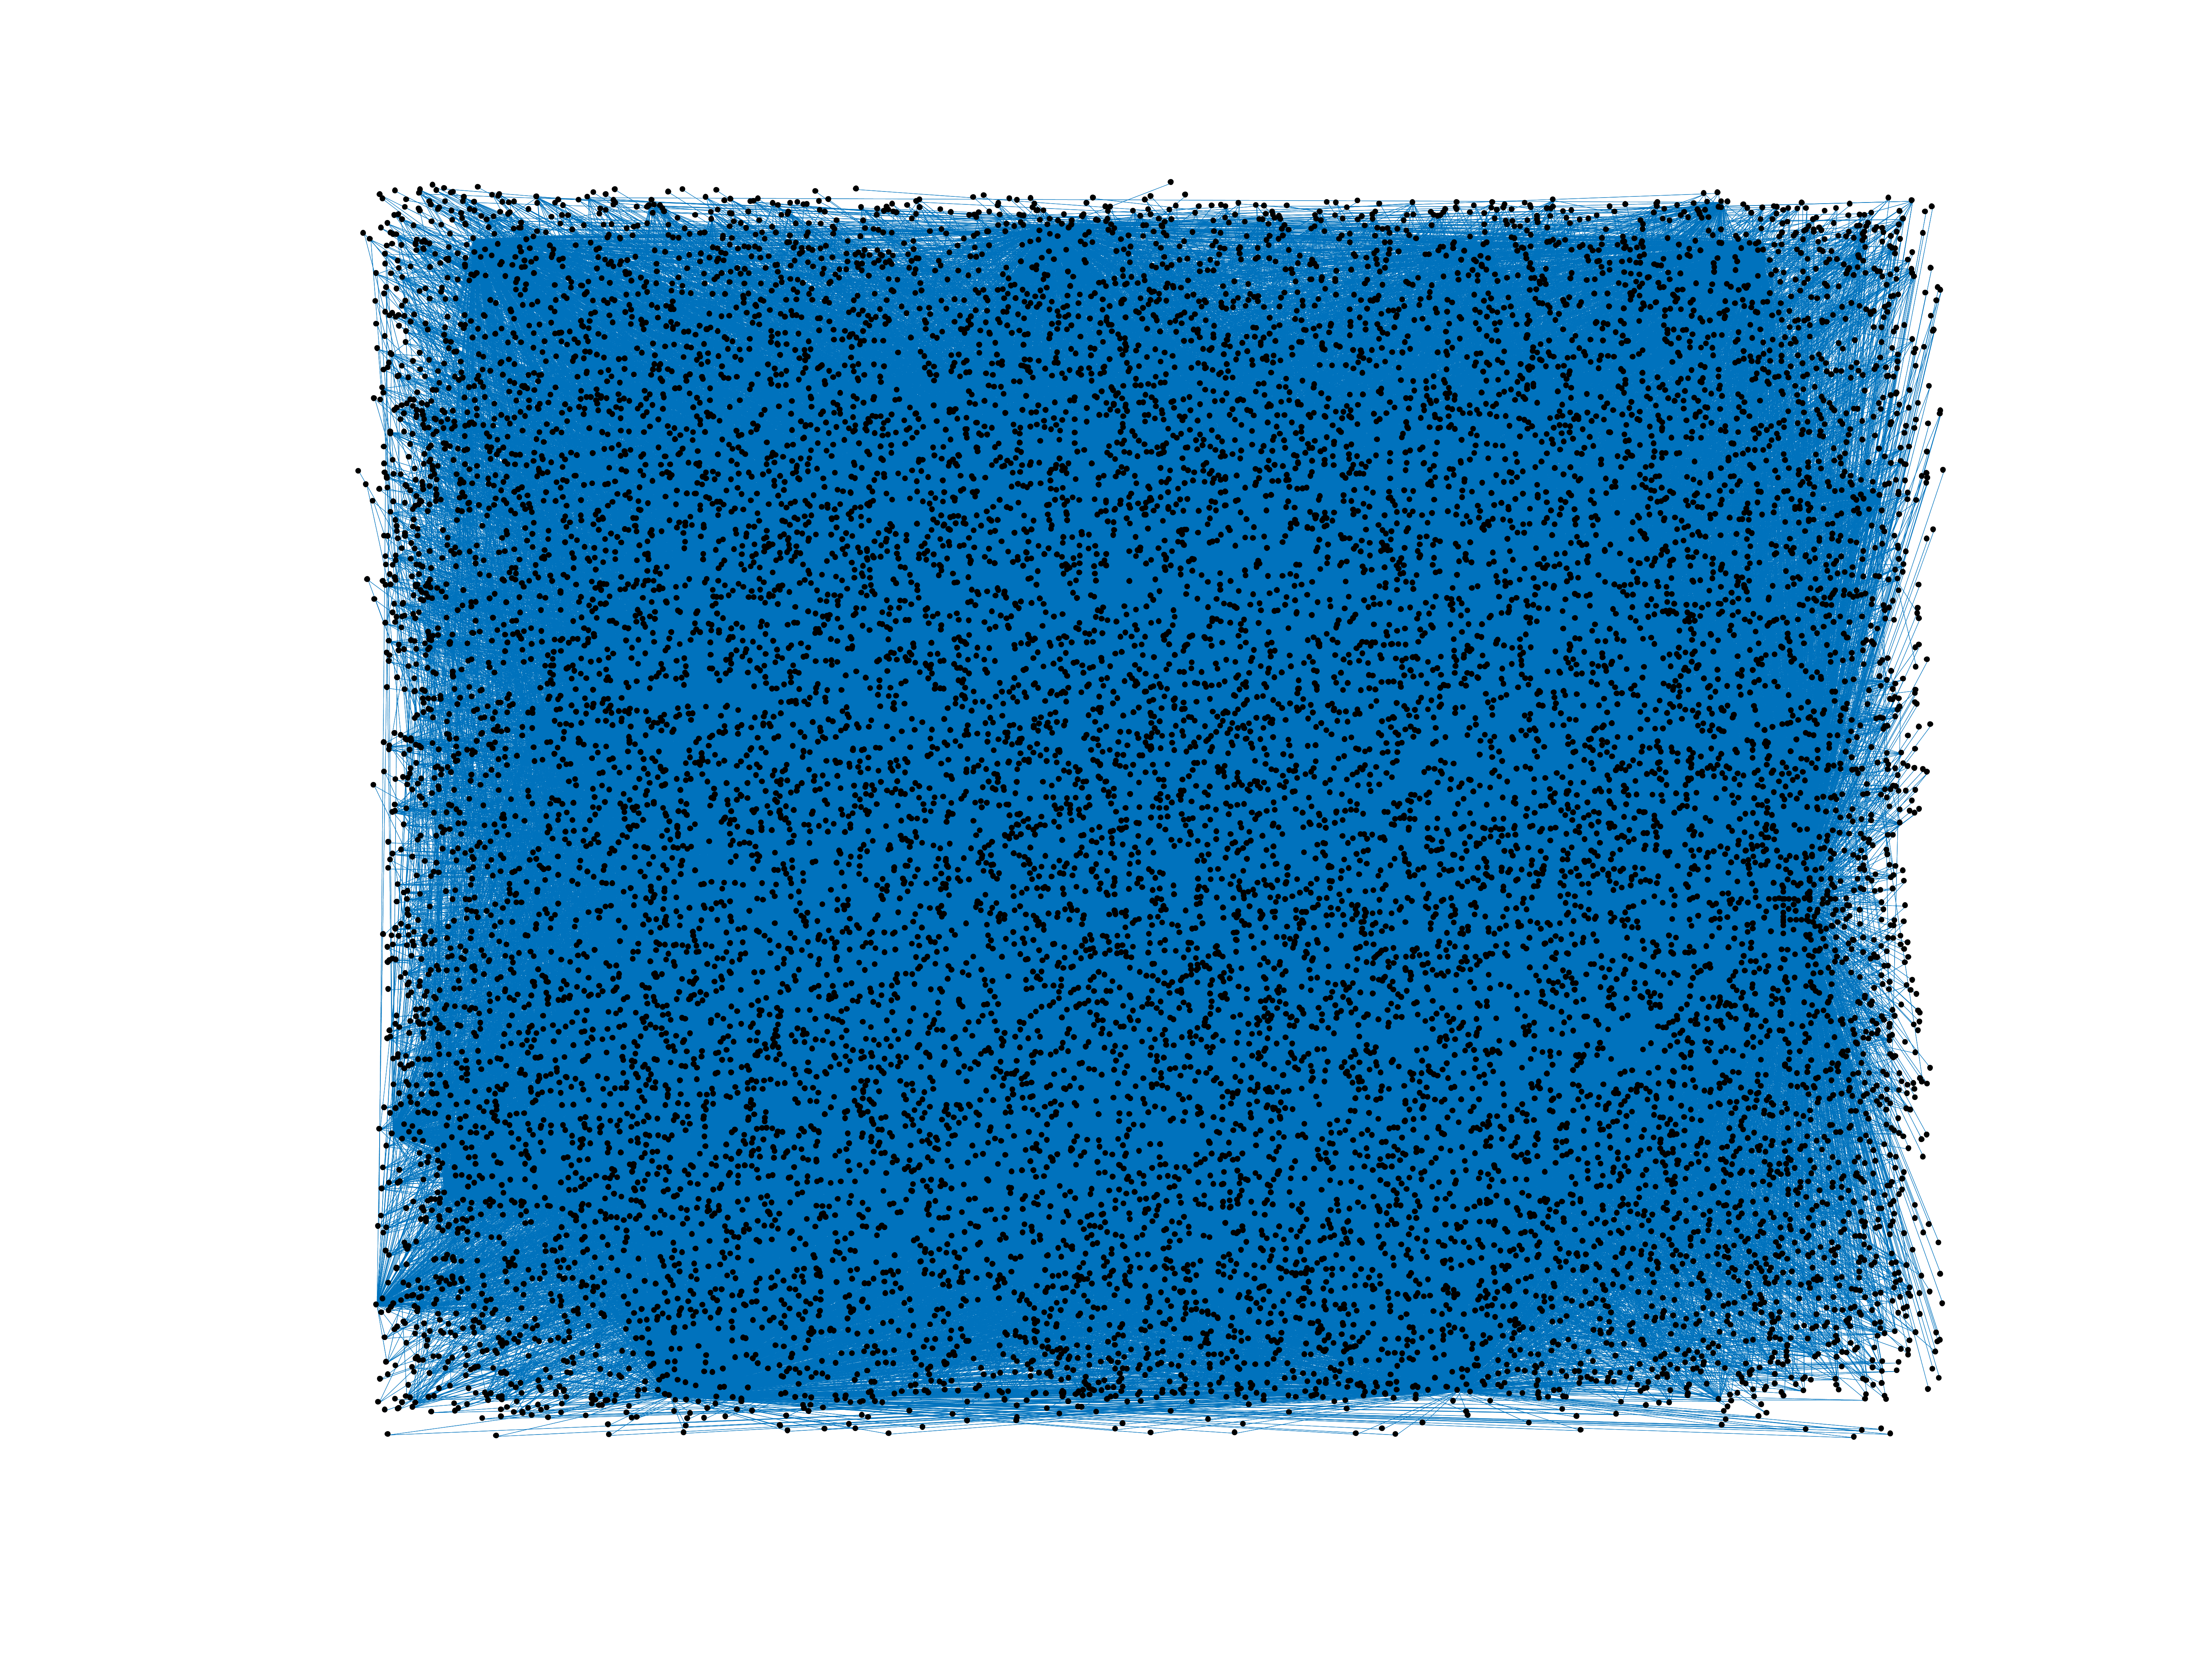
Wikipedia edits (mrj)
This is the bipartite edit network of the Western Mari Wikipedia. It contains
users and pages from the Western Mari Wikipedia, connected by edit events. Each
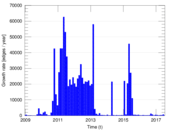
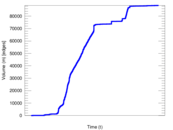
edge represents an edit. The dataset includes the timestamp of each edit.
Metadata
Statistics
| Size | n = | 15,123
|
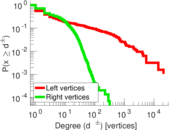
| Left size | n1 = | 624
|
| Right size | n2 = | 14,499
|
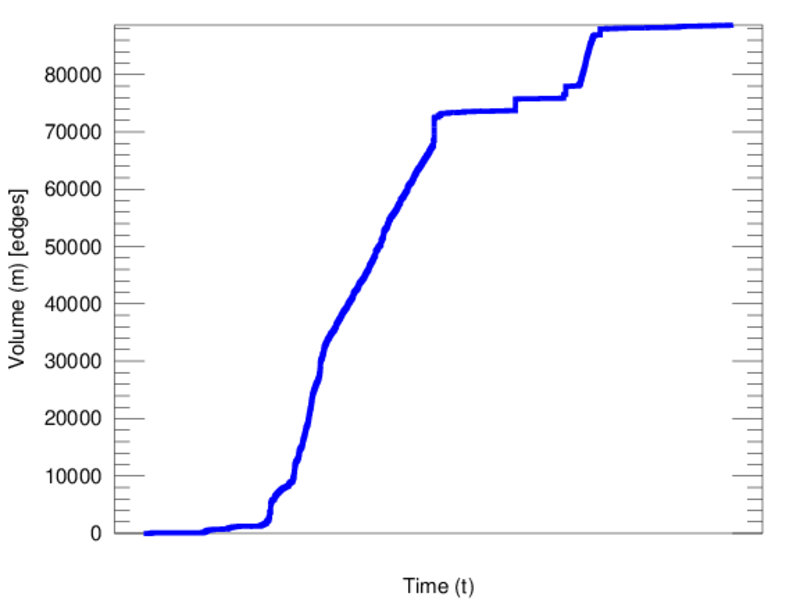
| Volume | m = | 88,622
|
| Unique edge count | m̿ = | 54,278
|
| Wedge count | s = | 94,926,757
|
| Claw count | z = | 230,663,244,363
|
| Cross count | x = | 529,726,416,399,298
|
| Square count | q = | 73,137,994
|
| 4-Tour count | T4 = | 964,980,092
|
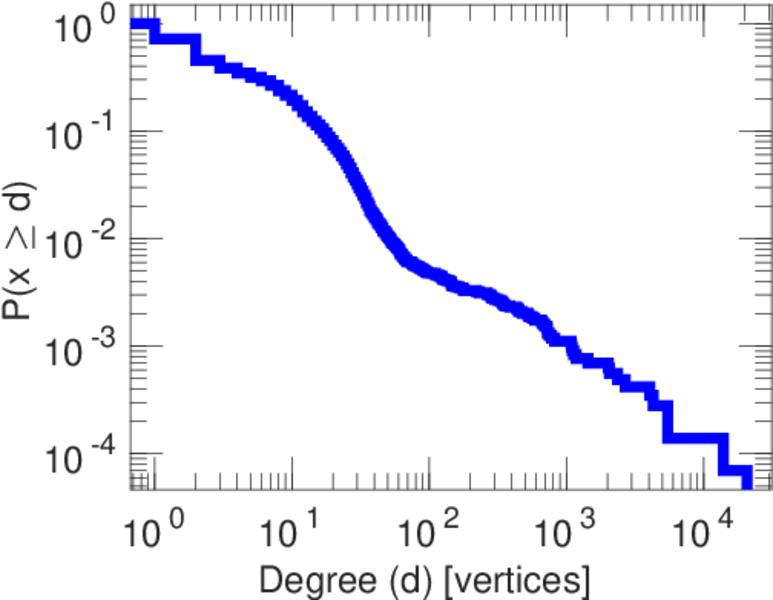
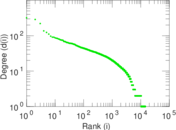
| Maximum degree | dmax = | 20,796
|
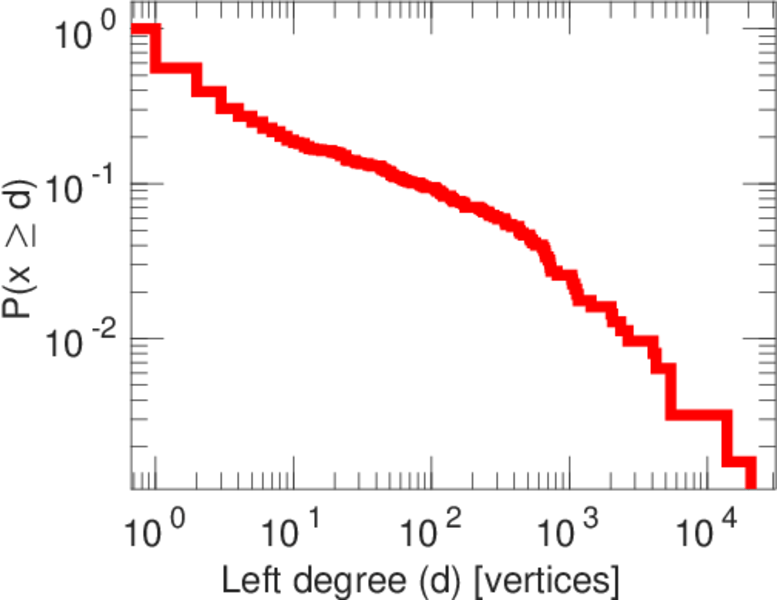
| Maximum left degree | d1max = | 20,796
|
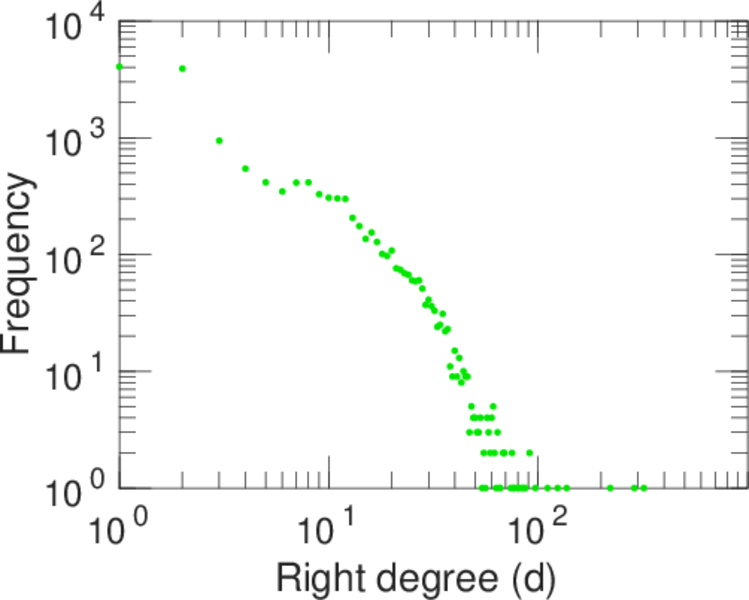
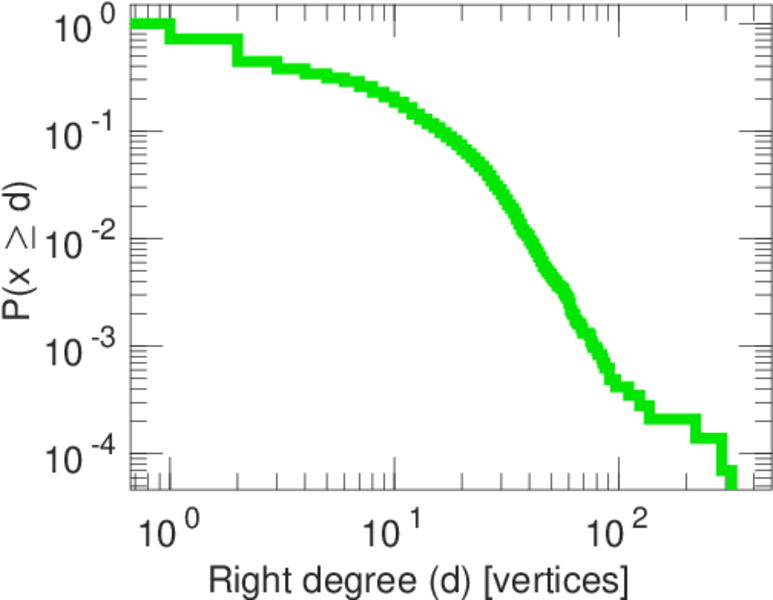
| Maximum right degree | d2max = | 320
|
| Average degree | d = | 11.720 2
|
| Average left degree | d1 = | 142.022
|
| Average right degree | d2 = | 6.112 28
|
| Fill | p = | 0.005 999 31
|
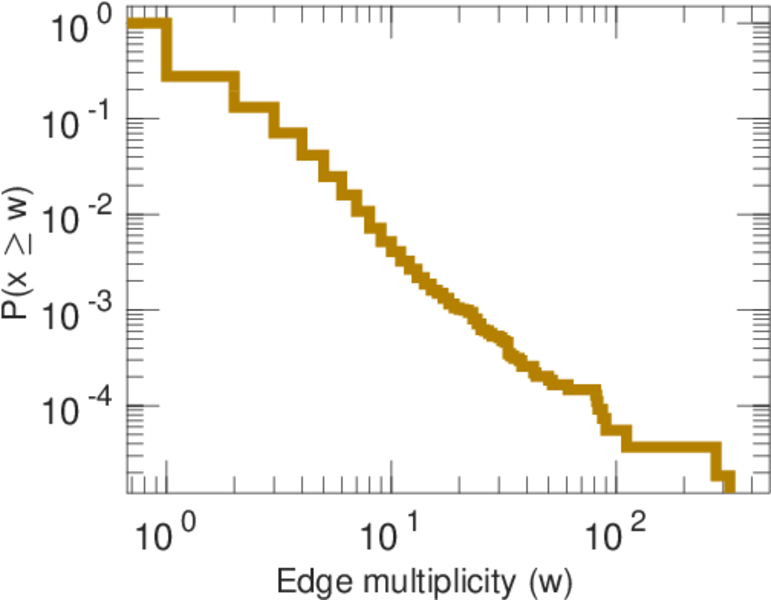
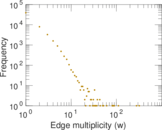
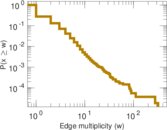
| Average edge multiplicity | m̃ = | 1.632 74
|
| Size of LCC | N = | 14,618
|
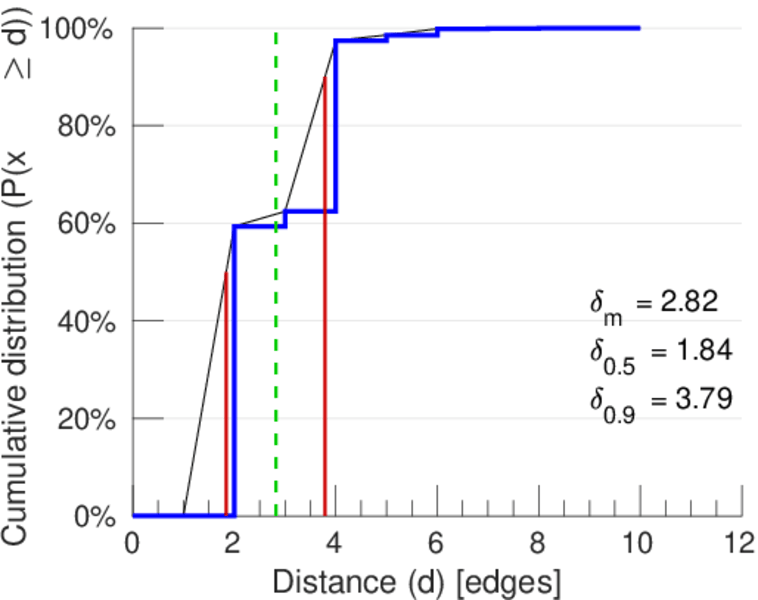
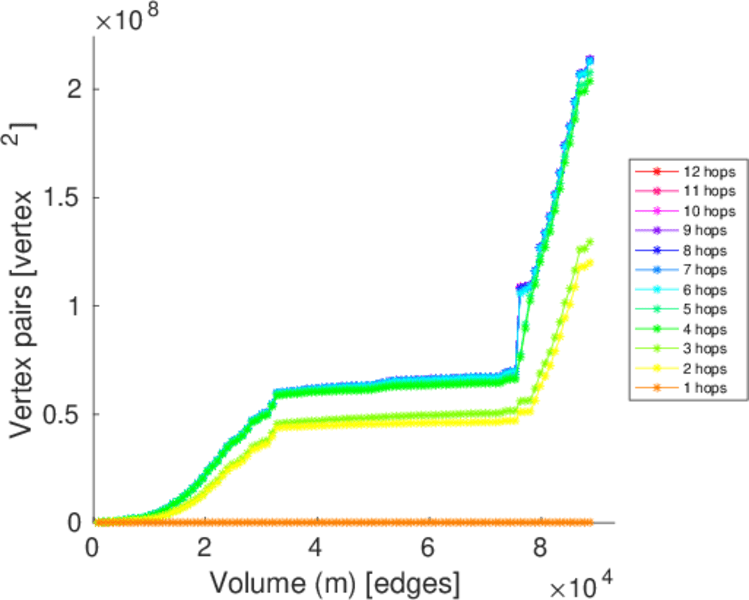
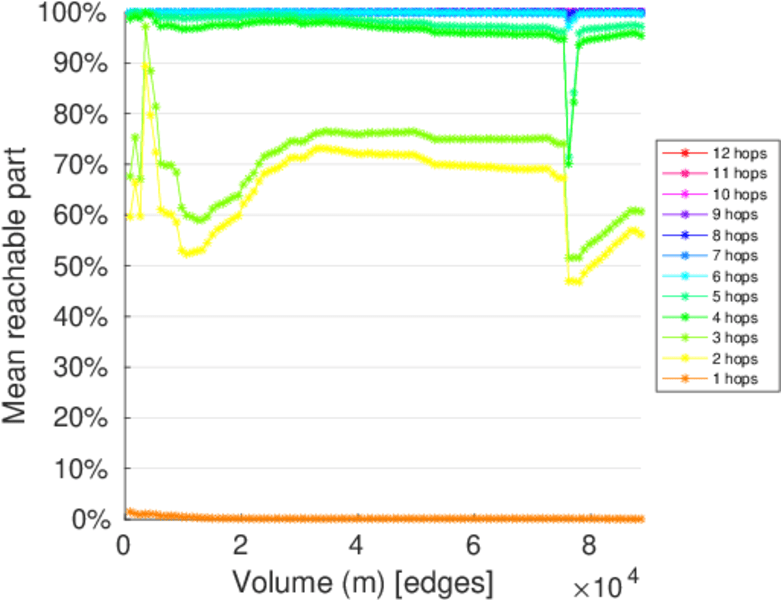
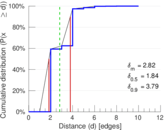
| Diameter | δ = | 12
|
| 50-Percentile effective diameter | δ0.5 = | 1.842 12
|
| 90-Percentile effective diameter | δ0.9 = | 3.788 25
|
| Median distance | δM = | 2
|
| Mean distance | δm = | 2.824 83
|
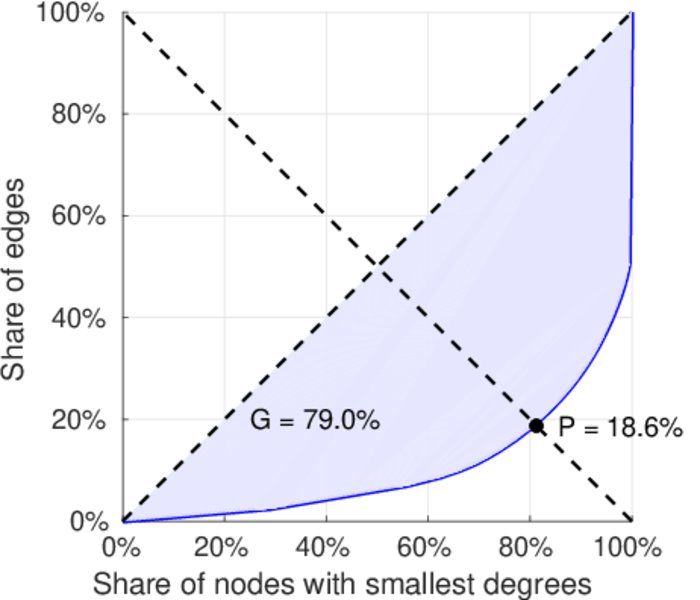
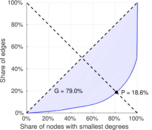
| Gini coefficient | G = | 0.792 654
|
| Balanced inequality ratio | P = | 0.188 672
|
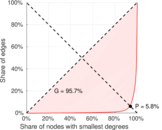
| Left balanced inequality ratio | P1 = | 0.058 326 4
|
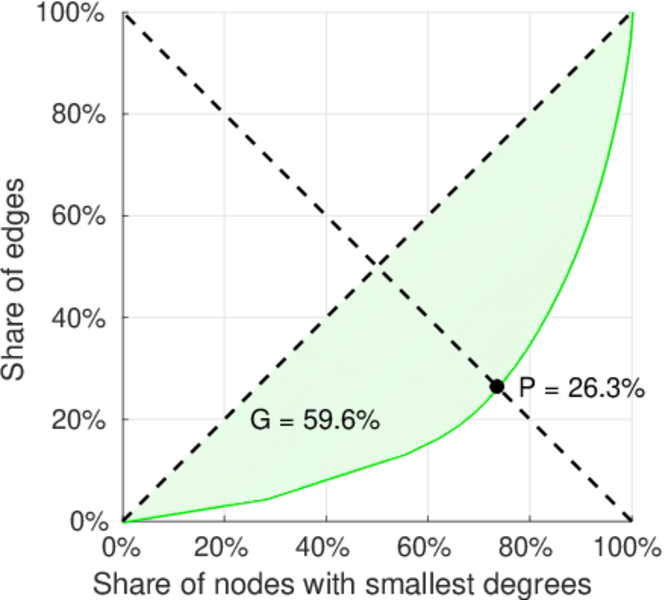
| Right balanced inequality ratio | P2 = | 0.262 960
|
| Relative edge distribution entropy | Her = | 0.731 576
|
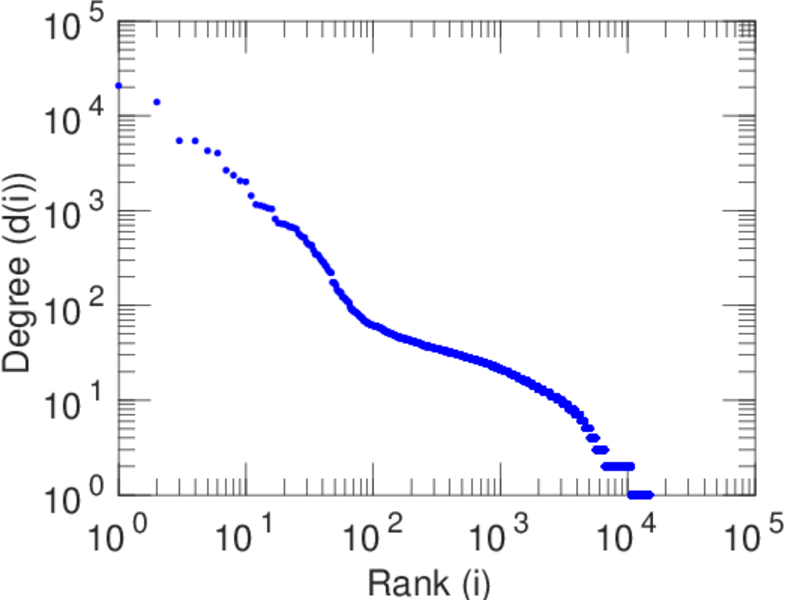
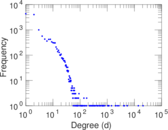
| Power law exponent | γ = | 2.103 94
|
| Tail power law exponent | γt = | 2.861 00
|
| Tail power law exponent with p | γ3 = | 2.861 00
|
| p-value | p = | 0.000 00
|
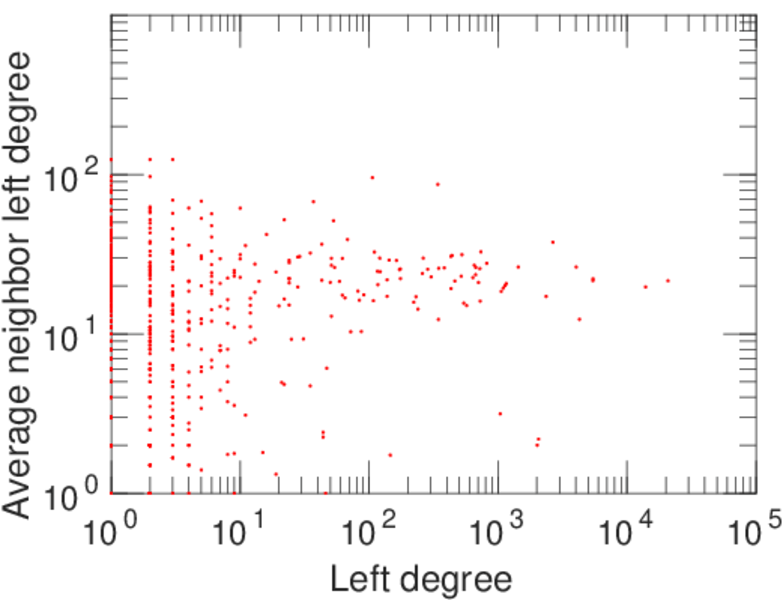
| Left tail power law exponent with p | γ3,1 = | 1.431 00
|
| Left p-value | p1 = | 0.000 00
|
| Right tail power law exponent with p | γ3,2 = | 8.951 00
|
| Right p-value | p2 = | 0.691 000
|
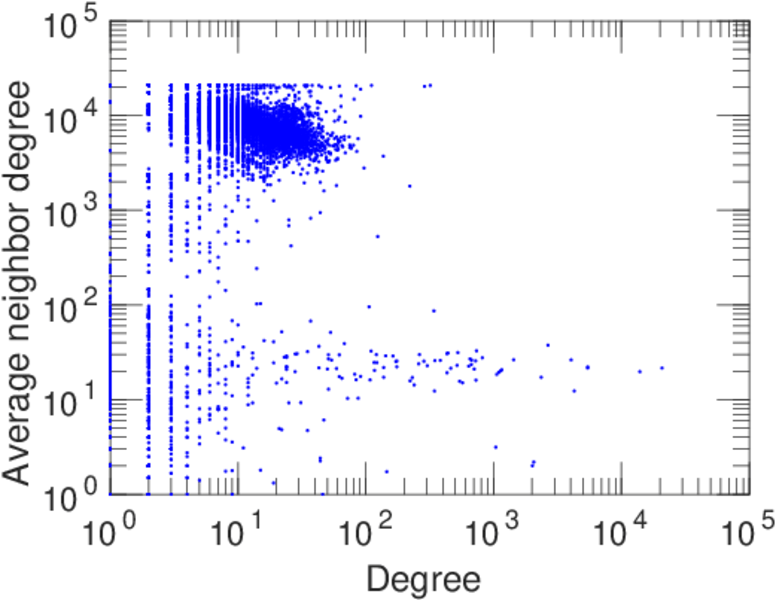
| Degree assortativity | ρ = | −0.381 003
|
| Degree assortativity p-value | pρ = | 0.000 00
|
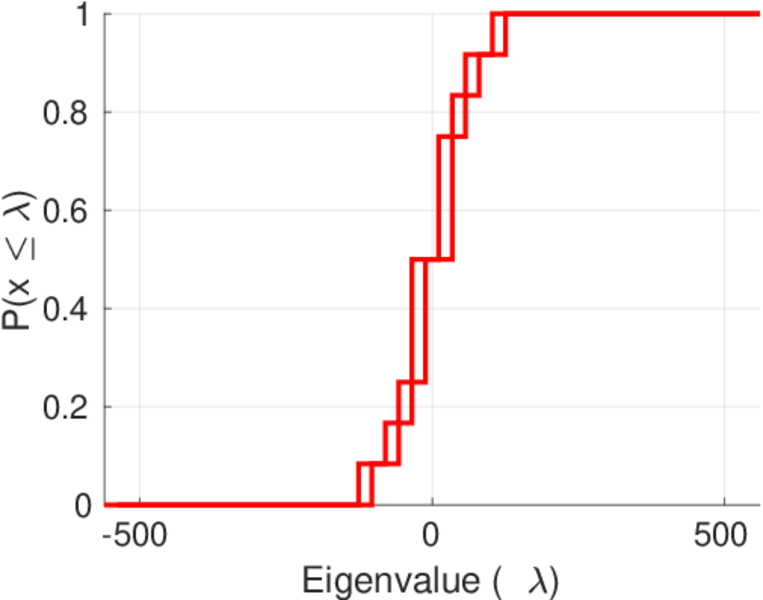
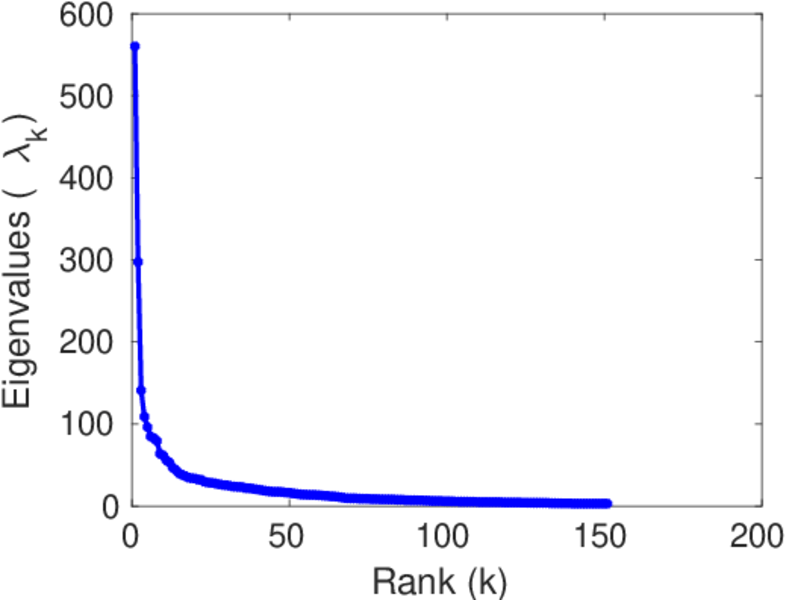
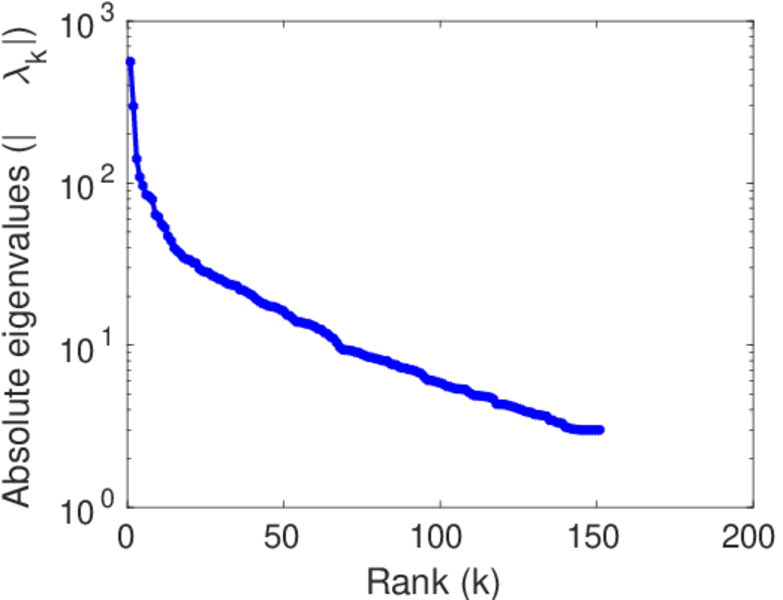
| Spectral norm | α = | 560.306
|
| Algebraic connectivity | a = | 0.019 050 3
|
| Spectral separation | |λ1[A] / λ2[A]| = | 1.883 47
|
| Controllability | C = | 13,753
|
| Relative controllability | Cr = | 0.919 872
|
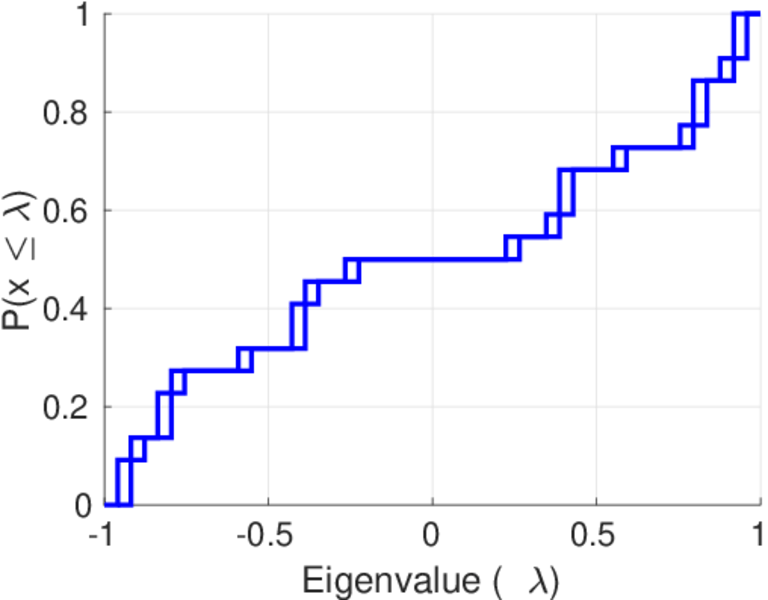
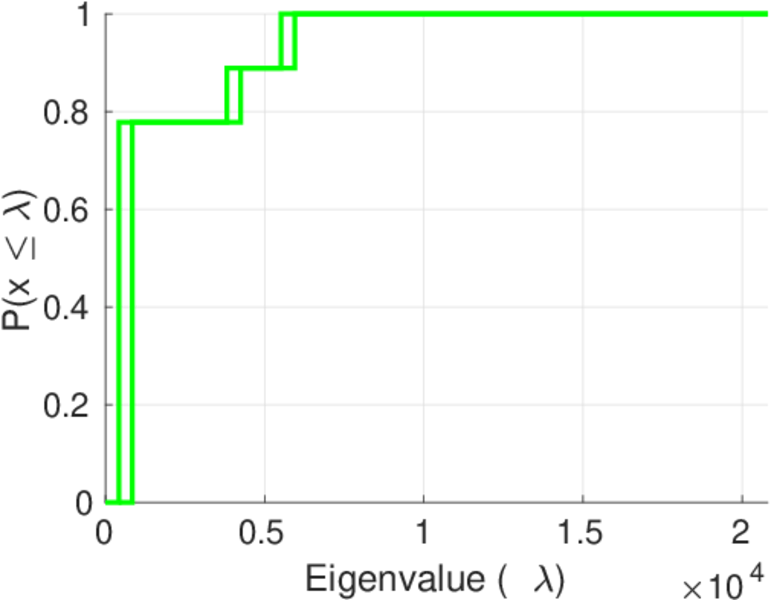
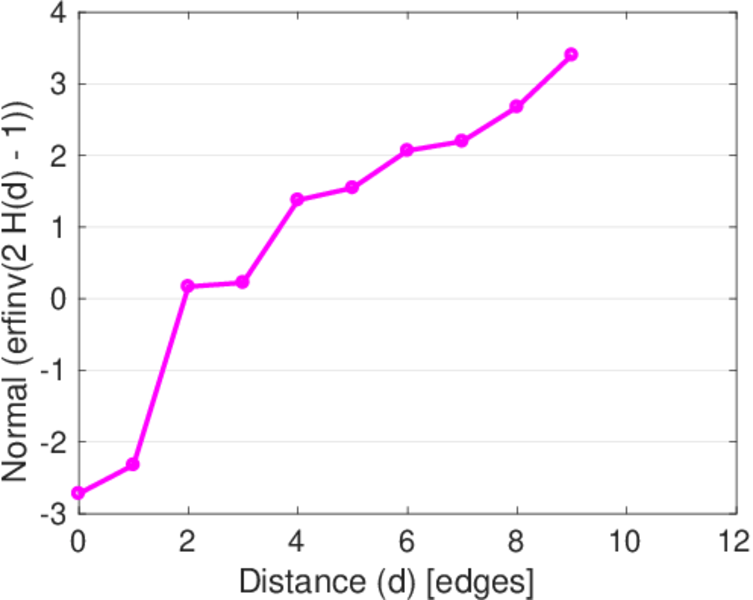
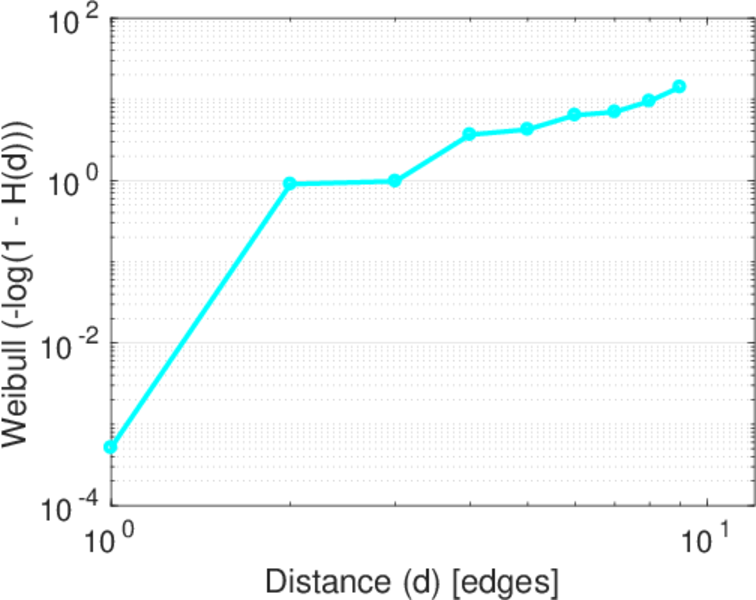
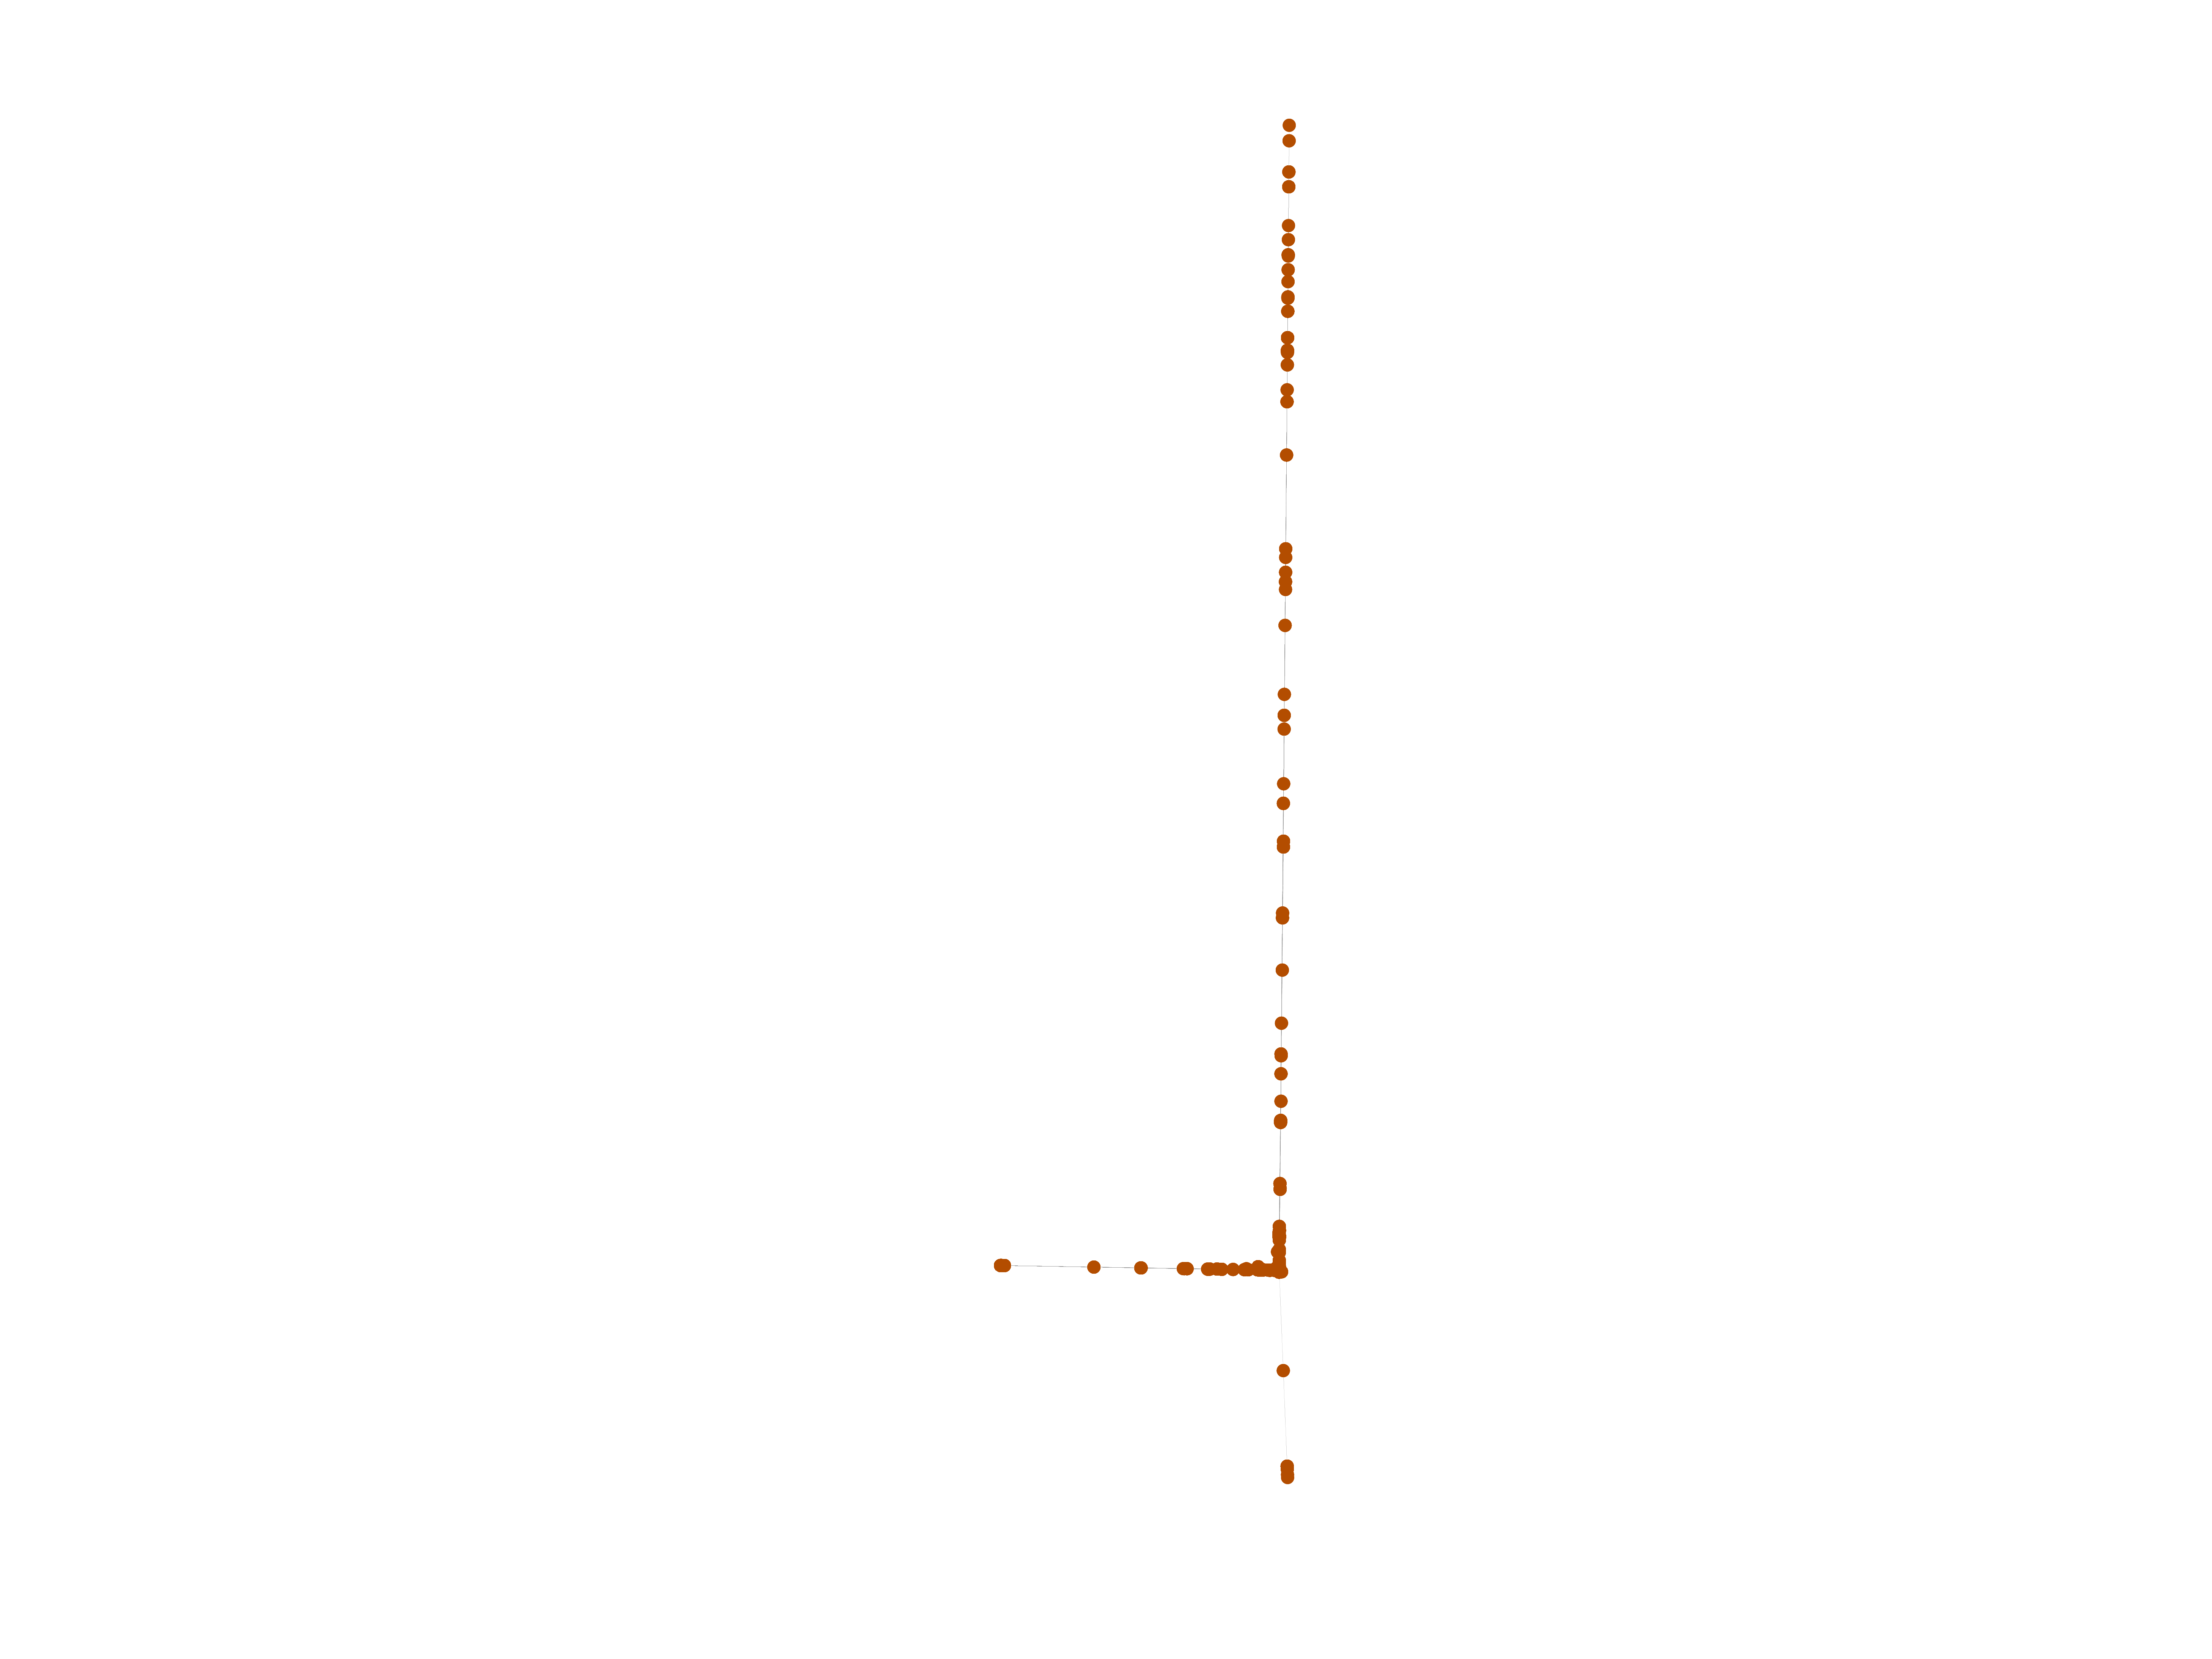
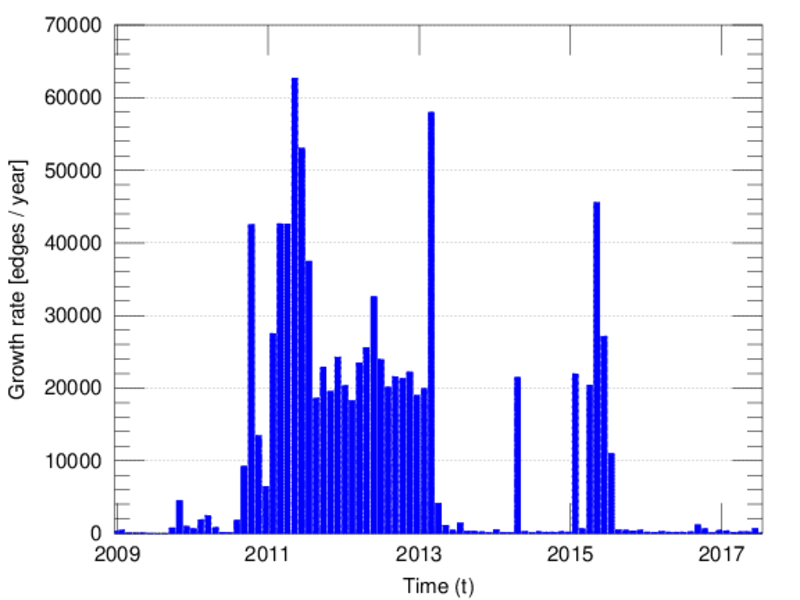
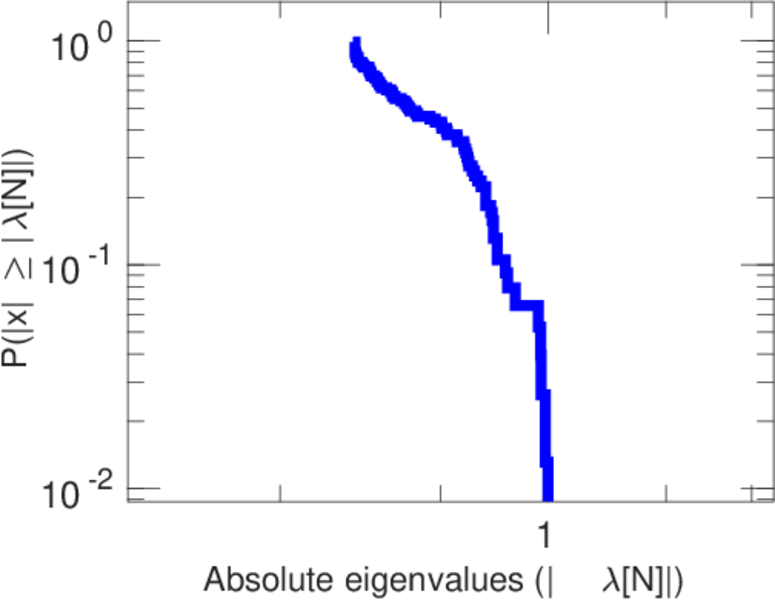
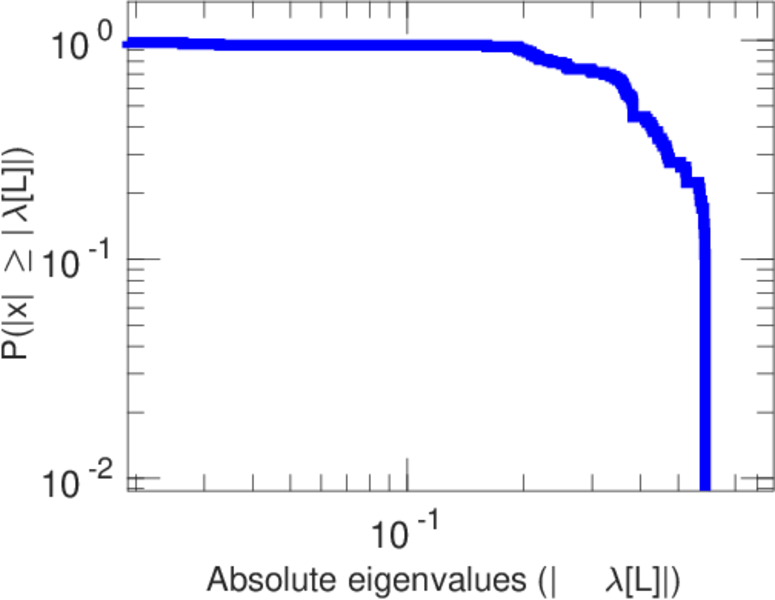
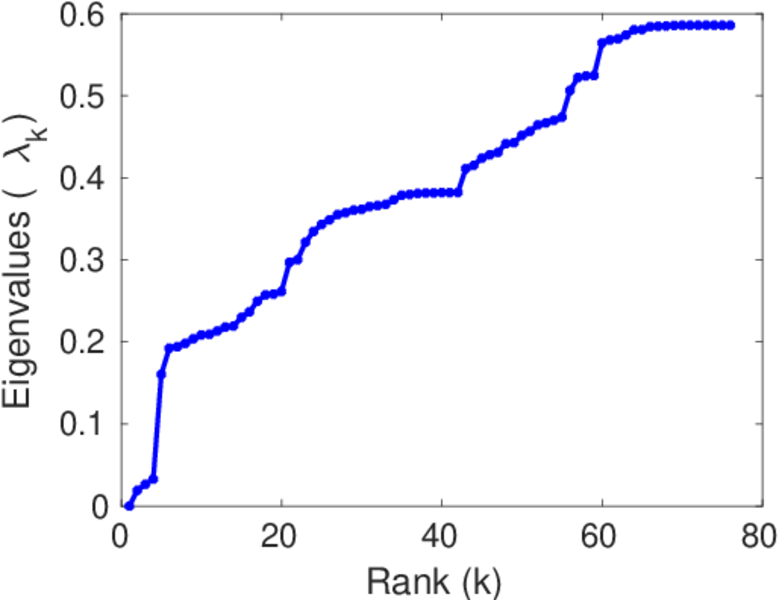
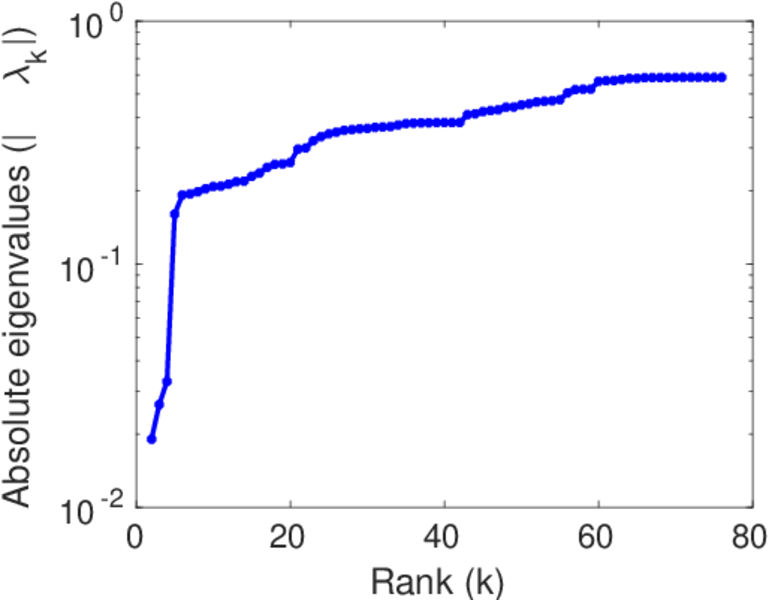
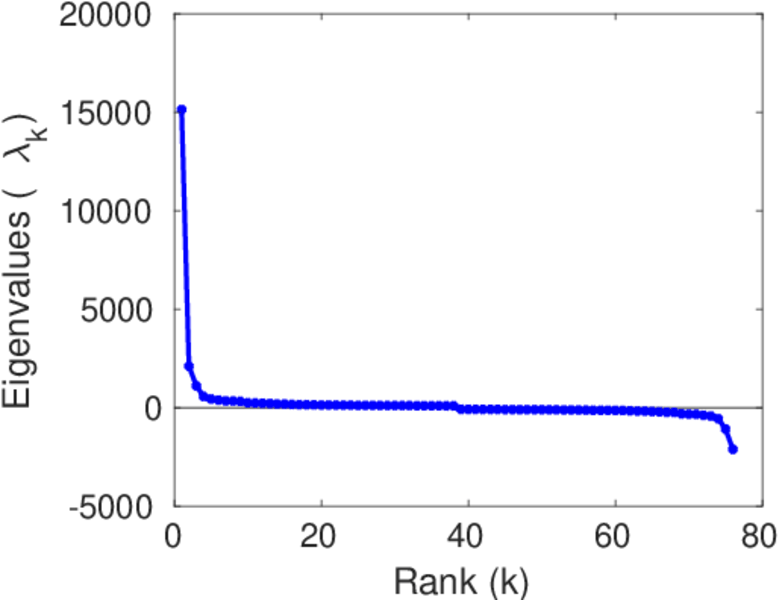
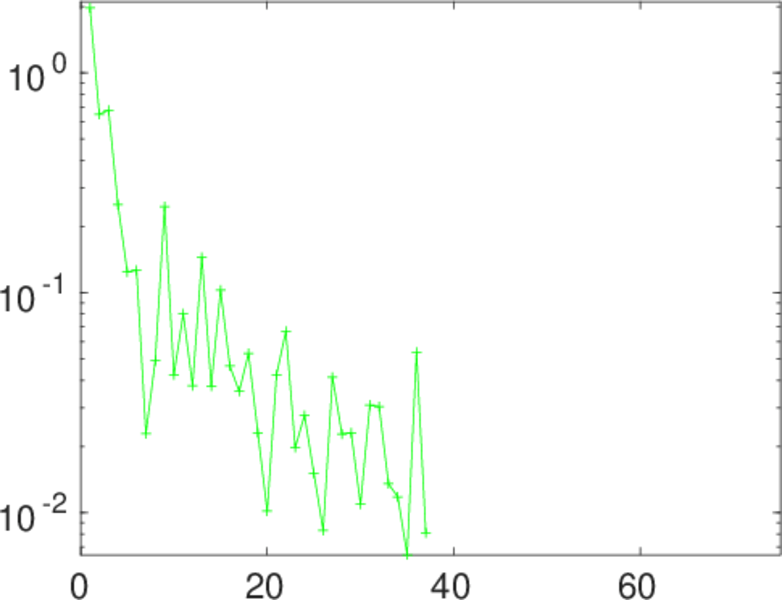
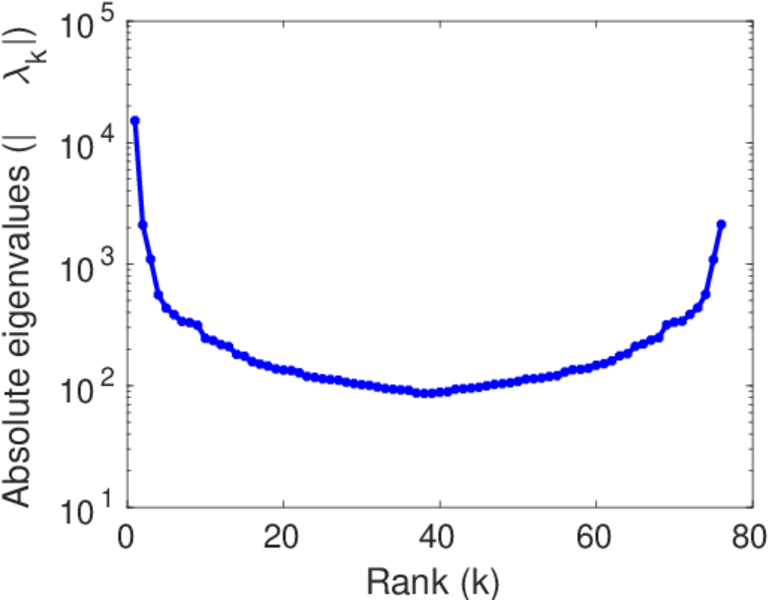
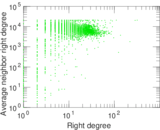
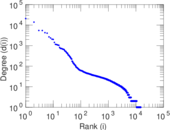
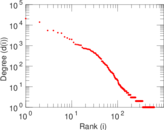
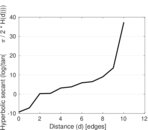
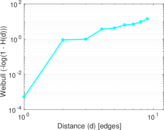
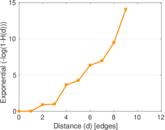
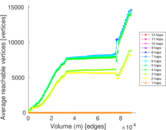
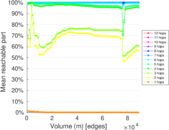
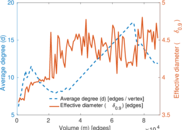
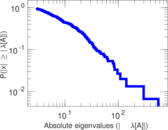
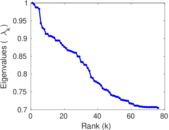
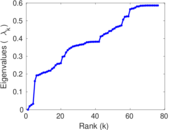
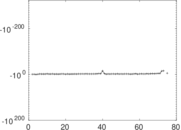
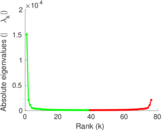
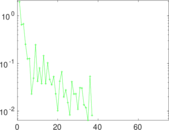
Plots


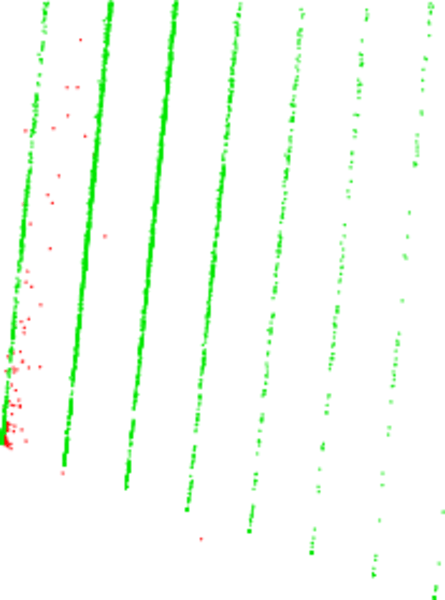
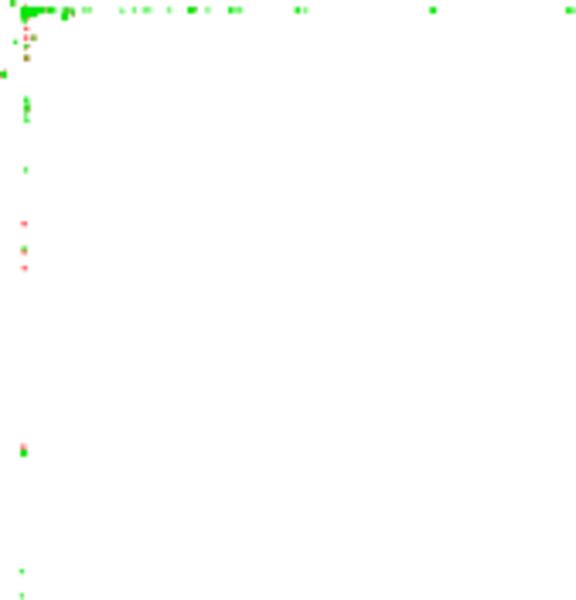
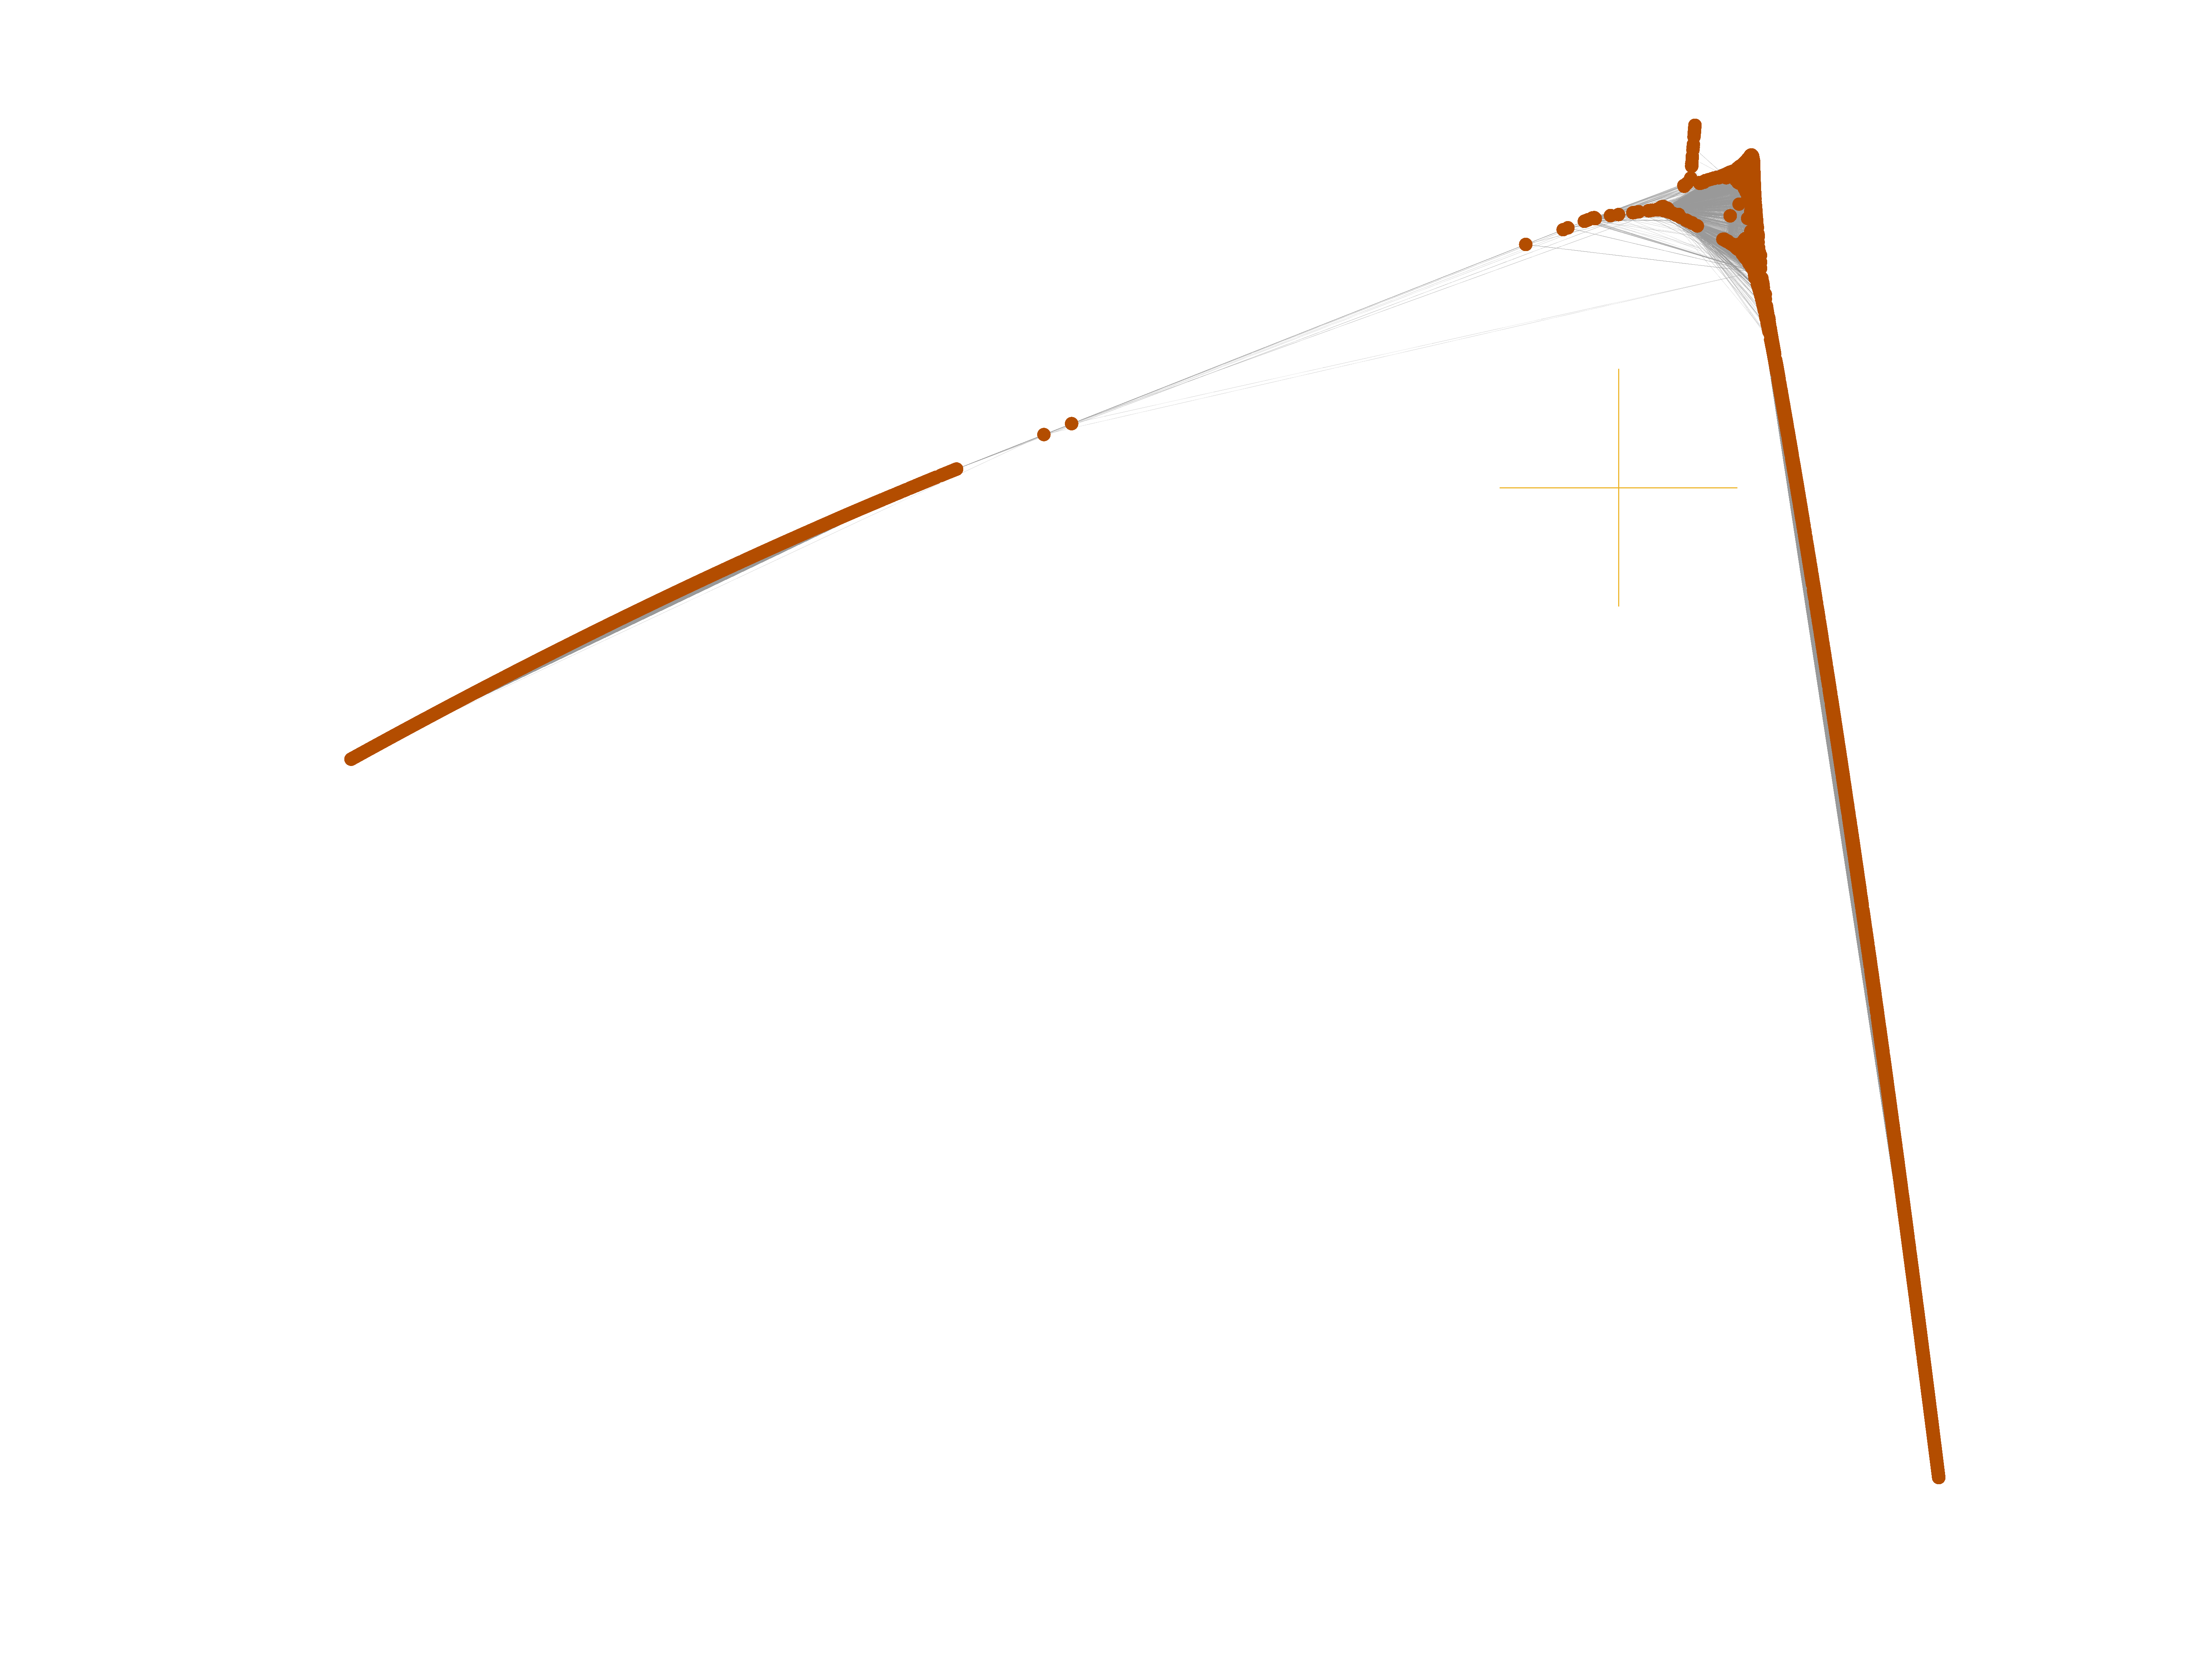
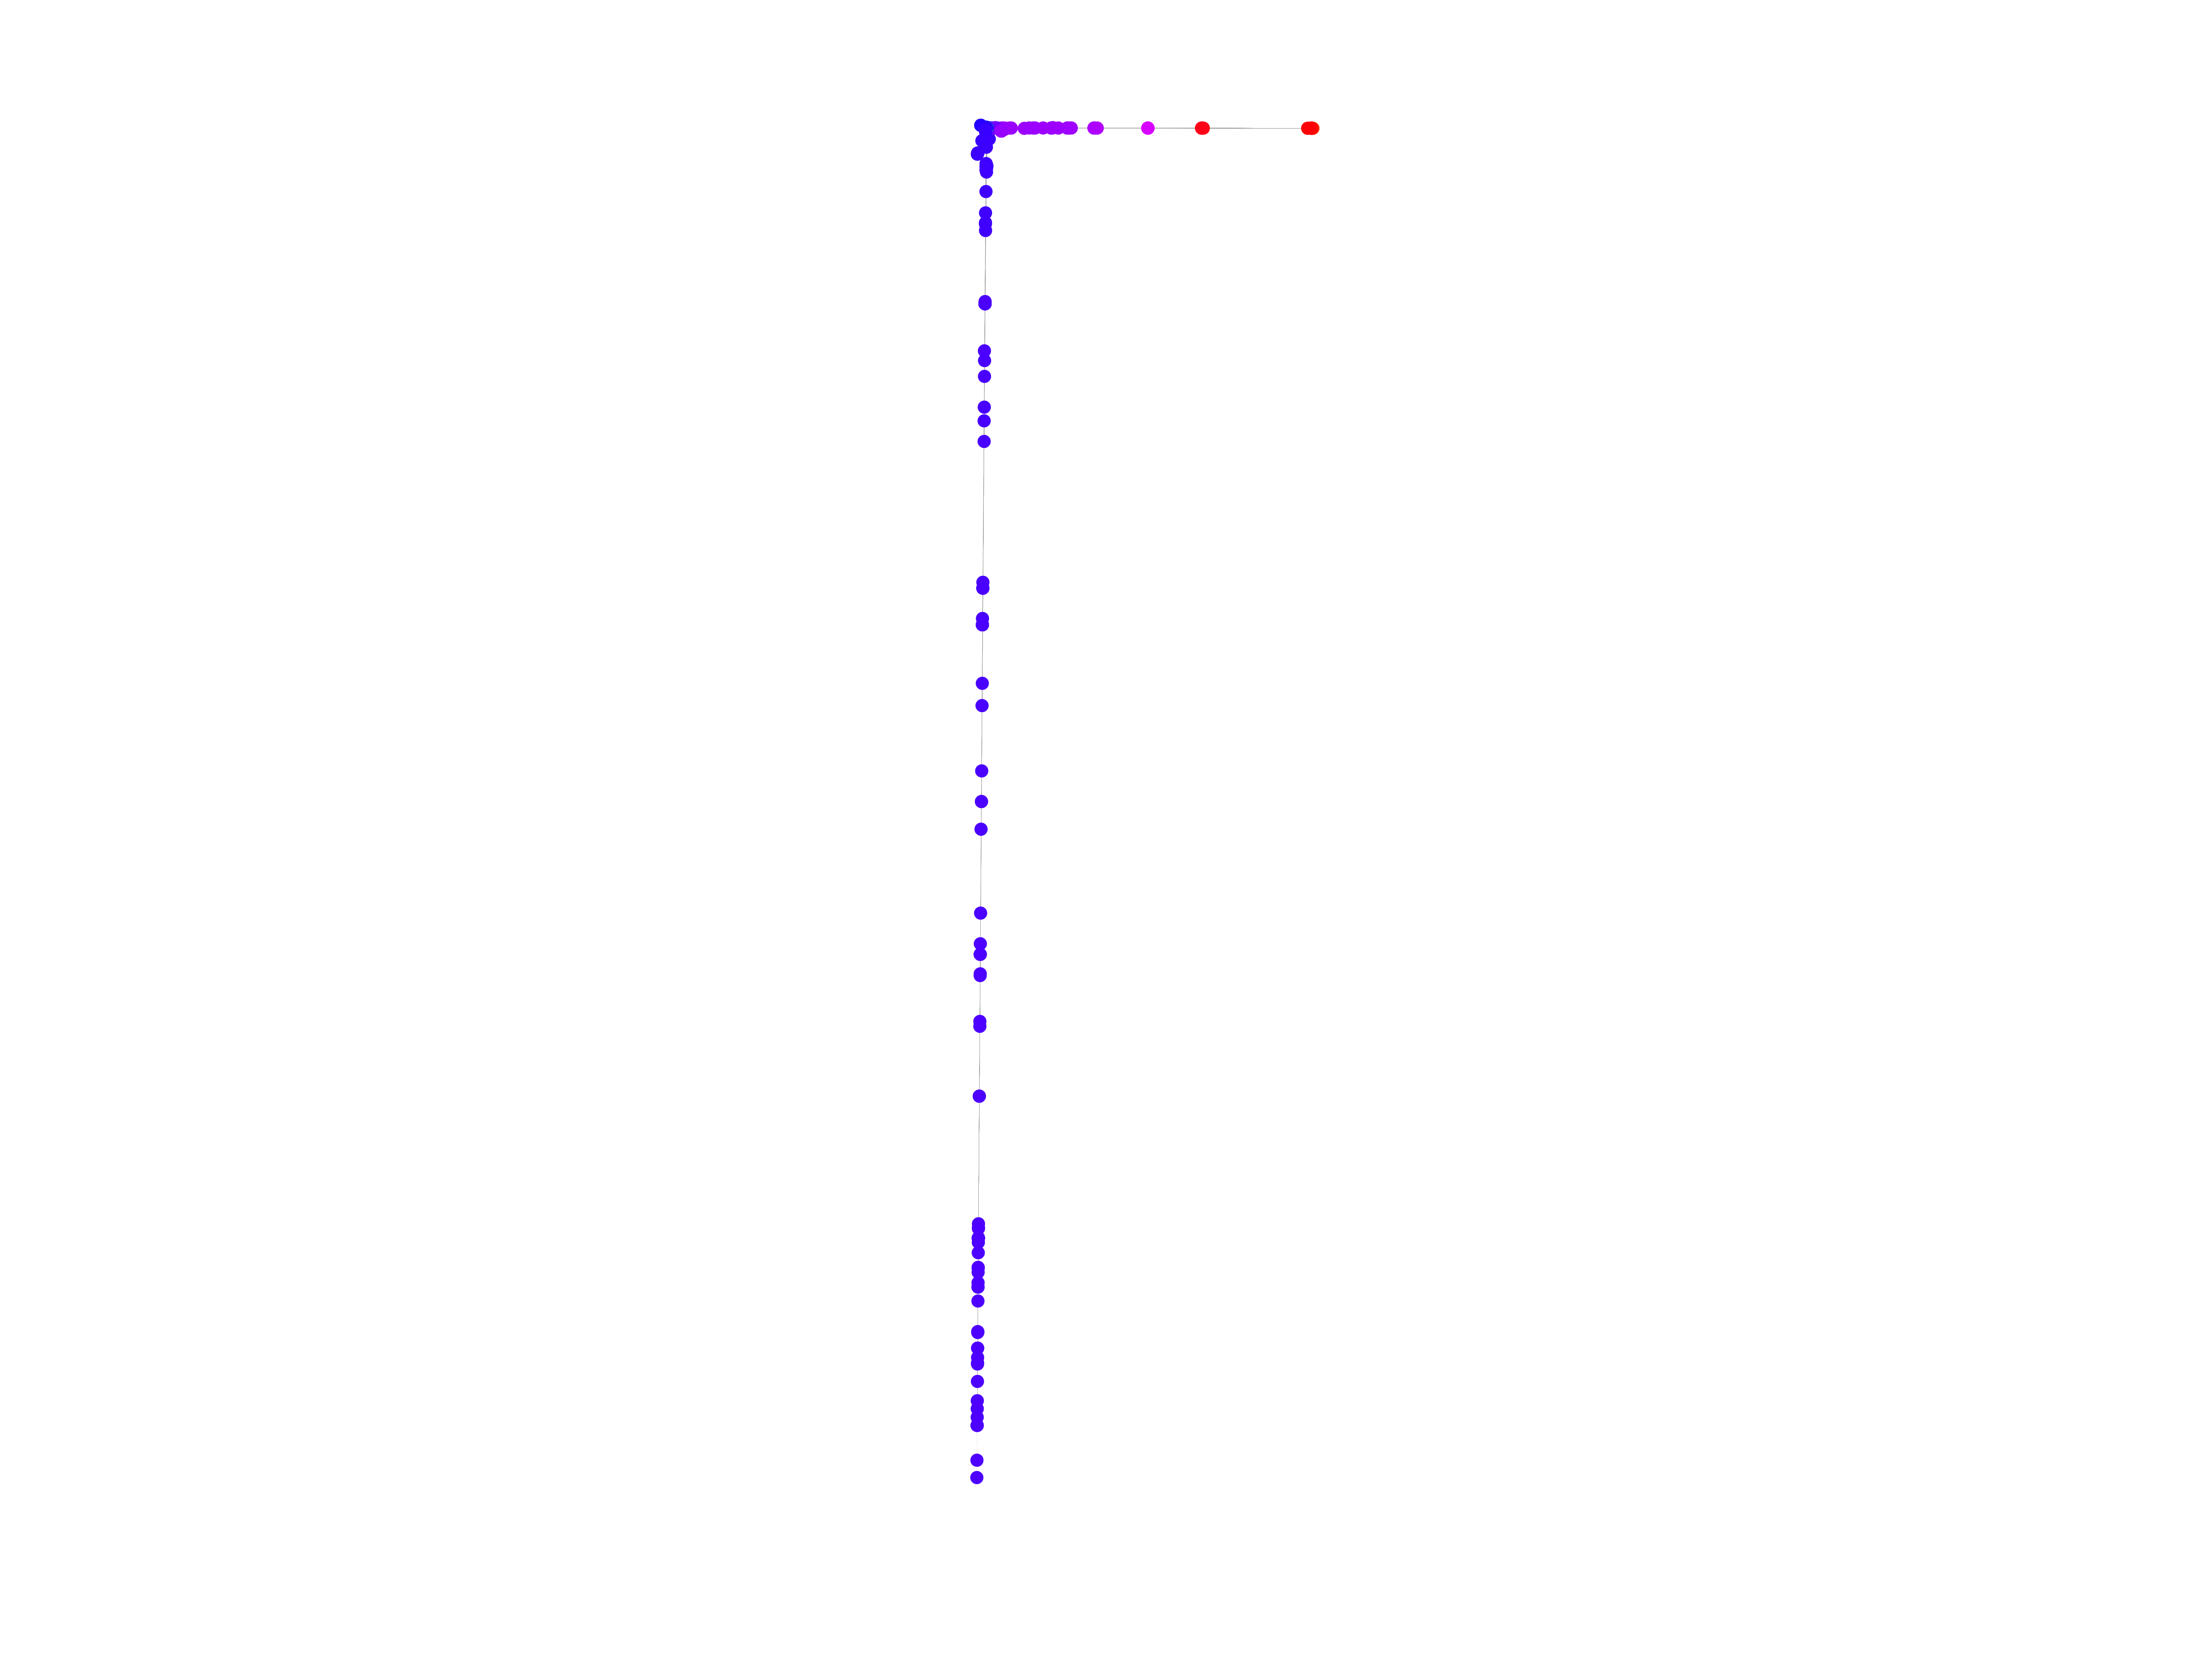
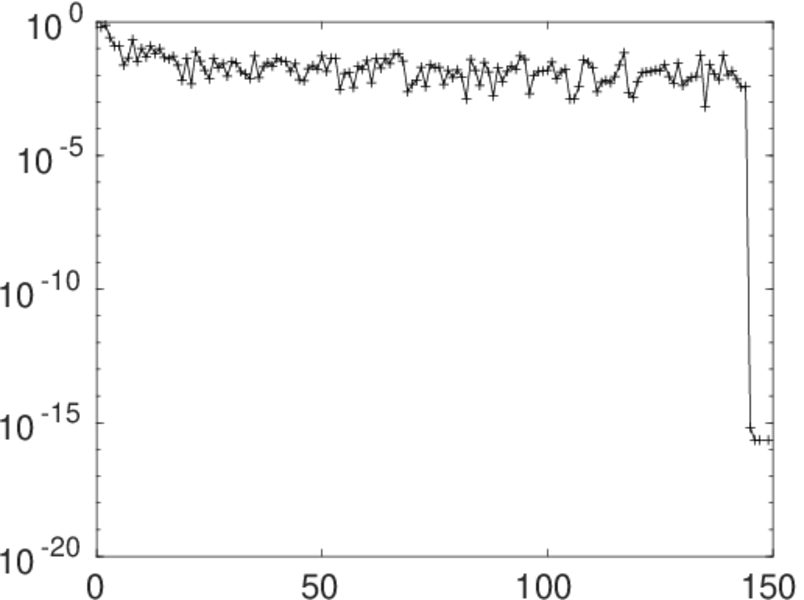
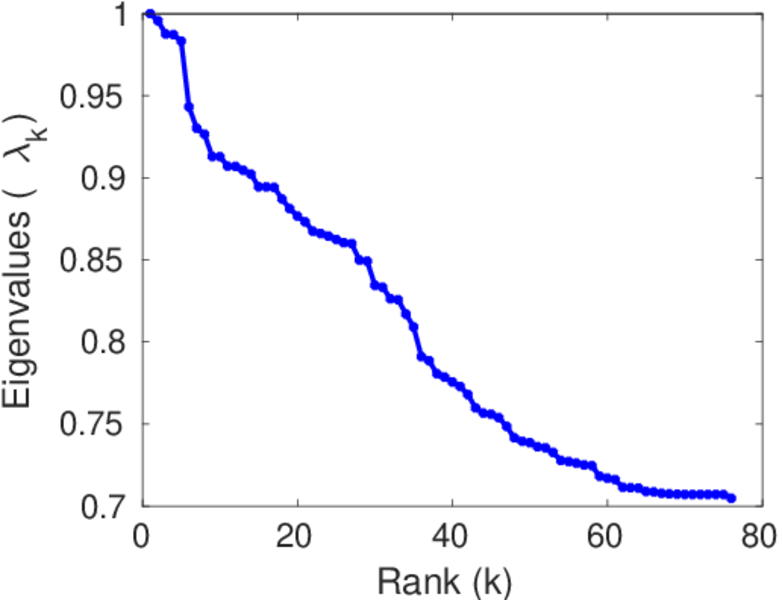
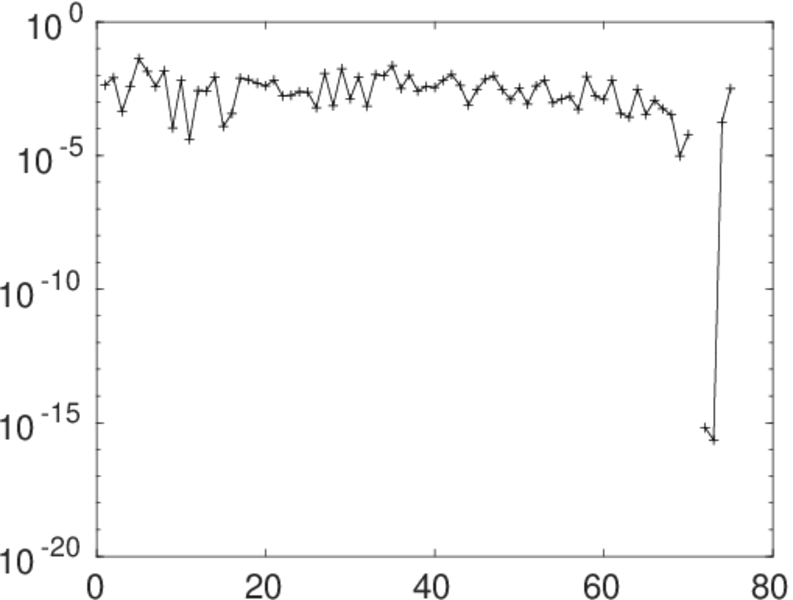
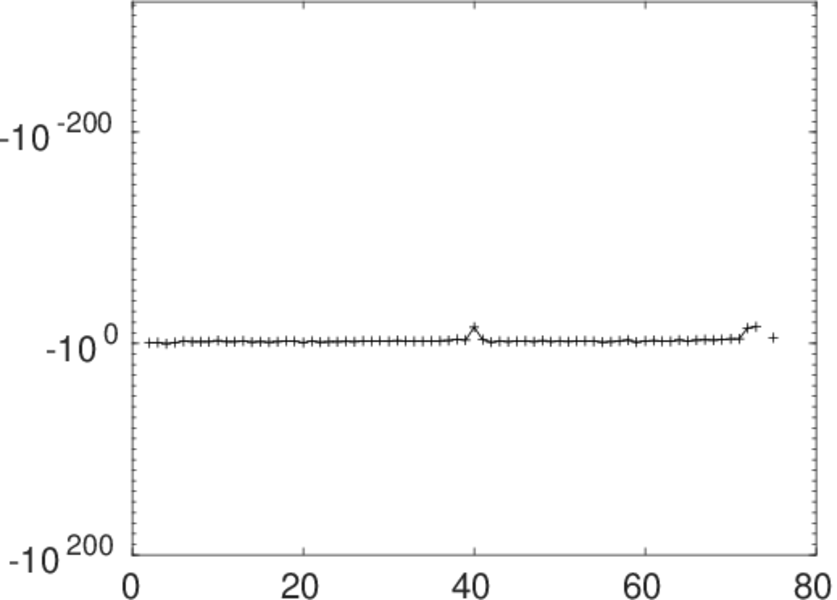
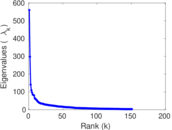
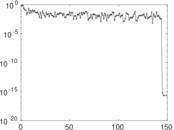
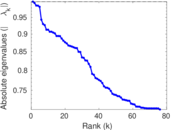
Matrix decompositions plots


Downloads
References
|
[1]
|
Jérôme Kunegis.
KONECT – The Koblenz Network Collection.
In Proc. Int. Conf. on World Wide Web Companion, pages
1343–1350, 2013.
[ http ]
|
|
[2]
|
Wikimedia Foundation.
Wikimedia downloads.
http://dumps.wikimedia.org/, January 2010.
|
 KONECT ‣ Networks ‣
Buy Me a Coffee
KONECT ‣ Networks ‣
Buy Me a Coffee