Wikipedia edits (mr)
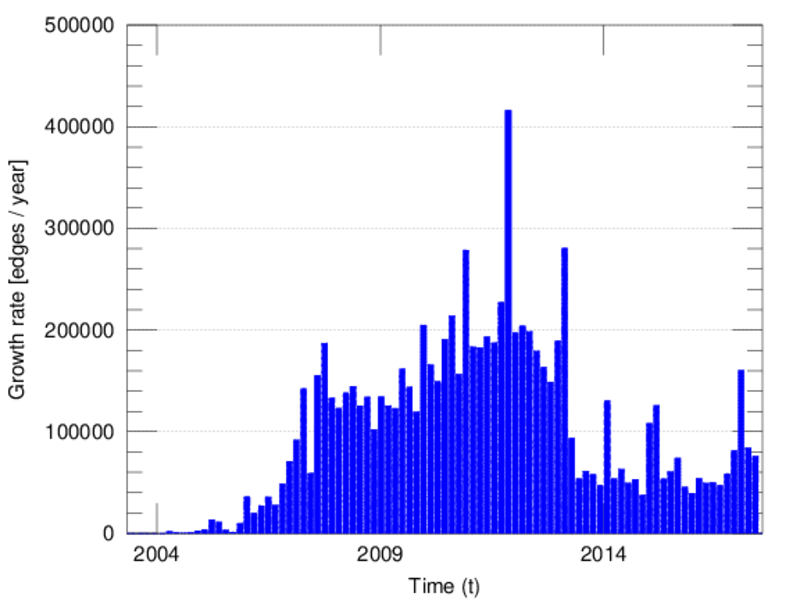
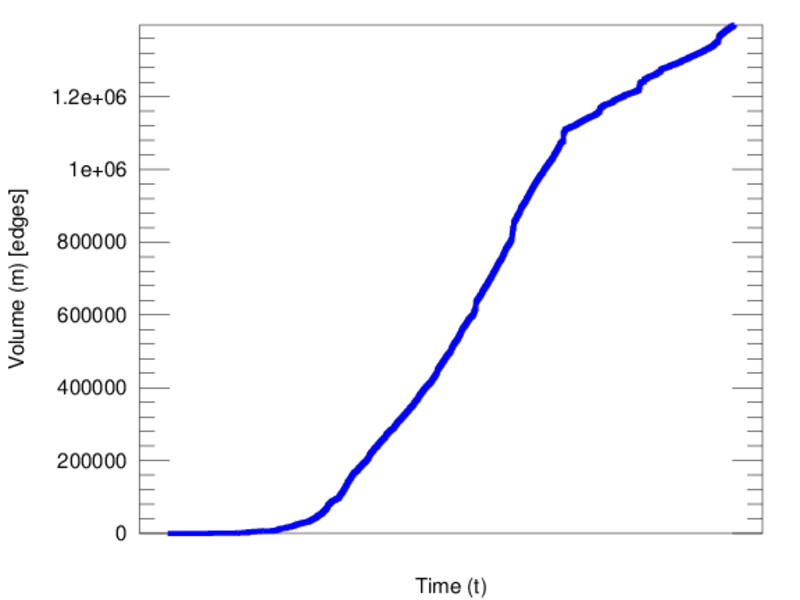
This is the bipartite edit network of the Marathi Wikipedia. It contains users
and pages from the Marathi Wikipedia, connected by edit events. Each edge
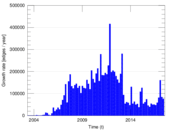
represents an edit. The dataset includes the timestamp of each edit.
Metadata
Statistics
| Size | n = | 206,373
|
| Left size | n1 = | 8,866
|
| Right size | n2 = | 197,507
|
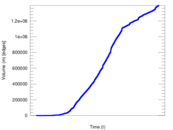
| Volume | m = | 1,396,816
|
| Unique edge count | m̿ = | 697,834
|
| Wedge count | s = | 5,621,076,574
|
| Claw count | z = | 65,572,735,005,363
|
| Square count | q = | 5,557,714,531
|
| 4-Tour count | T4 = | 66,947,733,868
|
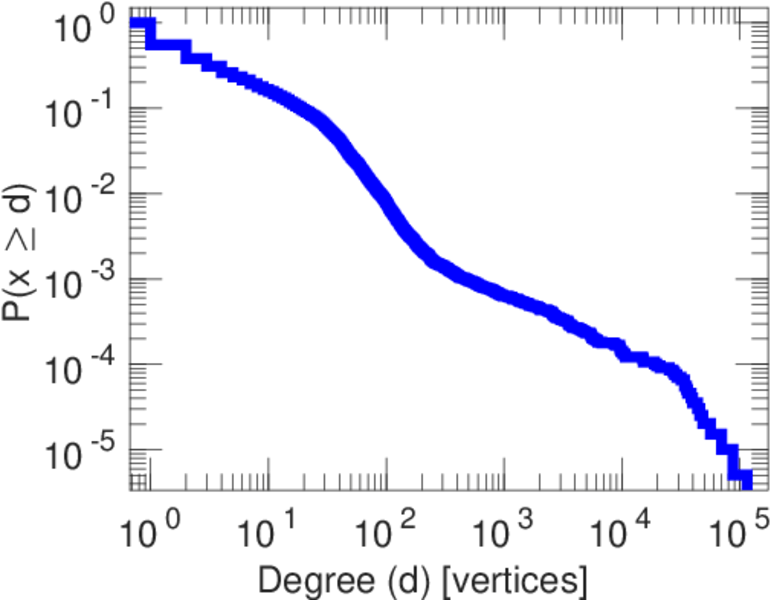
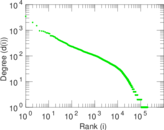
| Maximum degree | dmax = | 115,105
|
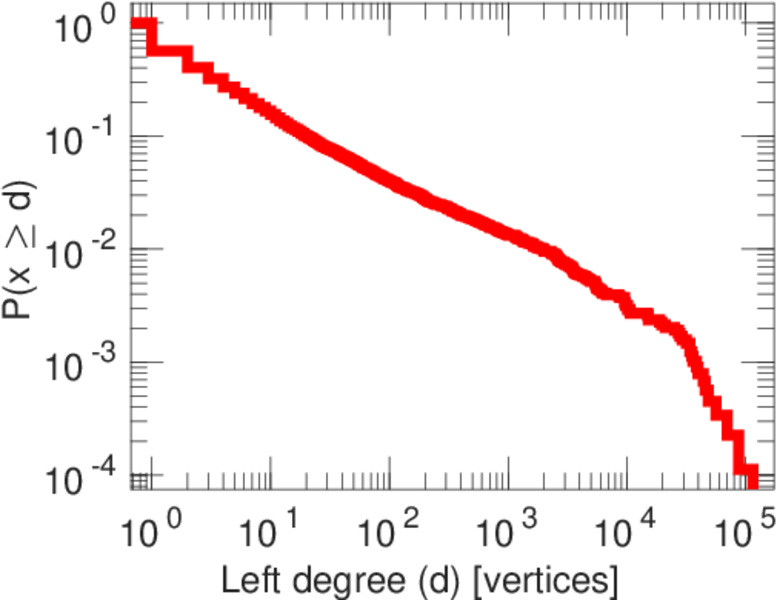
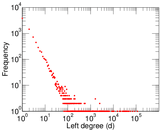
| Maximum left degree | d1max = | 115,105
|
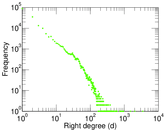
| Maximum right degree | d2max = | 3,479
|
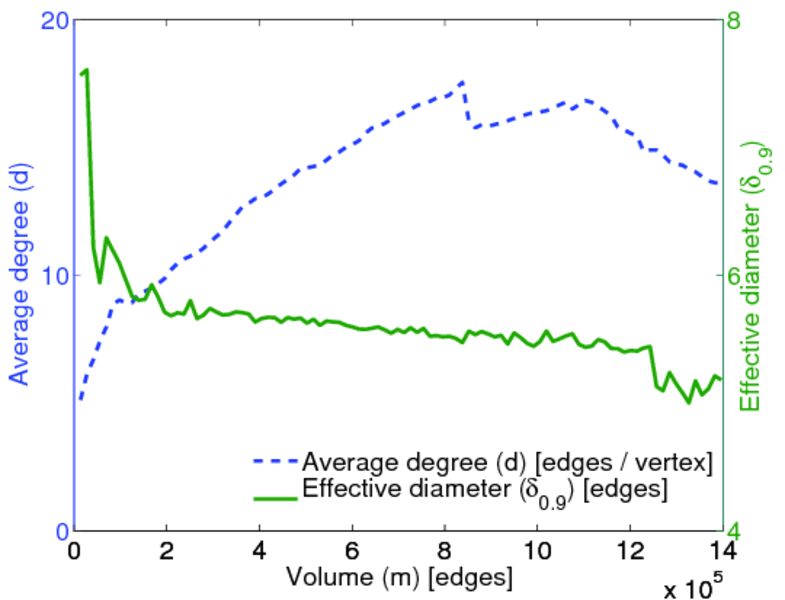
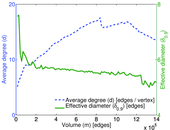
| Average degree | d = | 13.536 8
|
| Average left degree | d1 = | 157.547
|
| Average right degree | d2 = | 7.072 24
|
| Fill | p = | 0.000 398 512
|
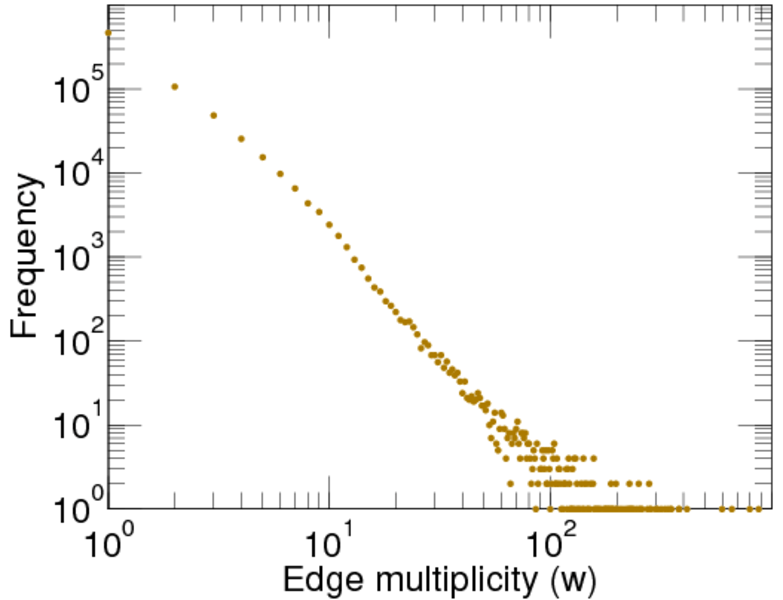
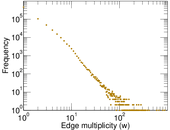
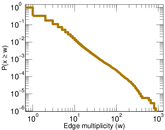
| Average edge multiplicity | m̃ = | 2.001 65
|
| Size of LCC | N = | 203,834
|
| Diameter | δ = | 11
|
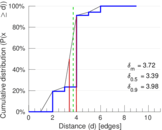
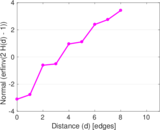
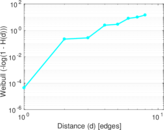
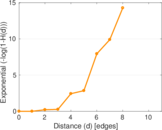
| 50-Percentile effective diameter | δ0.5 = | 3.391 98
|
| 90-Percentile effective diameter | δ0.9 = | 3.982 39
|
| Median distance | δM = | 4
|
| Mean distance | δm = | 3.717 96
|
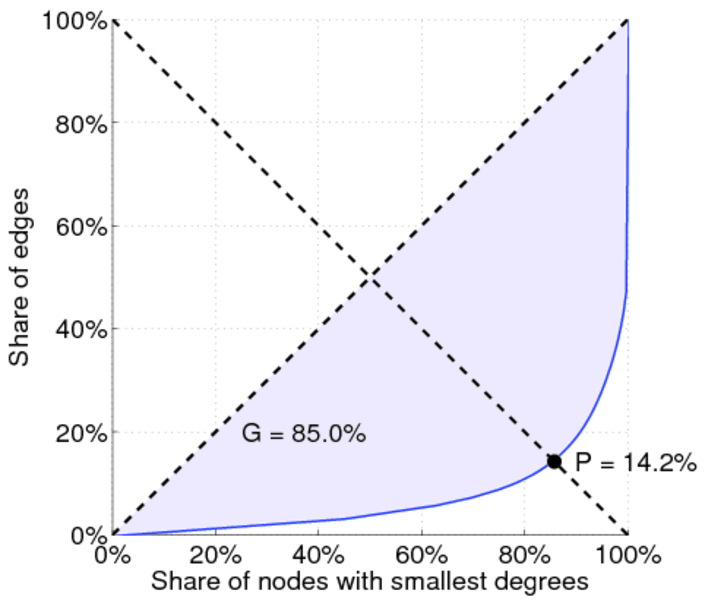
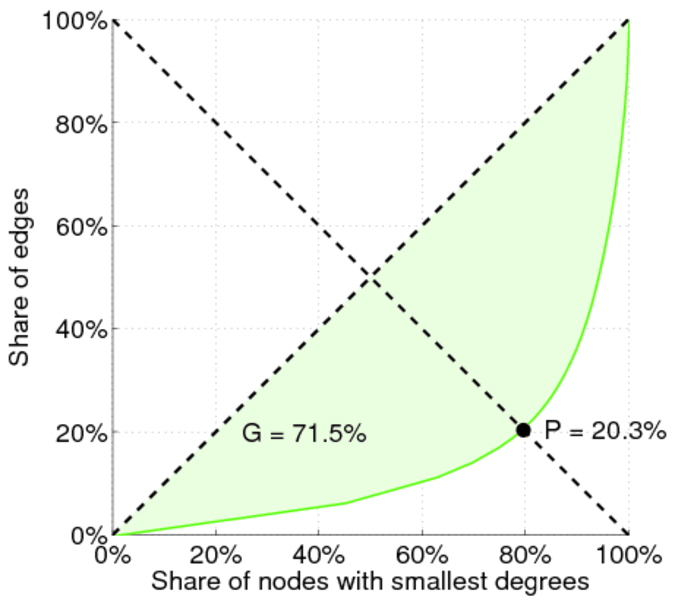
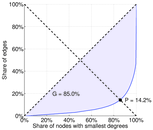
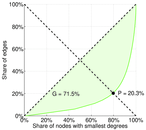
| Gini coefficient | G = | 0.853 281
|
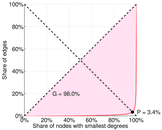
| Balanced inequality ratio | P = | 0.144 238
|
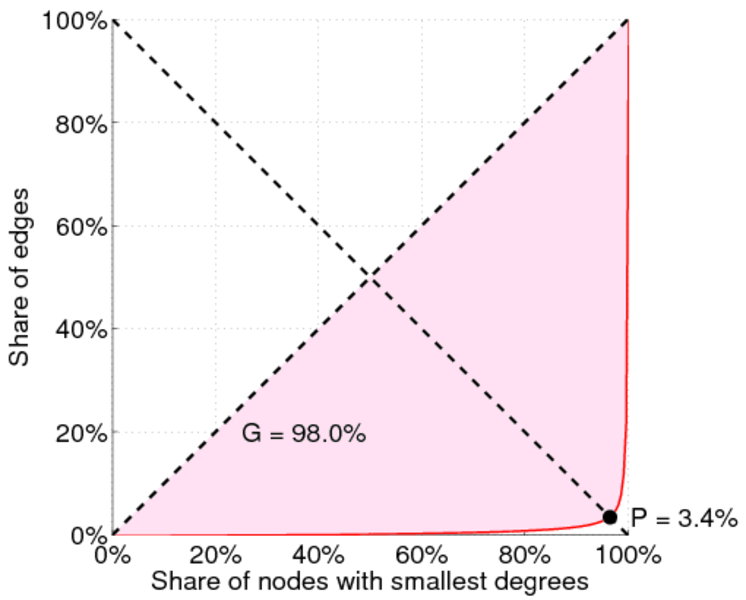
| Left balanced inequality ratio | P1 = | 0.034 494 2
|
| Right balanced inequality ratio | P2 = | 0.203 306
|
| Relative edge distribution entropy | Her = | 0.719 089
|
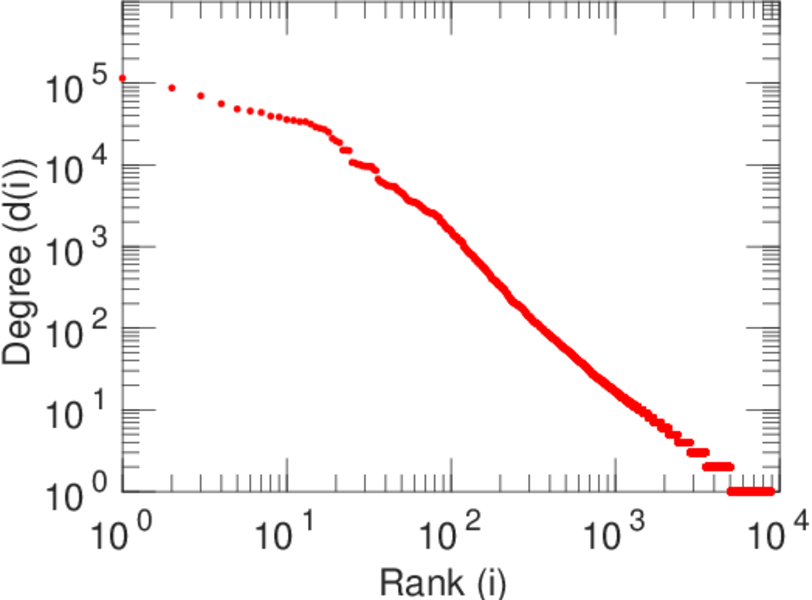
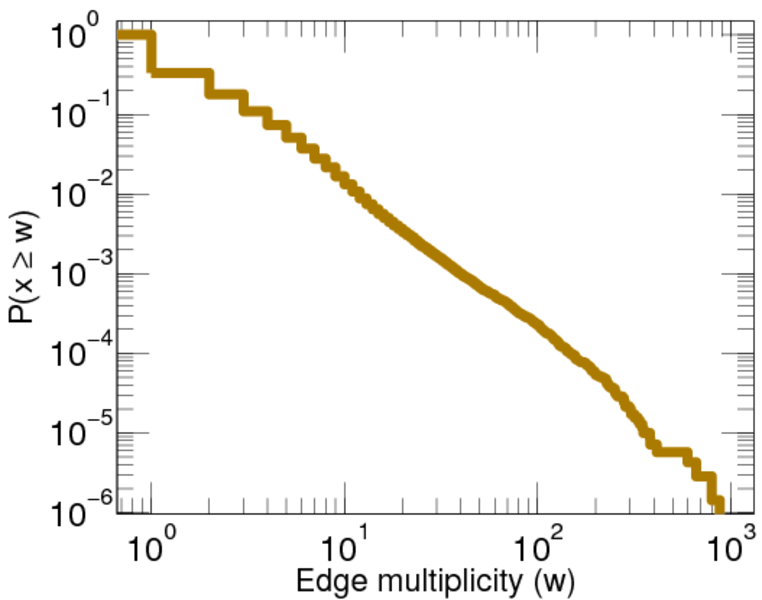
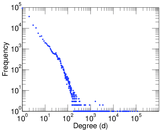
| Power law exponent | γ = | 2.406 59
|
| Tail power law exponent | γt = | 2.031 00
|
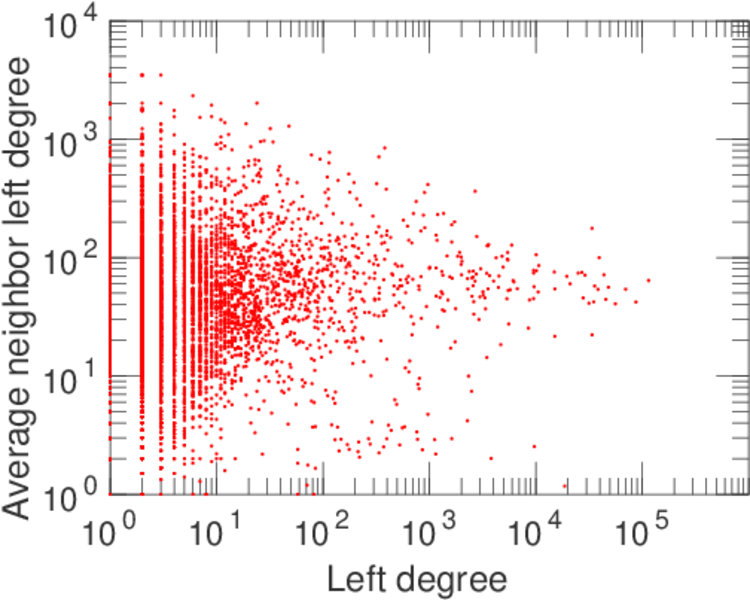
| Degree assortativity | ρ = | −0.209 179
|
| Degree assortativity p-value | pρ = | 0.000 00
|
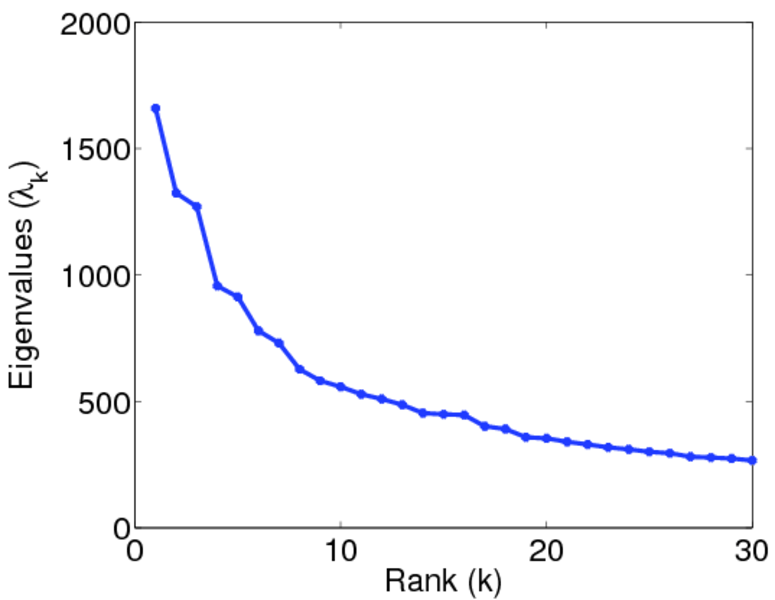
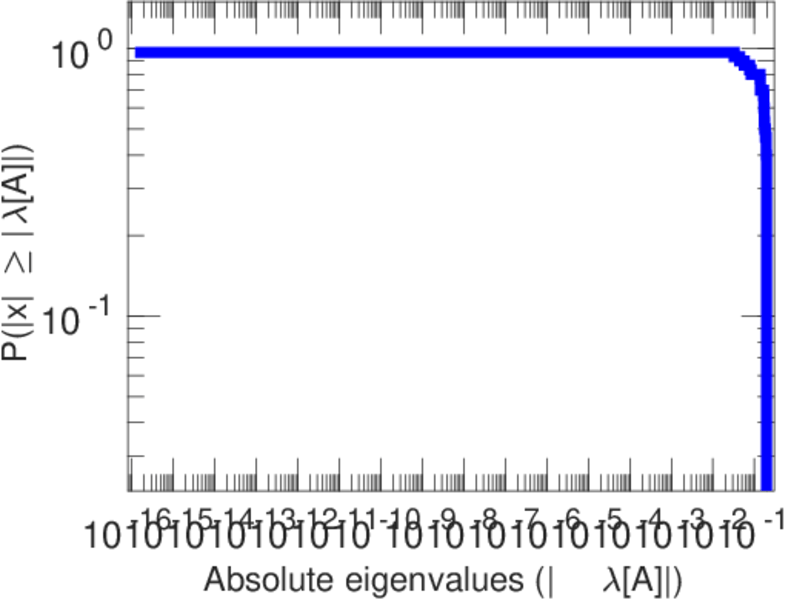
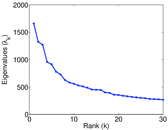
| Spectral norm | α = | 1,659.56
|
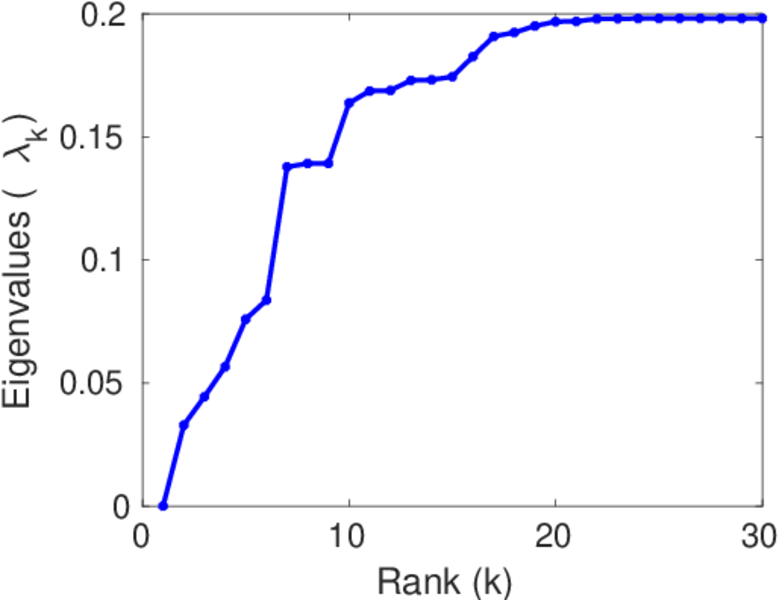
| Algebraic connectivity | a = | 0.032 849 1
|
| Spectral separation | |λ1[A] / λ2[A]| = | 1.253 44
|
| Controllability | C = | 191,886
|
| Relative controllability | Cr = | 0.932 753
|
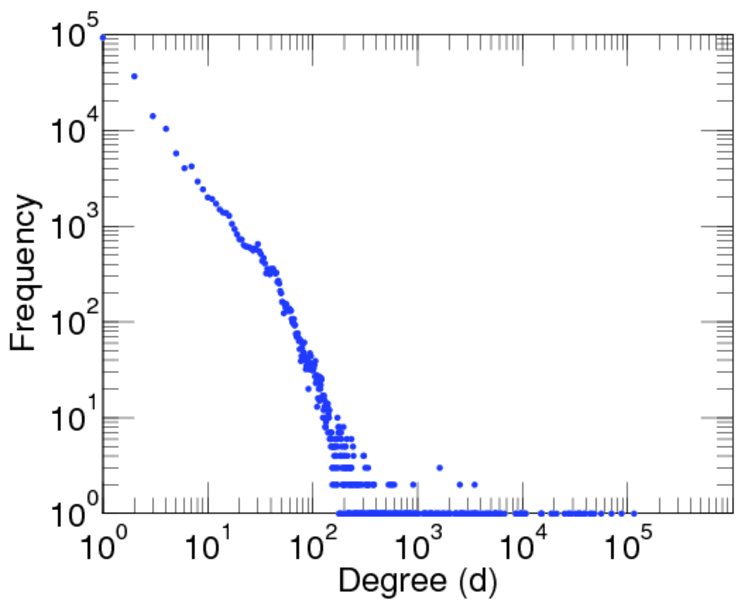
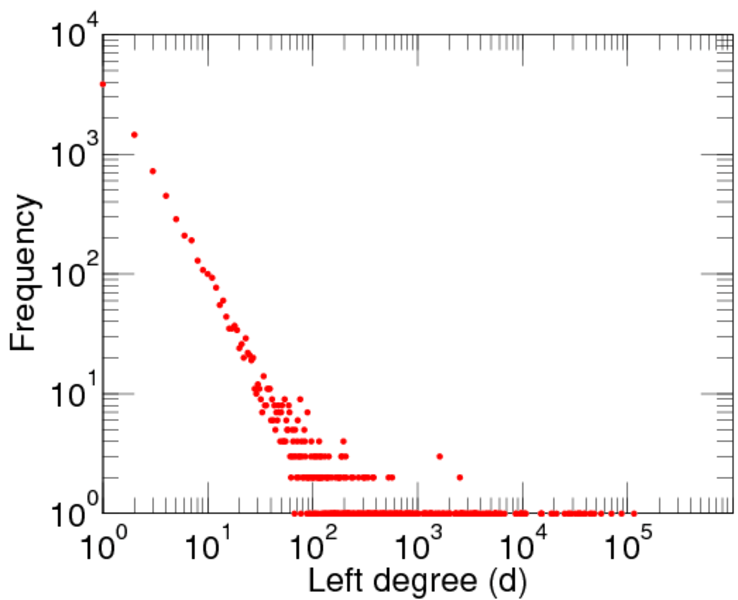
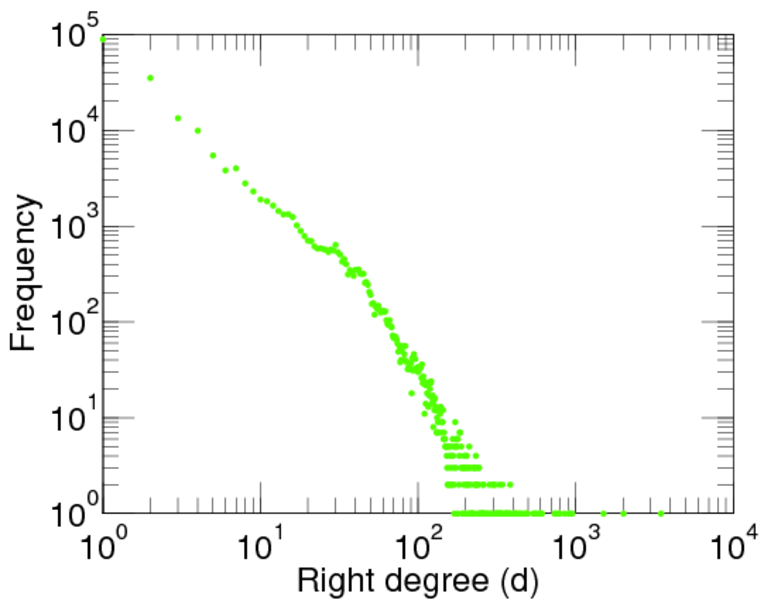
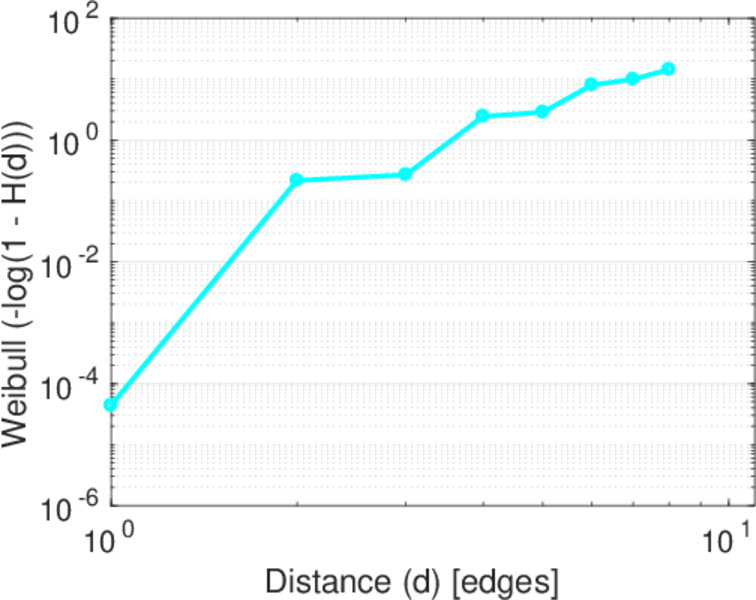
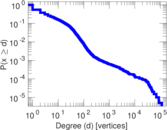
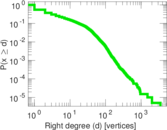
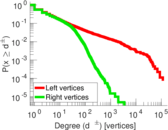
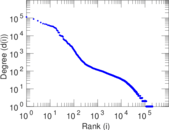
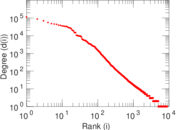
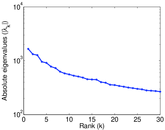
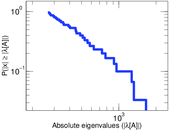
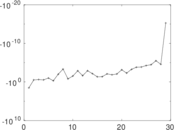
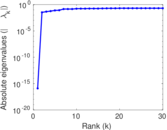
Plots


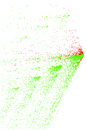

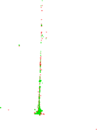


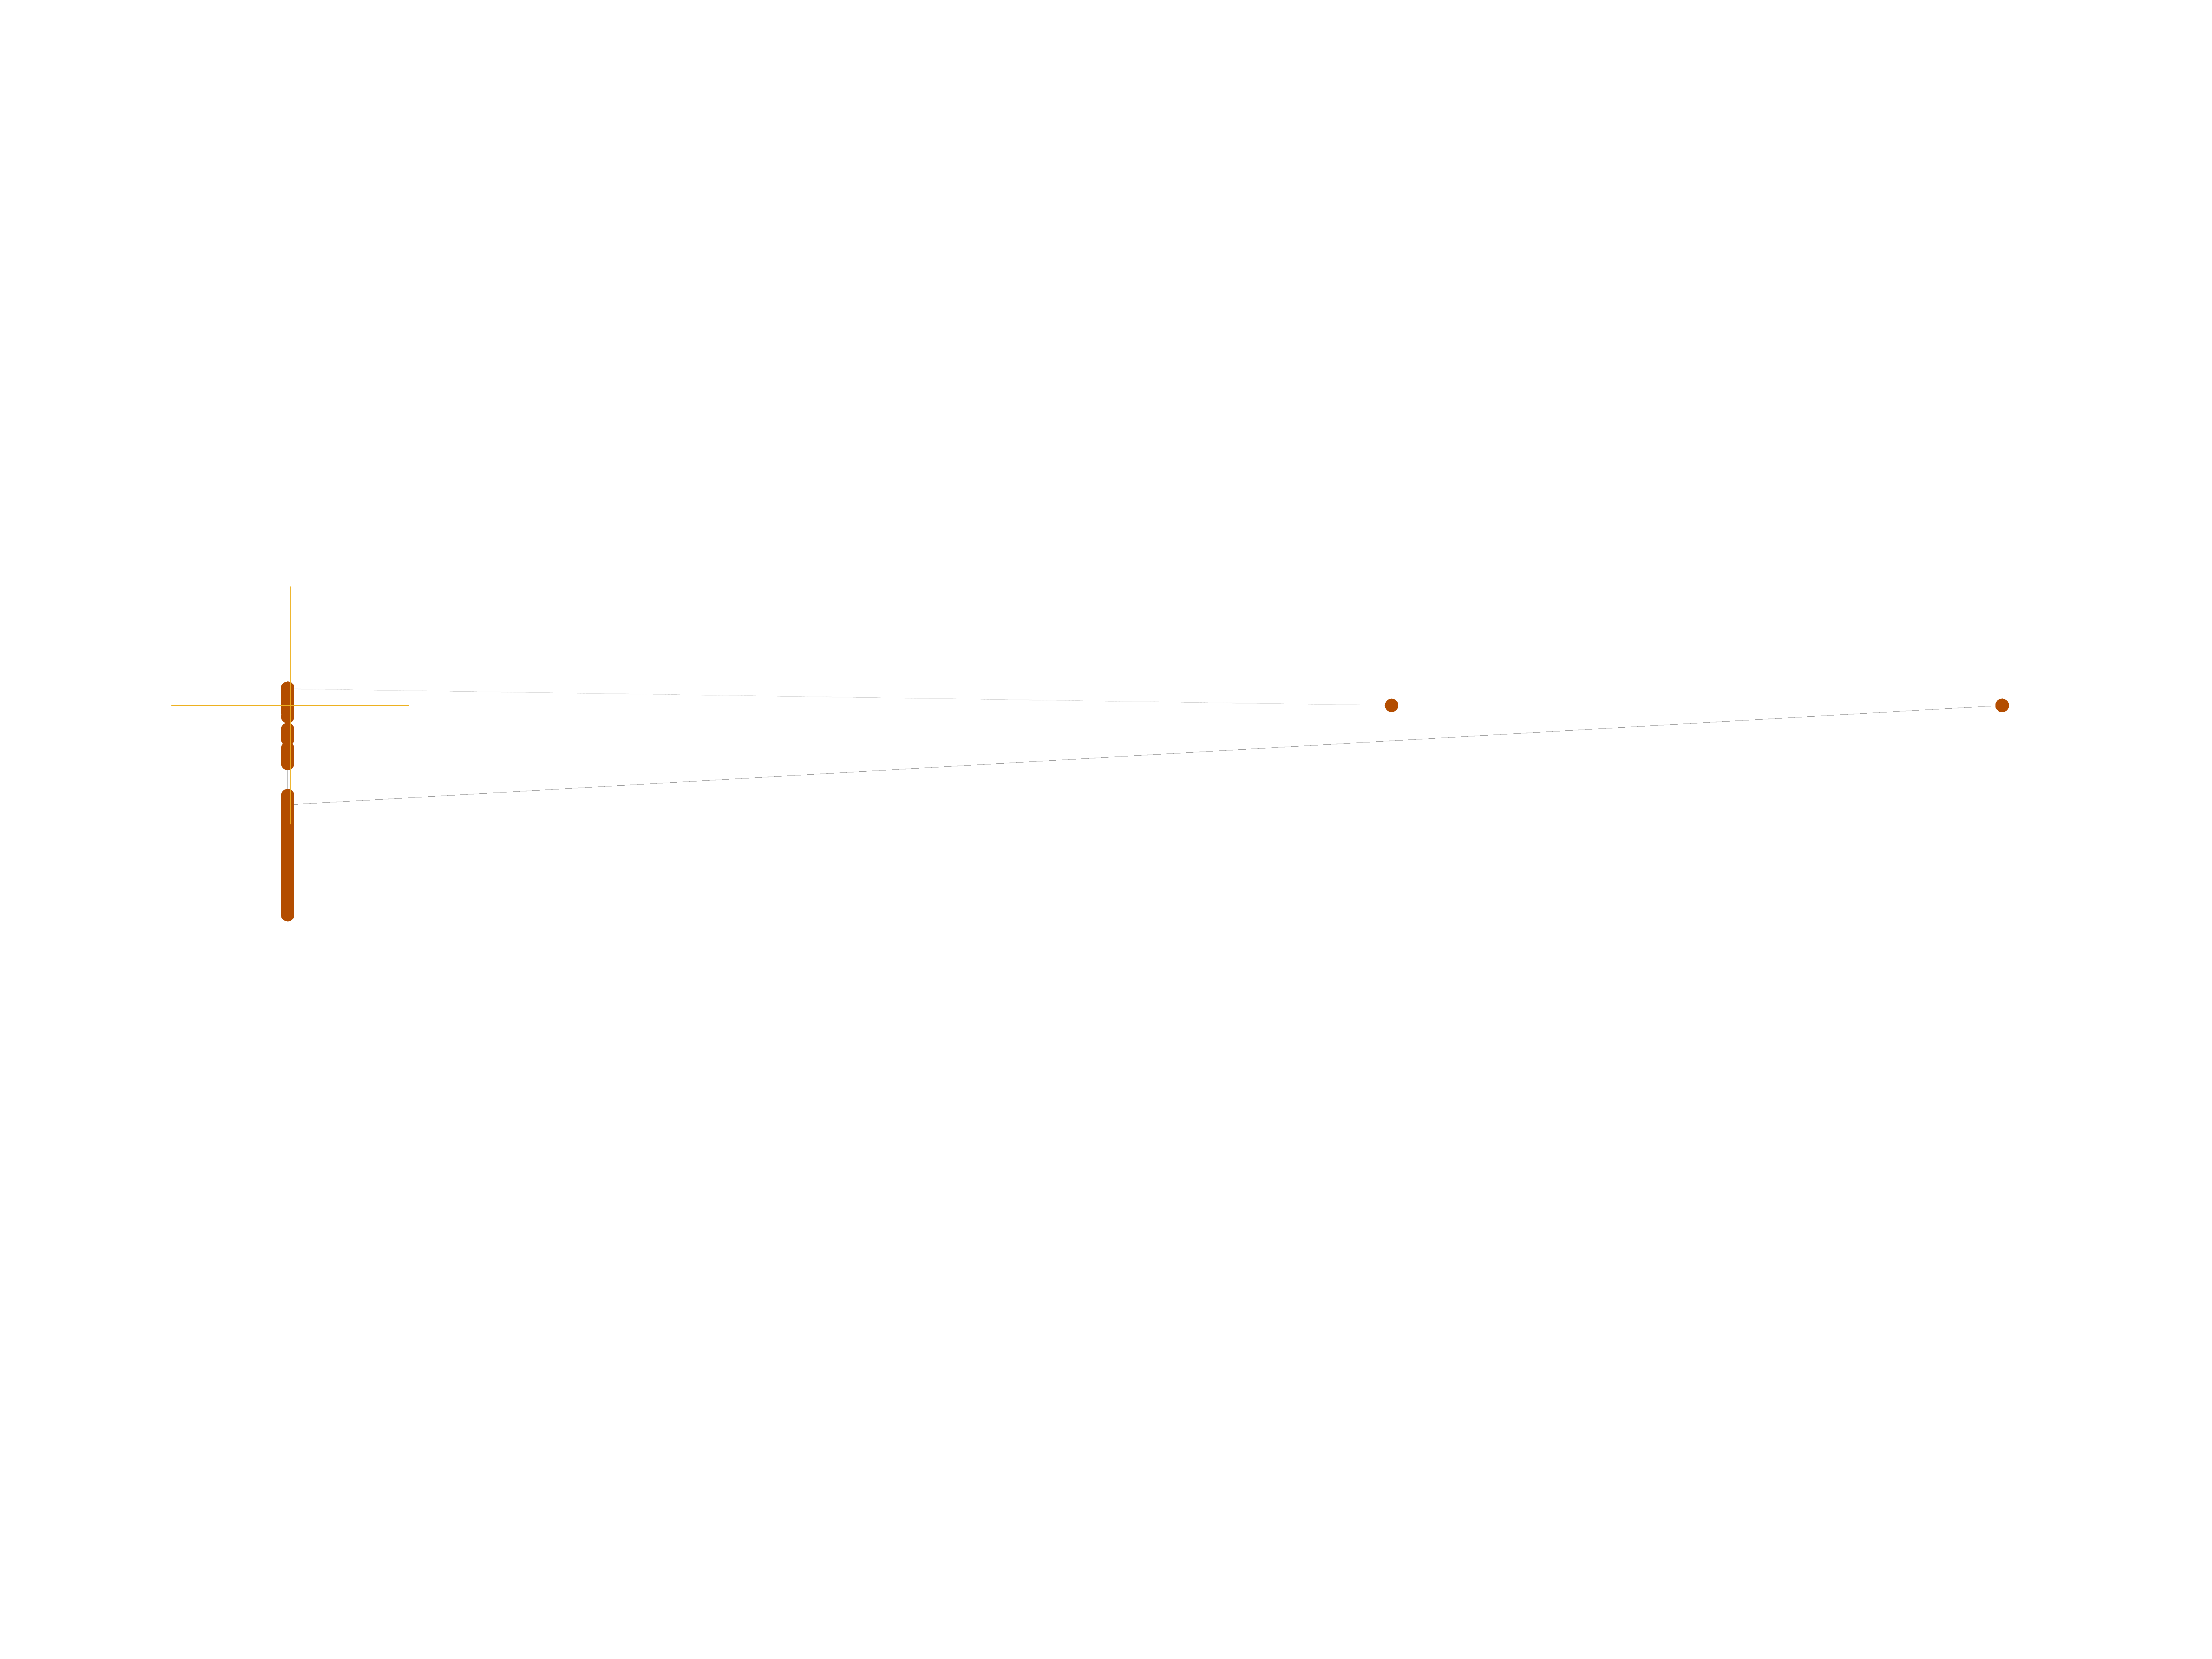
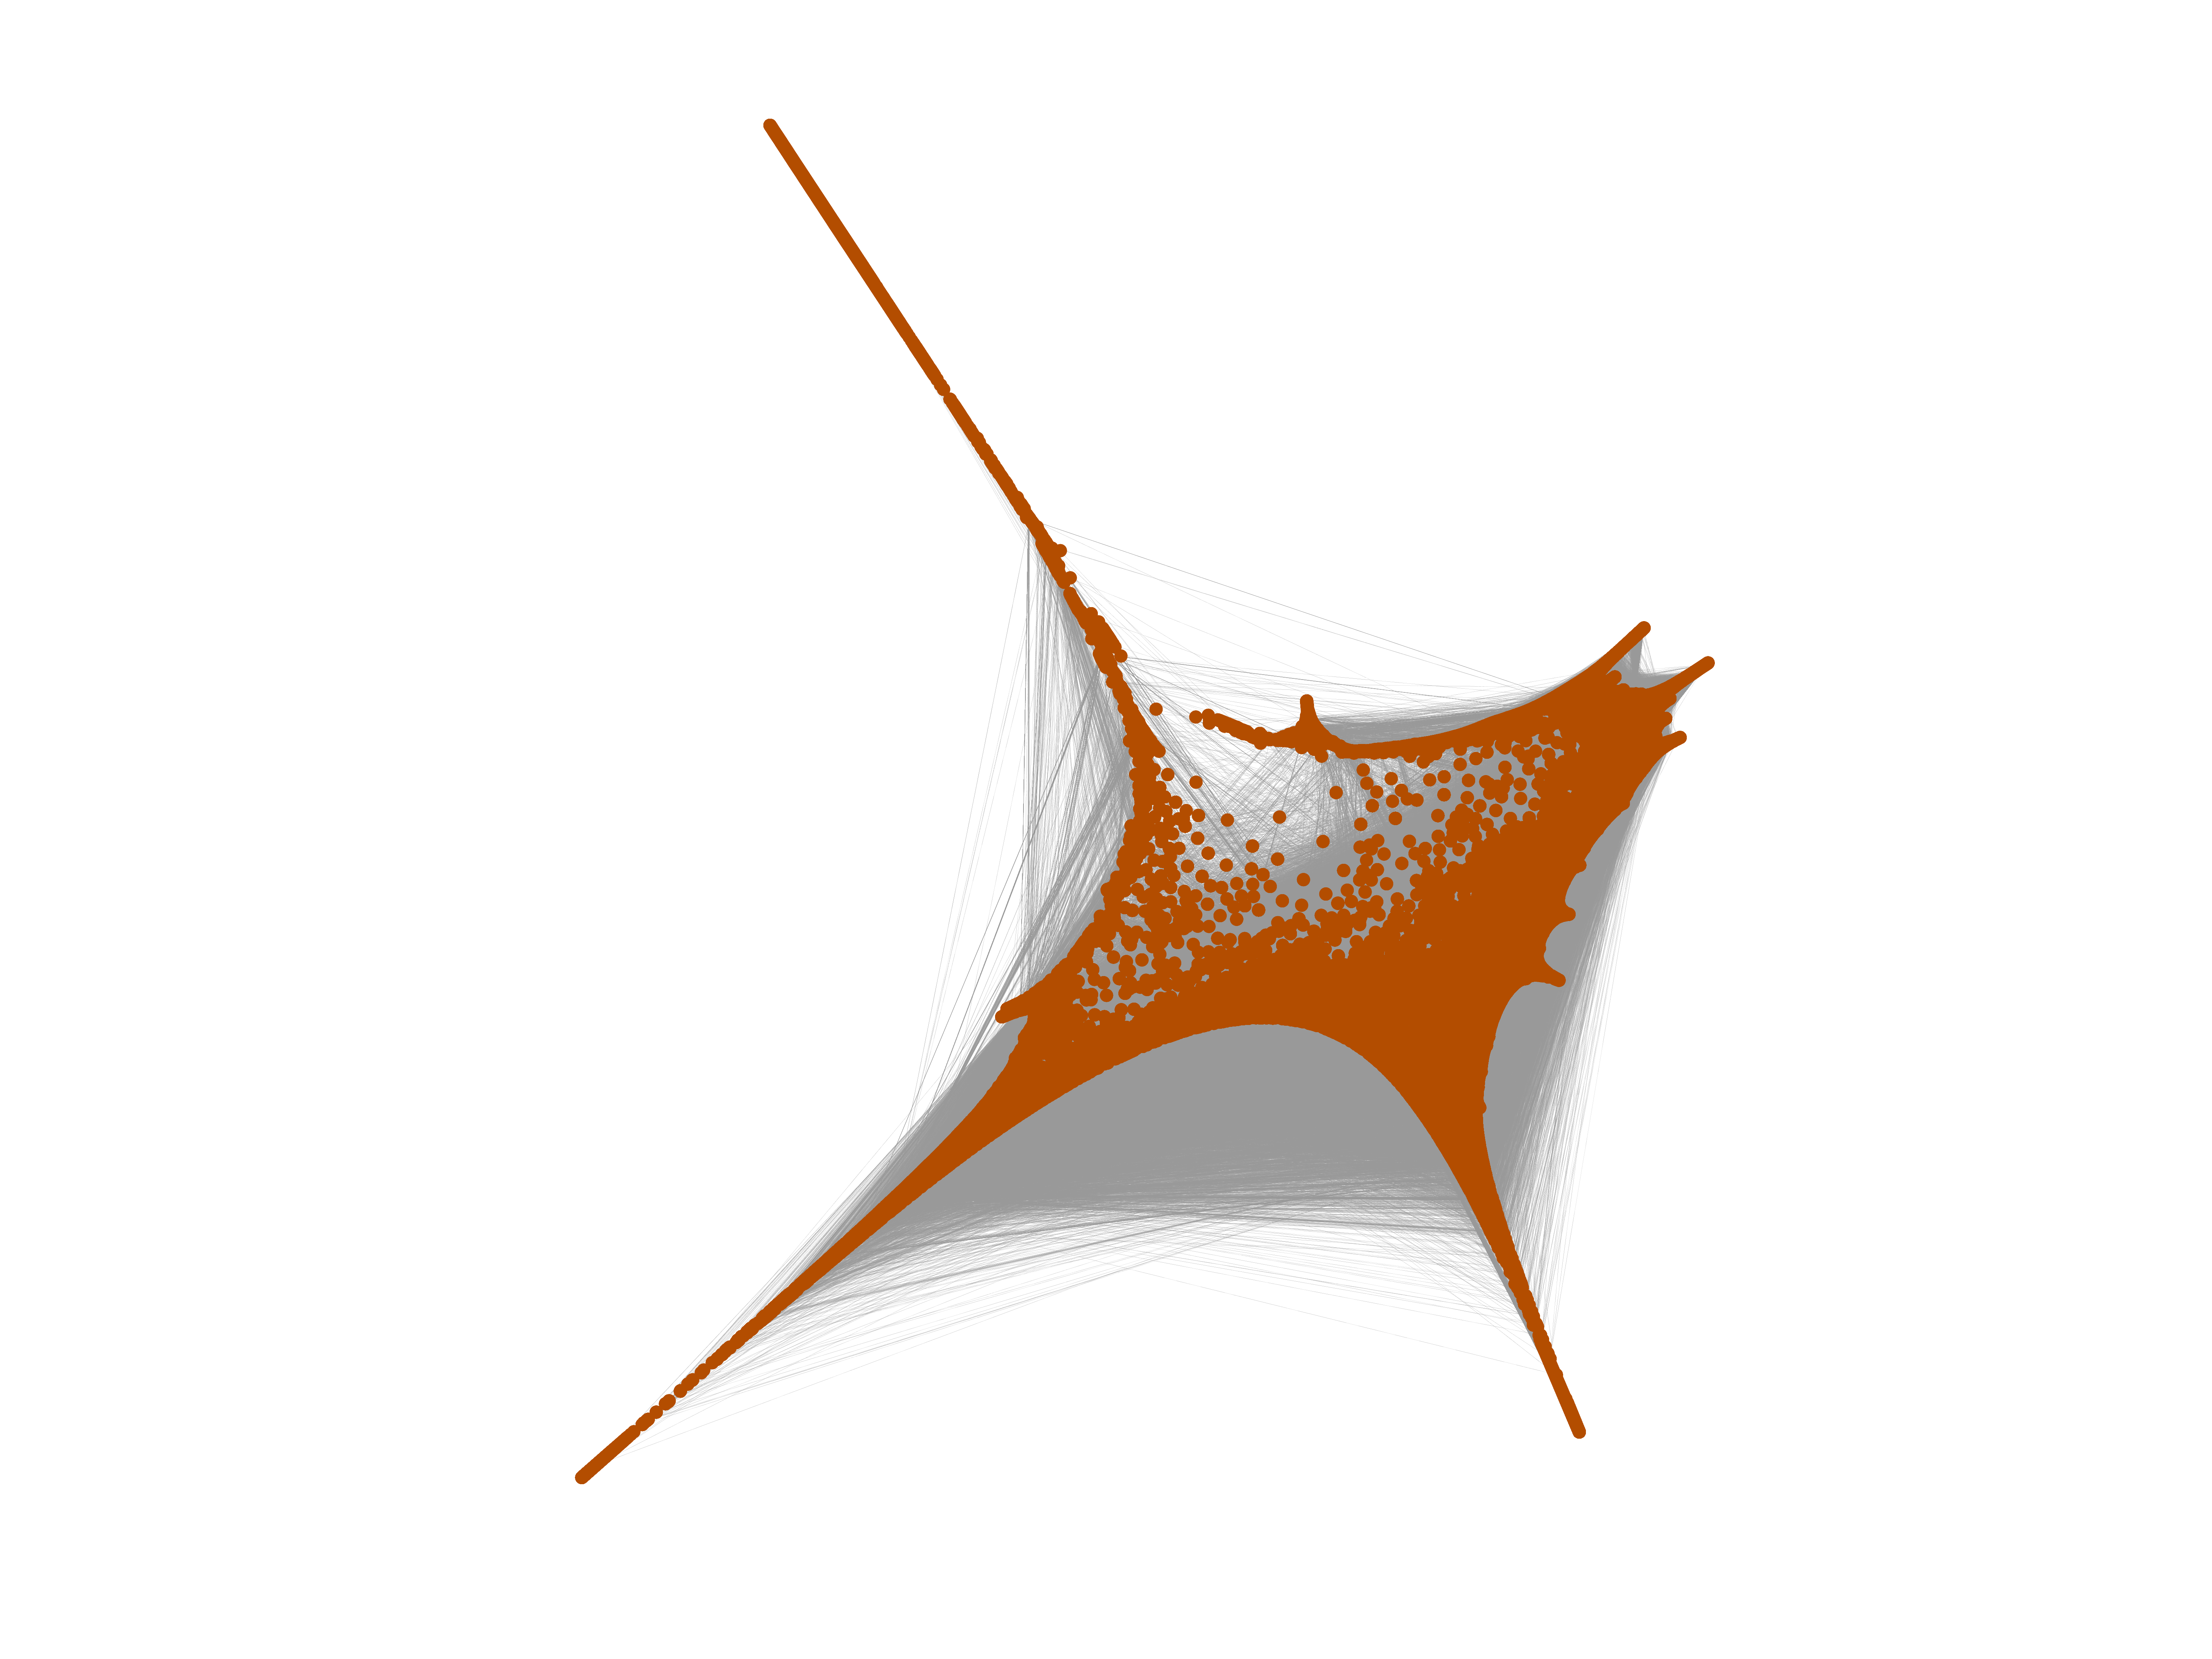
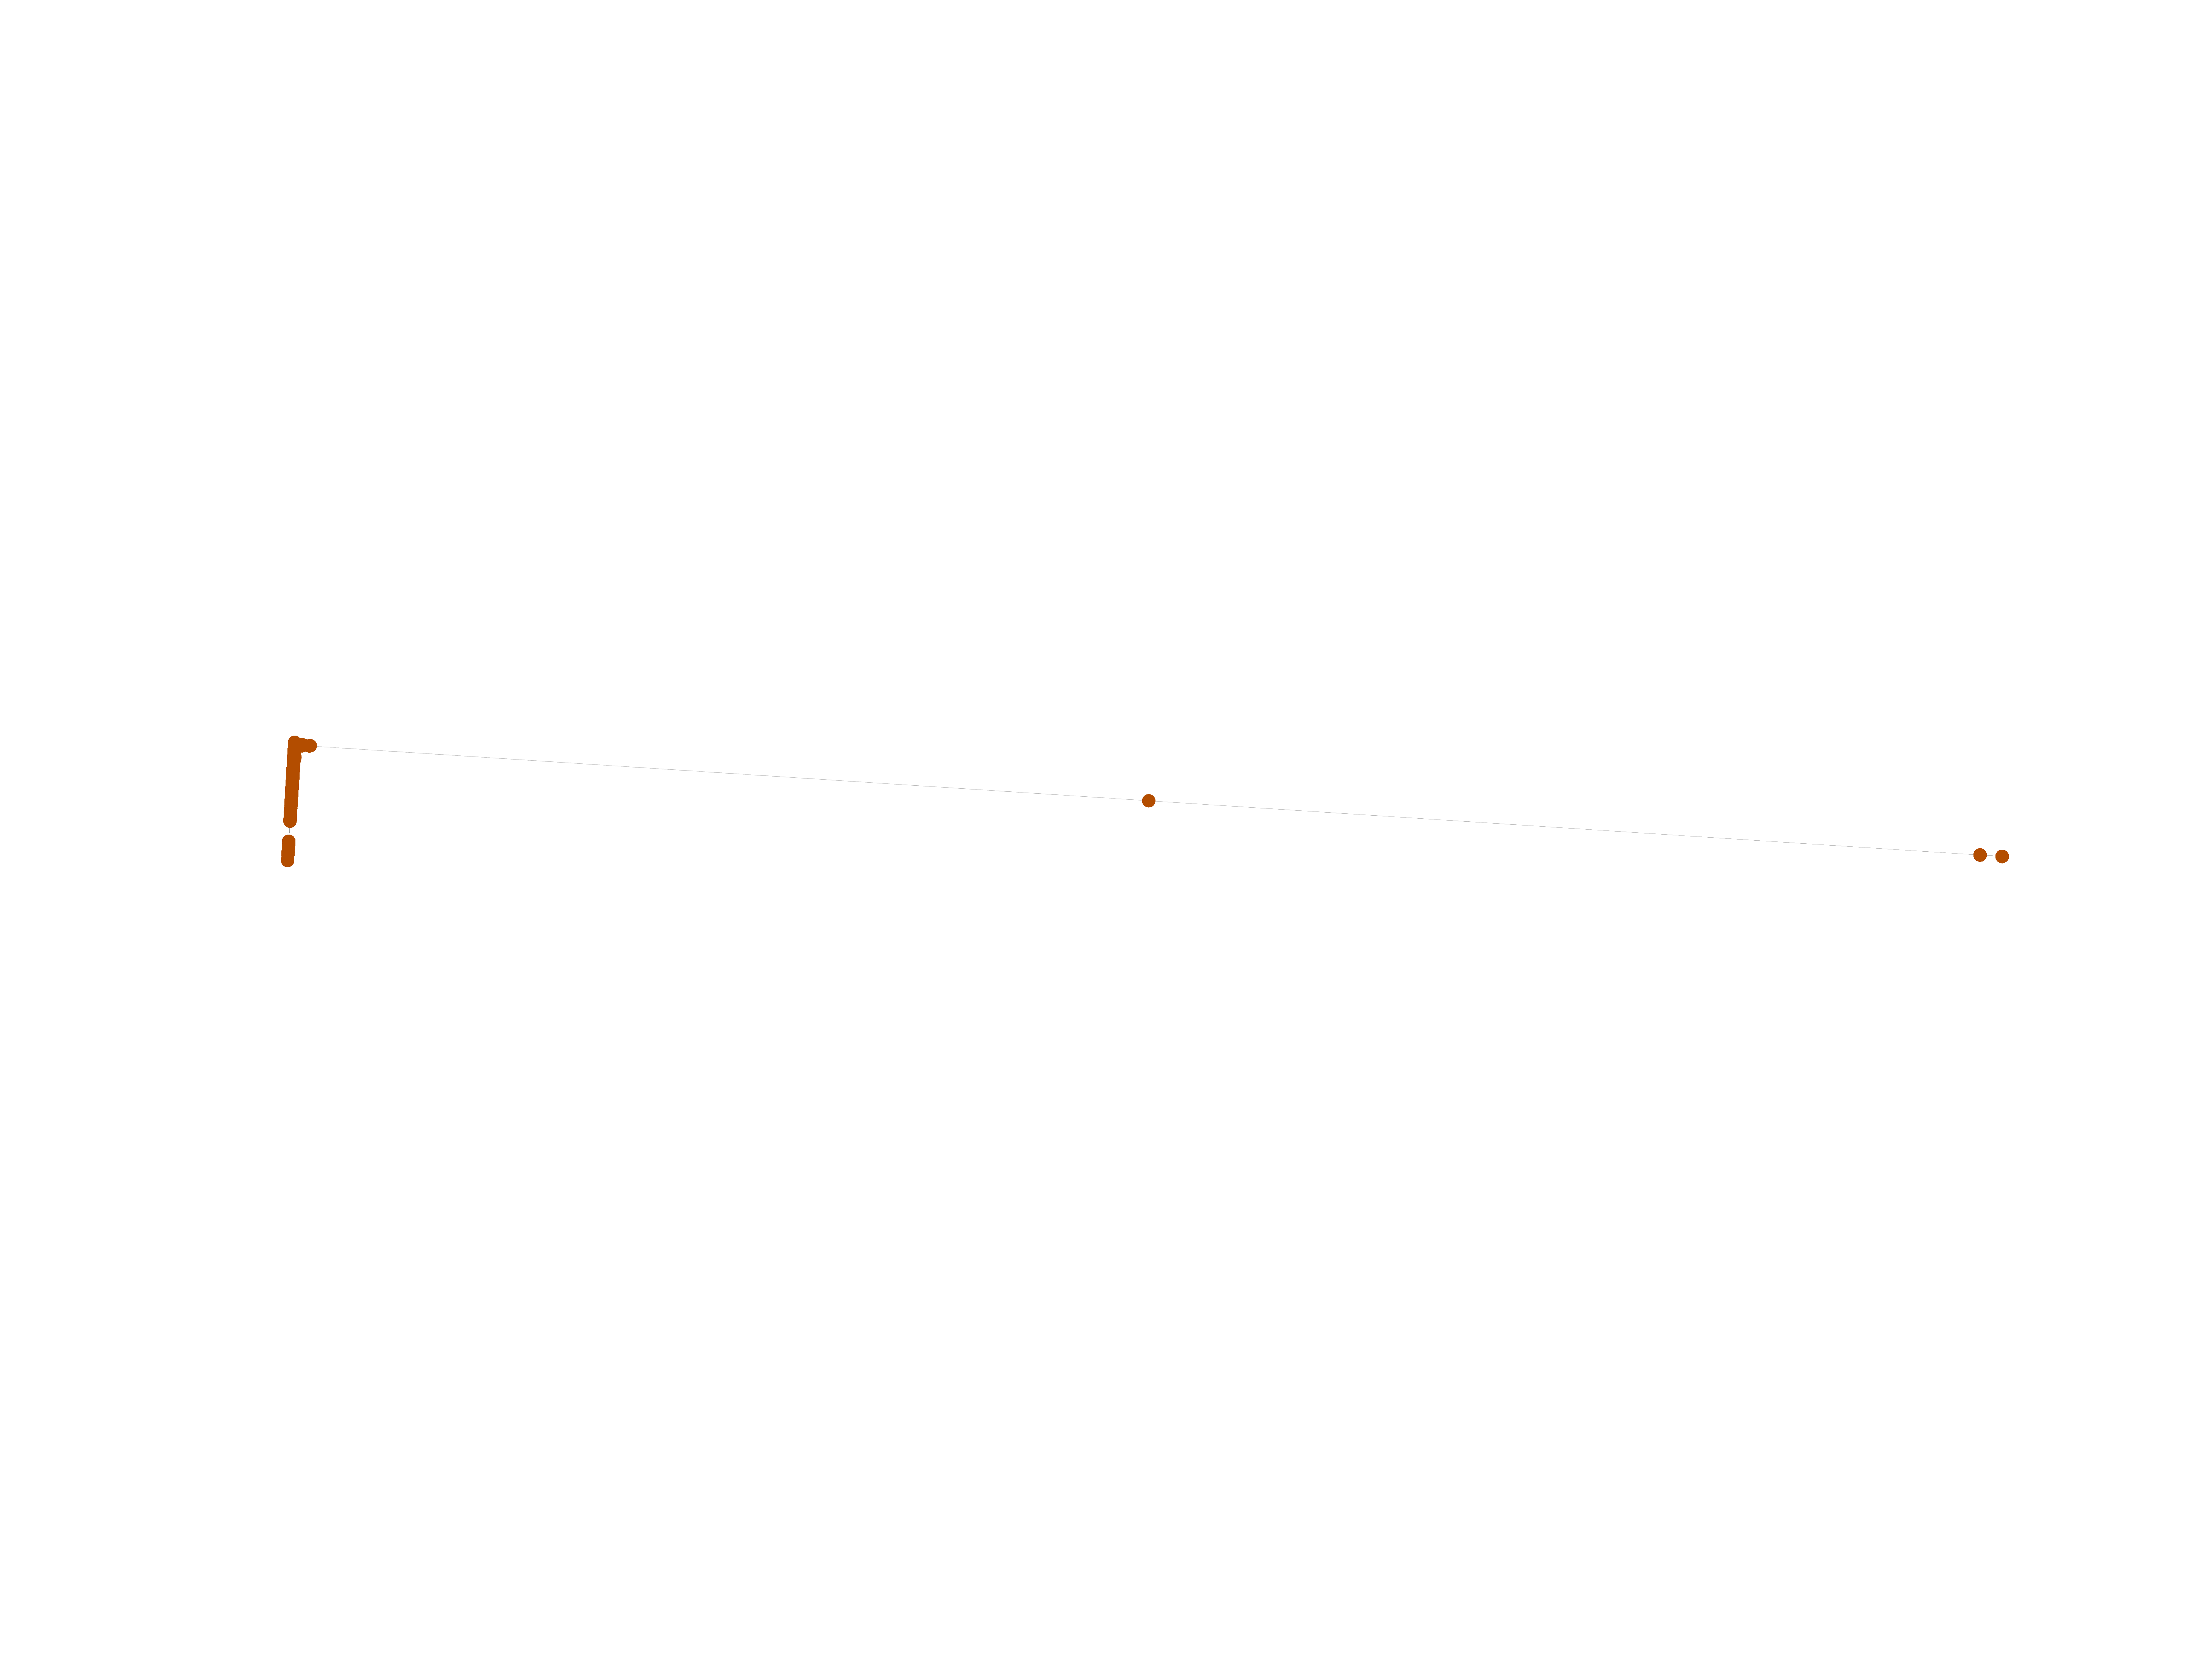
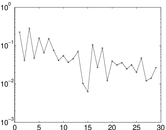
Matrix decompositions plots


Downloads
References
|
[1]
|
Jérôme Kunegis.
KONECT – The Koblenz Network Collection.
In Proc. Int. Conf. on World Wide Web Companion, pages
1343–1350, 2013.
[ http ]
|
|
[2]
|
Wikimedia Foundation.
Wikimedia downloads.
http://dumps.wikimedia.org/, January 2010.
|
 KONECT ‣ Networks ‣
Buy Me a Coffee
KONECT ‣ Networks ‣
Buy Me a Coffee