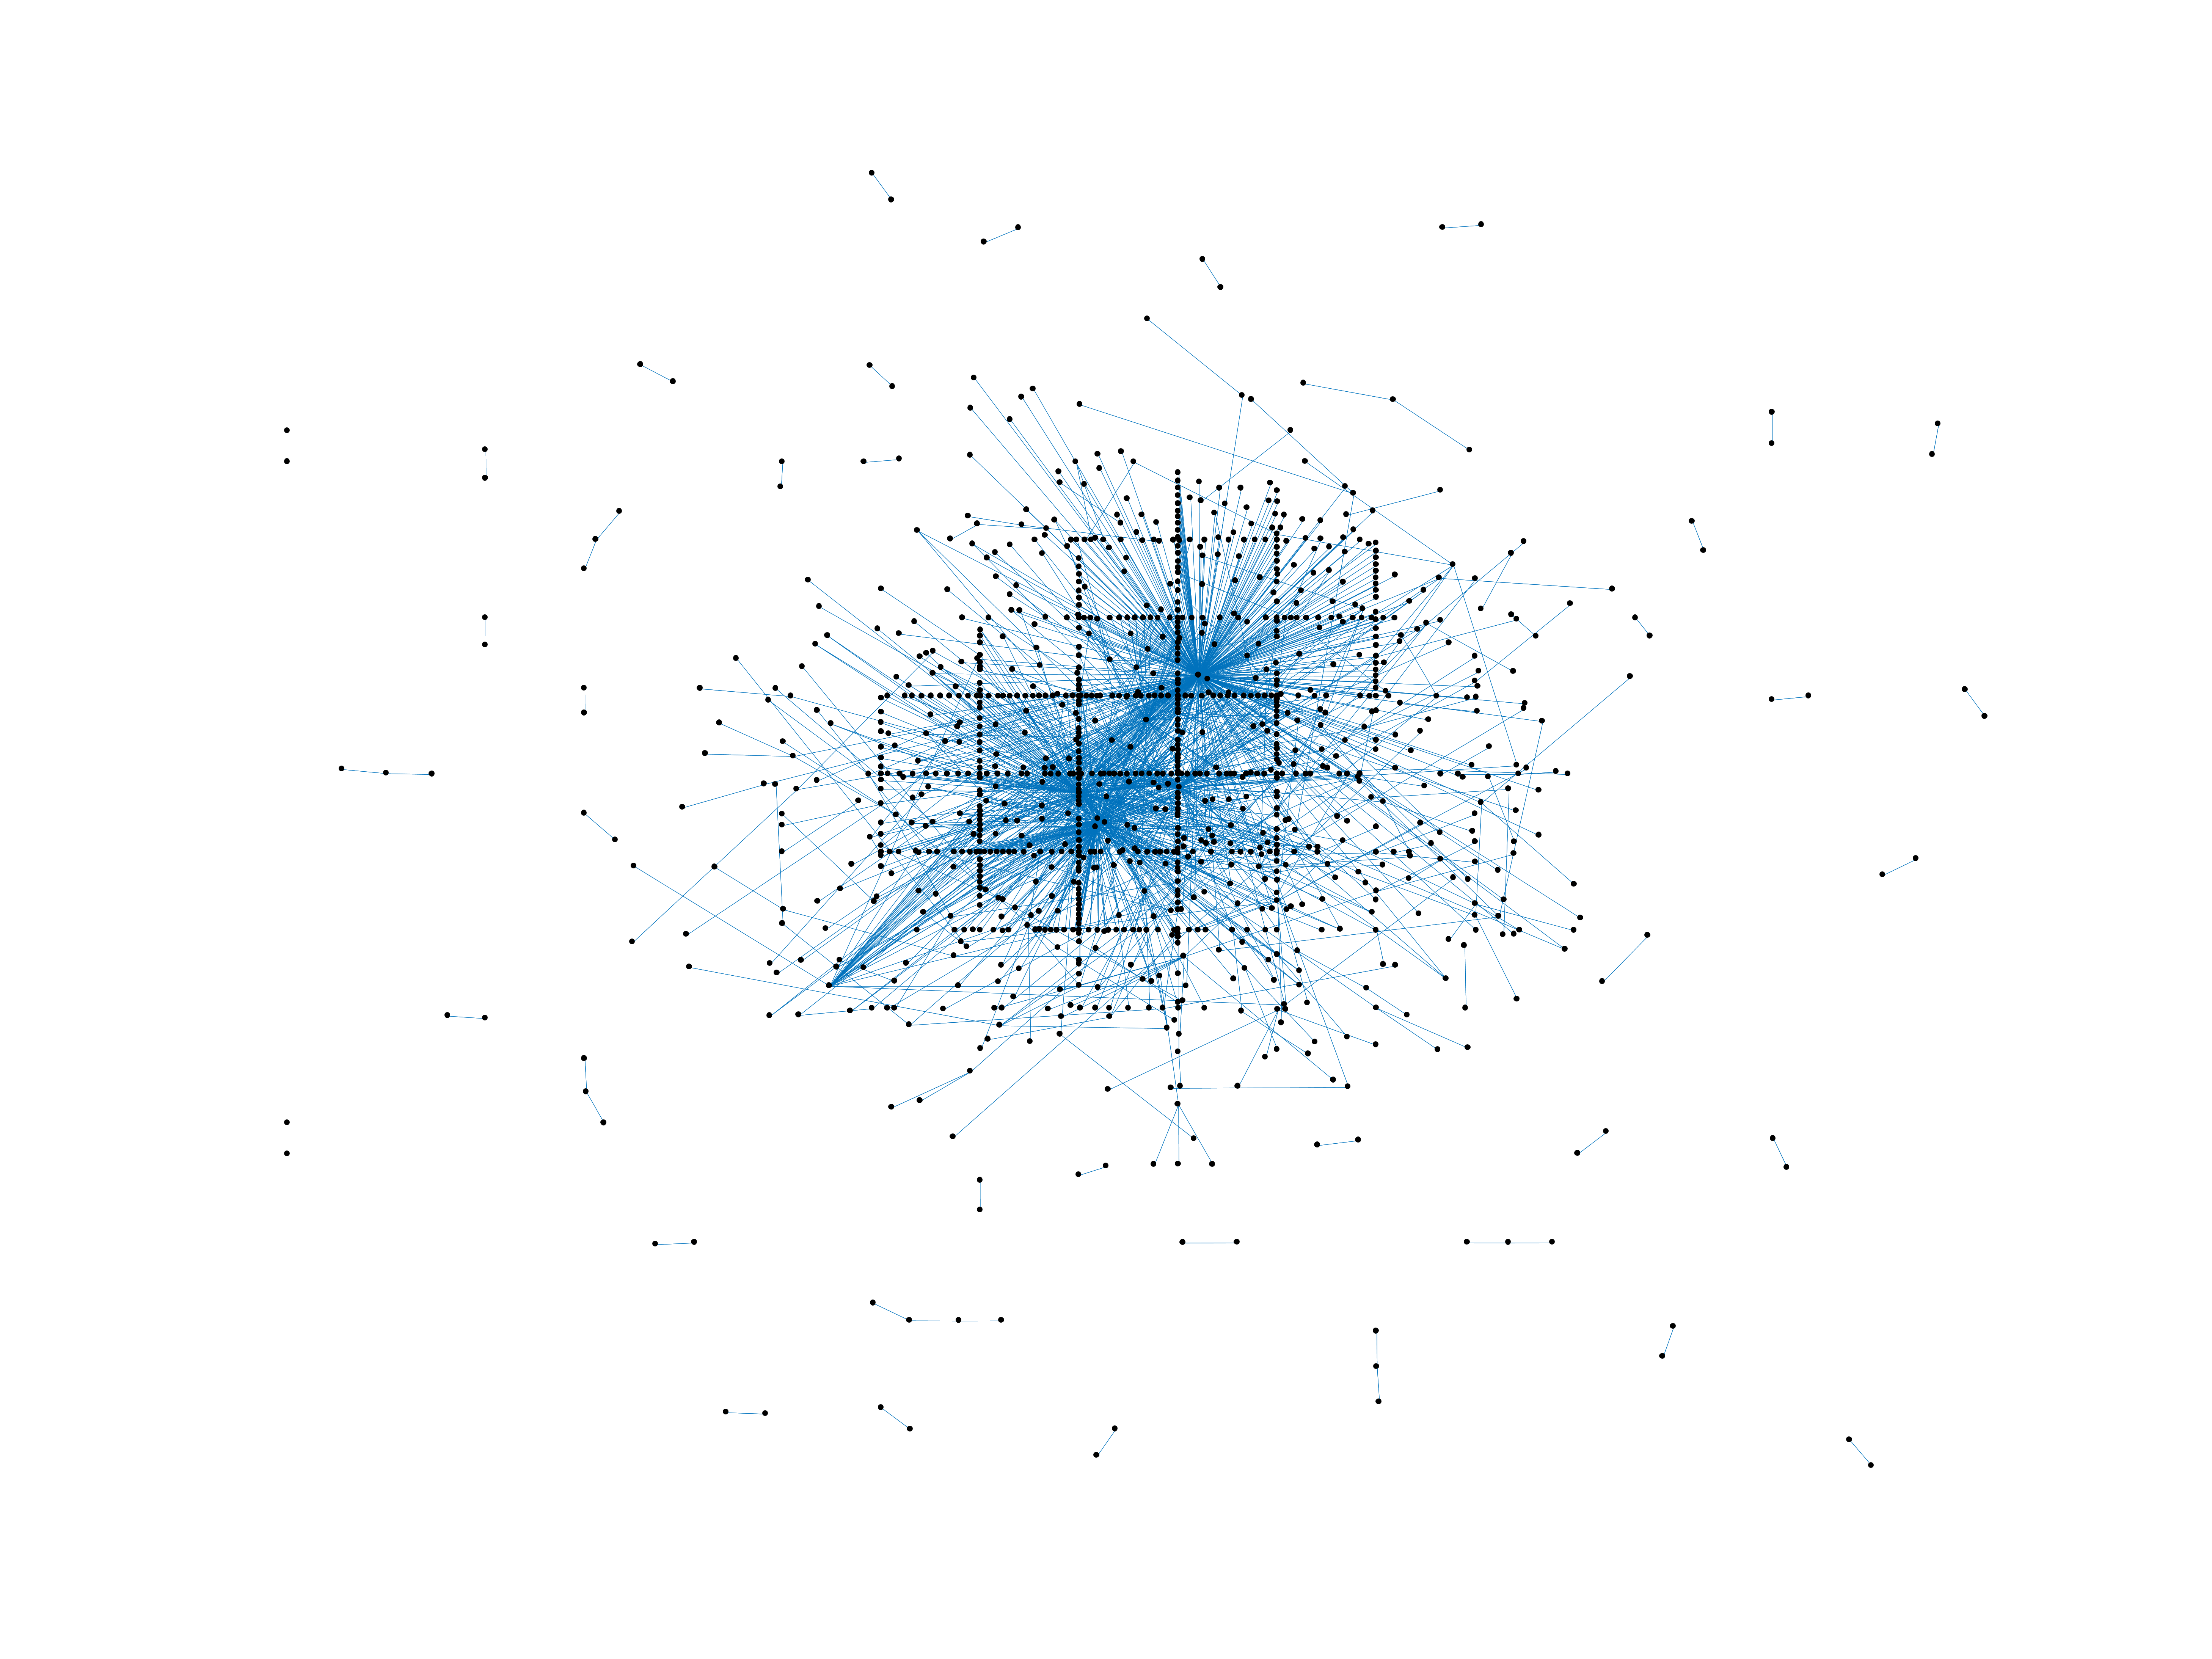
Wikibooks edits (mr)
This is the bipartite edit network of the Marathi Wikibooks. It contains users
and pages from the Marathi Wikibooks, connected by edit events. Each edge
represents an edit. The dataset includes the timestamp of each edit.
Metadata
Statistics
| Size | n = | 1,199
|
| Left size | n1 = | 190
|
| Right size | n2 = | 1,009
|
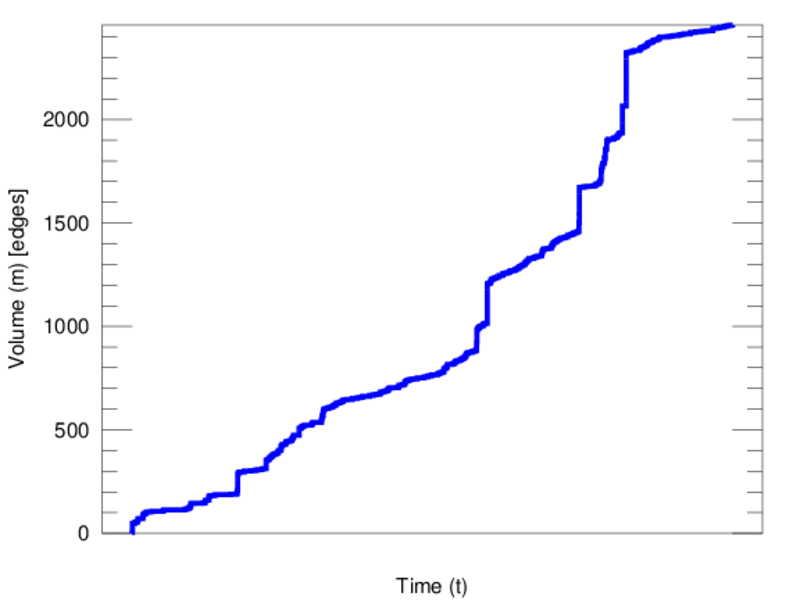
| Volume | m = | 2,457
|
| Unique edge count | m̿ = | 1,528
|
| Wedge count | s = | 117,558
|
| Claw count | z = | 11,411,586
|
| Cross count | x = | 980,254,545
|
| Square count | q = | 12,080
|
| 4-Tour count | T4 = | 571,636
|
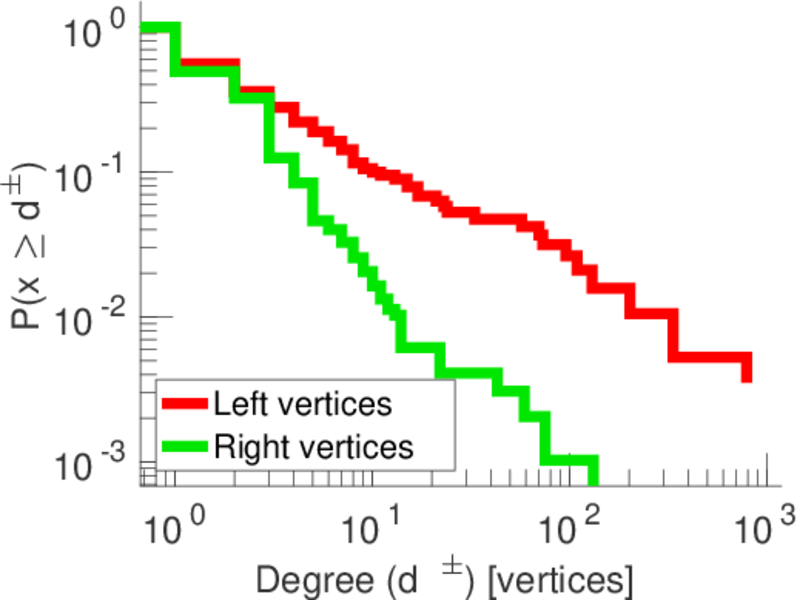
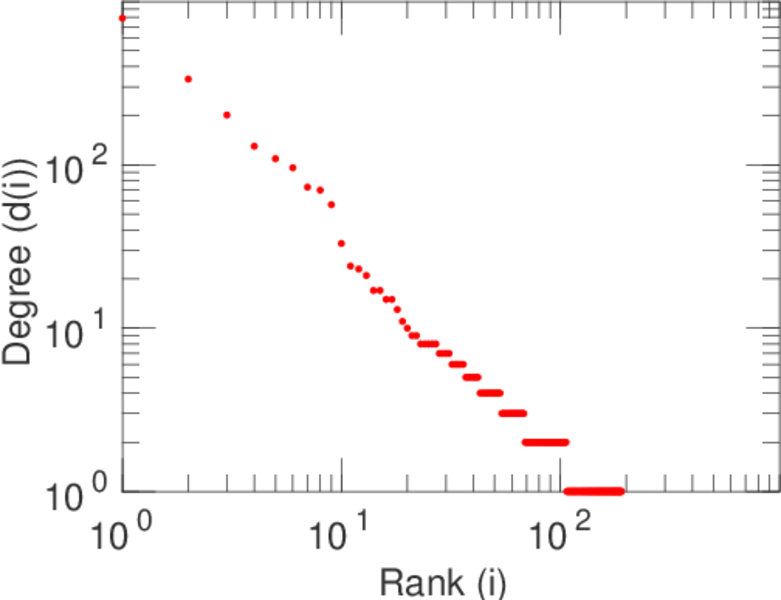
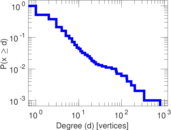
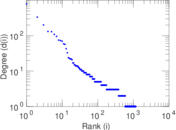
| Maximum degree | dmax = | 791
|
| Maximum left degree | d1max = | 791
|
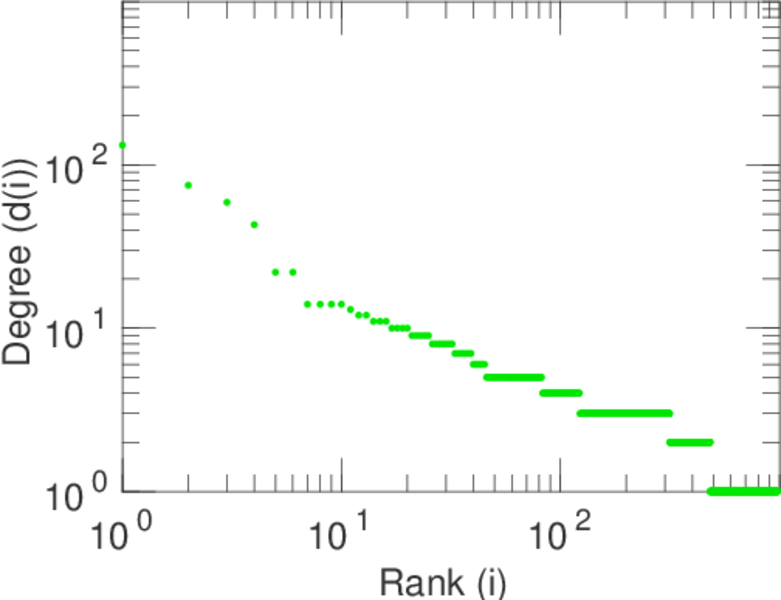
| Maximum right degree | d2max = | 132
|
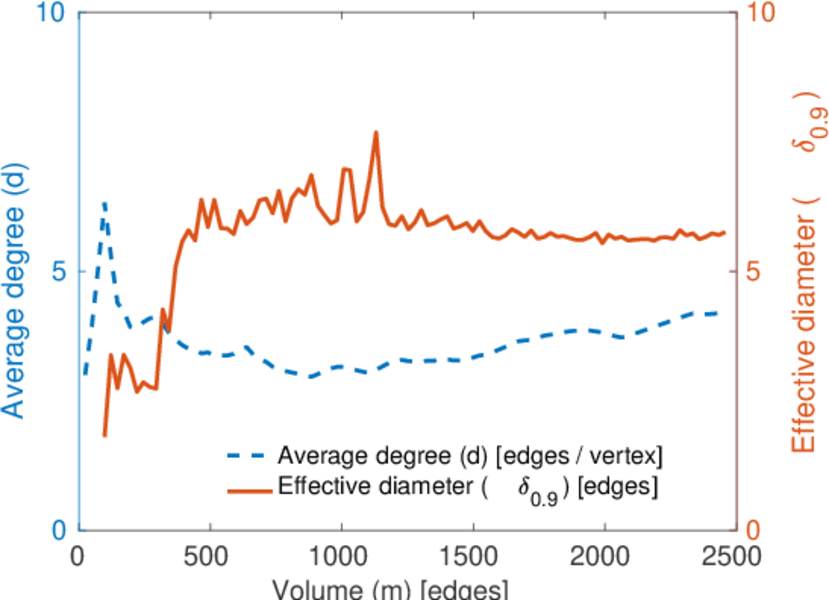
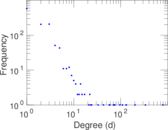
| Average degree | d = | 4.098 42
|
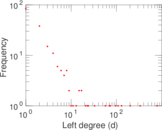
| Average left degree | d1 = | 12.931 6
|
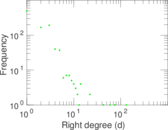
| Average right degree | d2 = | 2.435 08
|
| Fill | p = | 0.007 970 37
|
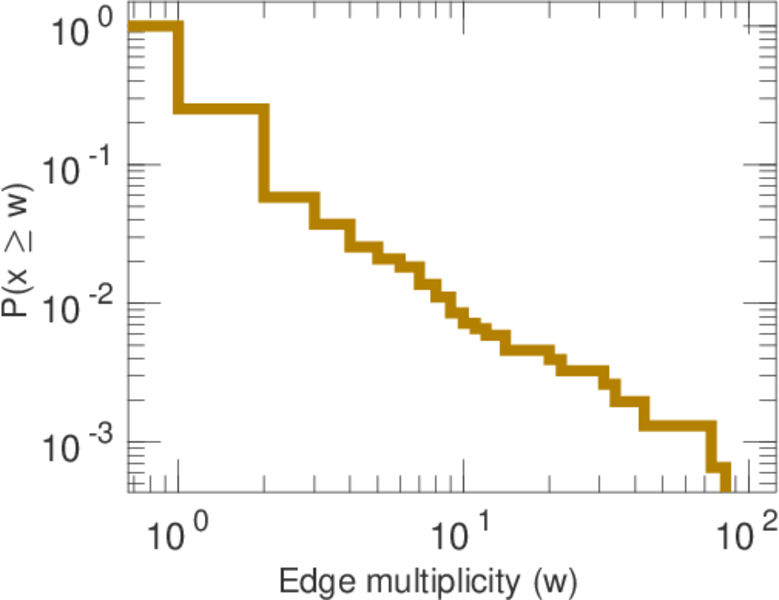
| Average edge multiplicity | m̃ = | 1.607 98
|
| Size of LCC | N = | 959
|
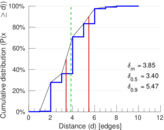
| Diameter | δ = | 12
|
| 50-Percentile effective diameter | δ0.5 = | 3.400 01
|
| 90-Percentile effective diameter | δ0.9 = | 5.470 40
|
| Median distance | δM = | 4
|
| Mean distance | δm = | 3.847 25
|
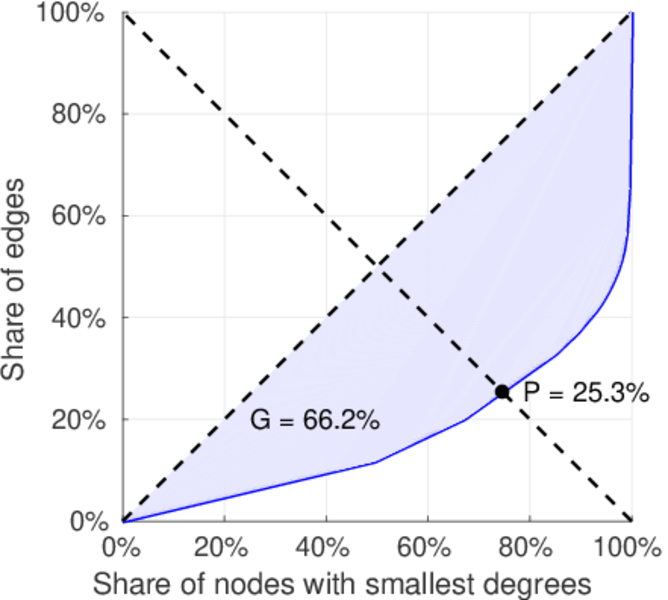
| Gini coefficient | G = | 0.690 252
|
| Balanced inequality ratio | P = | 0.236 874
|
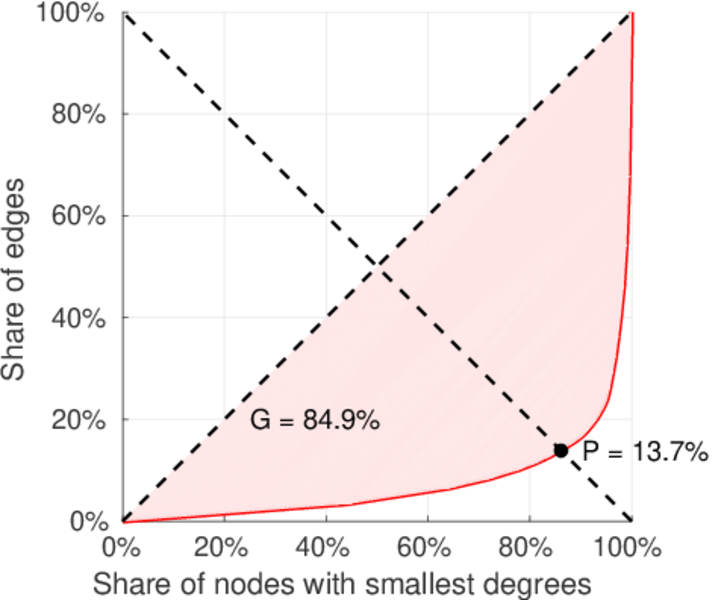
| Left balanced inequality ratio | P1 = | 0.137 159
|
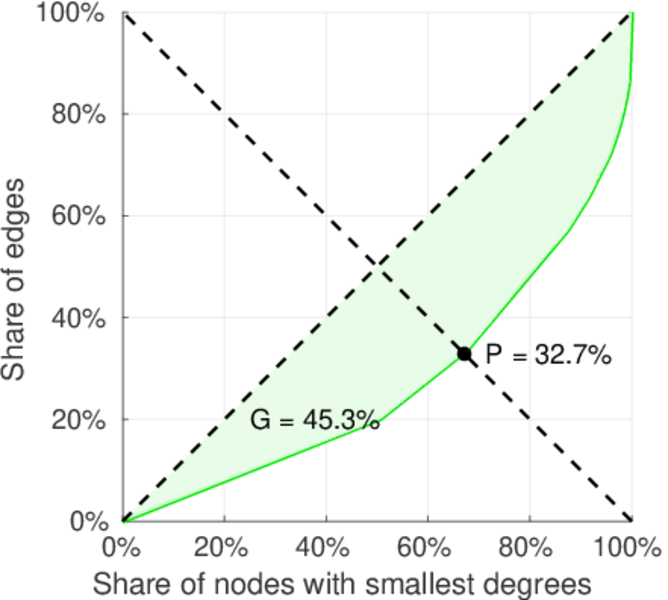
| Right balanced inequality ratio | P2 = | 0.327 228
|
| Relative edge distribution entropy | Her = | 0.809 702
|
| Power law exponent | γ = | 3.534 64
|
| Tail power law exponent | γt = | 3.031 00
|
| Tail power law exponent with p | γ3 = | 3.031 00
|
| p-value | p = | 0.001 000 00
|
| Left tail power law exponent with p | γ3,1 = | 1.861 00
|
| Left p-value | p1 = | 0.423 000
|
| Right tail power law exponent with p | γ3,2 = | 3.911 00
|
| Right p-value | p2 = | 0.013 000 0
|
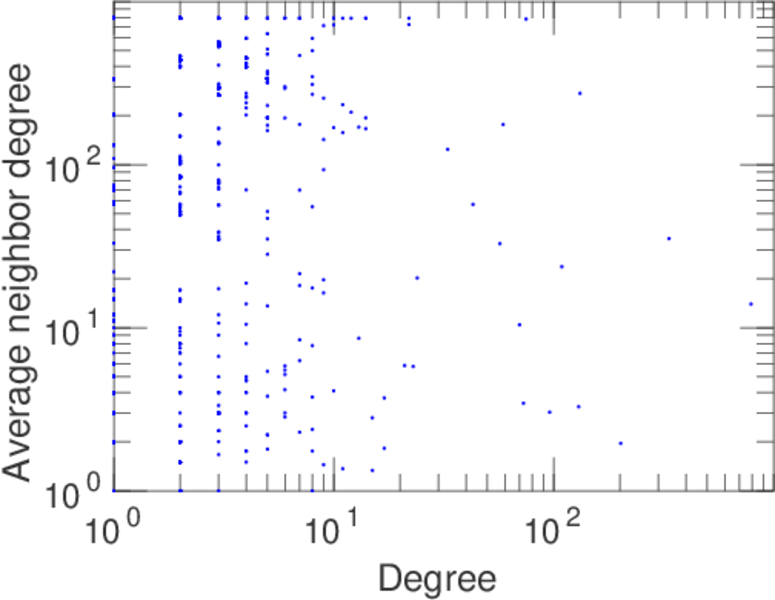
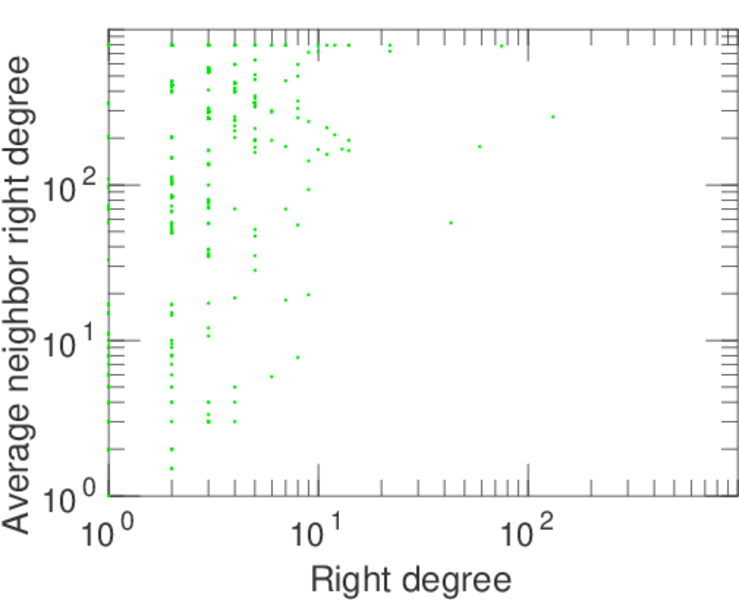
| Degree assortativity | ρ = | −0.170 969
|
| Degree assortativity p-value | pρ = | 1.729 22 × 10−11
|
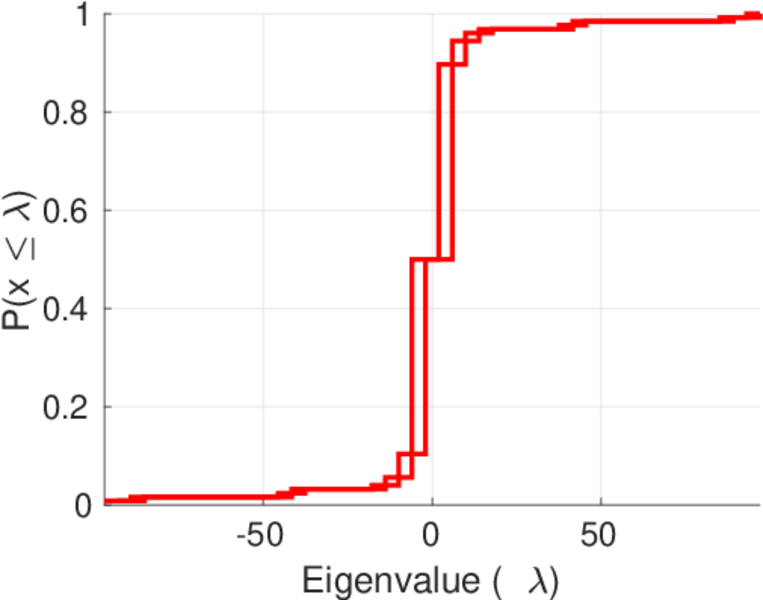
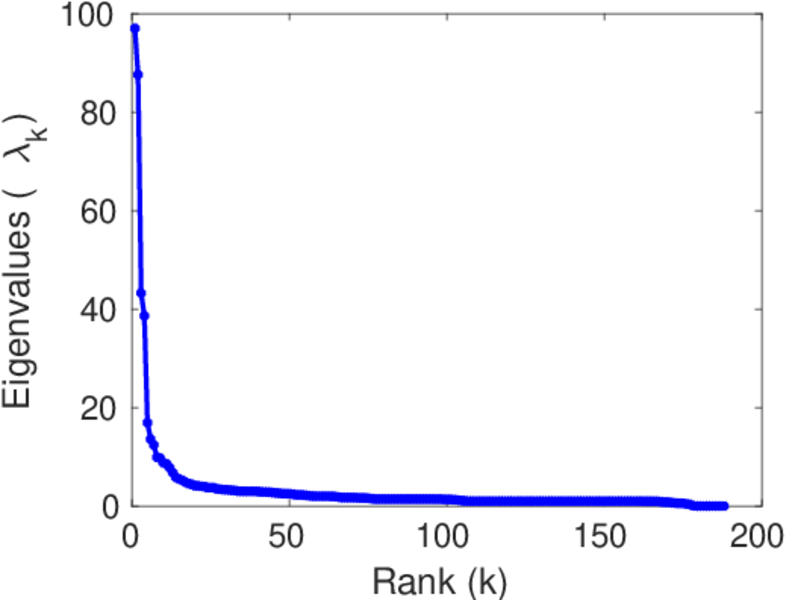
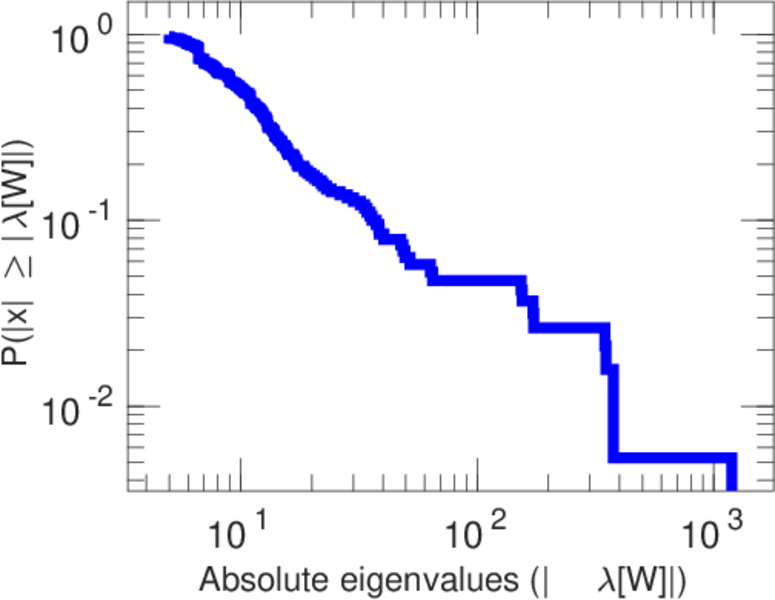
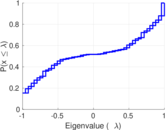
| Spectral norm | α = | 97.018 7
|
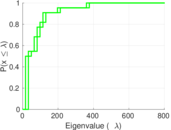
| Algebraic connectivity | a = | 0.050 959 2
|
| Spectral separation | |λ1[A] / λ2[A]| = | 1.107 57
|
| Controllability | C = | 810
|
| Relative controllability | Cr = | 0.694 683
|
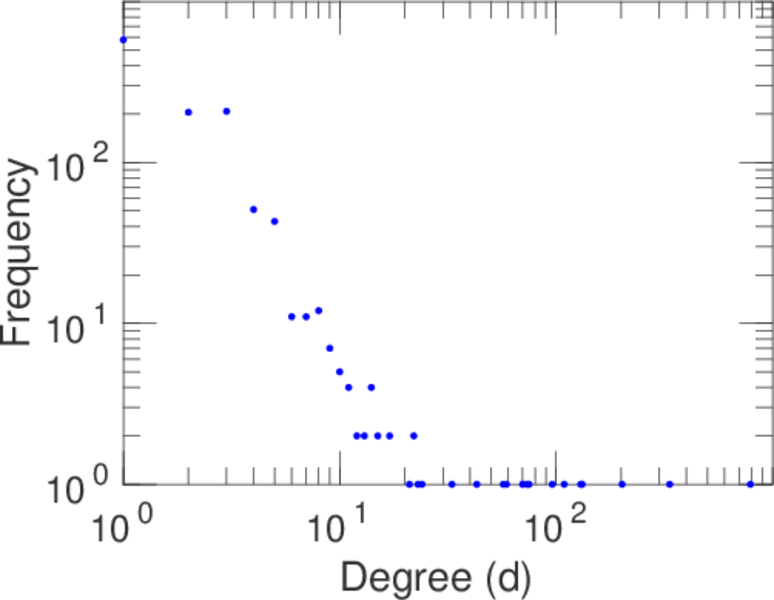
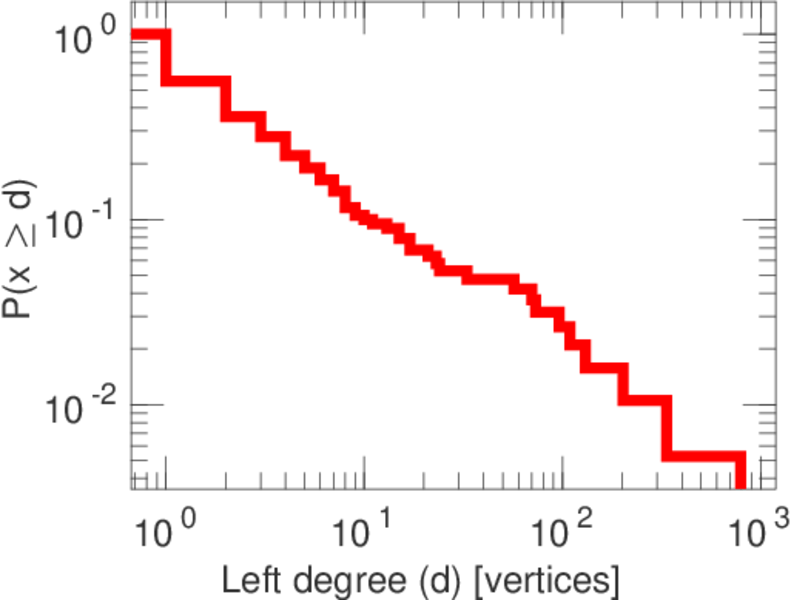
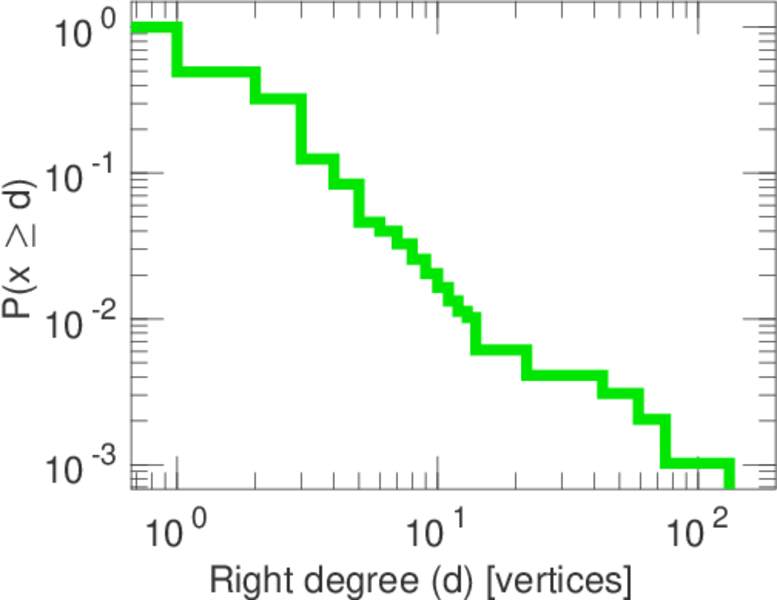
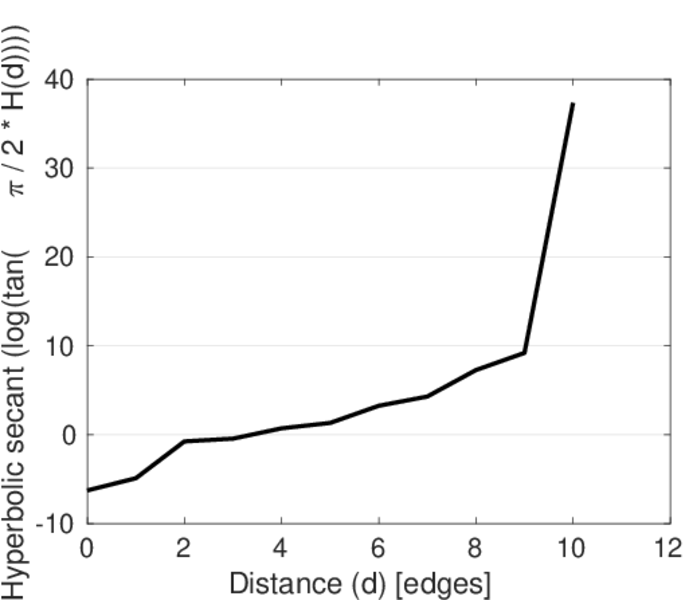
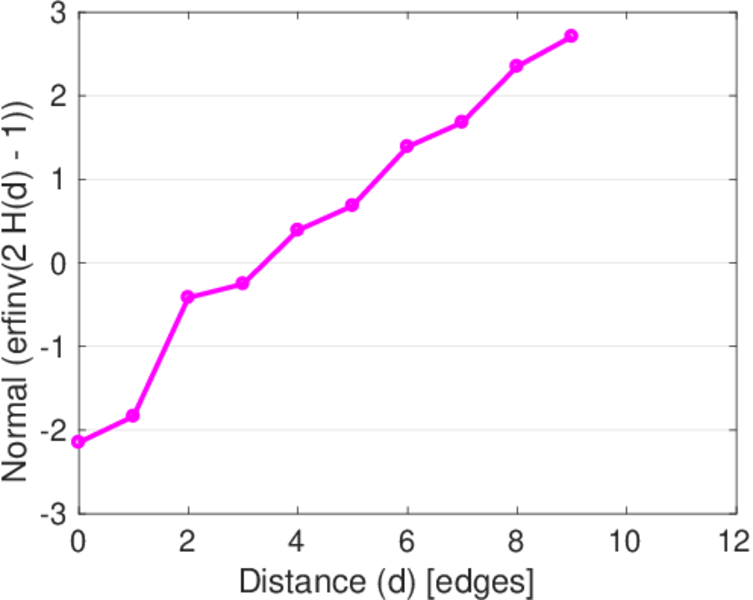
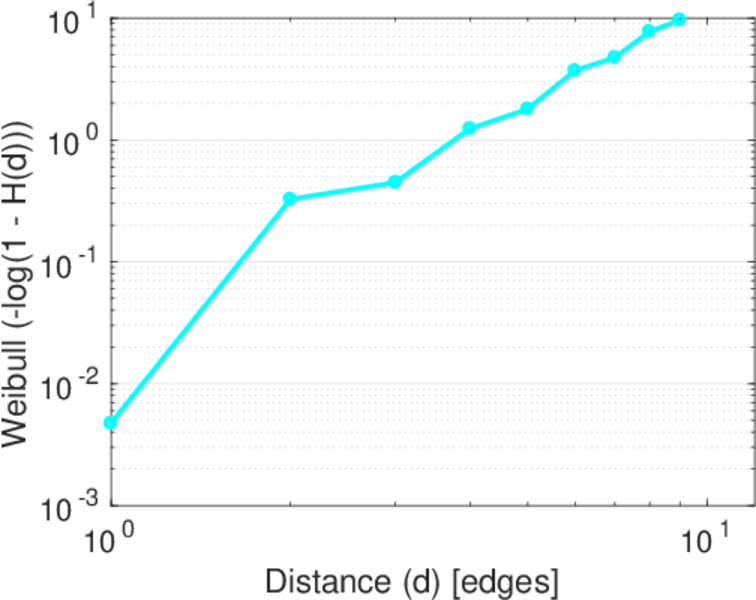
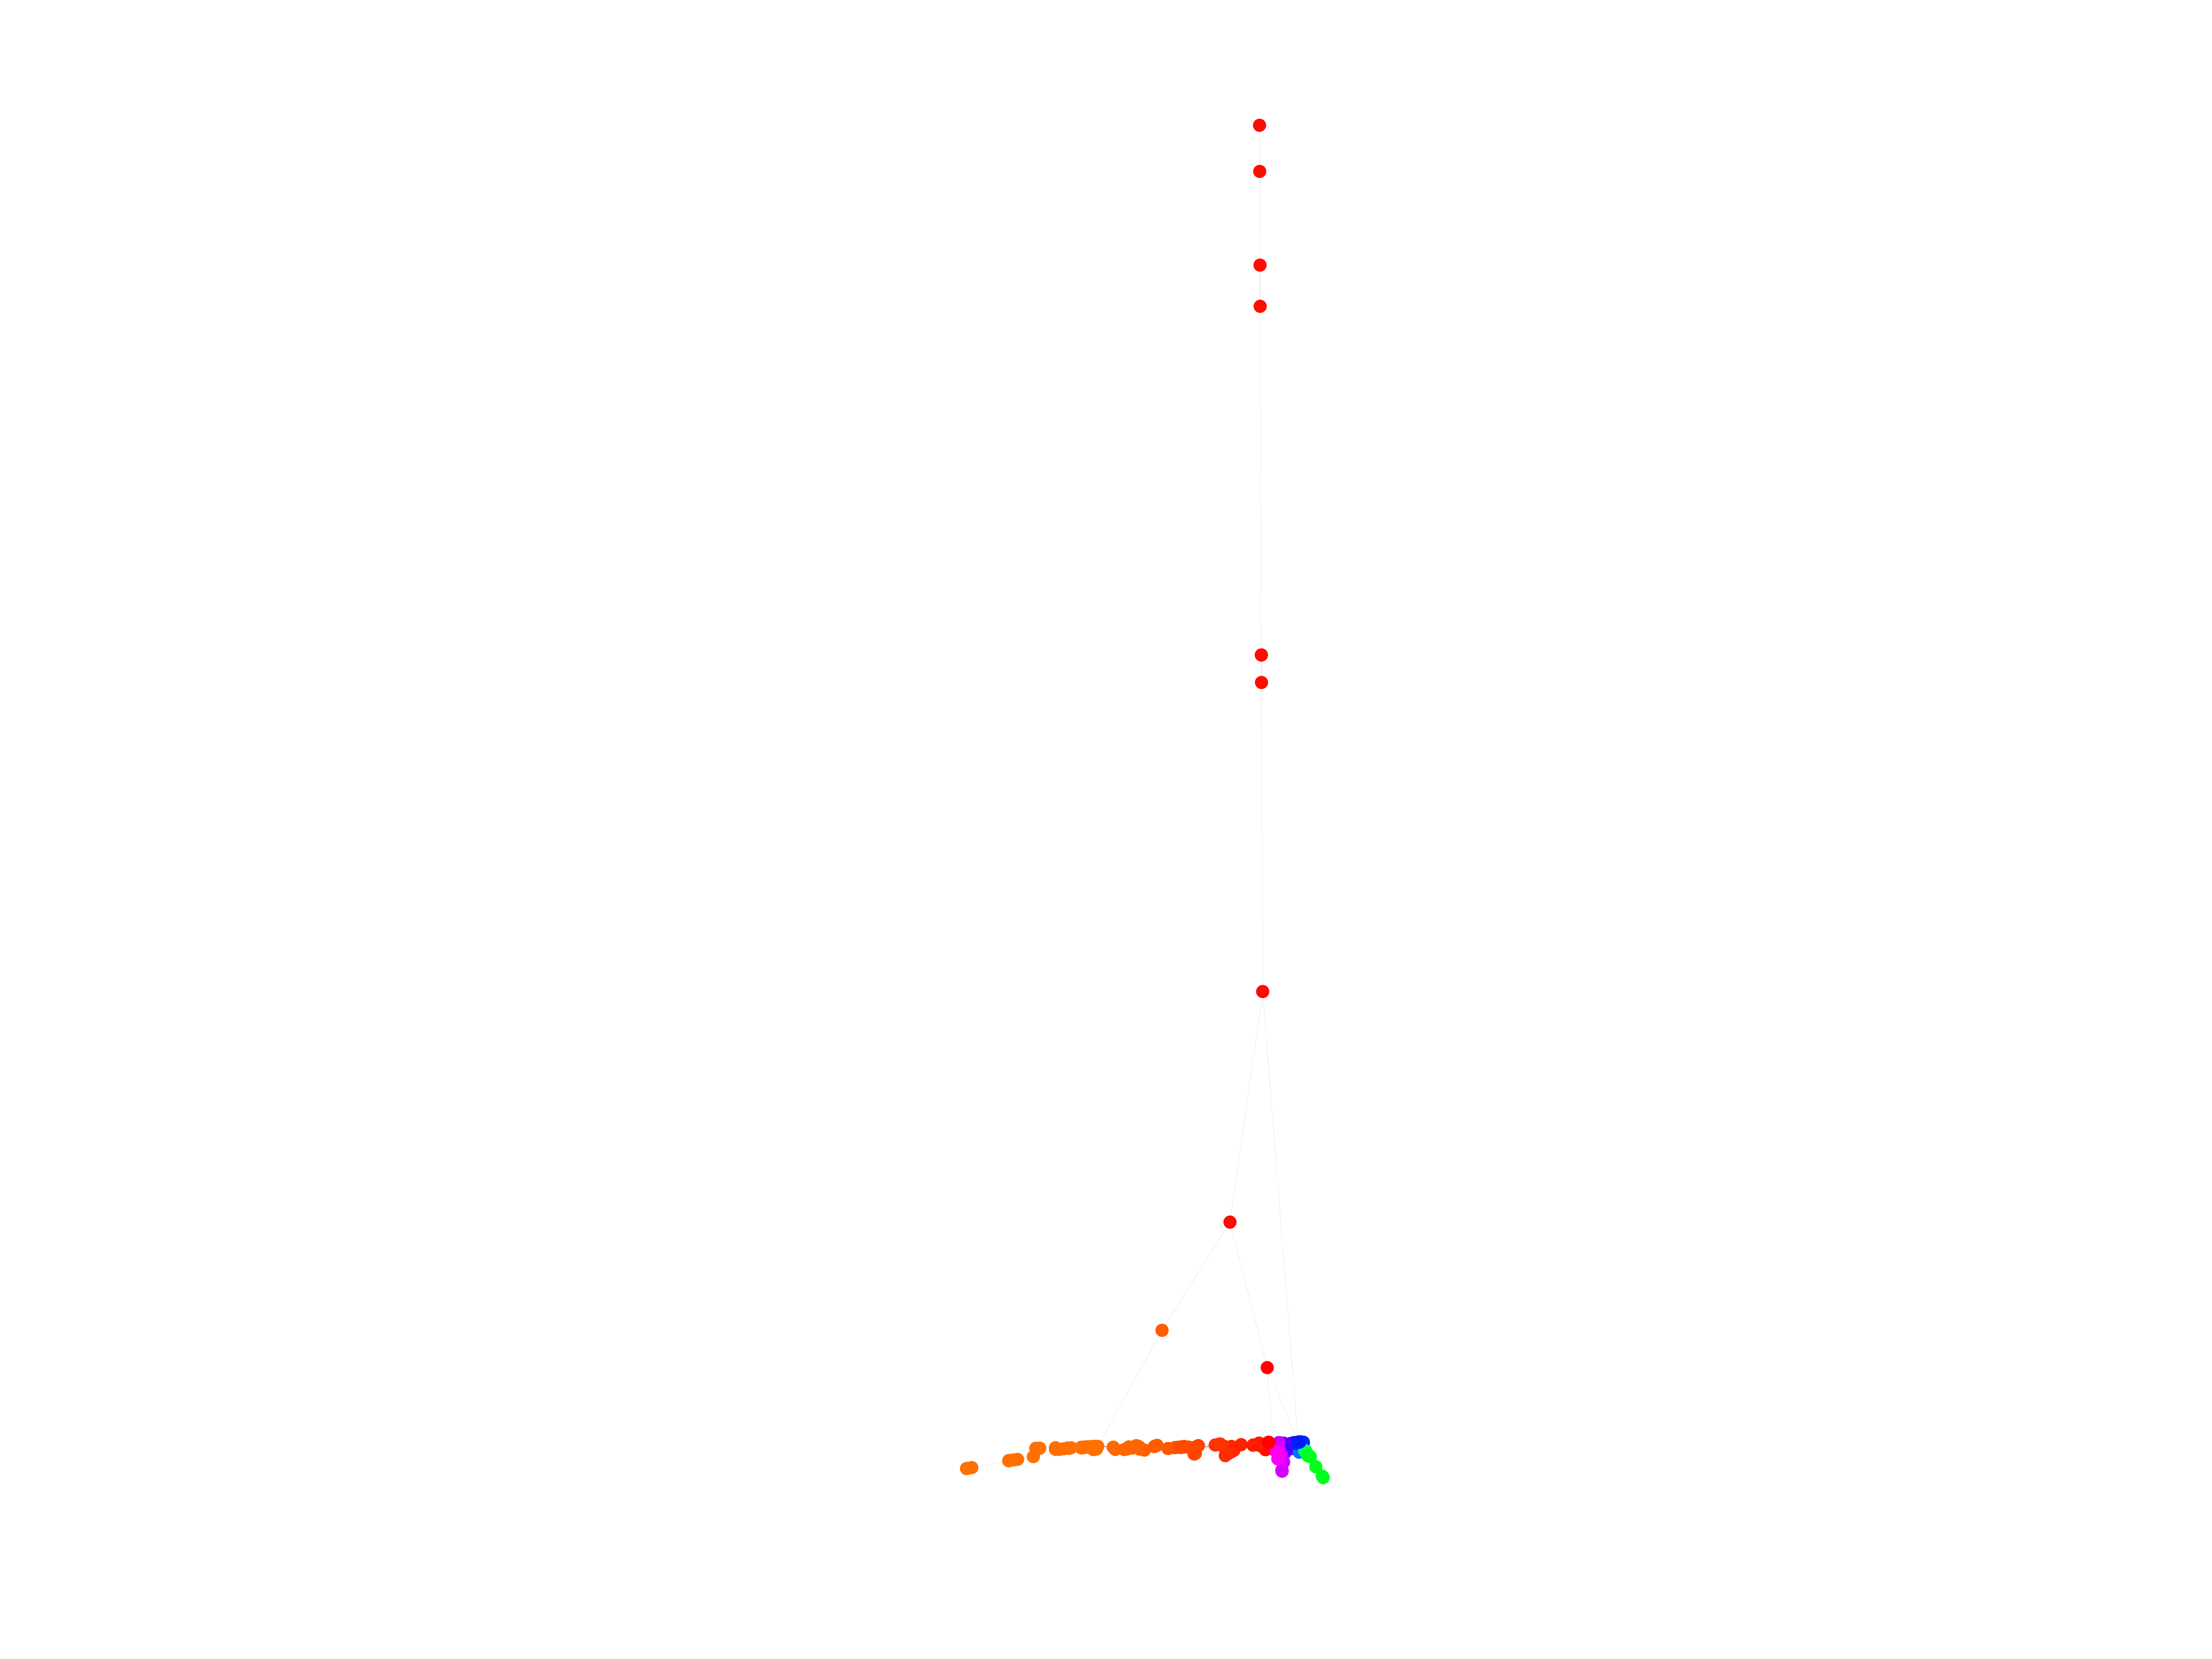
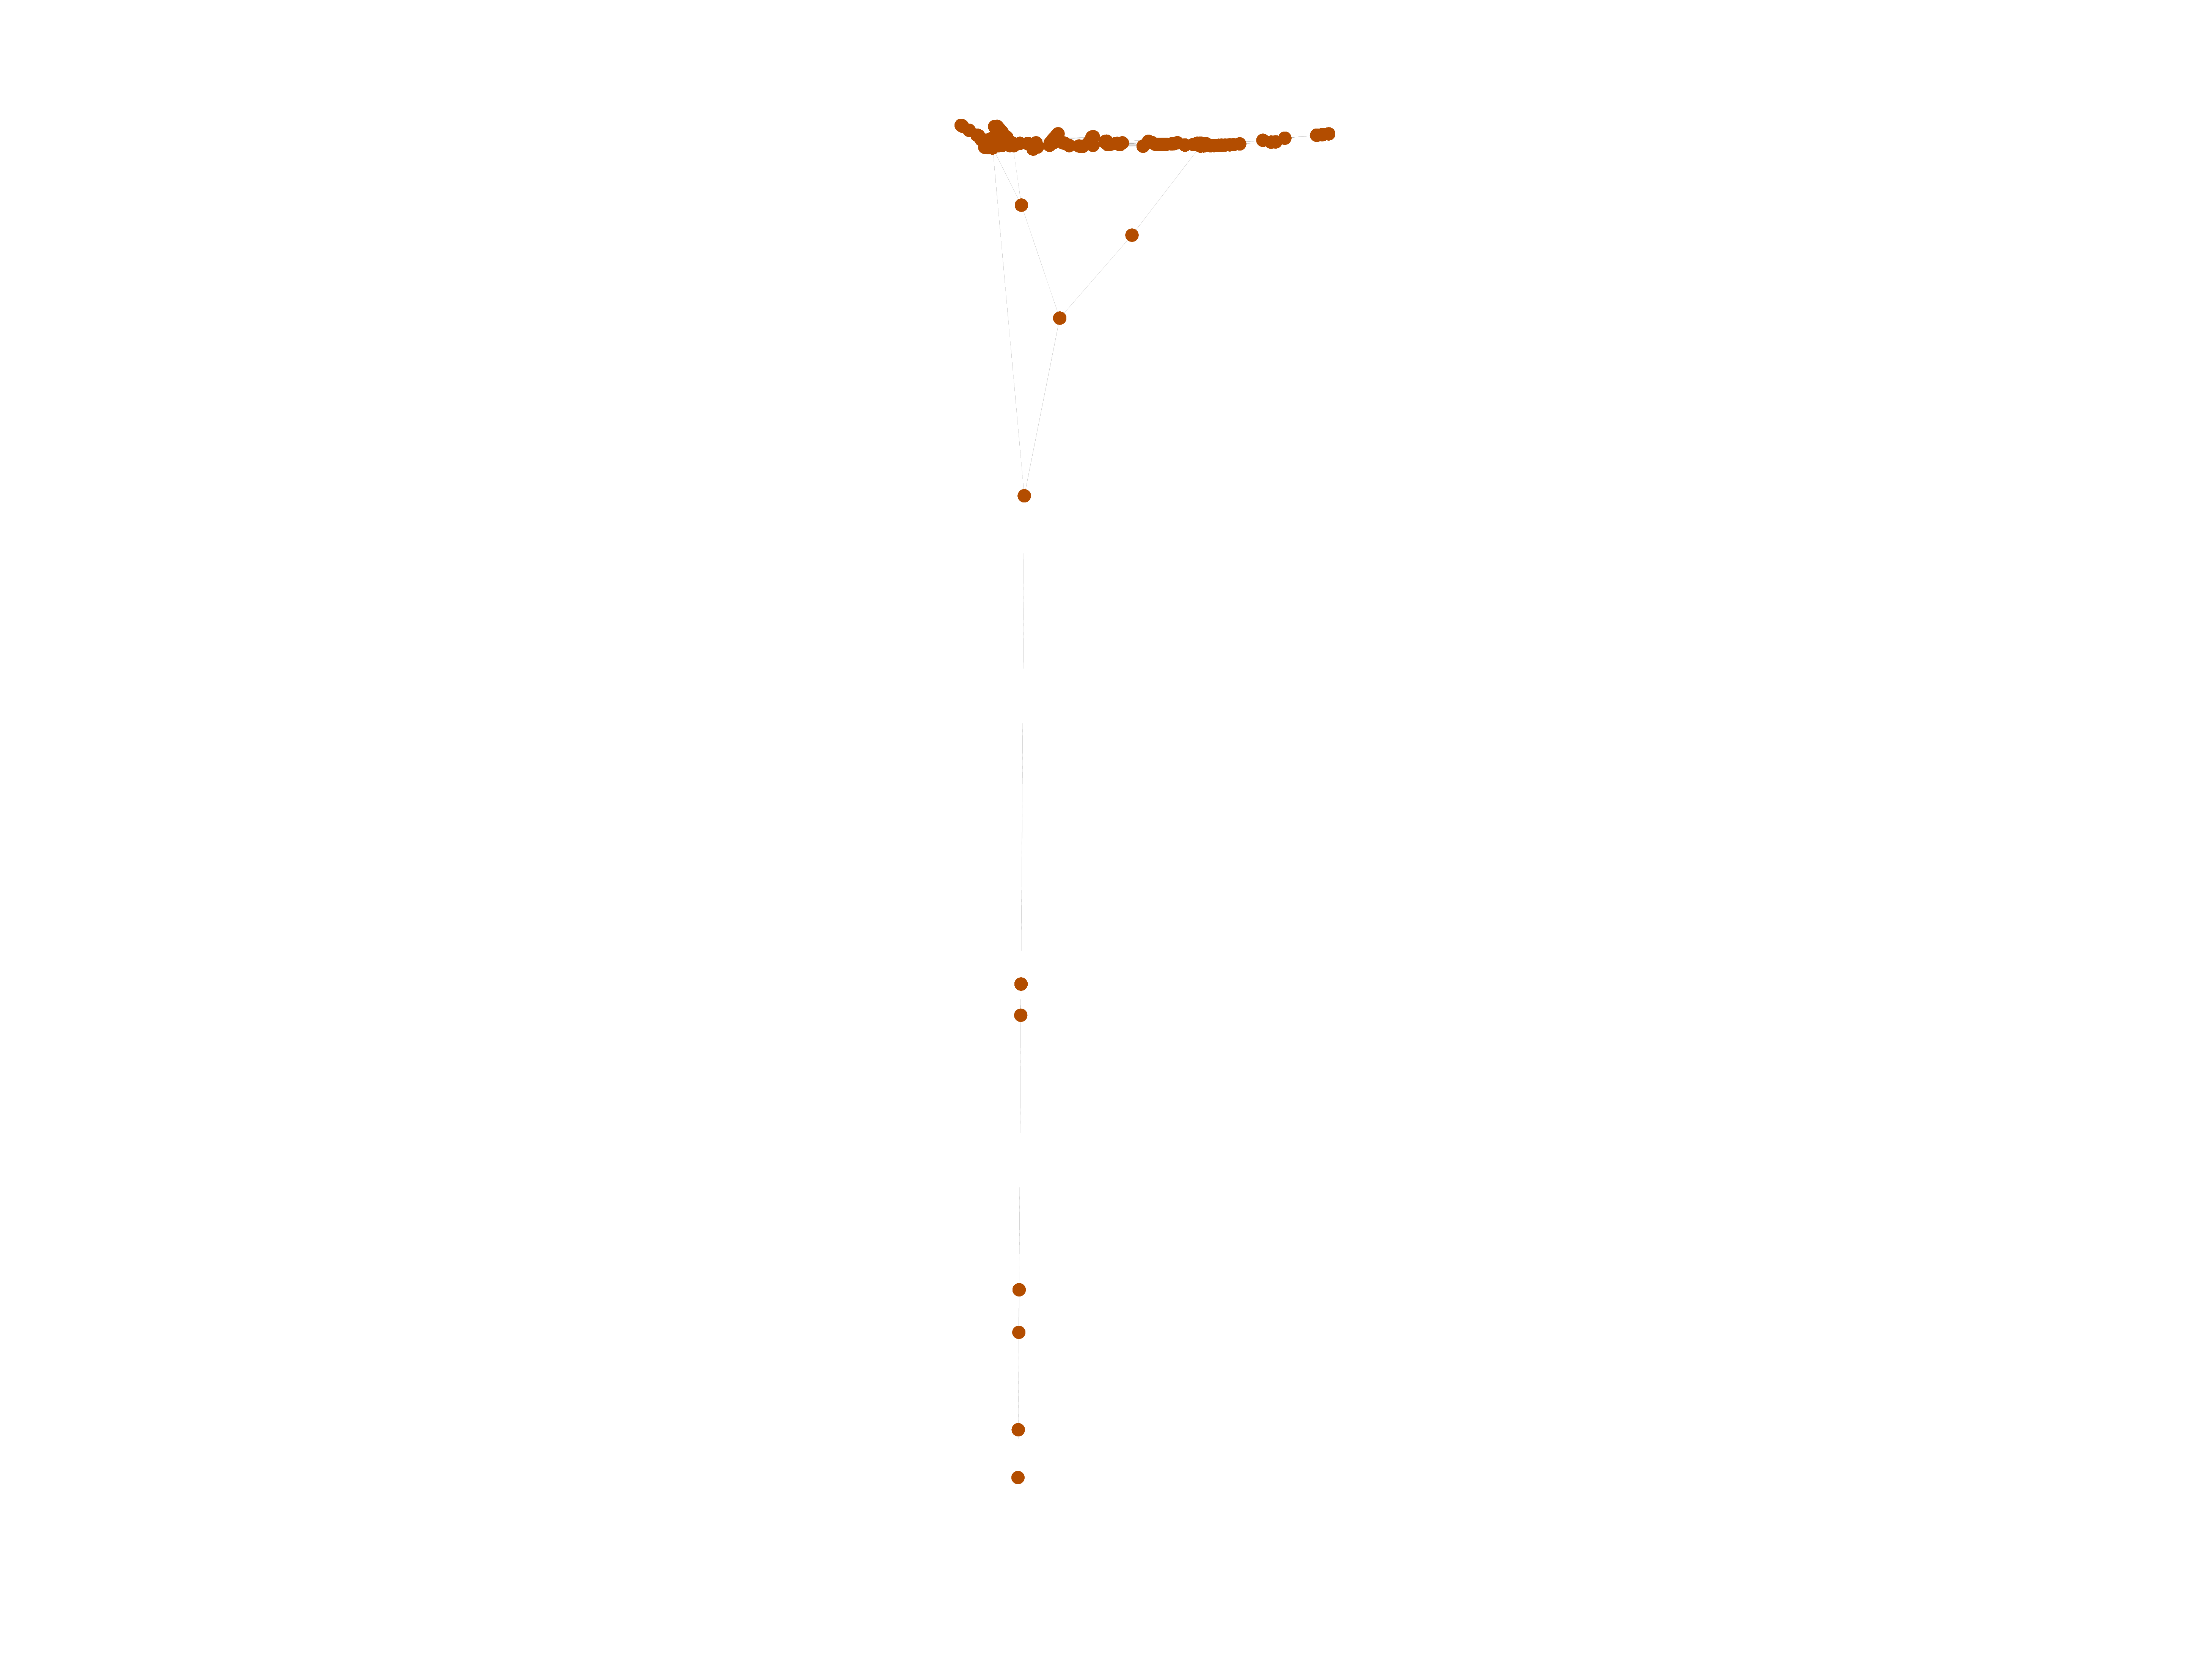
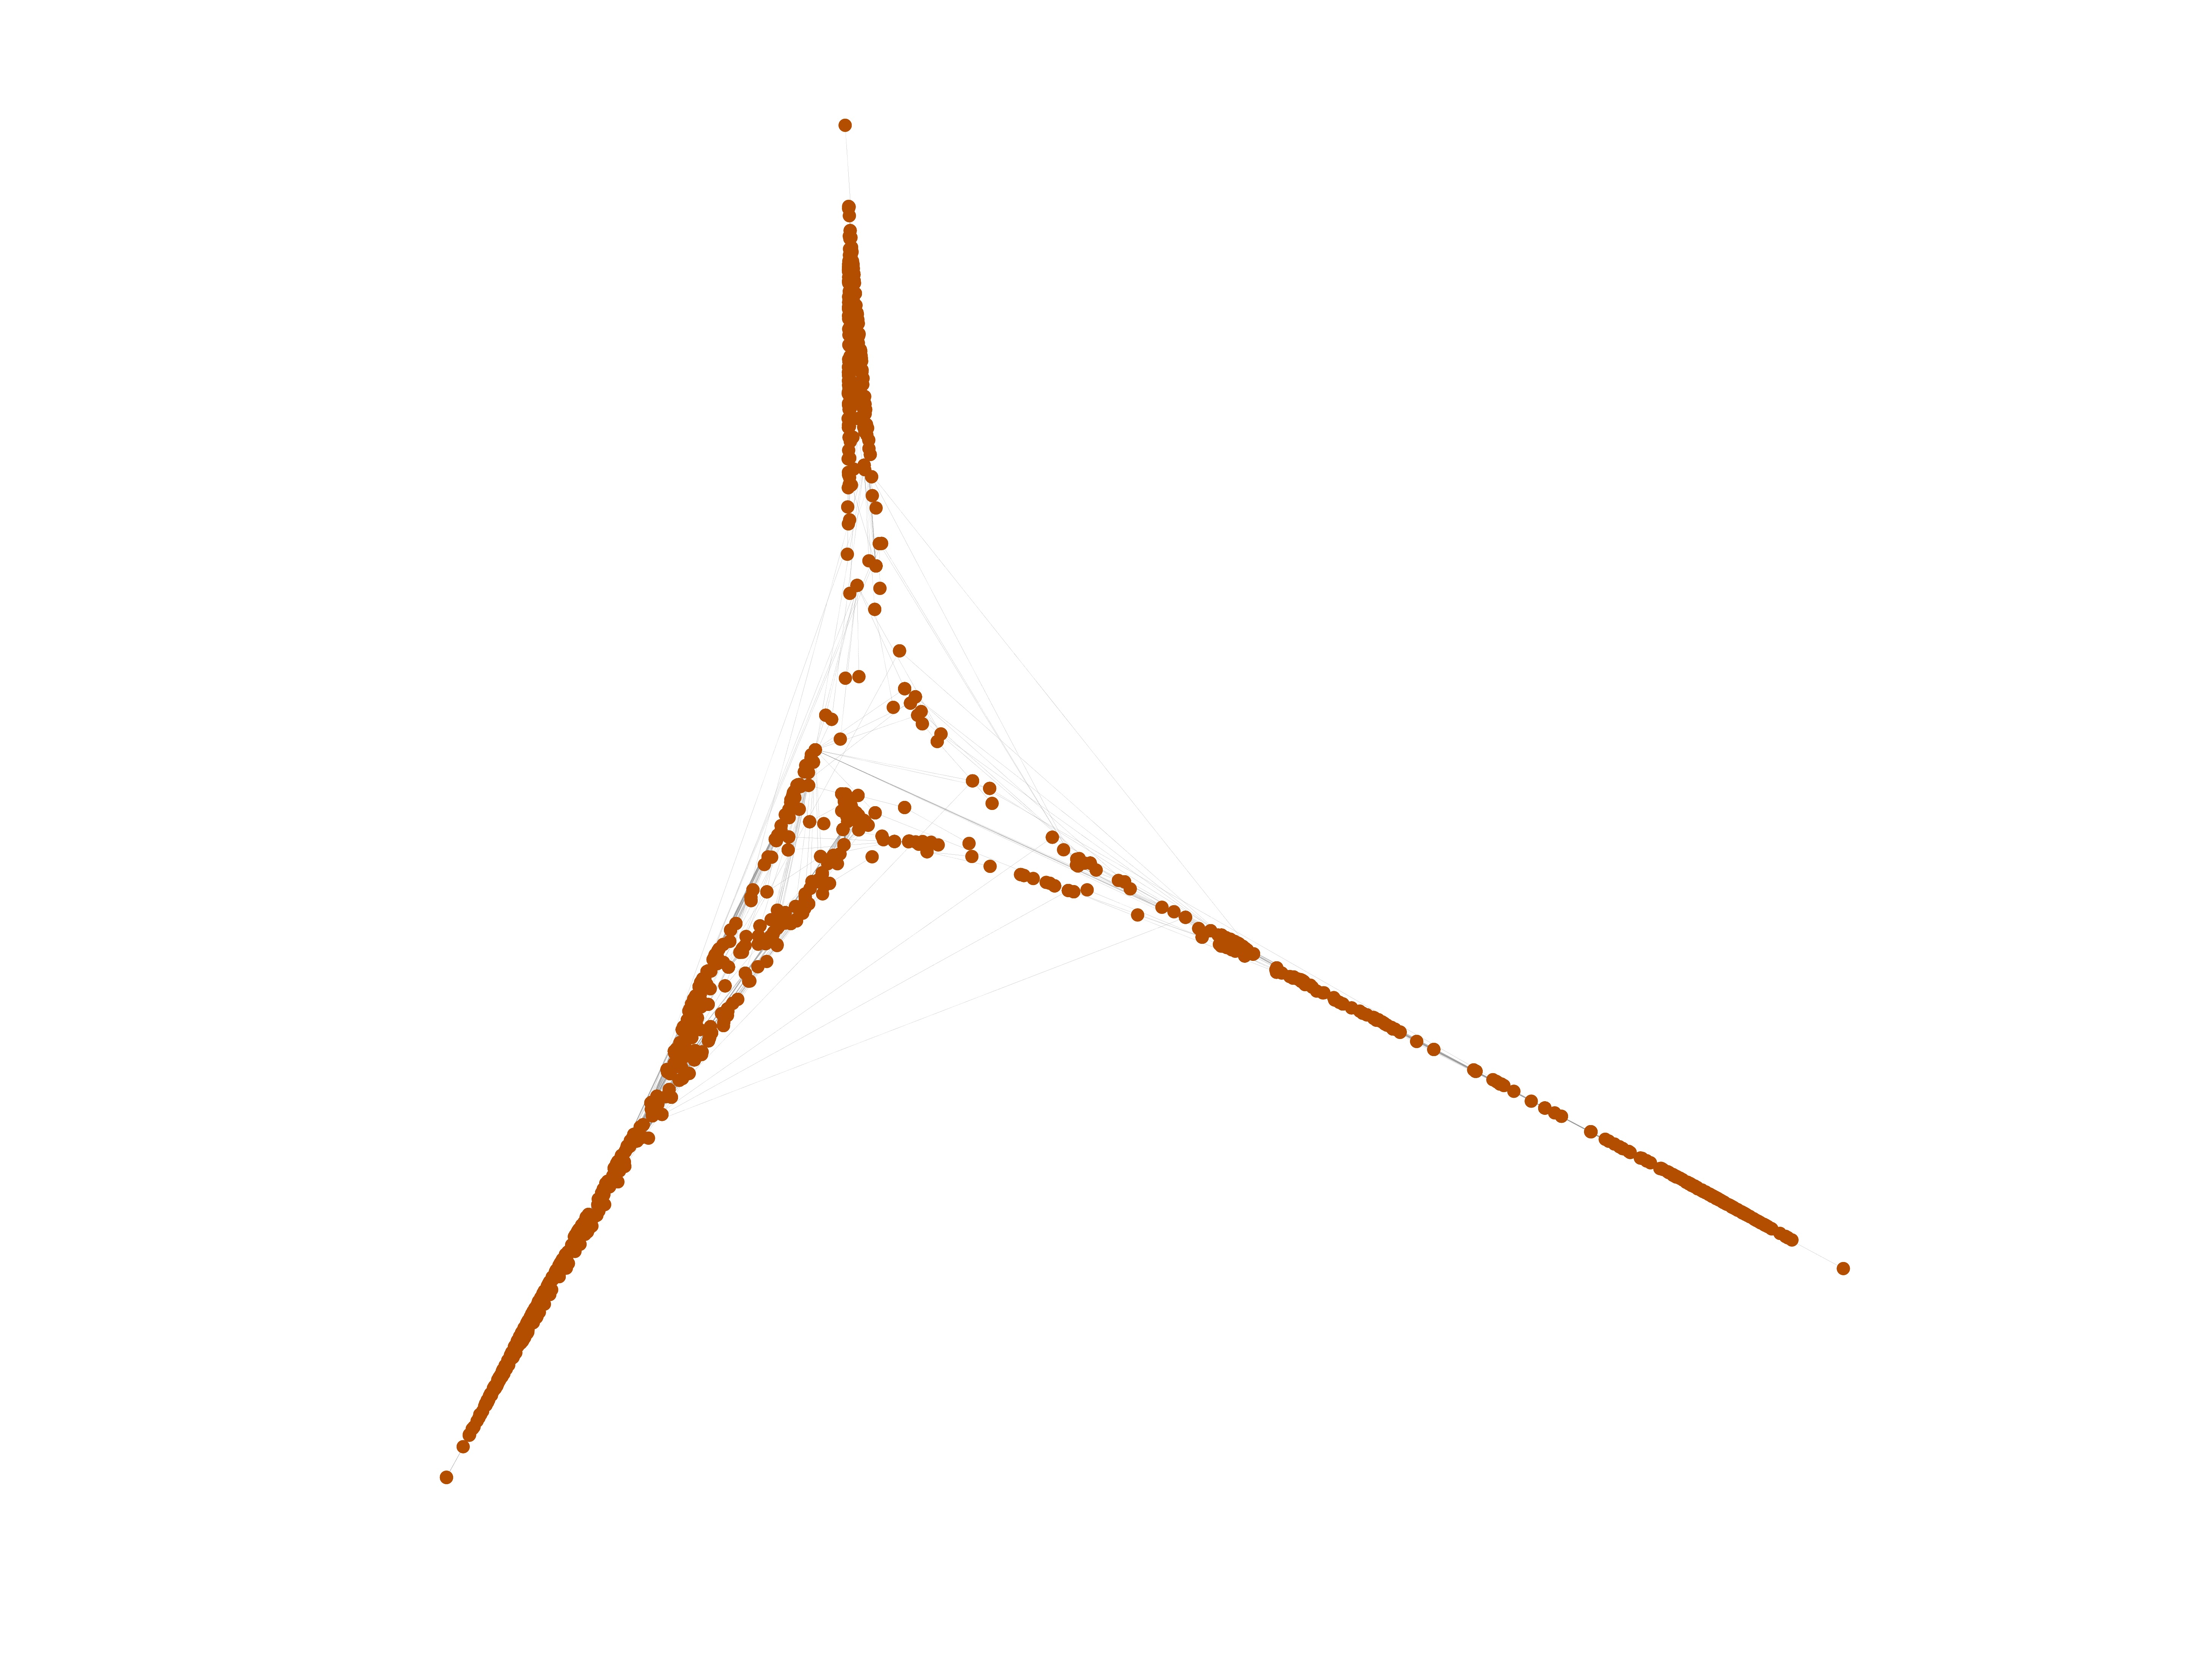
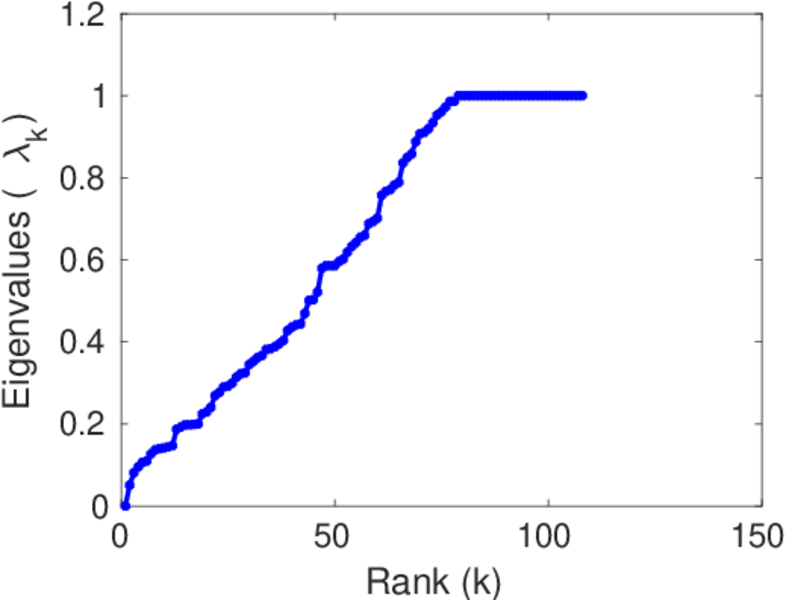
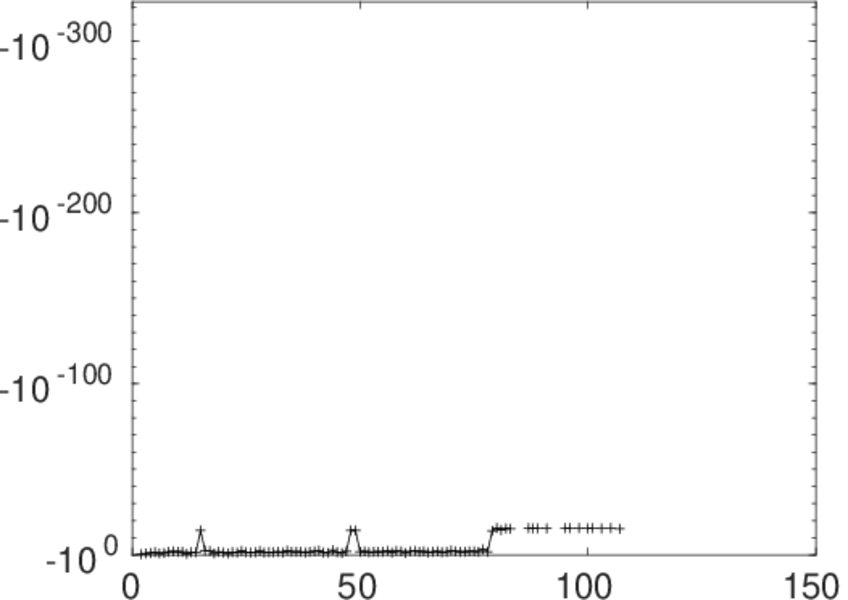
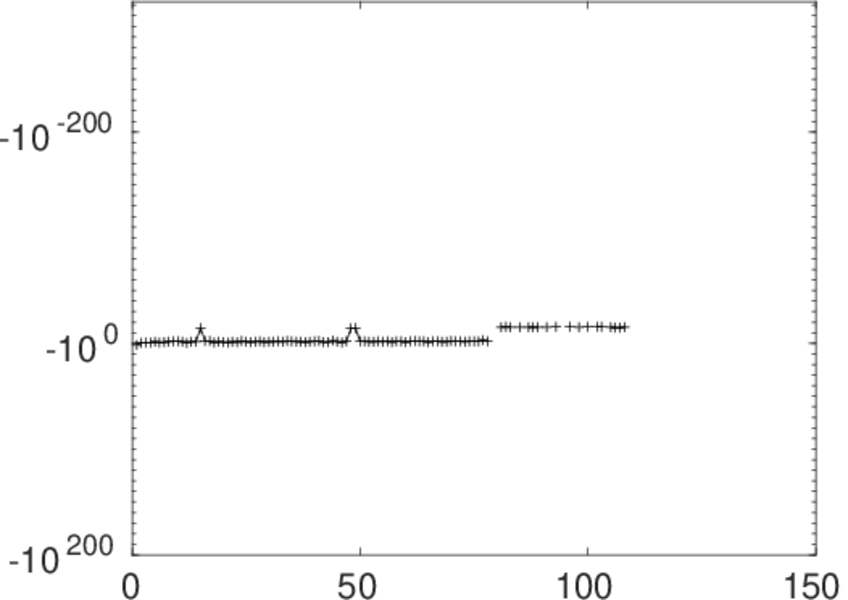
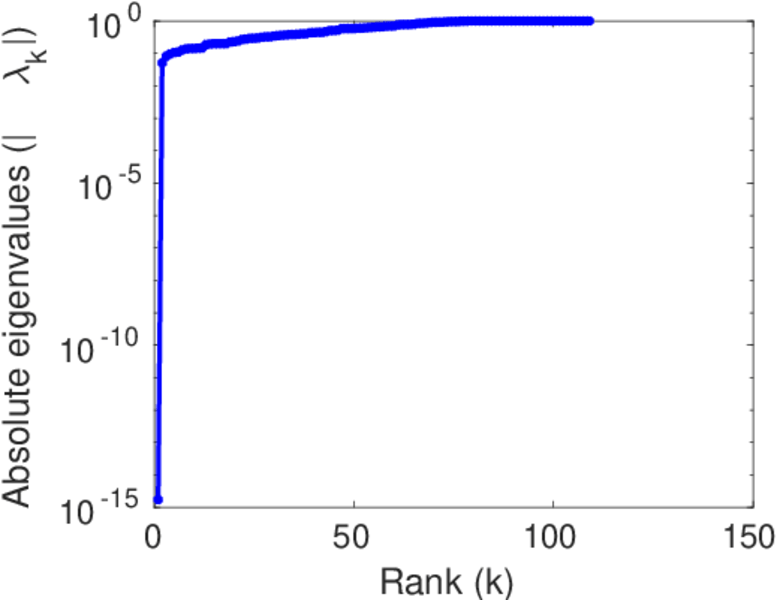
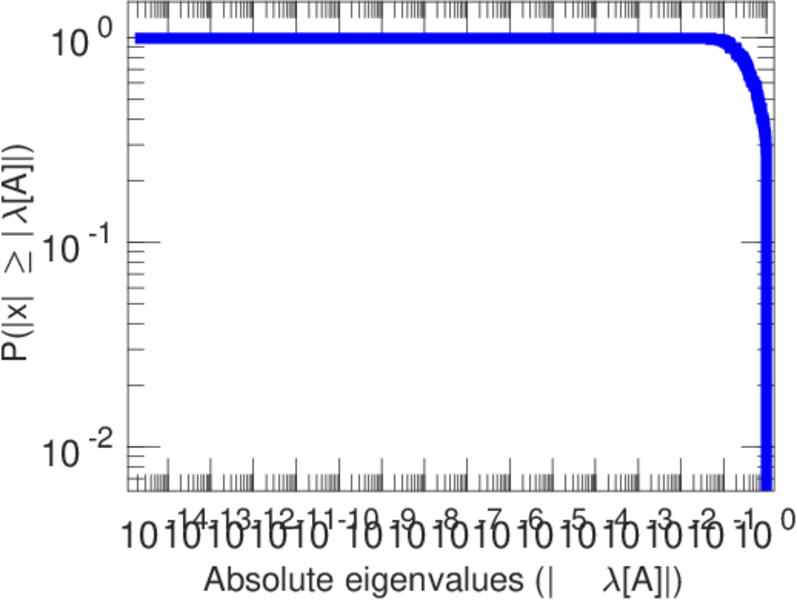
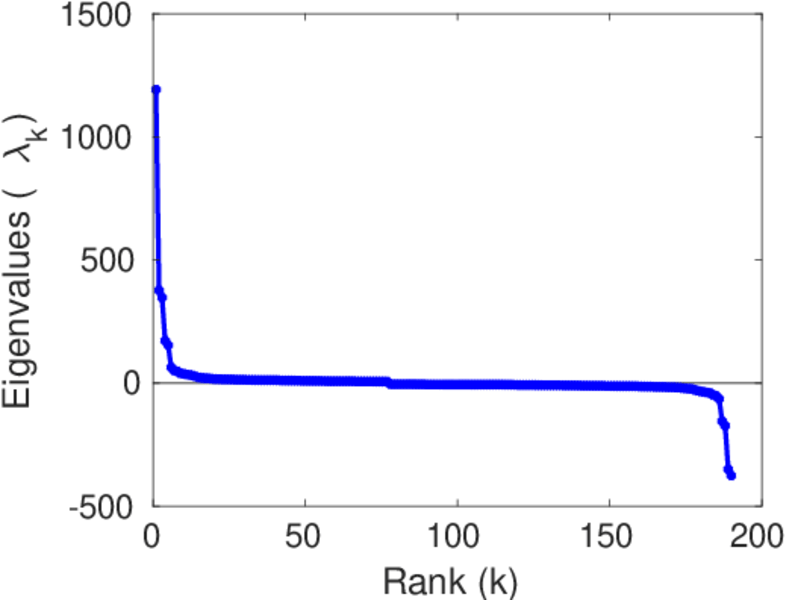
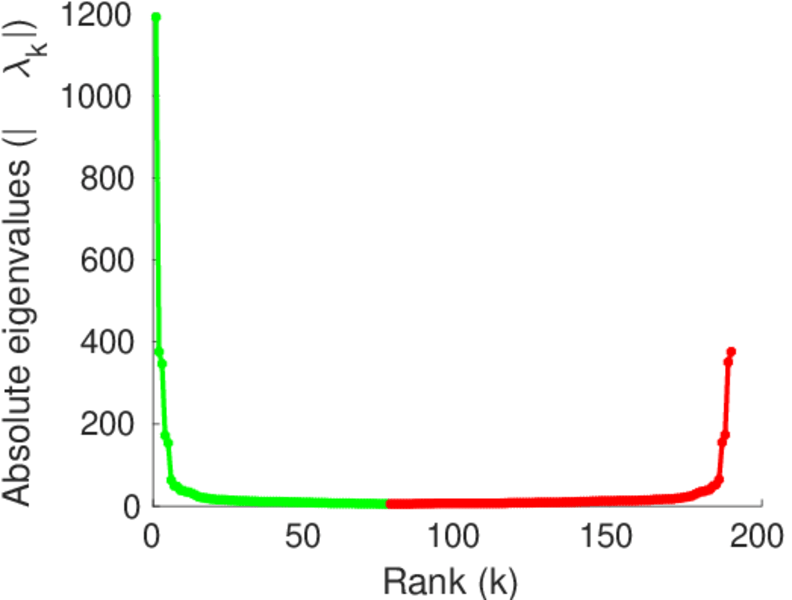
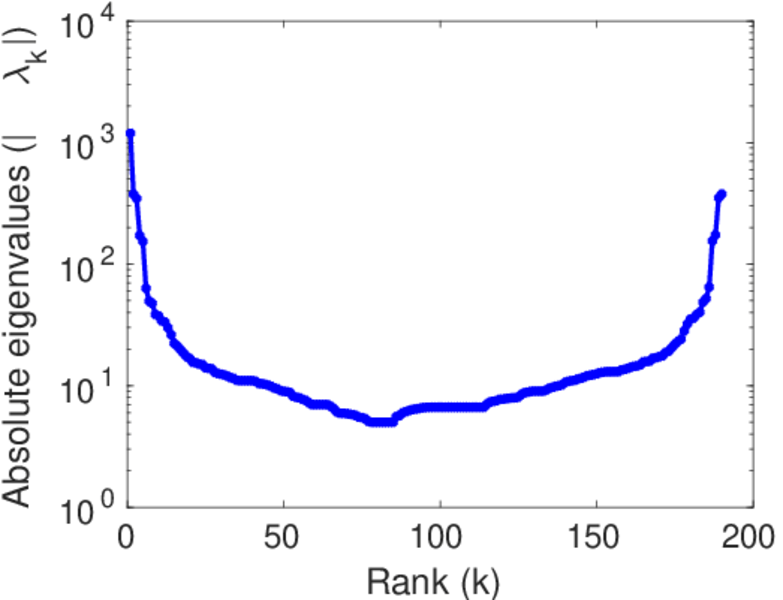
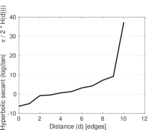
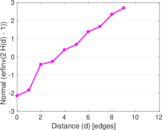
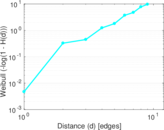
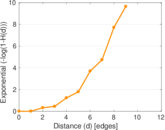
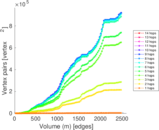
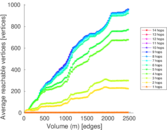
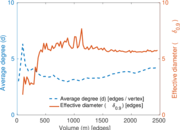
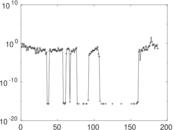
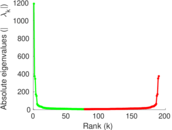
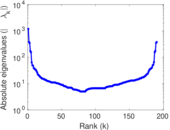
Plots


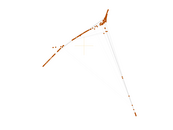
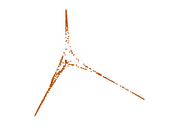


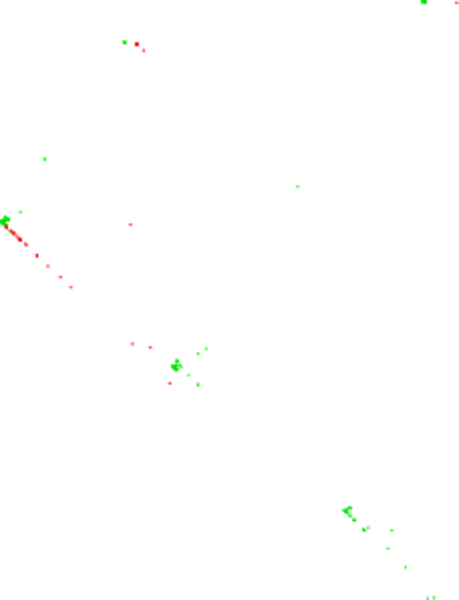
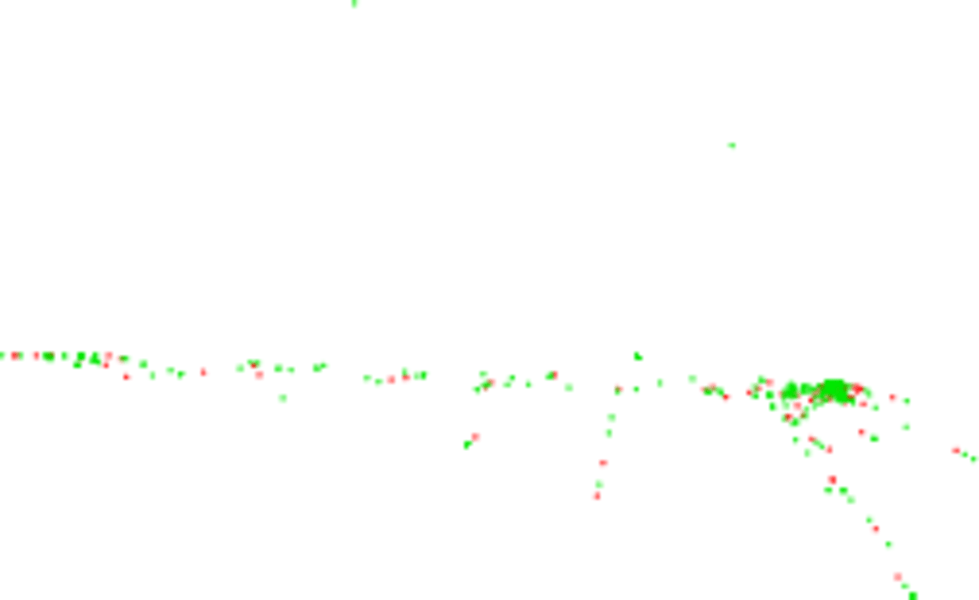
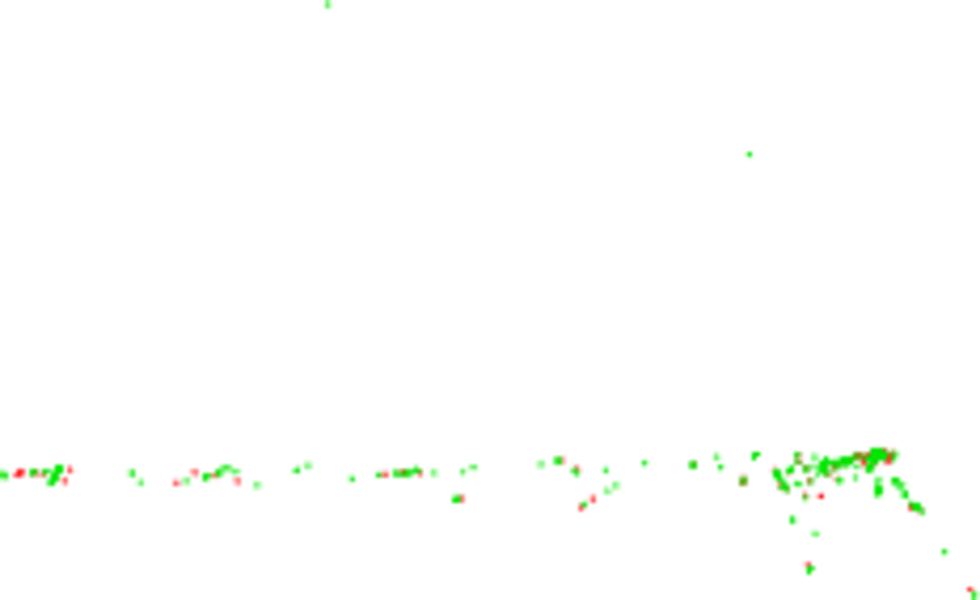
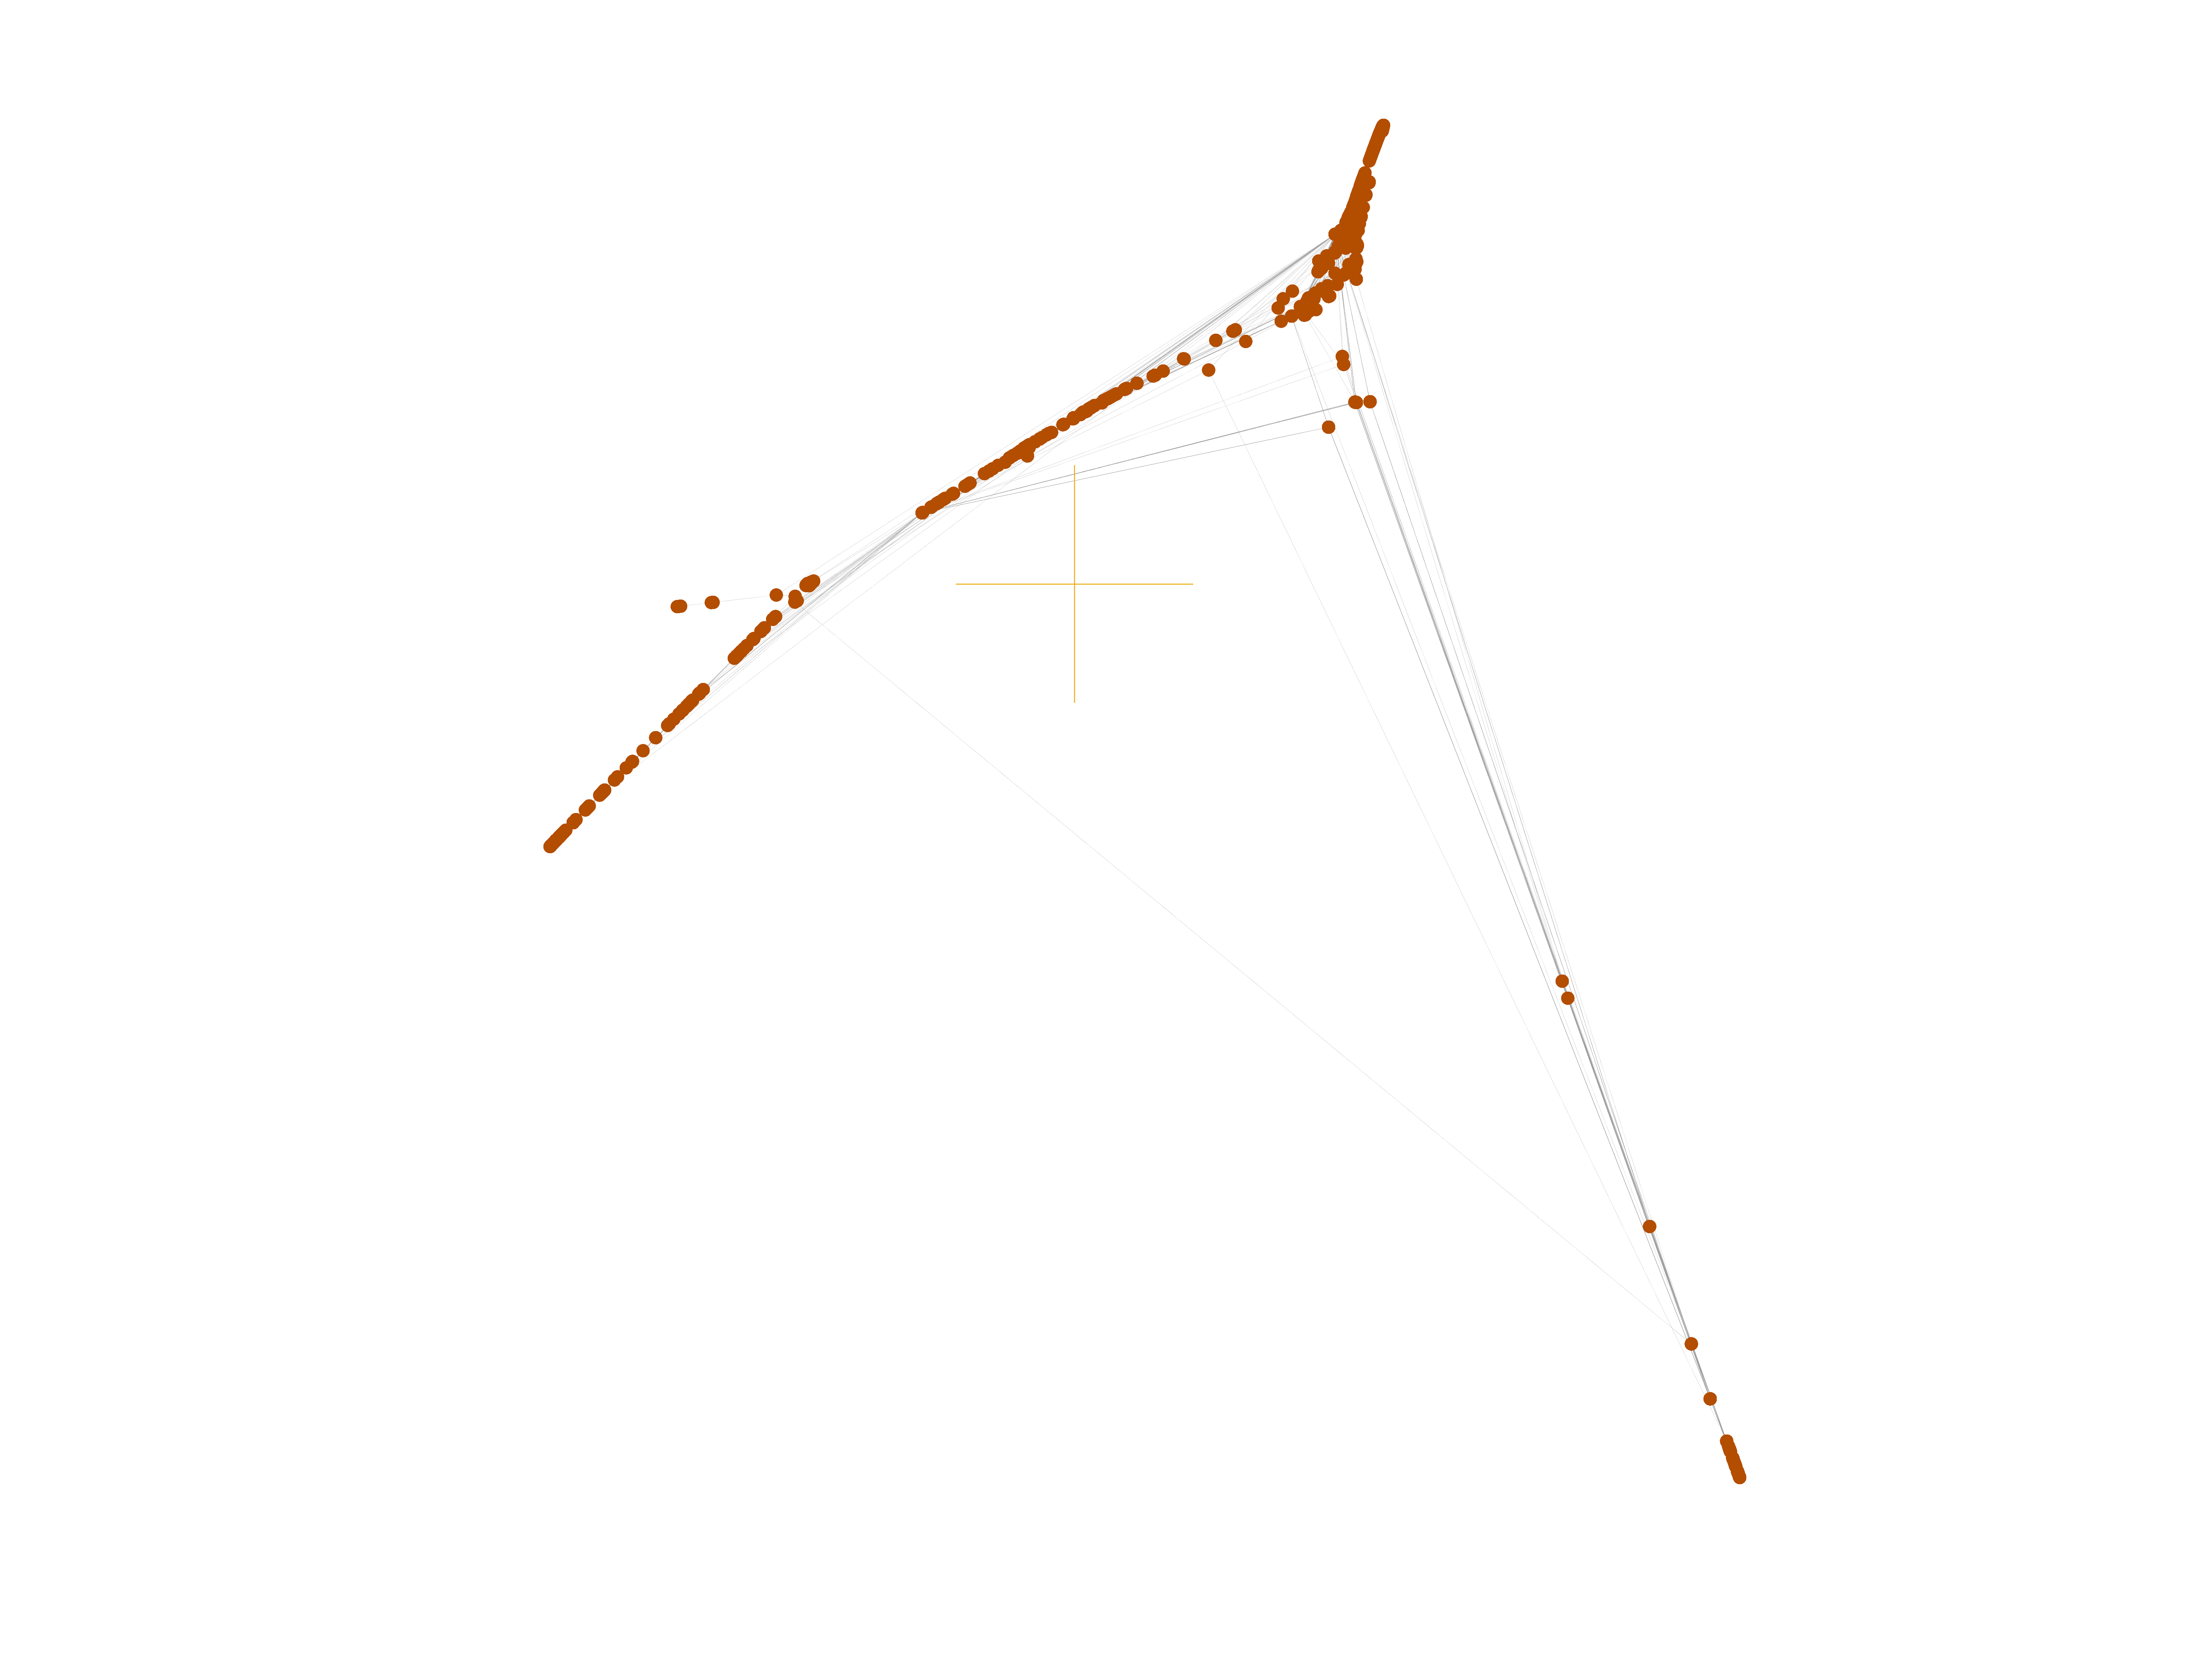
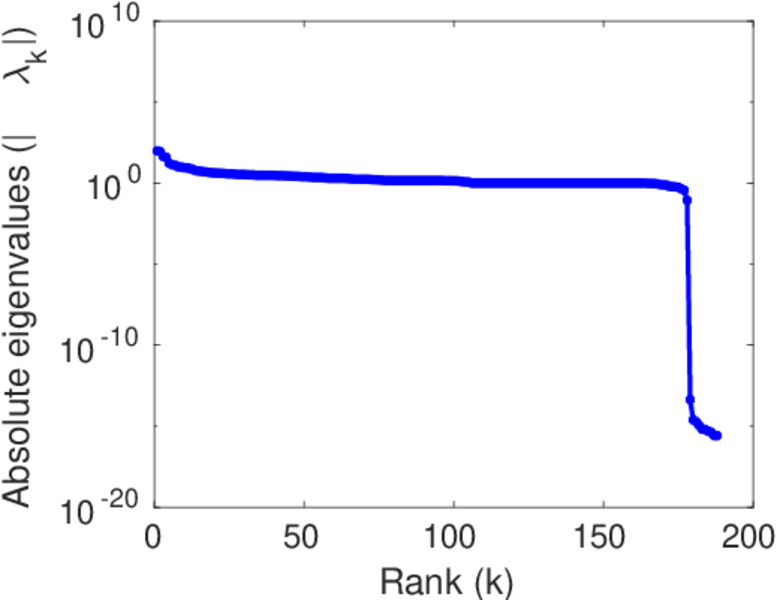
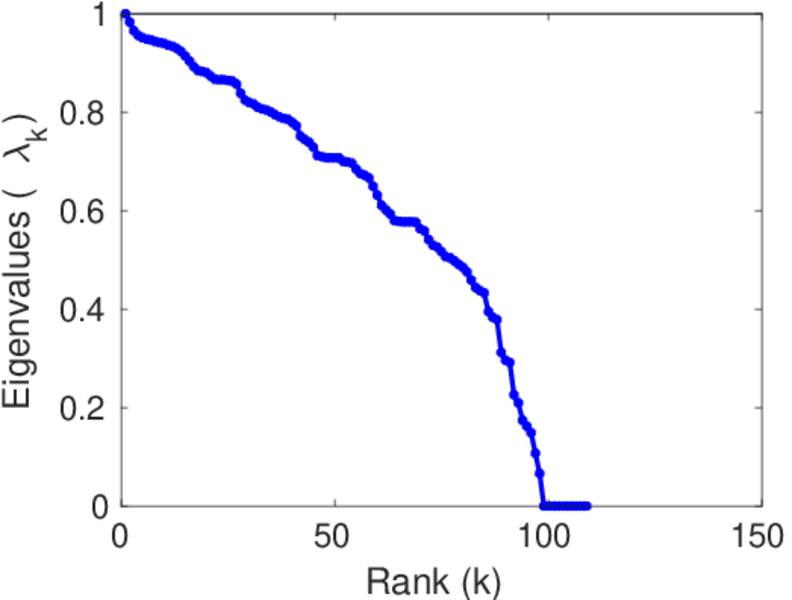
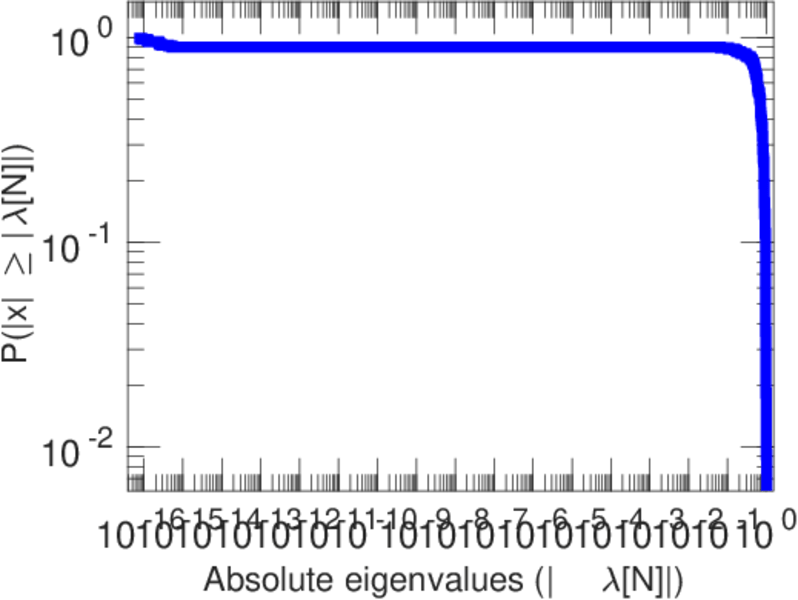
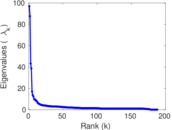
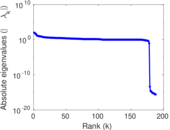
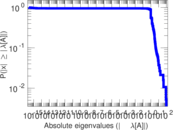
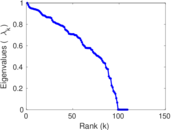
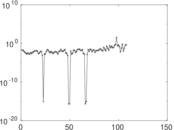
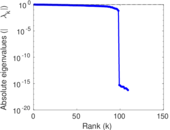
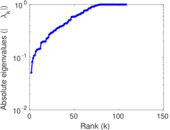
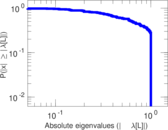
Matrix decompositions plots


Downloads
References
|
[1]
|
Jérôme Kunegis.
KONECT – The Koblenz Network Collection.
In Proc. Int. Conf. on World Wide Web Companion, pages
1343–1350, 2013.
[ http ]
|
|
[2]
|
Wikimedia Foundation.
Wikimedia downloads.
http://dumps.wikimedia.org/, January 2010.
|
 KONECT ‣ Networks ‣
Buy Me a Coffee
KONECT ‣ Networks ‣
Buy Me a Coffee