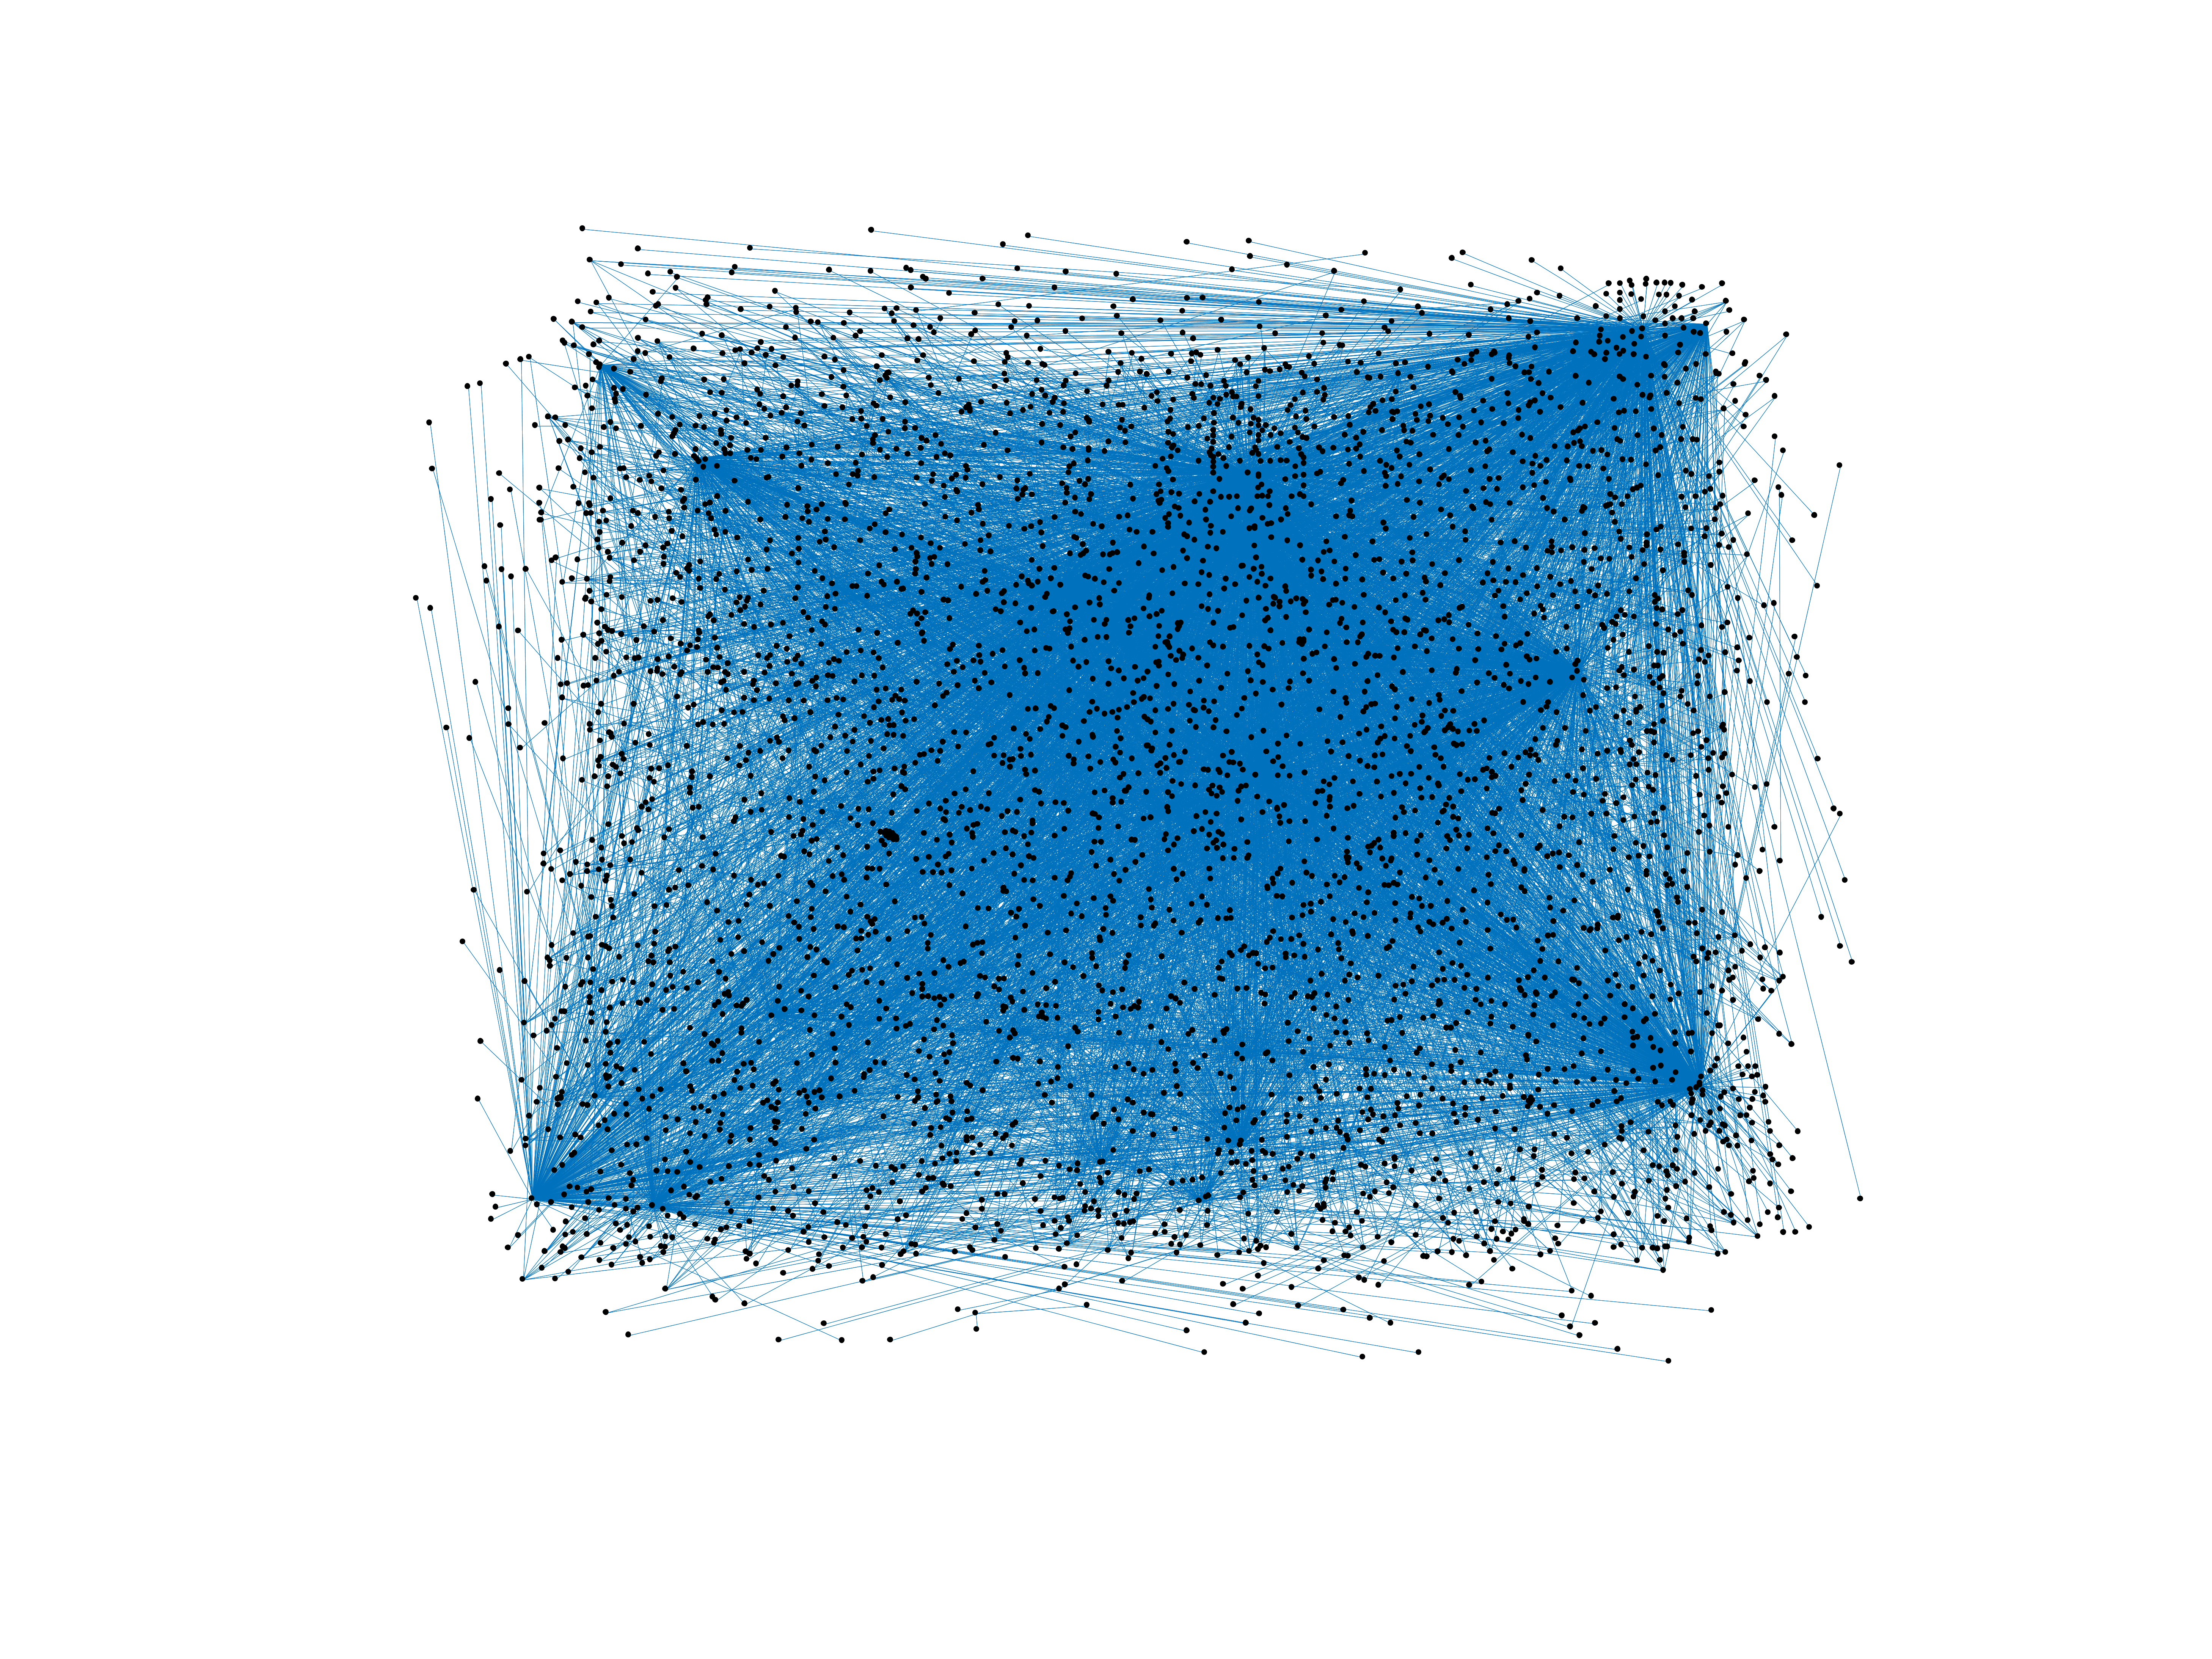
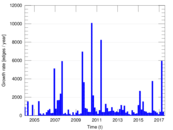
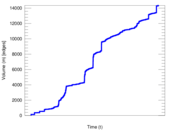
Wiktionary edits (mr)
This is the bipartite edit network of the Marathi Wiktionary. It contains users
and pages from the Marathi Wiktionary, connected by edit events. Each edge
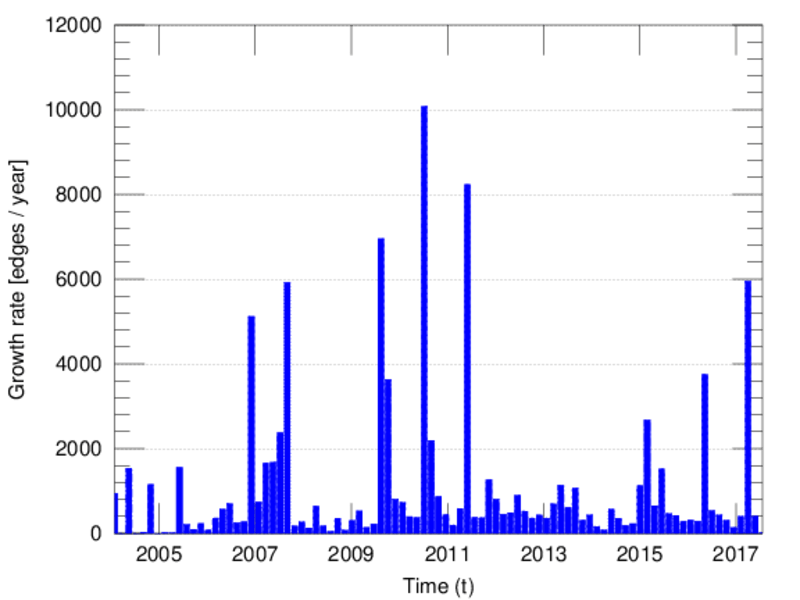
represents an edit. The dataset includes the timestamp of each edit.
Metadata
Statistics
| Size | n = | 4,337
|
| Left size | n1 = | 281
|
| Right size | n2 = | 4,056
|
| Volume | m = | 14,353
|
| Unique edge count | m̿ = | 8,499
|
| Wedge count | s = | 2,569,349
|
| Claw count | z = | 800,416,746
|
| Cross count | x = | 224,740,371,118
|
| Square count | q = | 894,869
|
| 4-Tour count | T4 = | 17,460,322
|
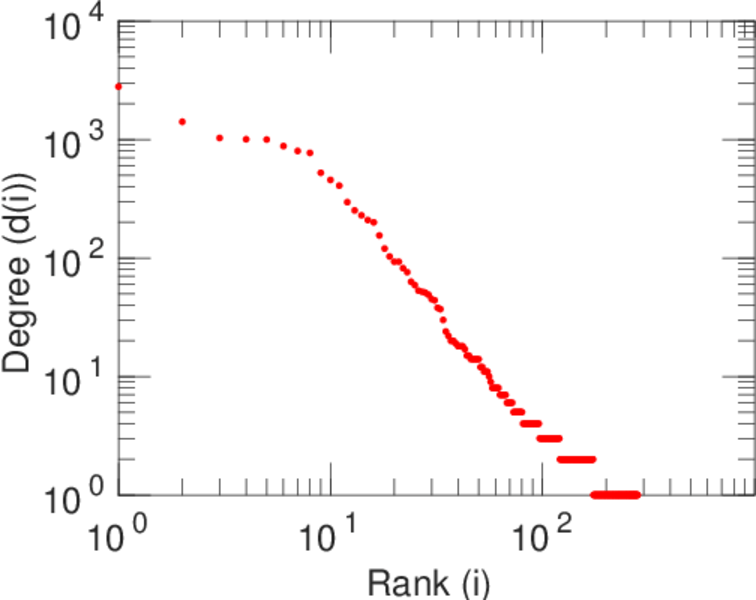
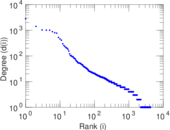
| Maximum degree | dmax = | 2,793
|
| Maximum left degree | d1max = | 2,793
|
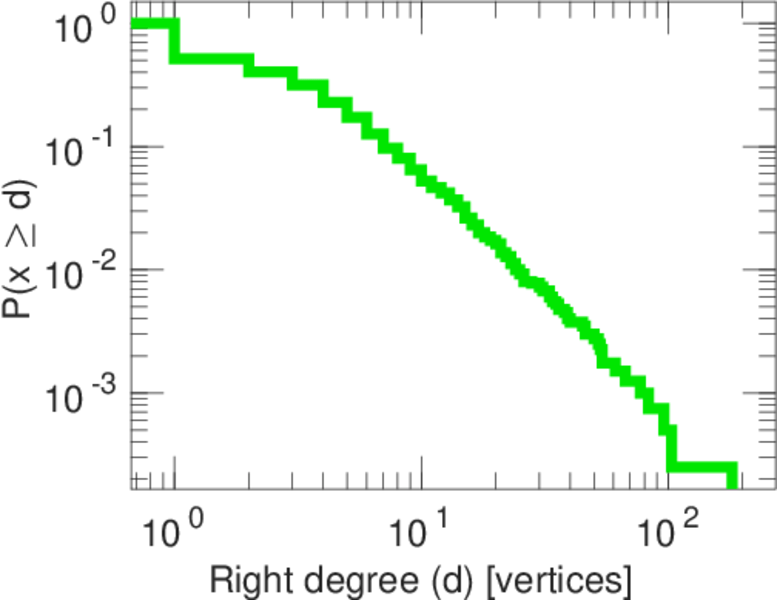
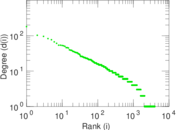
| Maximum right degree | d2max = | 181
|
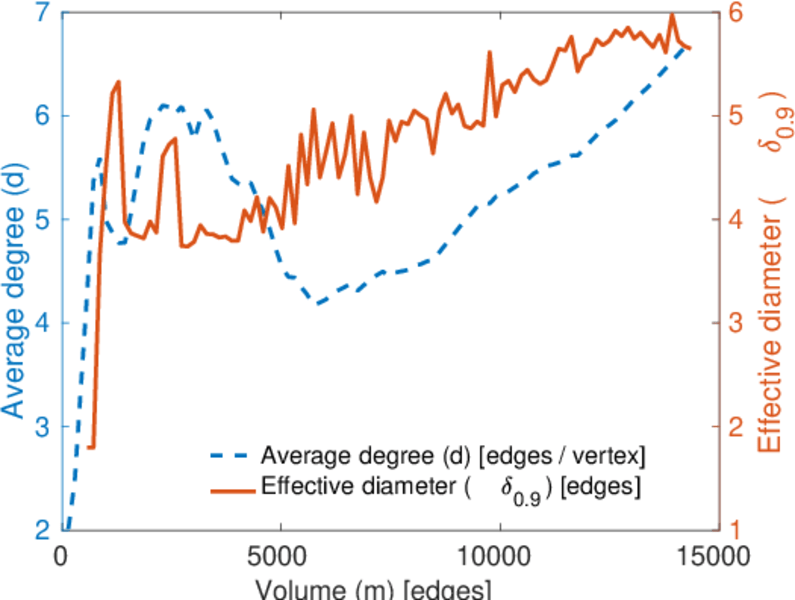
| Average degree | d = | 6.618 86
|
| Average left degree | d1 = | 51.078 3
|
| Average right degree | d2 = | 3.538 71
|
| Fill | p = | 0.007 456 99
|
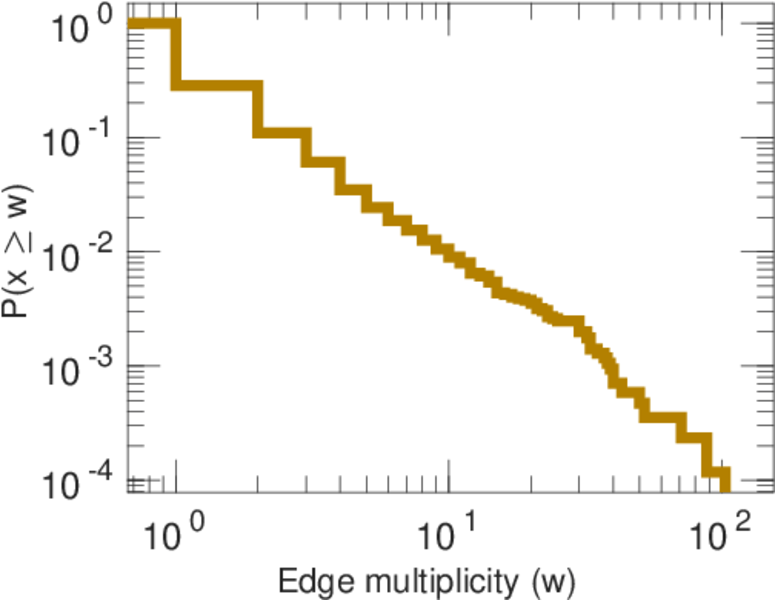
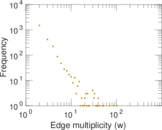
| Average edge multiplicity | m̃ = | 1.688 79
|
| Size of LCC | N = | 4,018
|
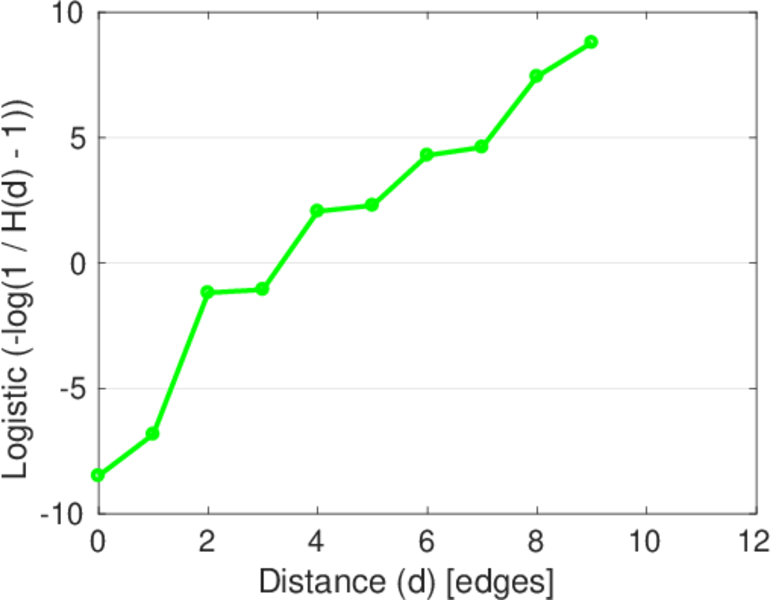
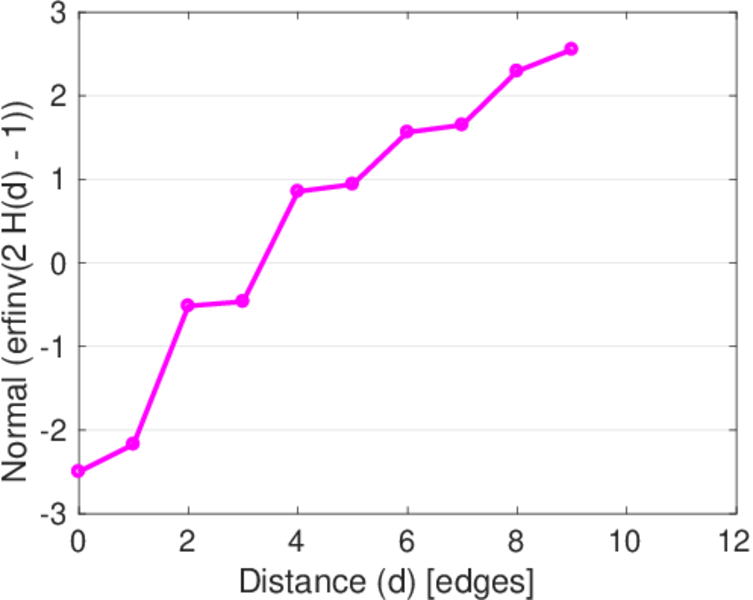
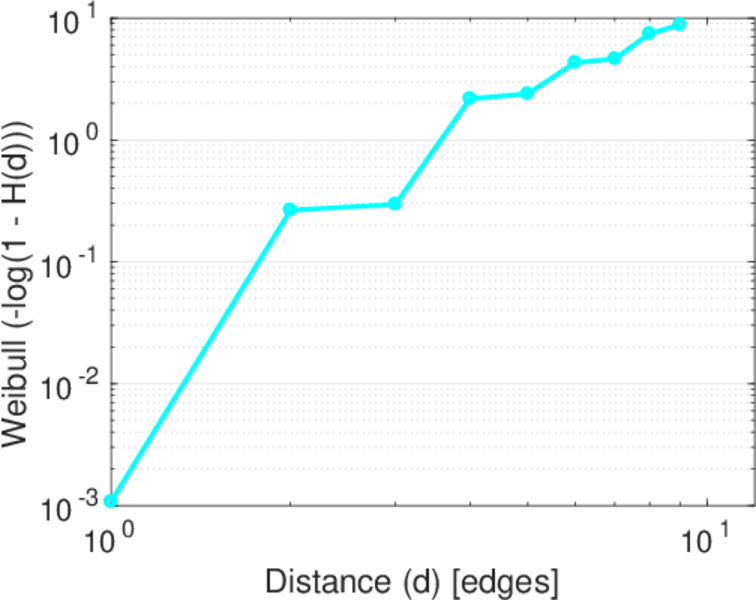
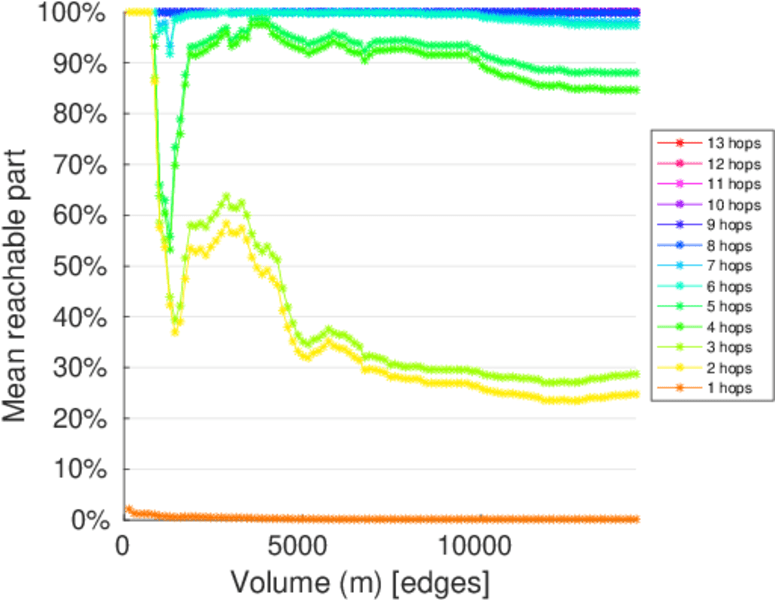
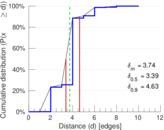
| Diameter | δ = | 13
|
| 50-Percentile effective diameter | δ0.5 = | 3.387 07
|
| 90-Percentile effective diameter | δ0.9 = | 4.631 75
|
| Median distance | δM = | 4
|
| Mean distance | δm = | 3.739 89
|
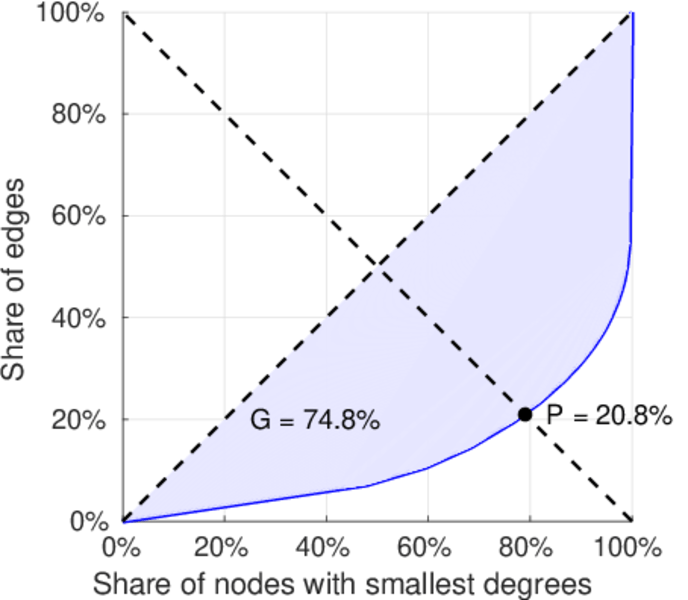
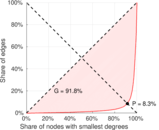
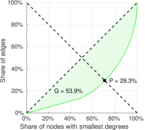
| Gini coefficient | G = | 0.755 468
|
| Balanced inequality ratio | P = | 0.203 477
|
| Left balanced inequality ratio | P1 = | 0.083 118 5
|
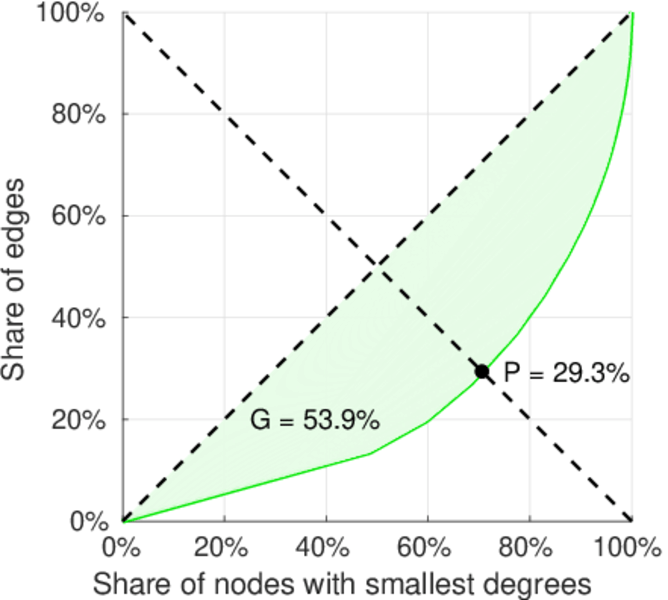
| Right balanced inequality ratio | P2 = | 0.292 622
|
| Relative edge distribution entropy | Her = | 0.757 033
|
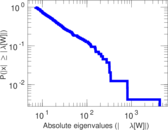
| Power law exponent | γ = | 2.845 60
|
| Tail power law exponent | γt = | 2.031 00
|
| Tail power law exponent with p | γ3 = | 2.031 00
|
| p-value | p = | 0.000 00
|
| Left tail power law exponent with p | γ3,1 = | 1.511 00
|
| Left p-value | p1 = | 0.376 000
|
| Right tail power law exponent with p | γ3,2 = | 6.971 00
|
| Right p-value | p2 = | 0.394 000
|
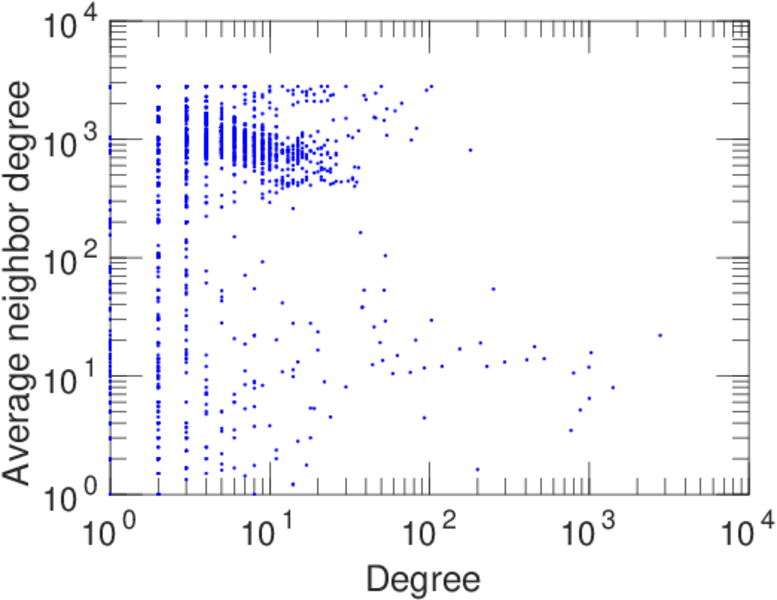
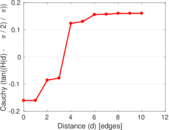
| Degree assortativity | ρ = | −0.265 499
|
| Degree assortativity p-value | pρ = | 4.372 87 × 10−137
|
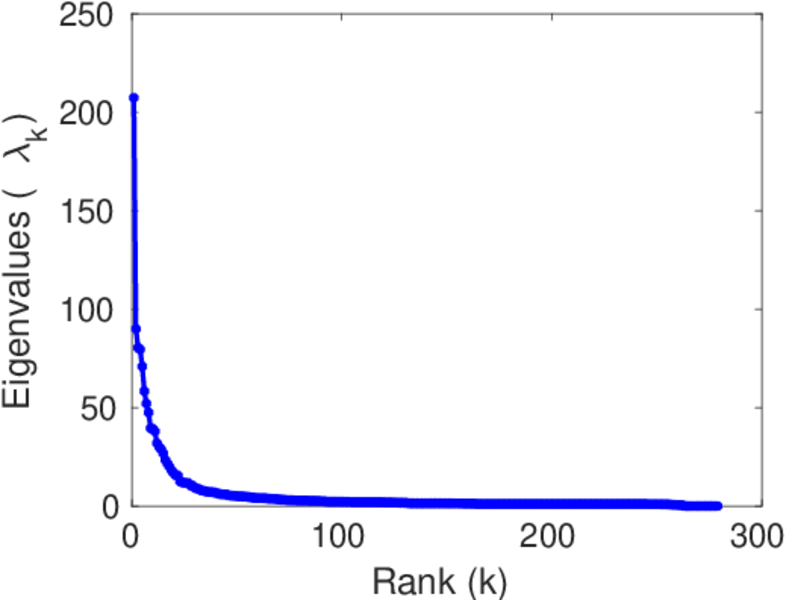
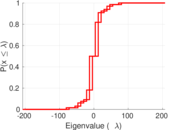
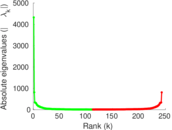
| Spectral norm | α = | 207.297
|
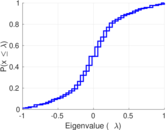
| Algebraic connectivity | a = | 0.017 514 8
|
| Spectral separation | |λ1[A] / λ2[A]| = | 2.303 84
|
| Controllability | C = | 3,750
|
| Relative controllability | Cr = | 0.876 988
|
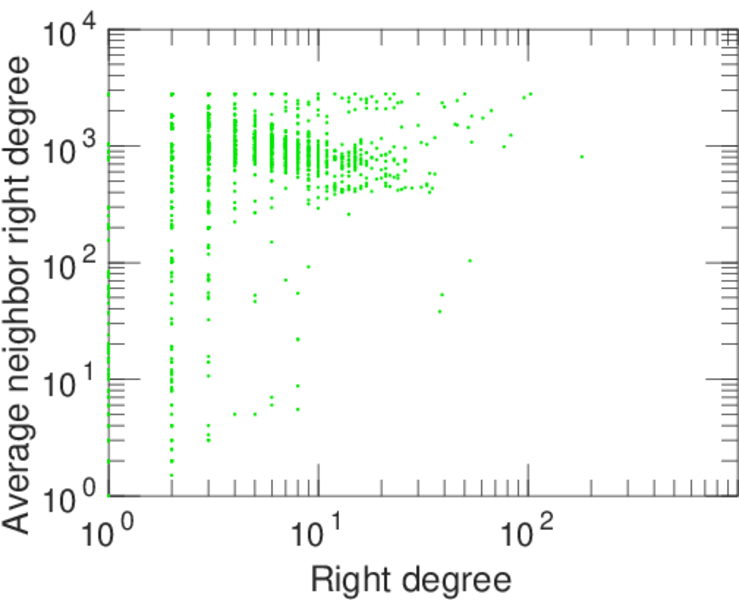
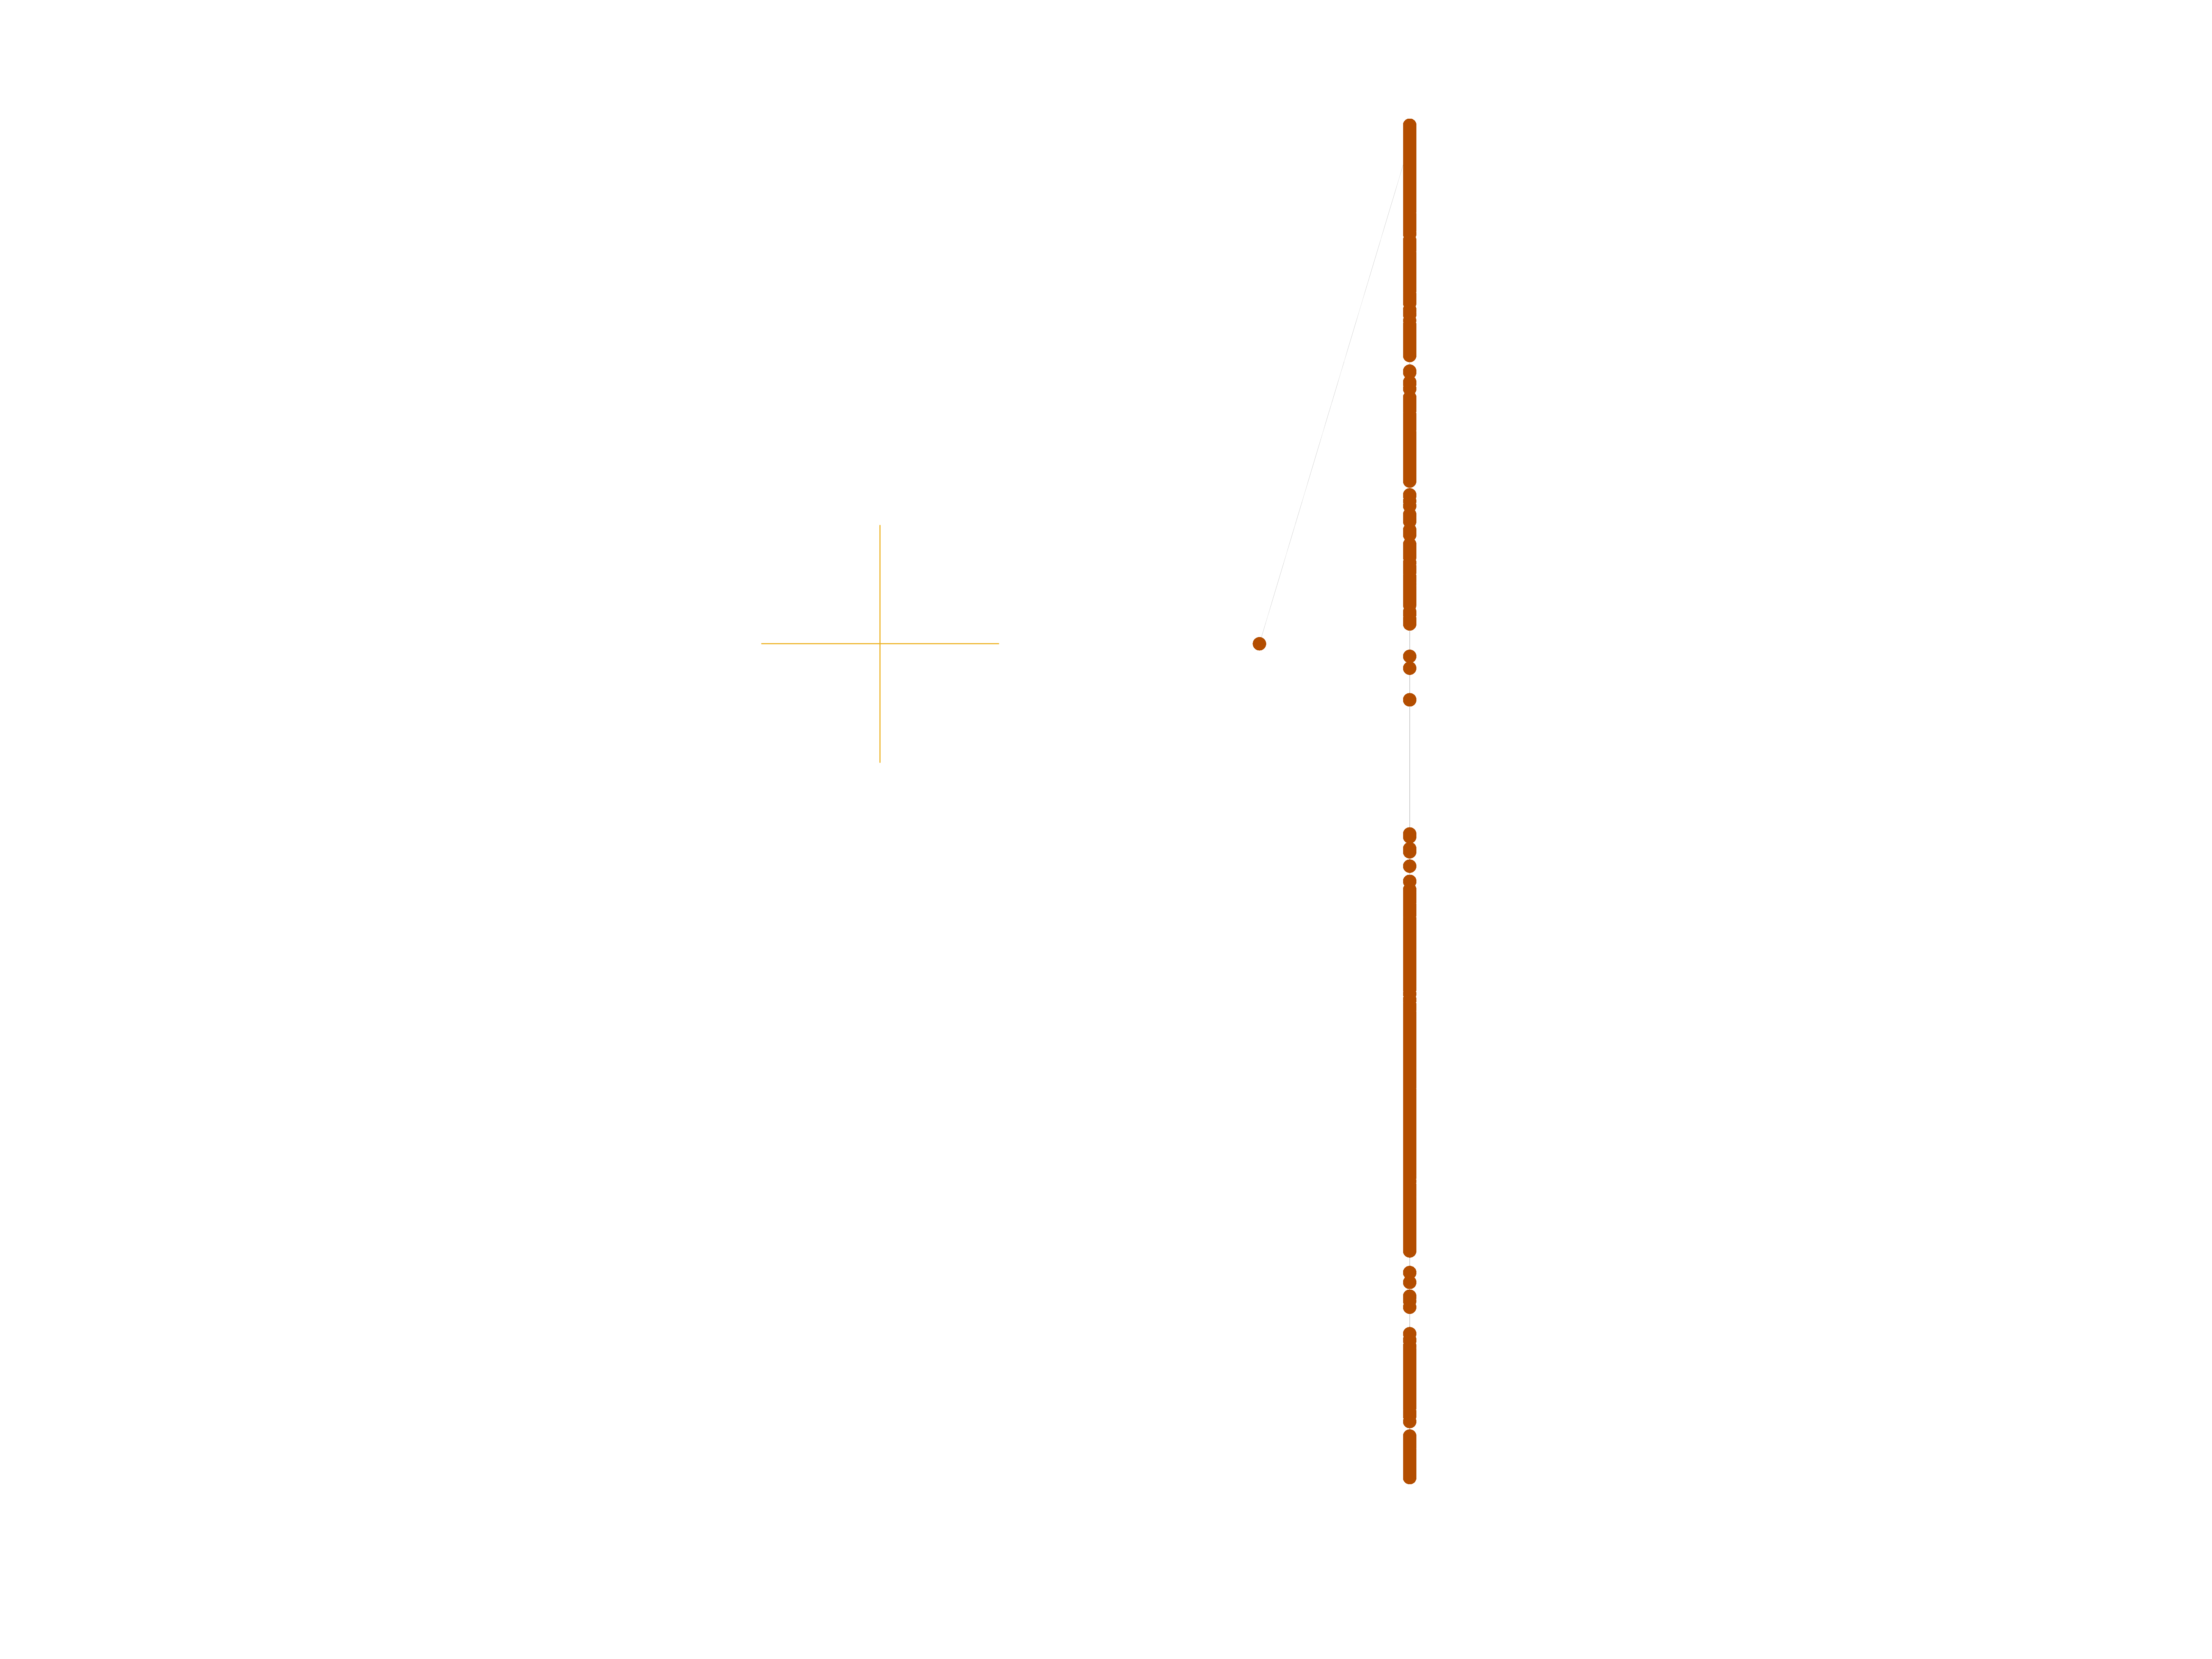
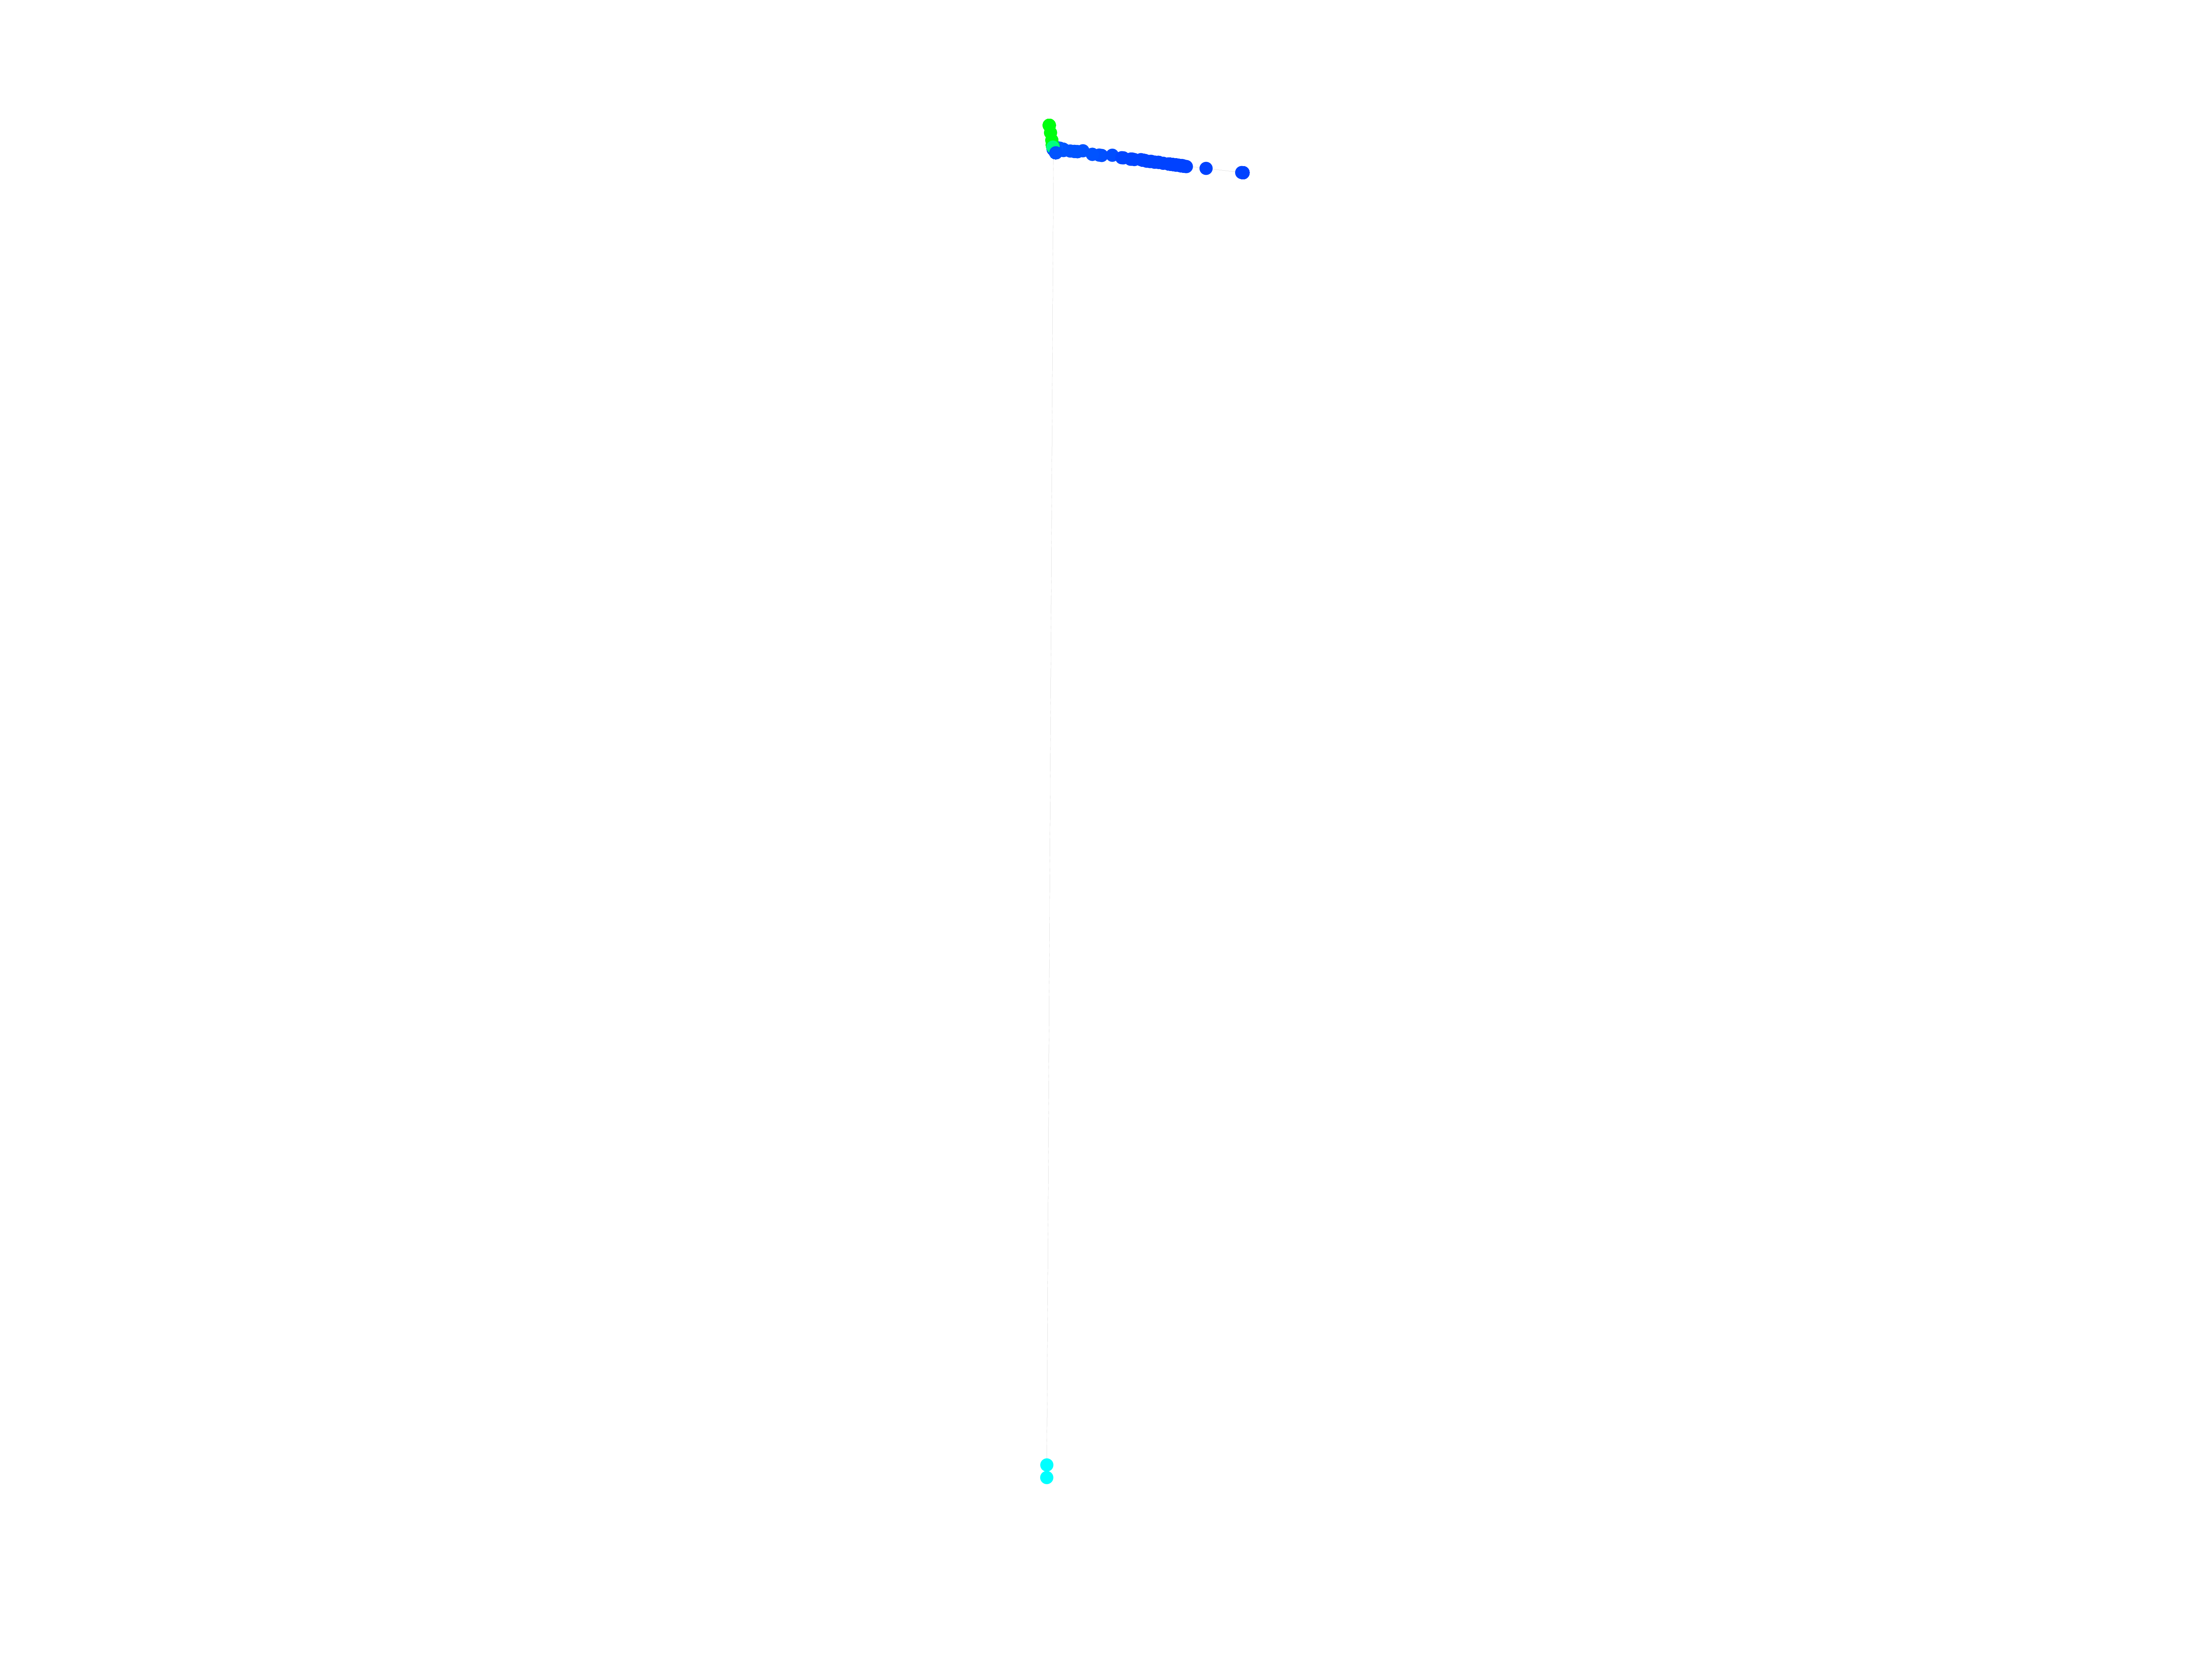
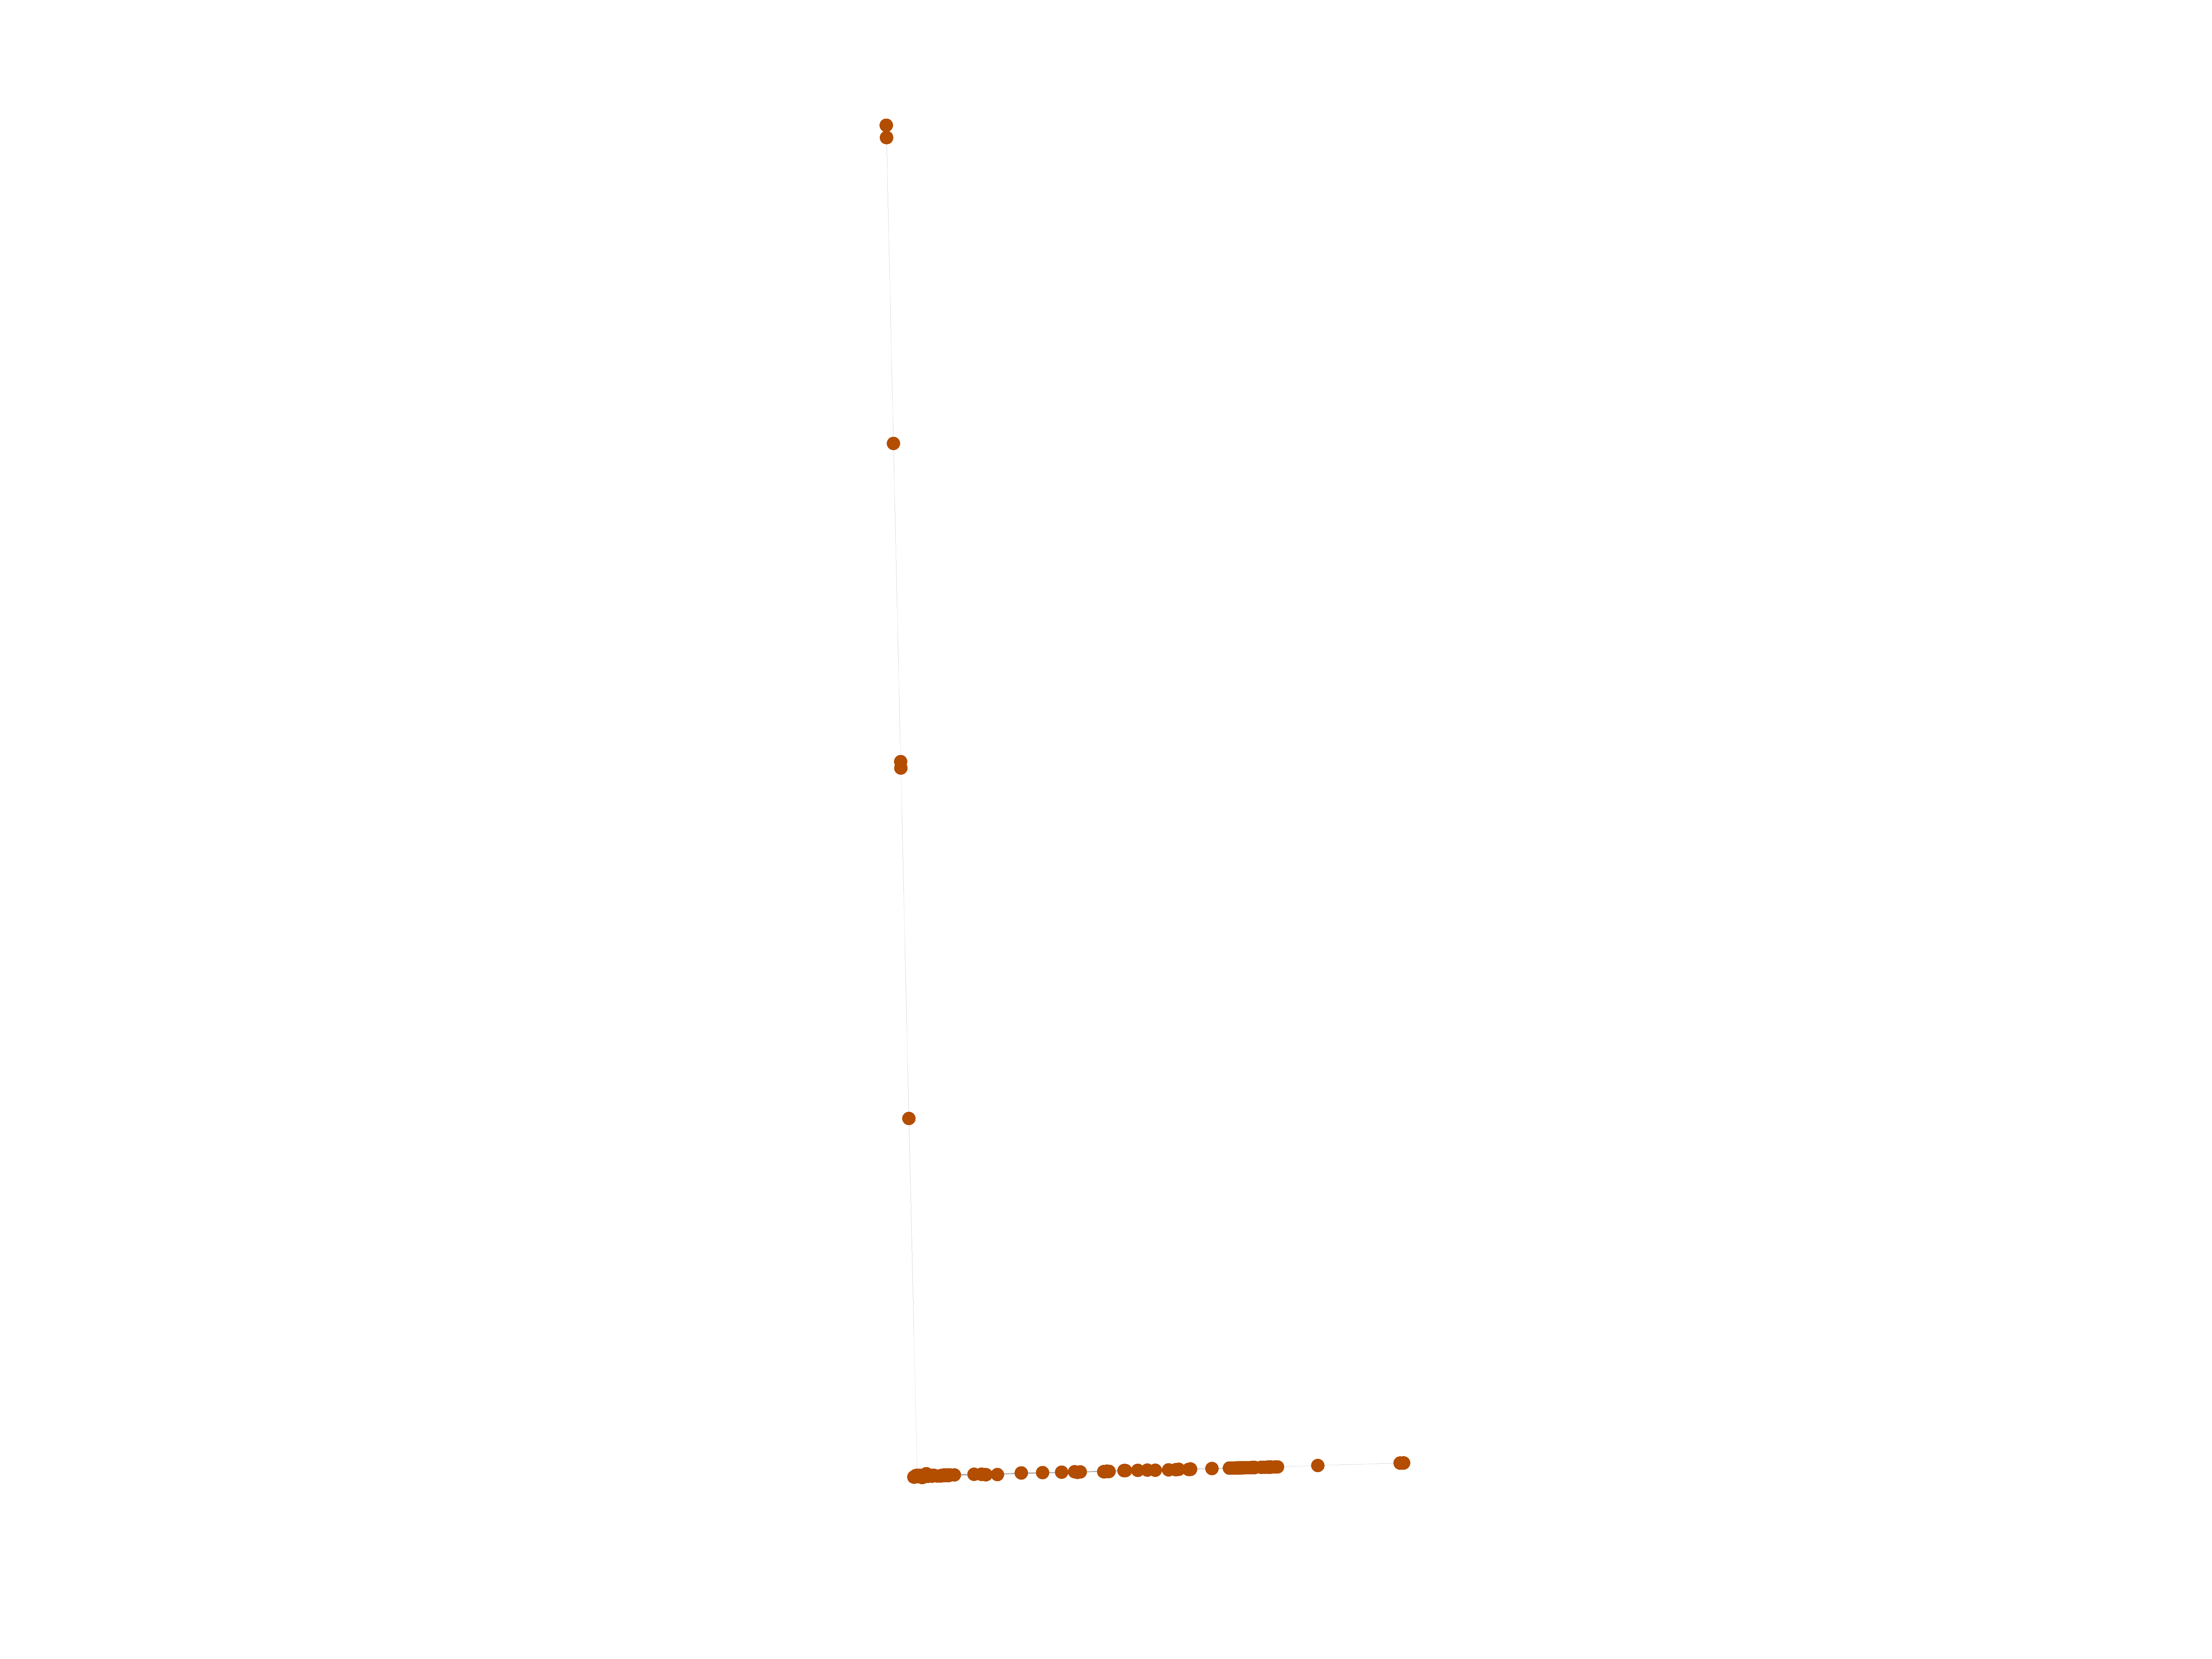
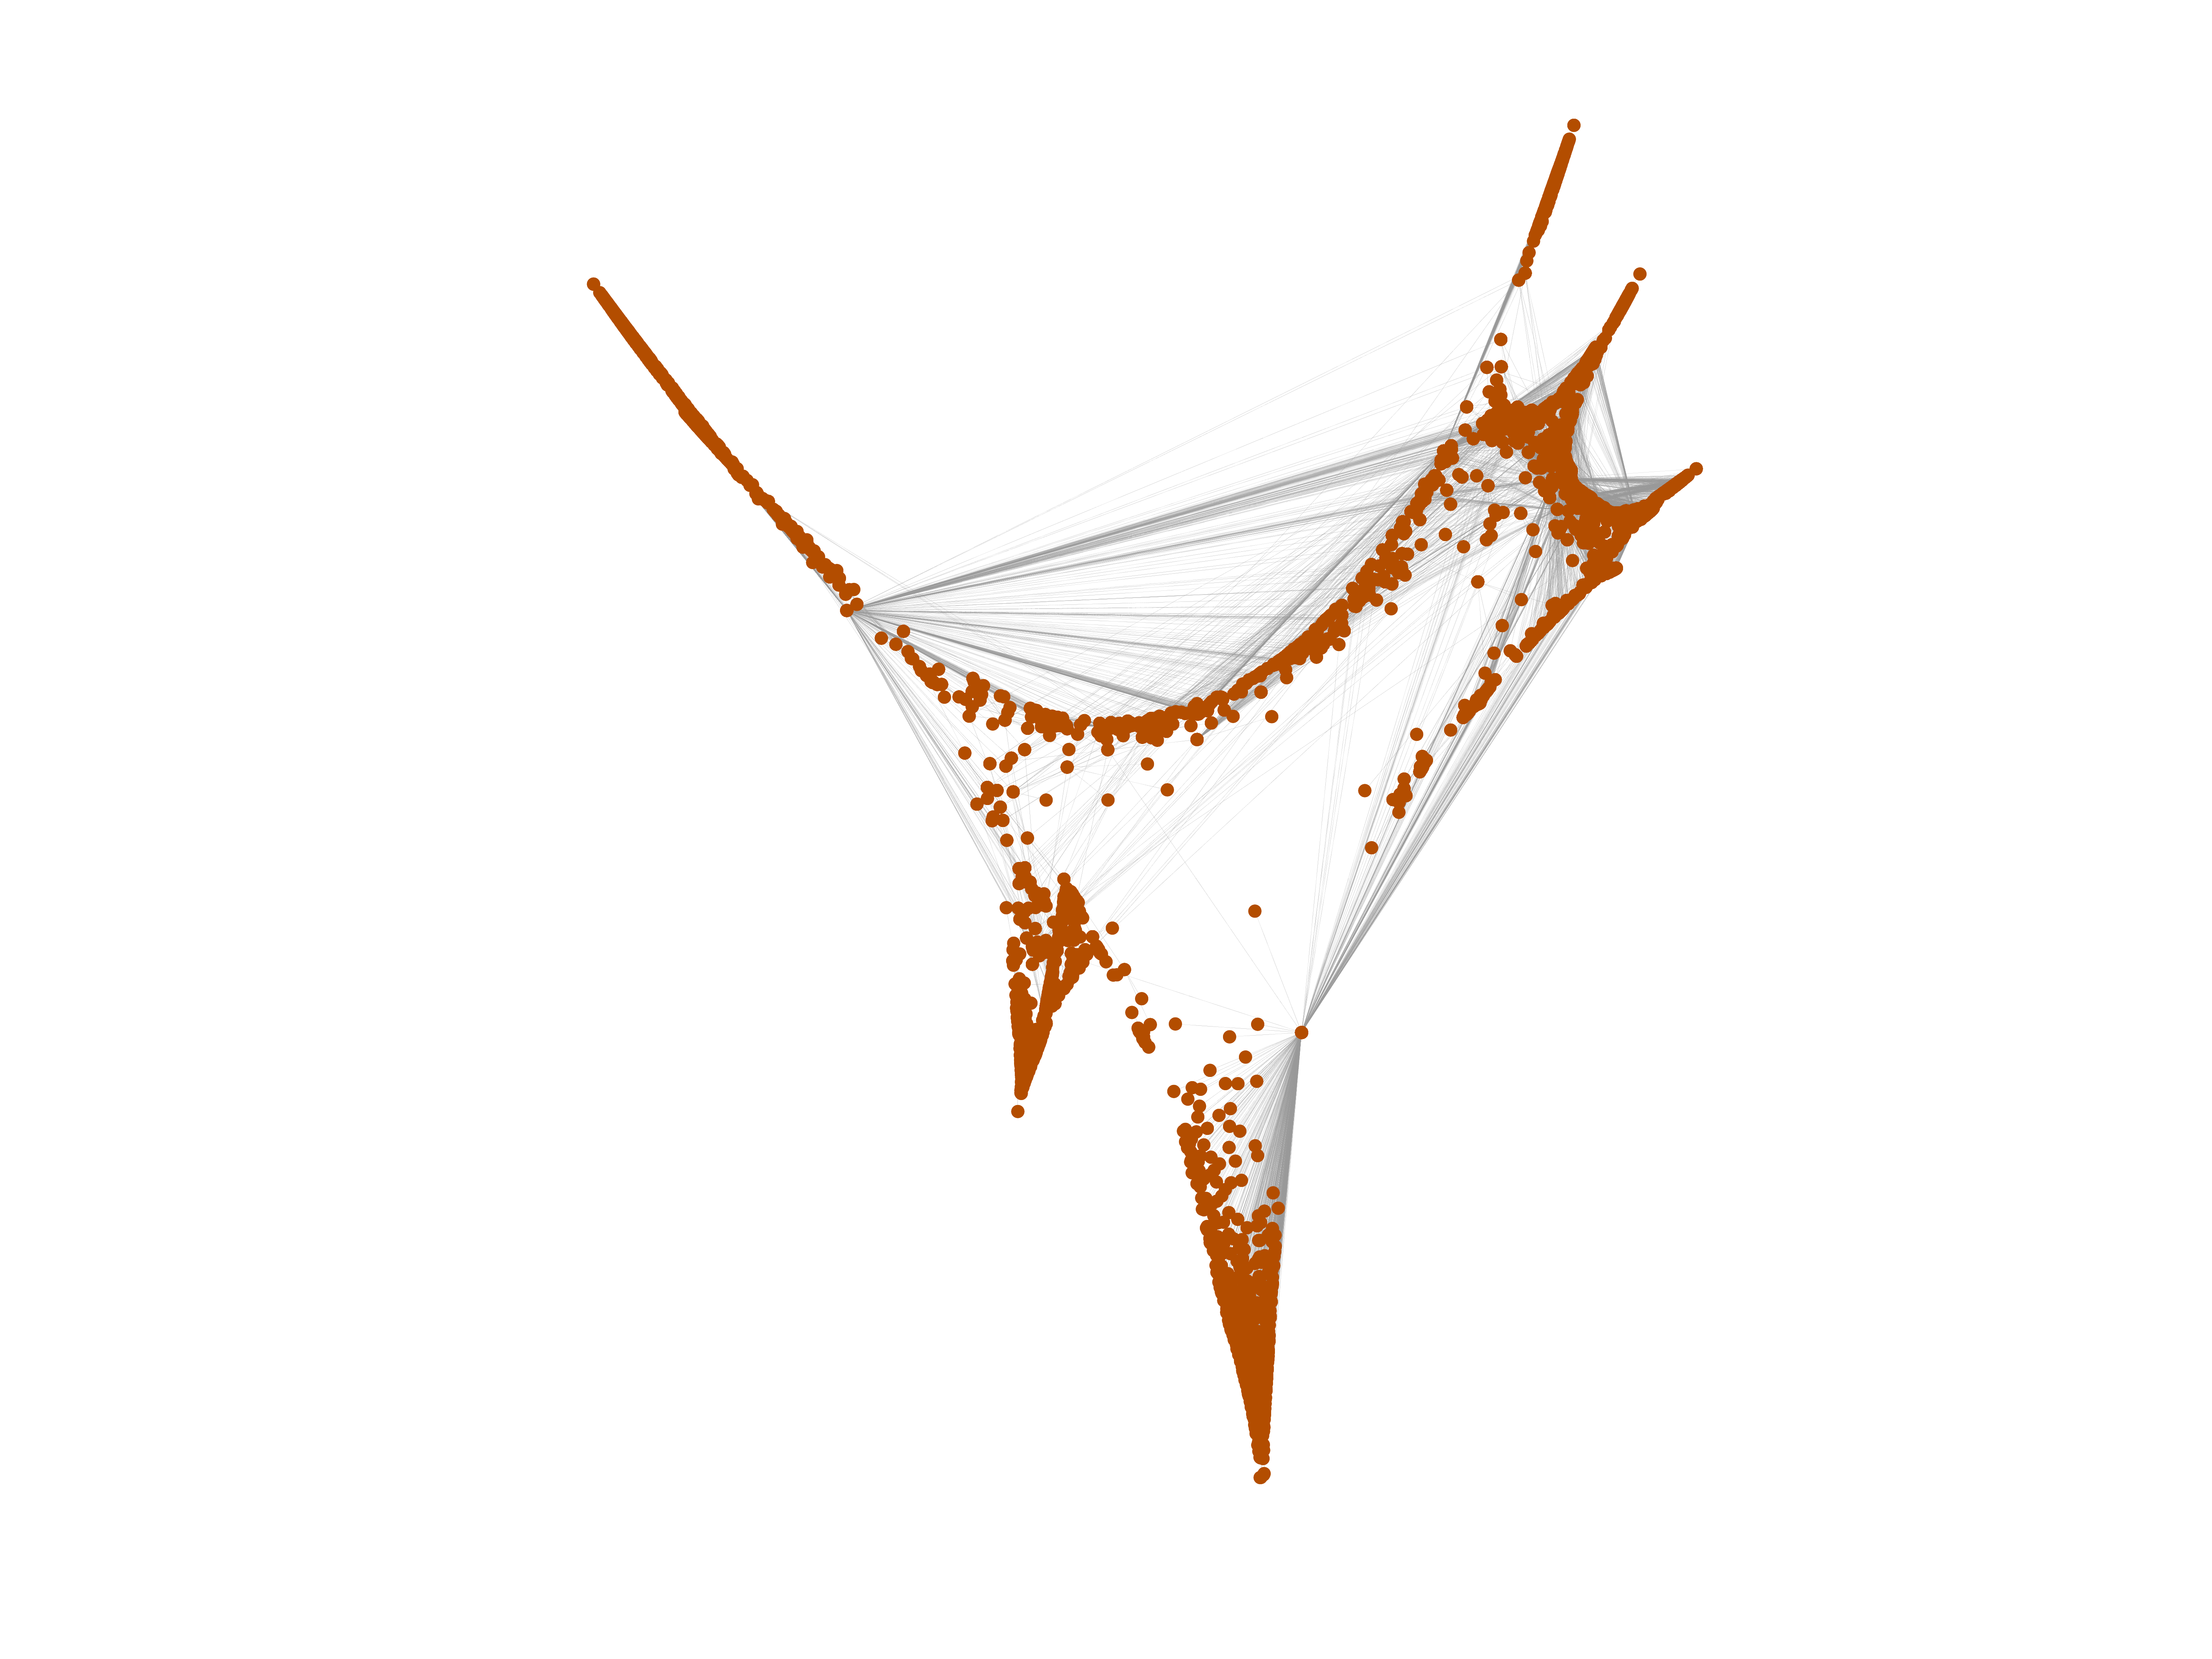
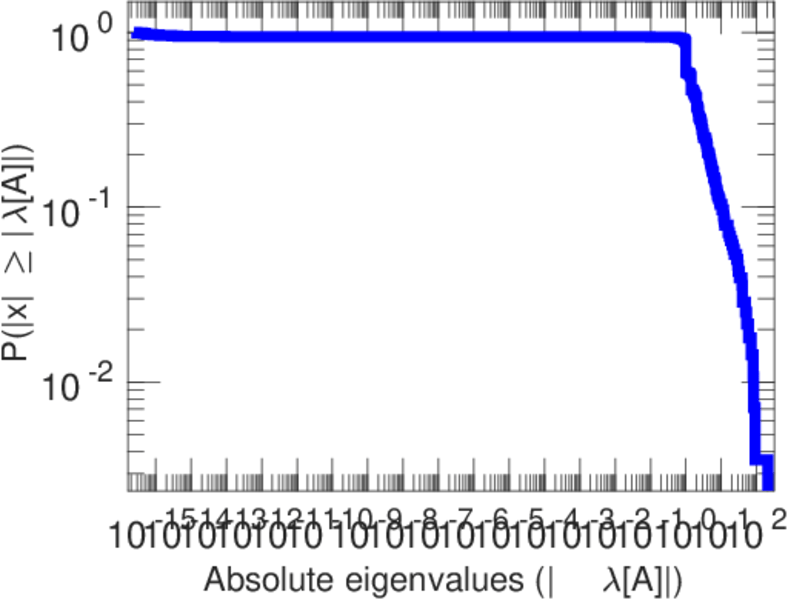
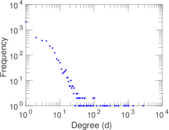
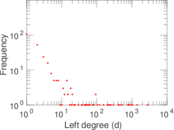
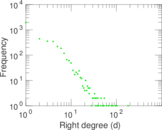
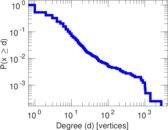
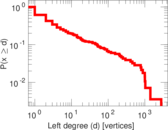
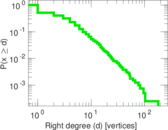
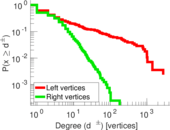
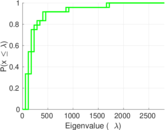
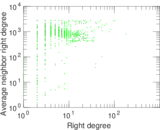
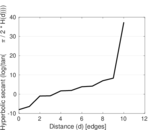
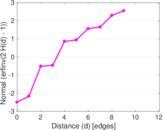
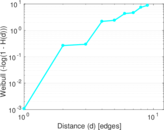
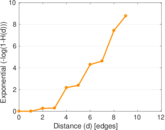
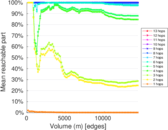
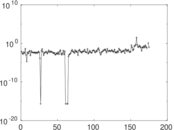
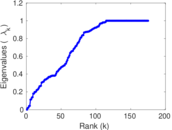
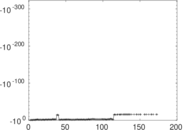
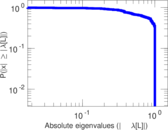
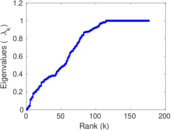
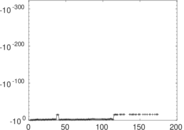
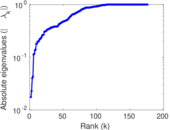
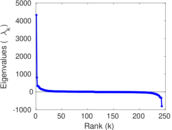
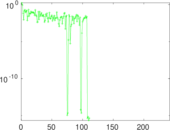
Plots


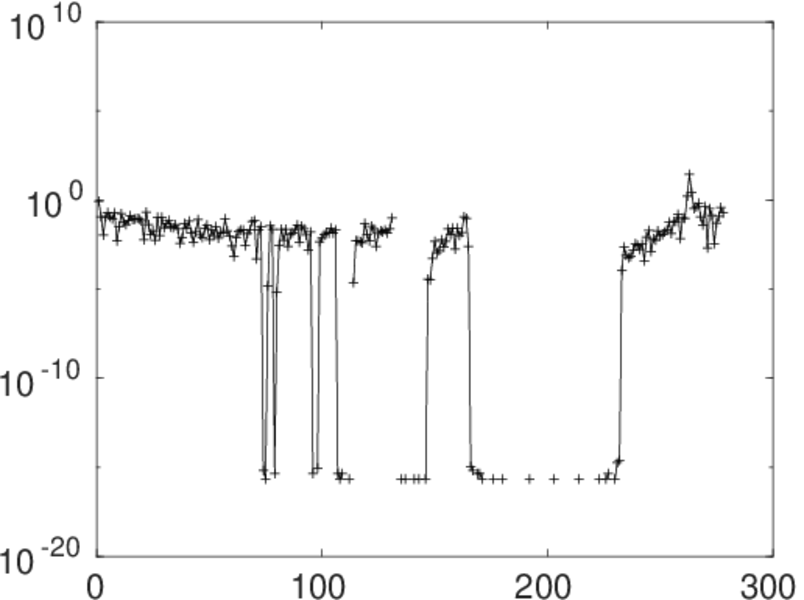
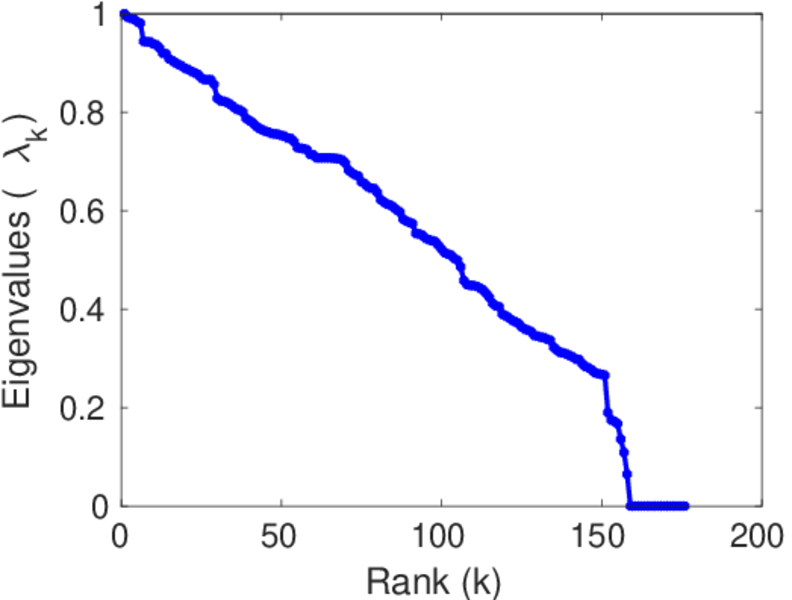
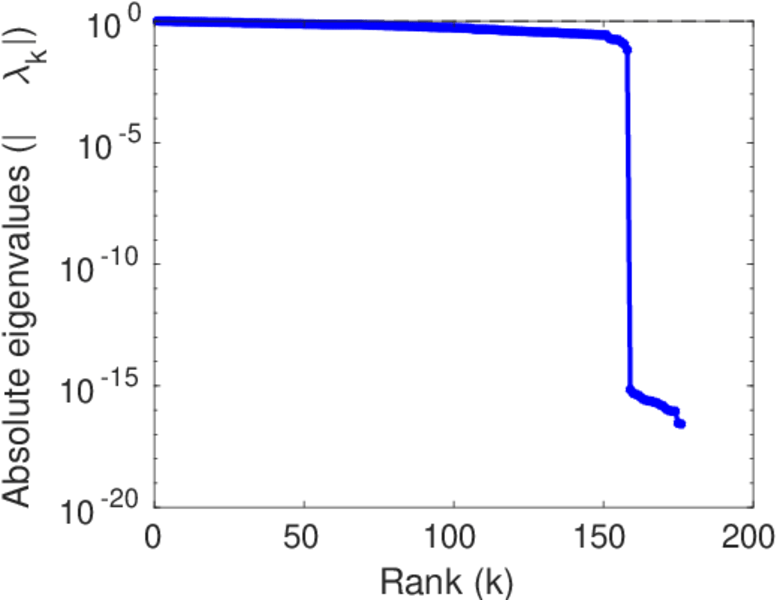
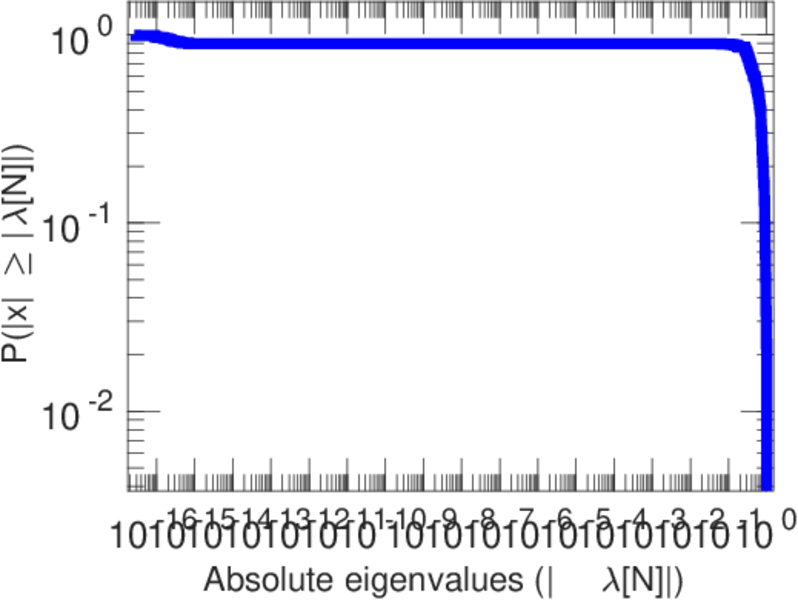
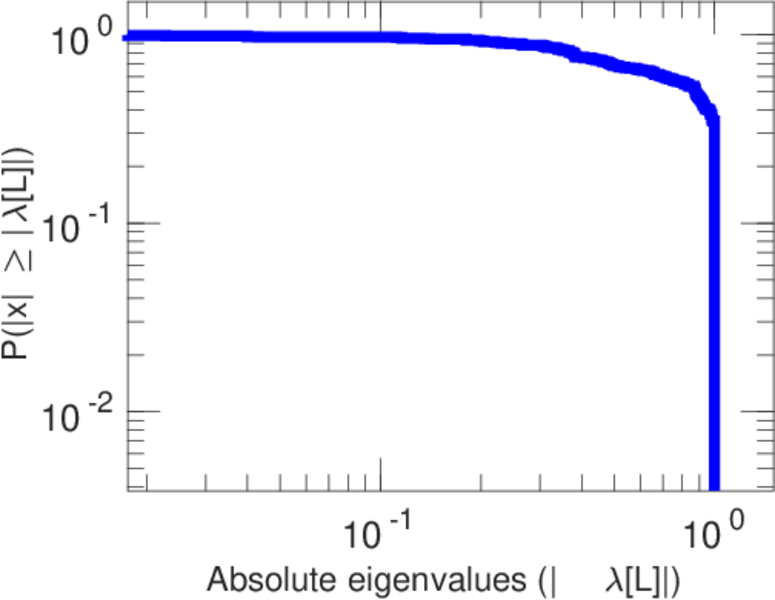
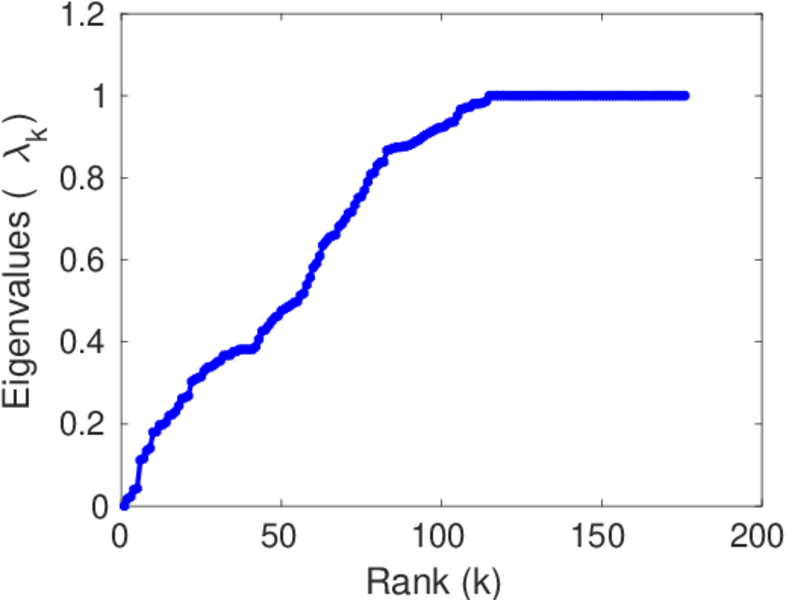
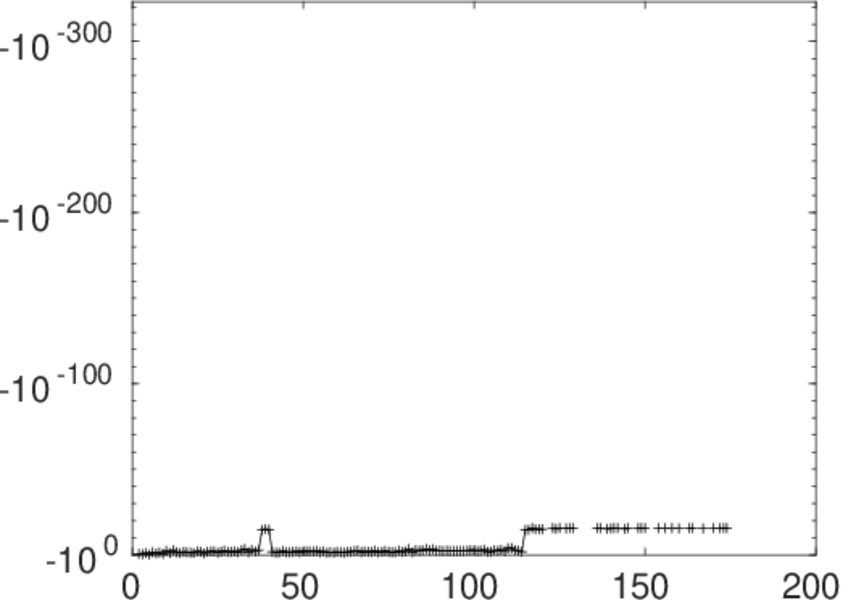
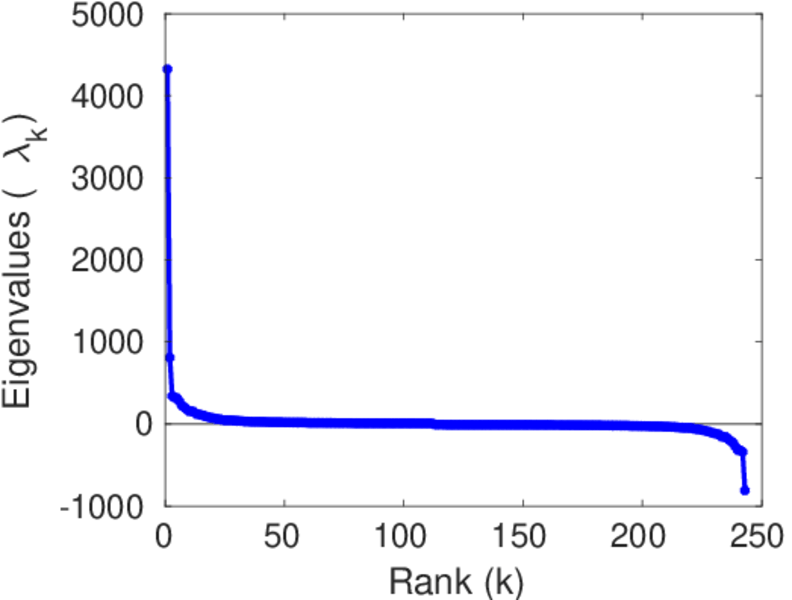
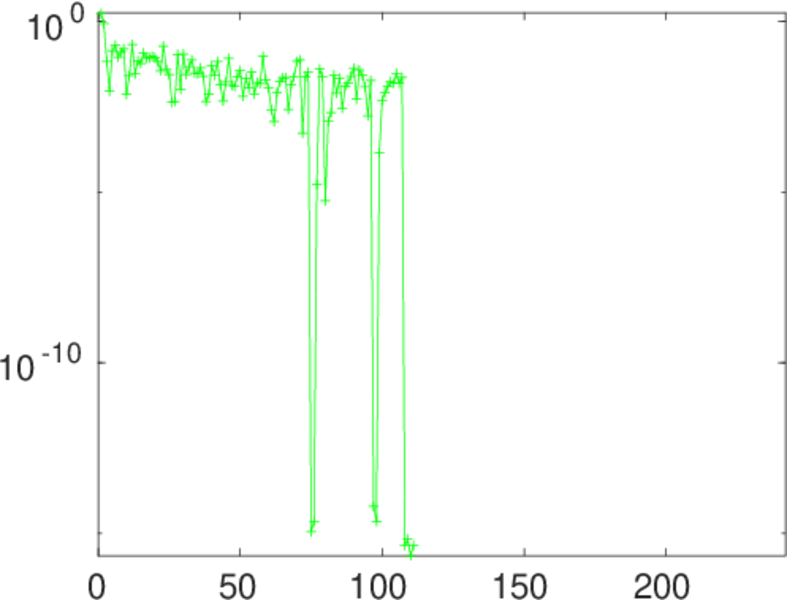
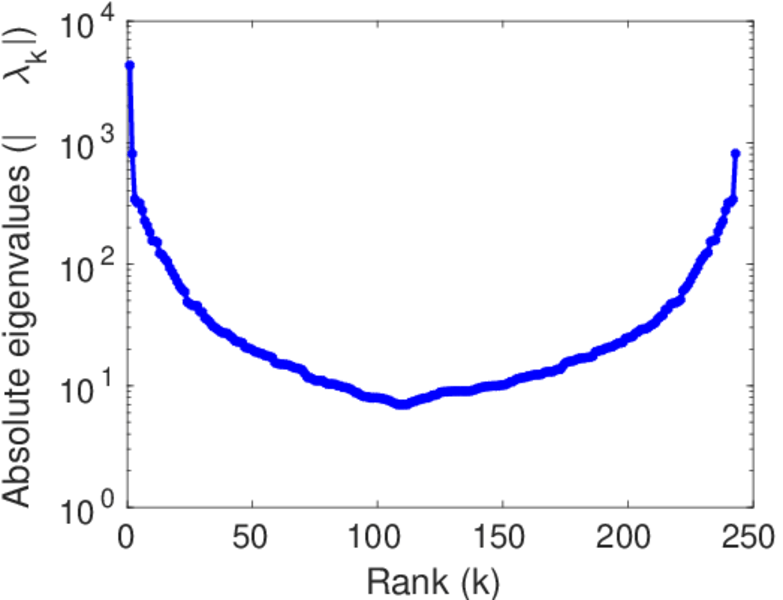
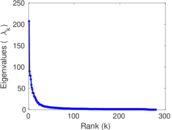
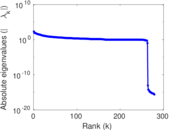
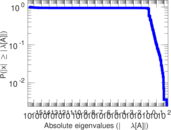
Matrix decompositions plots


Downloads
References
|
[1]
|
Jérôme Kunegis.
KONECT – The Koblenz Network Collection.
In Proc. Int. Conf. on World Wide Web Companion, pages
1343–1350, 2013.
[ http ]
|
|
[2]
|
Wikimedia Foundation.
Wikimedia downloads.
http://dumps.wikimedia.org/, January 2010.
|
 KONECT ‣ Networks ‣
Buy Me a Coffee
KONECT ‣ Networks ‣
Buy Me a Coffee