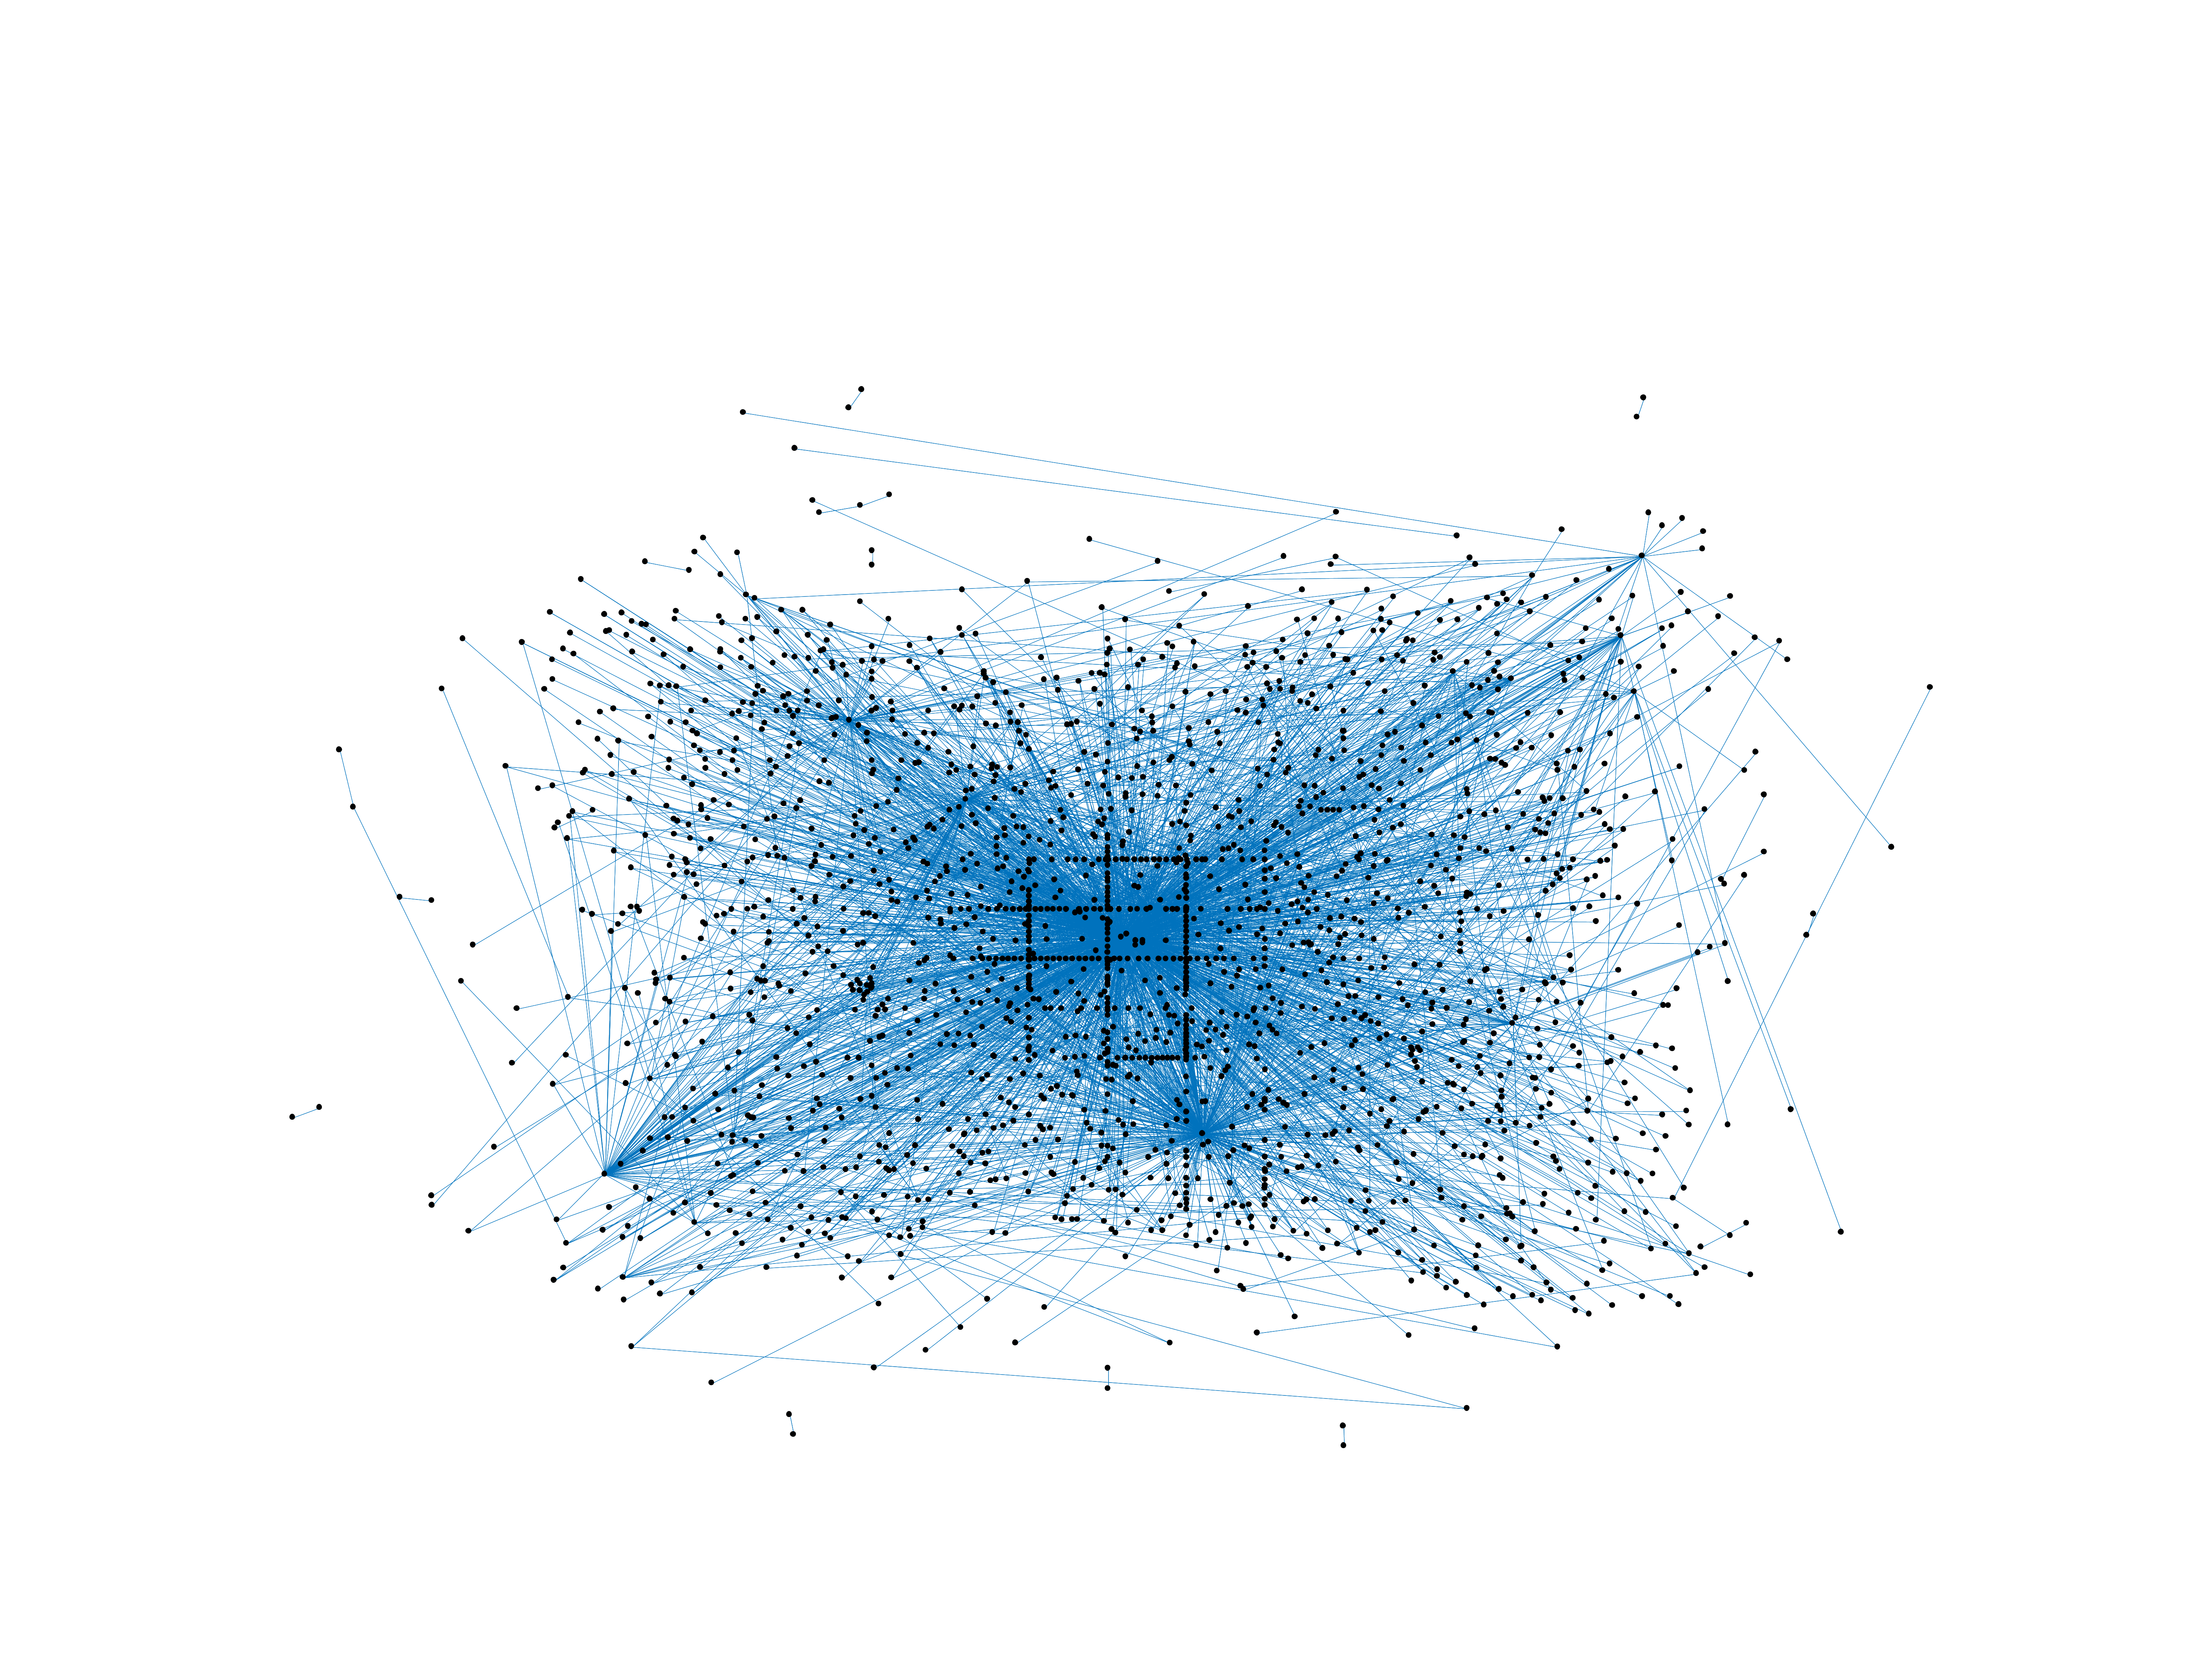
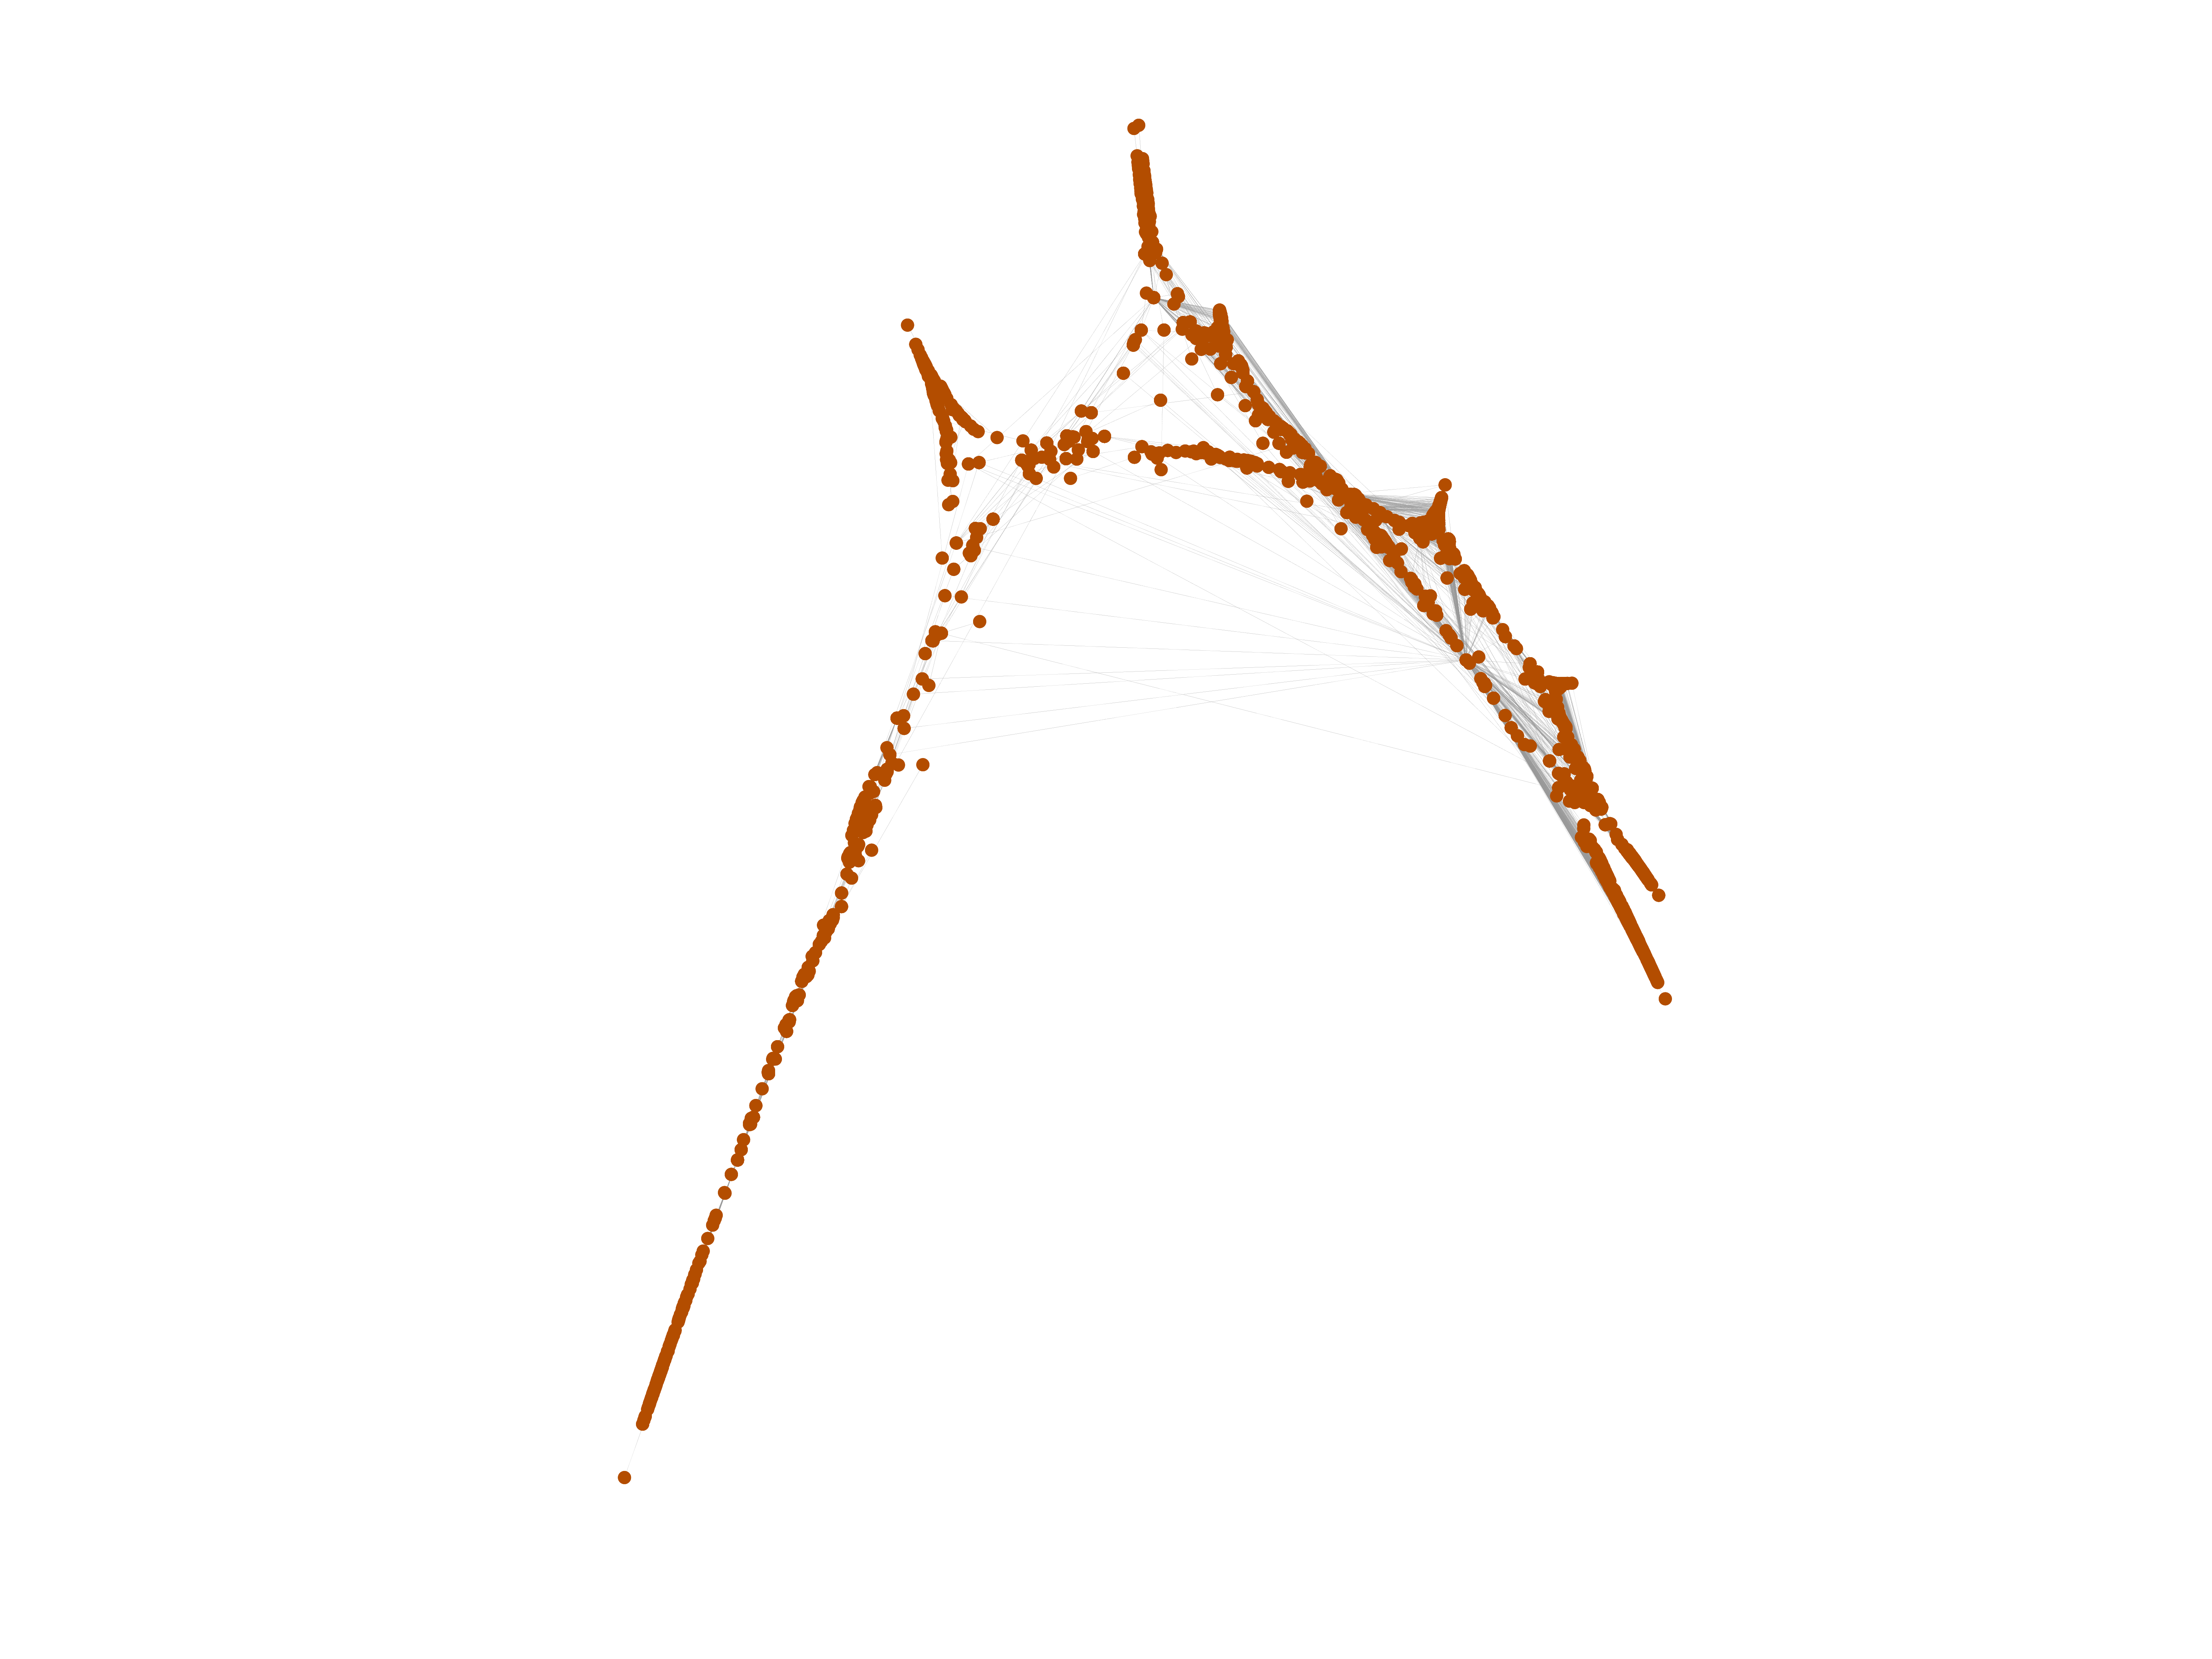
Wikibooks edits (ms)
This is the bipartite edit network of the Malay Wikibooks. It contains users
and pages from the Malay Wikibooks, connected by edit events. Each edge
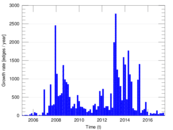
represents an edit. The dataset includes the timestamp of each edit.
Metadata
Statistics
| Size | n = | 2,102
|
| Left size | n1 = | 223
|
| Right size | n2 = | 1,879
|
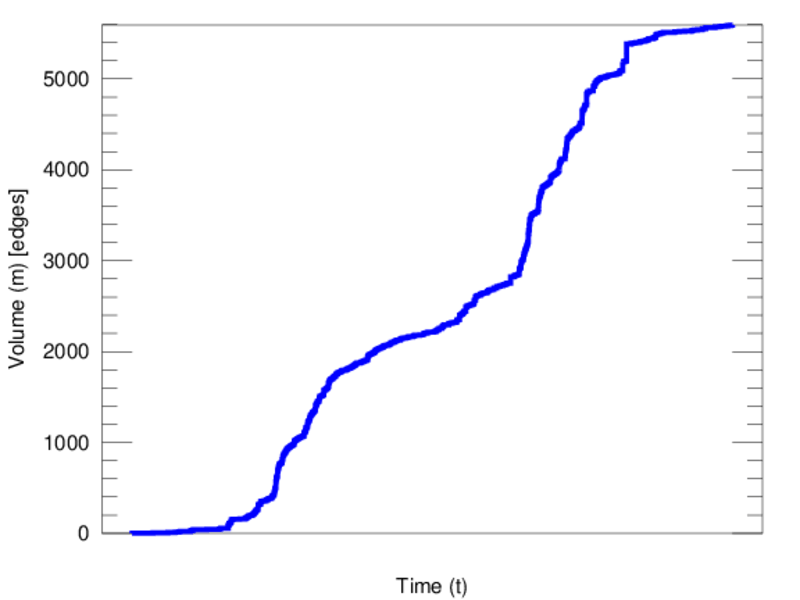
| Volume | m = | 5,593
|
| Unique edge count | m̿ = | 2,879
|
| Wedge count | s = | 566,847
|
| Claw count | z = | 151,699,990
|
| Cross count | x = | 34,482,133,099
|
| Square count | q = | 37,610
|
| 4-Tour count | T4 = | 2,574,142
|
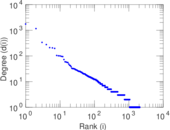
| Maximum degree | dmax = | 1,744
|
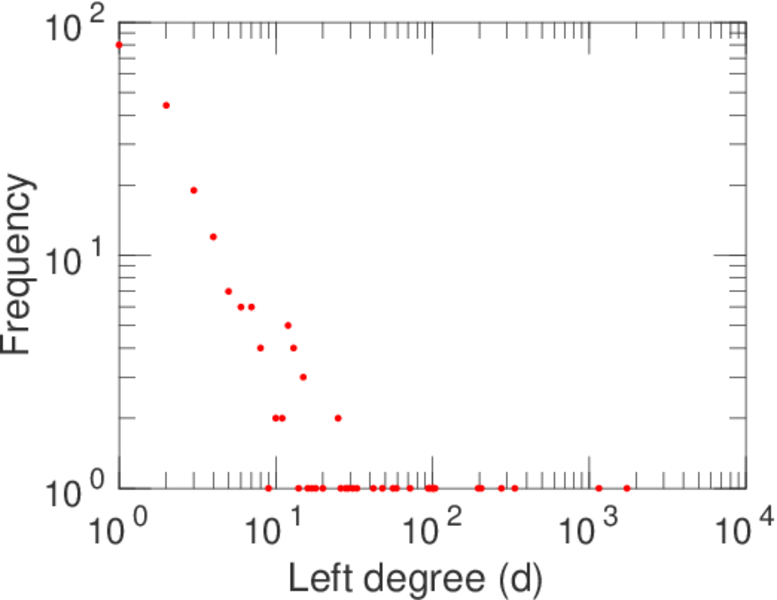
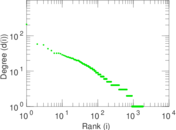
| Maximum left degree | d1max = | 1,744
|
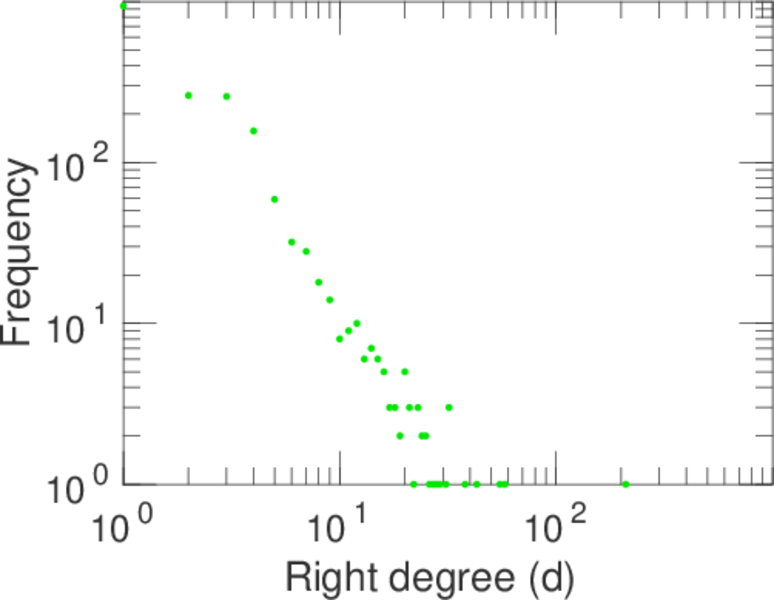
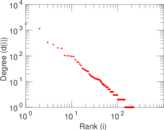
| Maximum right degree | d2max = | 210
|
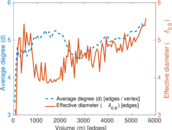
| Average degree | d = | 5.321 60
|
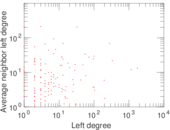
| Average left degree | d1 = | 25.080 7
|
| Average right degree | d2 = | 2.976 58
|
| Fill | p = | 0.006 870 84
|
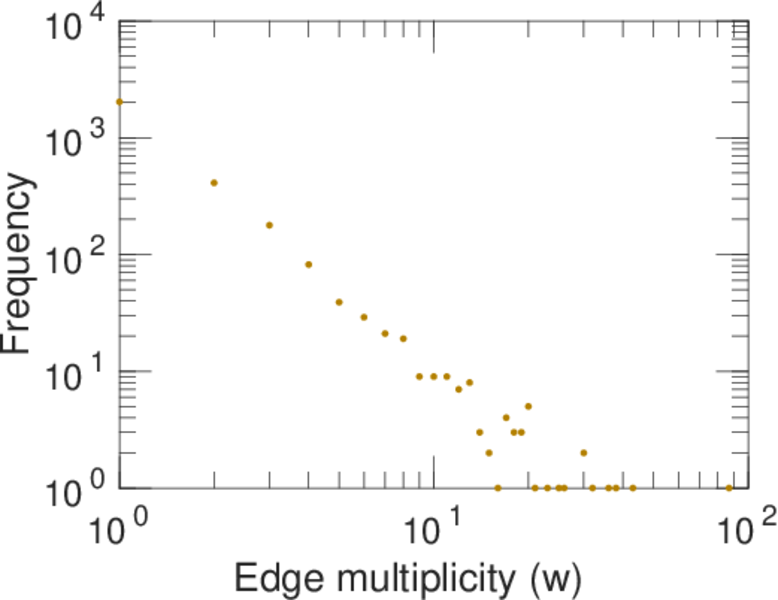
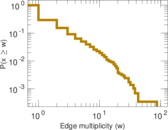
| Average edge multiplicity | m̃ = | 1.942 69
|
| Size of LCC | N = | 1,890
|
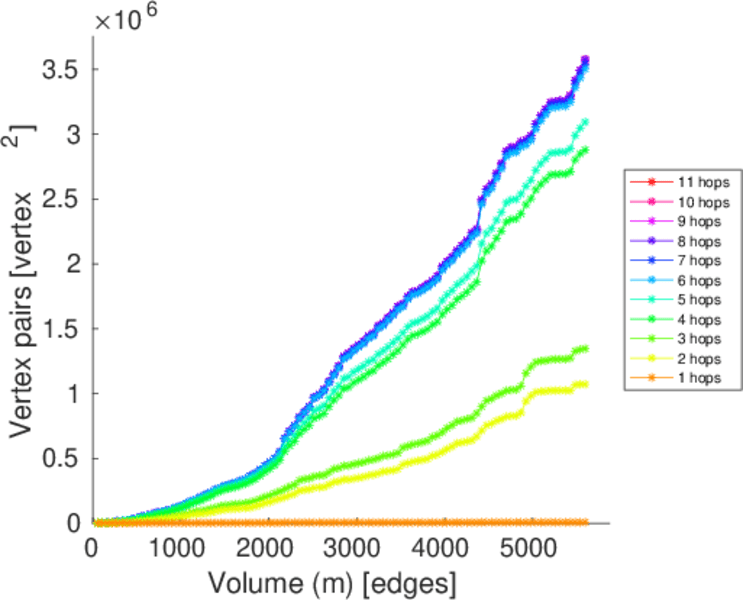
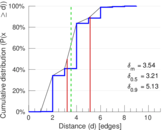
| Diameter | δ = | 11
|
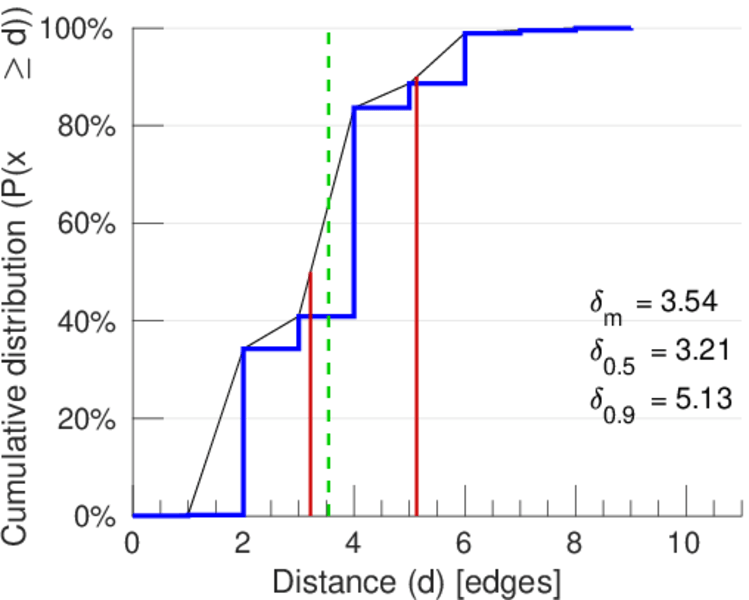
| 50-Percentile effective diameter | δ0.5 = | 3.212 36
|
| 90-Percentile effective diameter | δ0.9 = | 5.132 96
|
| Median distance | δM = | 4
|
| Mean distance | δm = | 3.538 50
|
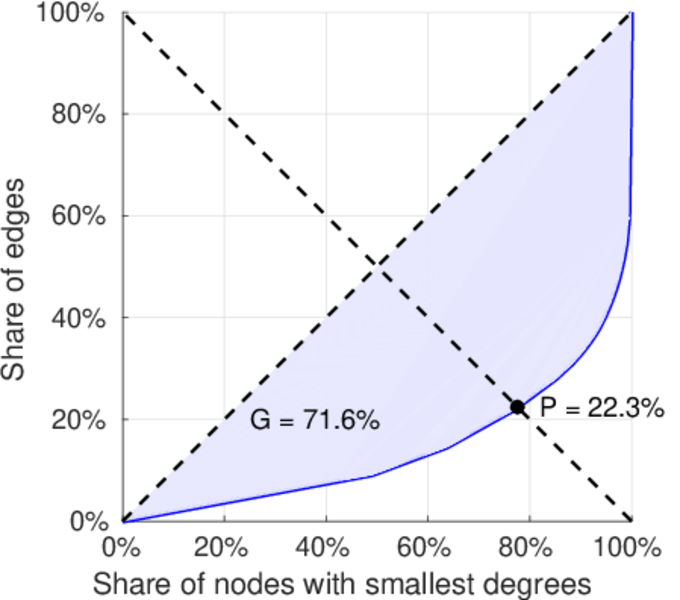
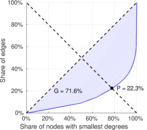
| Gini coefficient | G = | 0.729 691
|
| Balanced inequality ratio | P = | 0.217 325
|
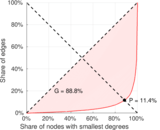
| Left balanced inequality ratio | P1 = | 0.114 429
|
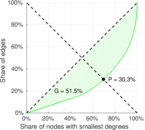
| Right balanced inequality ratio | P2 = | 0.302 879
|
| Relative edge distribution entropy | Her = | 0.779 297
|
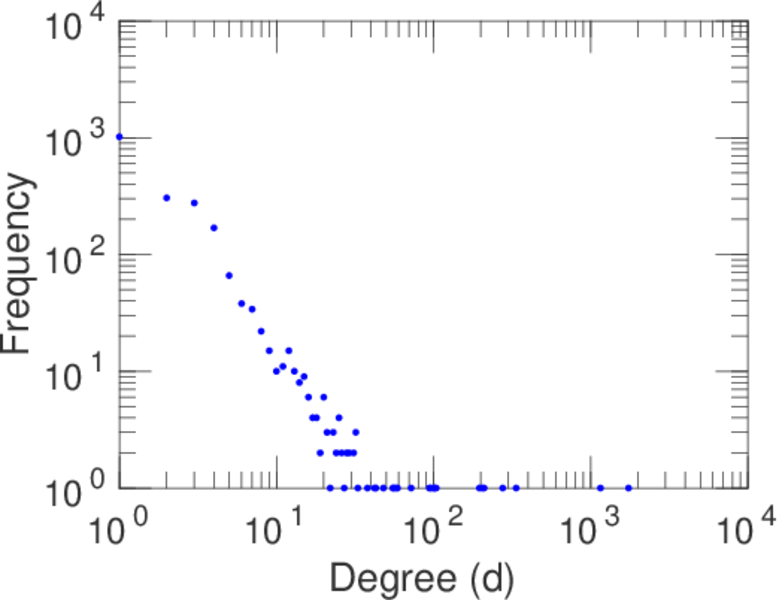
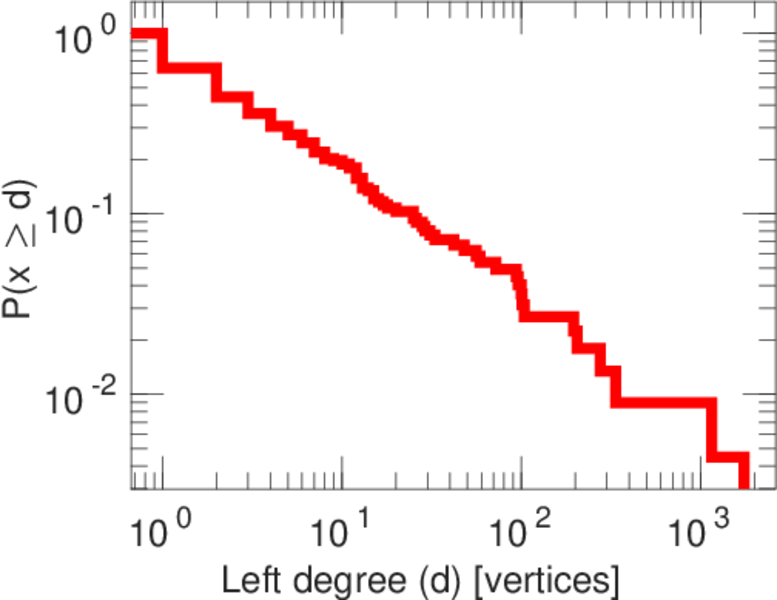
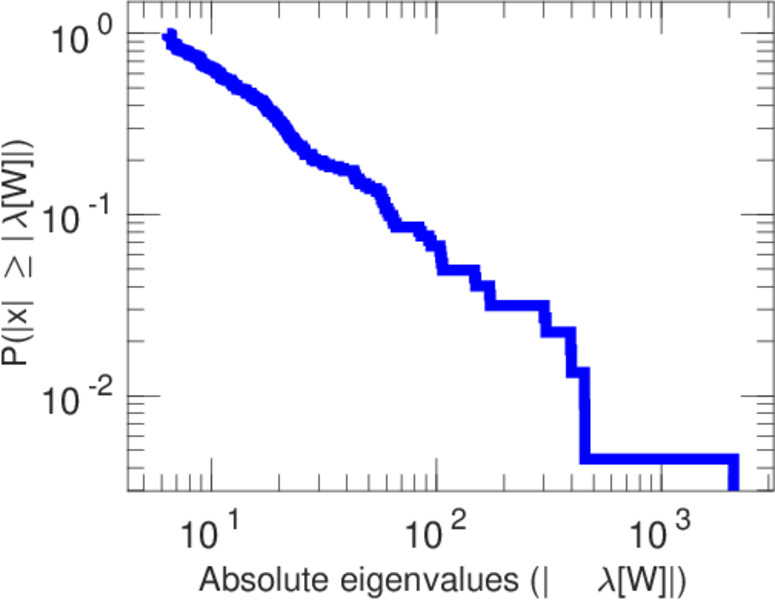
| Power law exponent | γ = | 3.604 70
|
| Tail power law exponent | γt = | 2.951 00
|
| Tail power law exponent with p | γ3 = | 2.951 00
|
| p-value | p = | 0.000 00
|
| Left tail power law exponent with p | γ3,1 = | 1.731 00
|
| Left p-value | p1 = | 0.467 000
|
| Right tail power law exponent with p | γ3,2 = | 5.651 00
|
| Right p-value | p2 = | 0.000 00
|
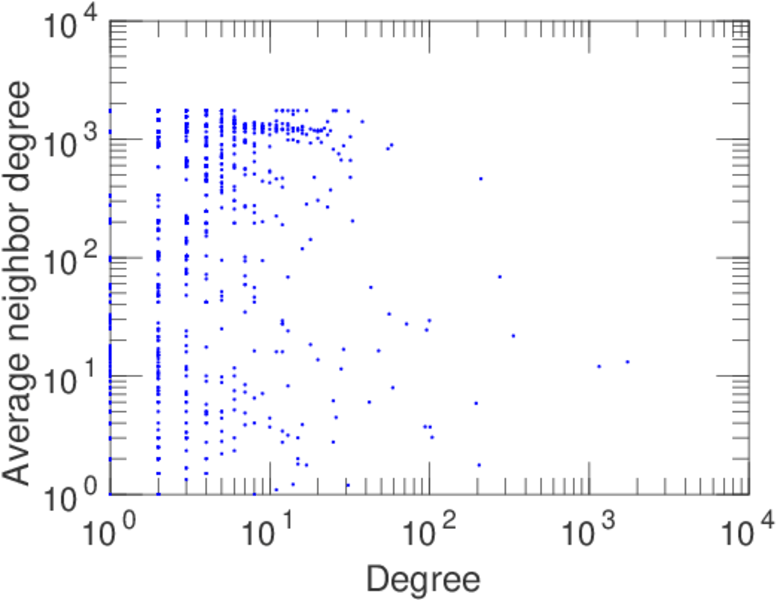
| Degree assortativity | ρ = | −0.130 732
|
| Degree assortativity p-value | pρ = | 1.897 73 × 10−12
|
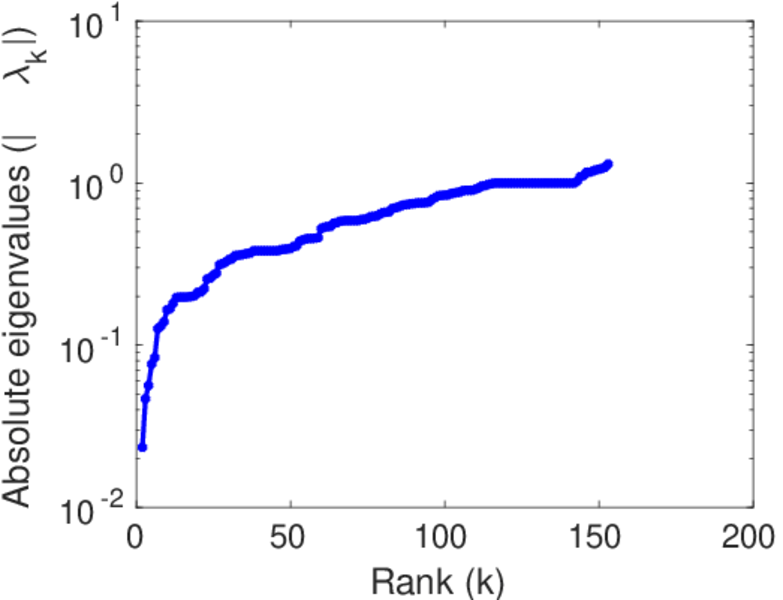
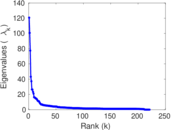
| Spectral norm | α = | 120.737
|
| Algebraic connectivity | a = | 0.023 444 2
|
| Spectral separation | |λ1[A] / λ2[A]| = | 1.199 22
|
| Controllability | C = | 1,649
|
| Relative controllability | Cr = | 0.794 699
|
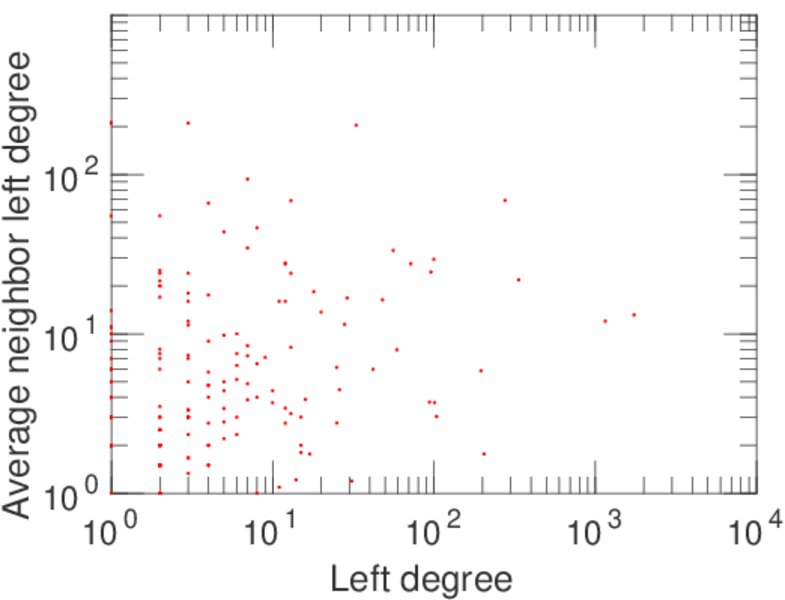
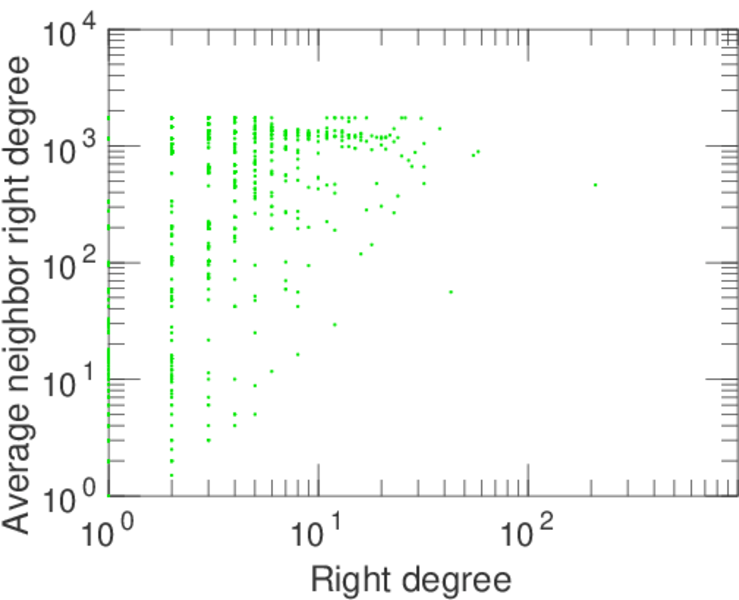
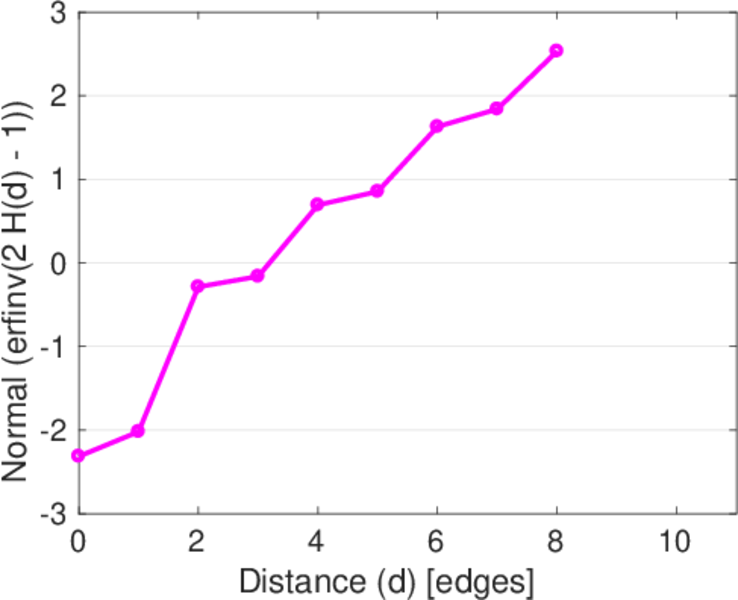
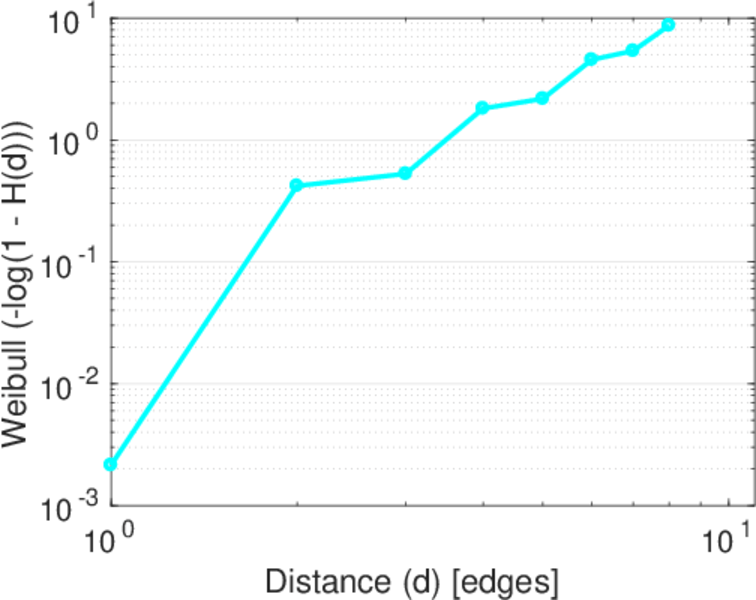
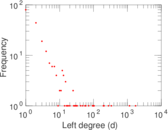
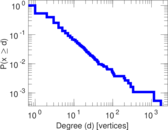
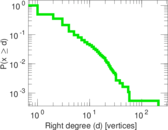
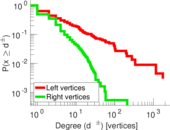
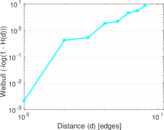
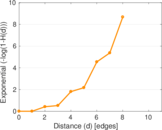
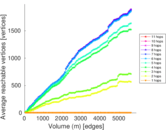
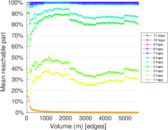
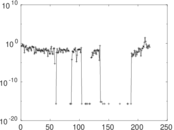
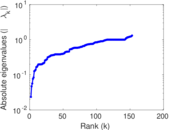
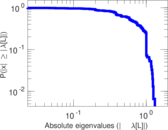
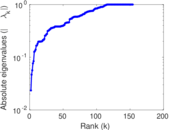
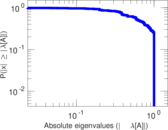
Plots


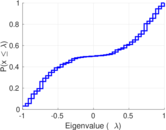
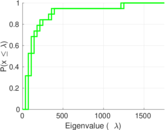


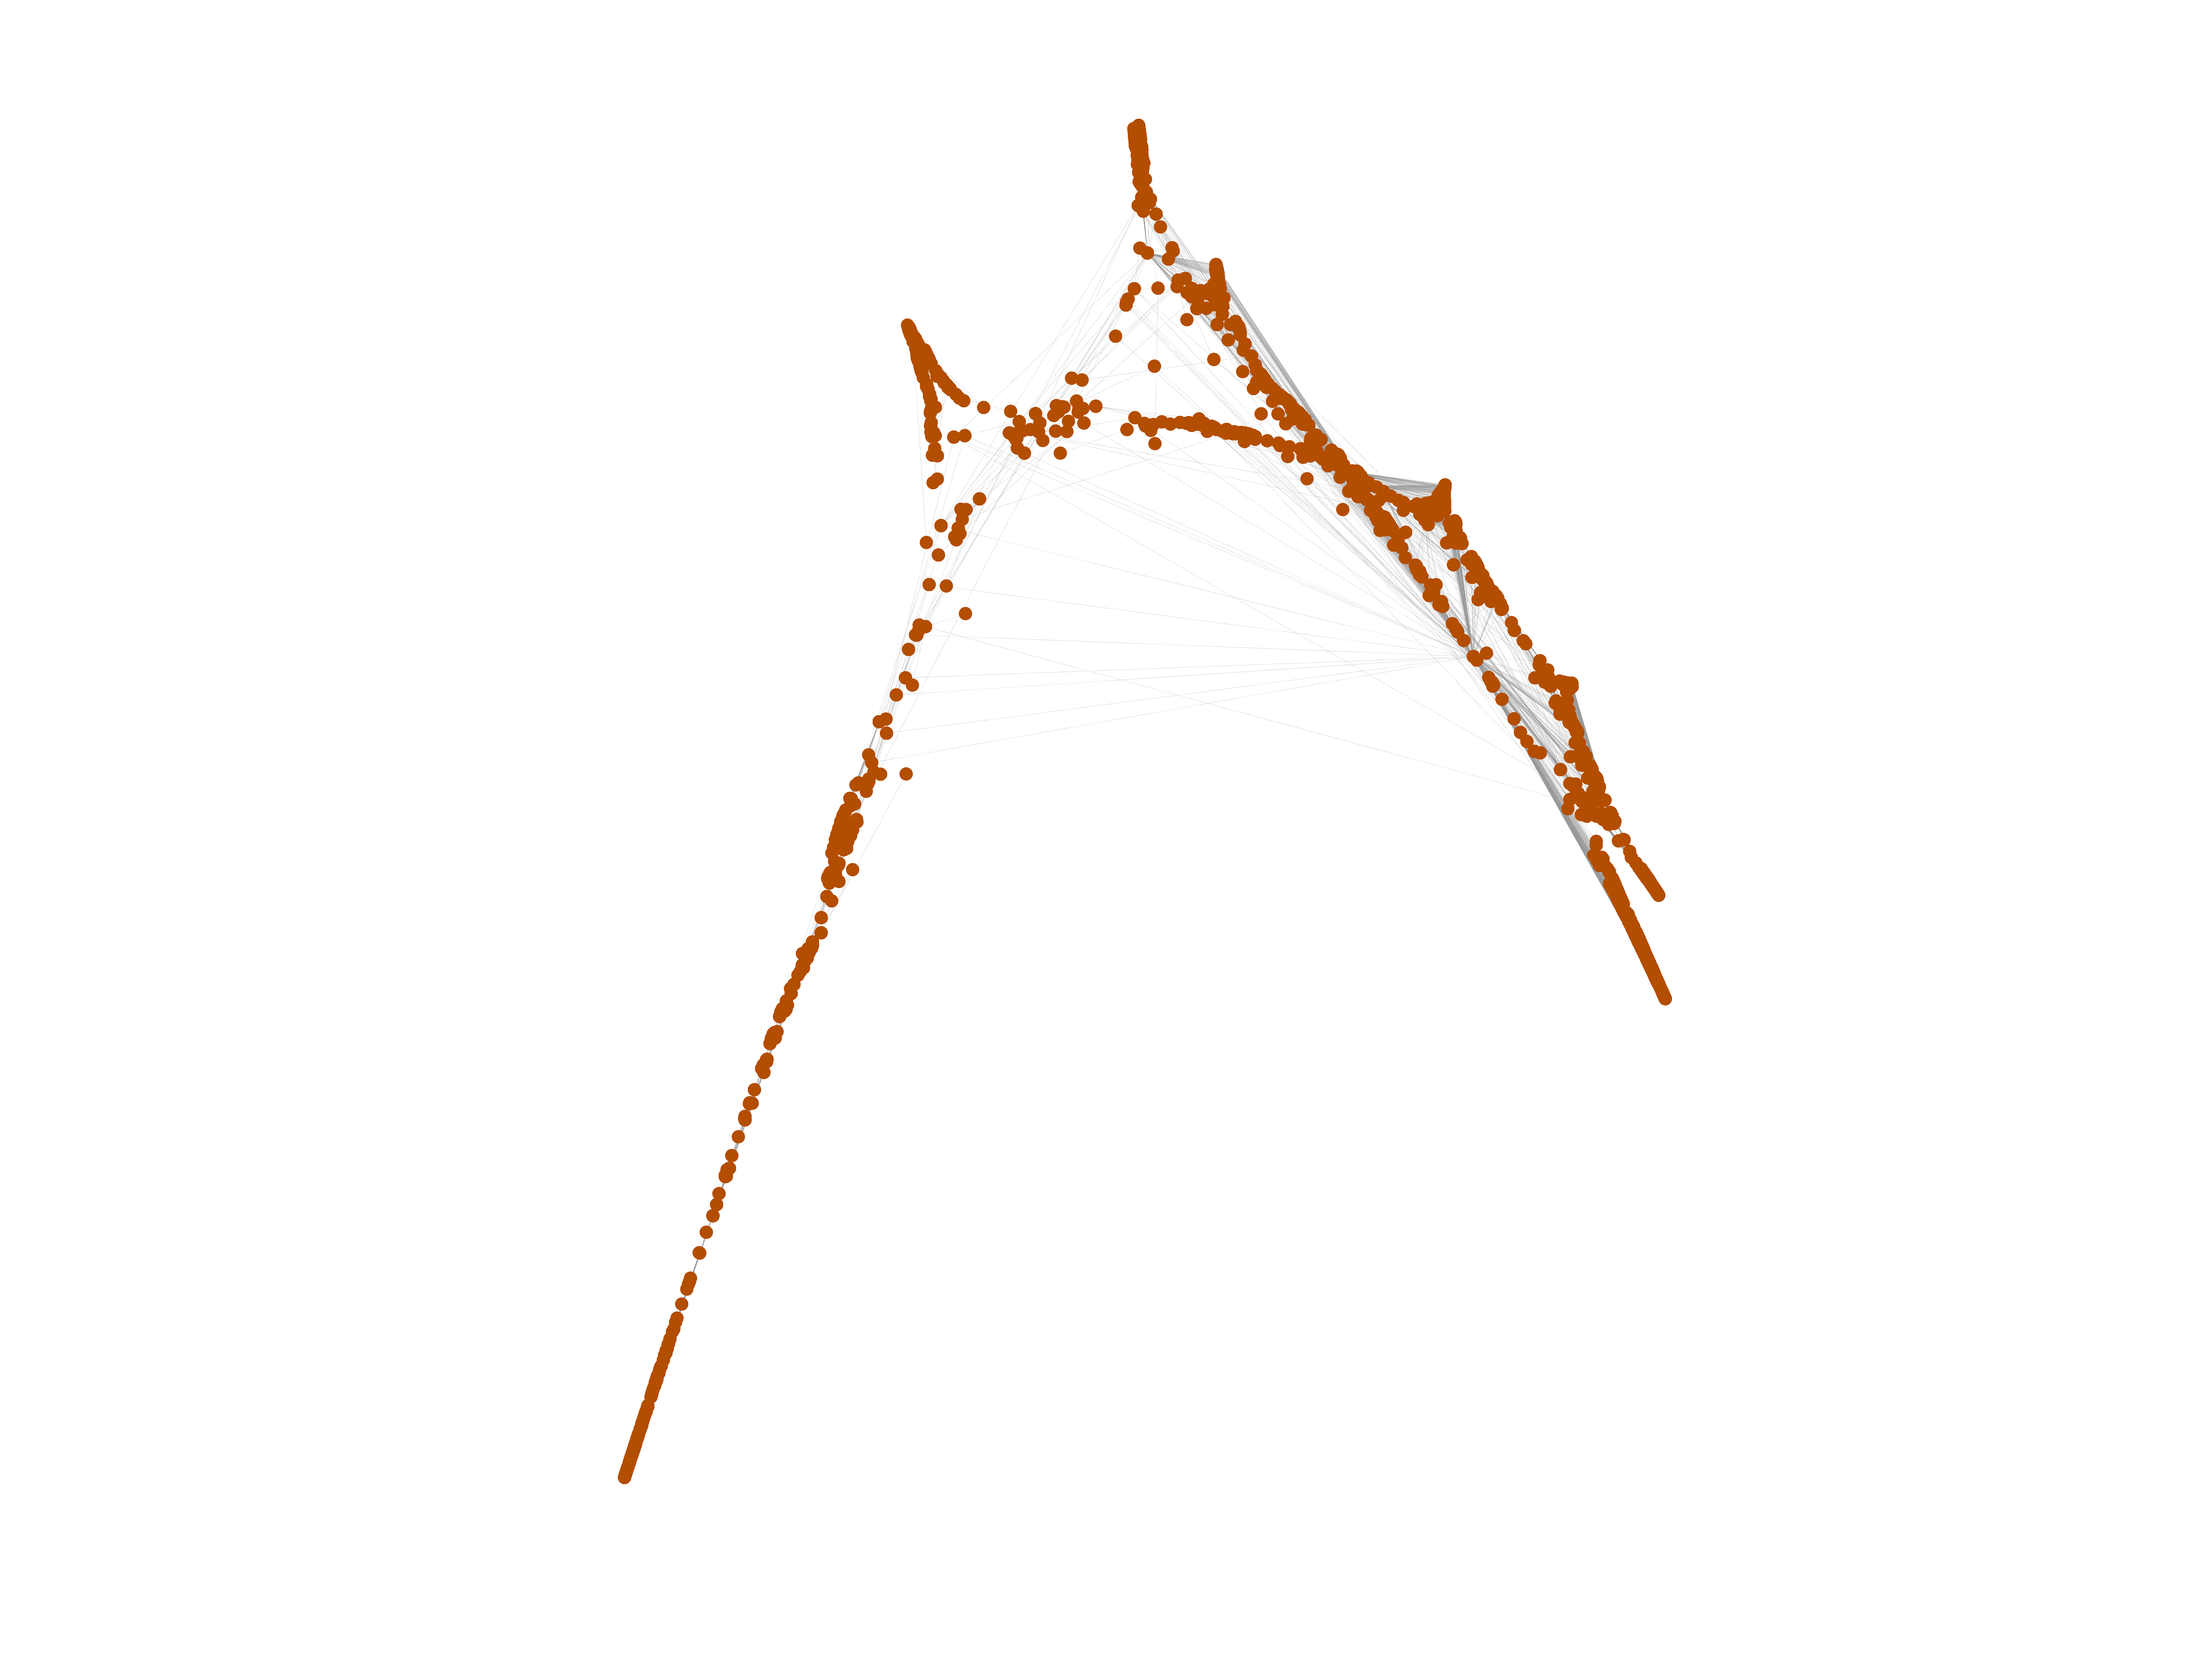
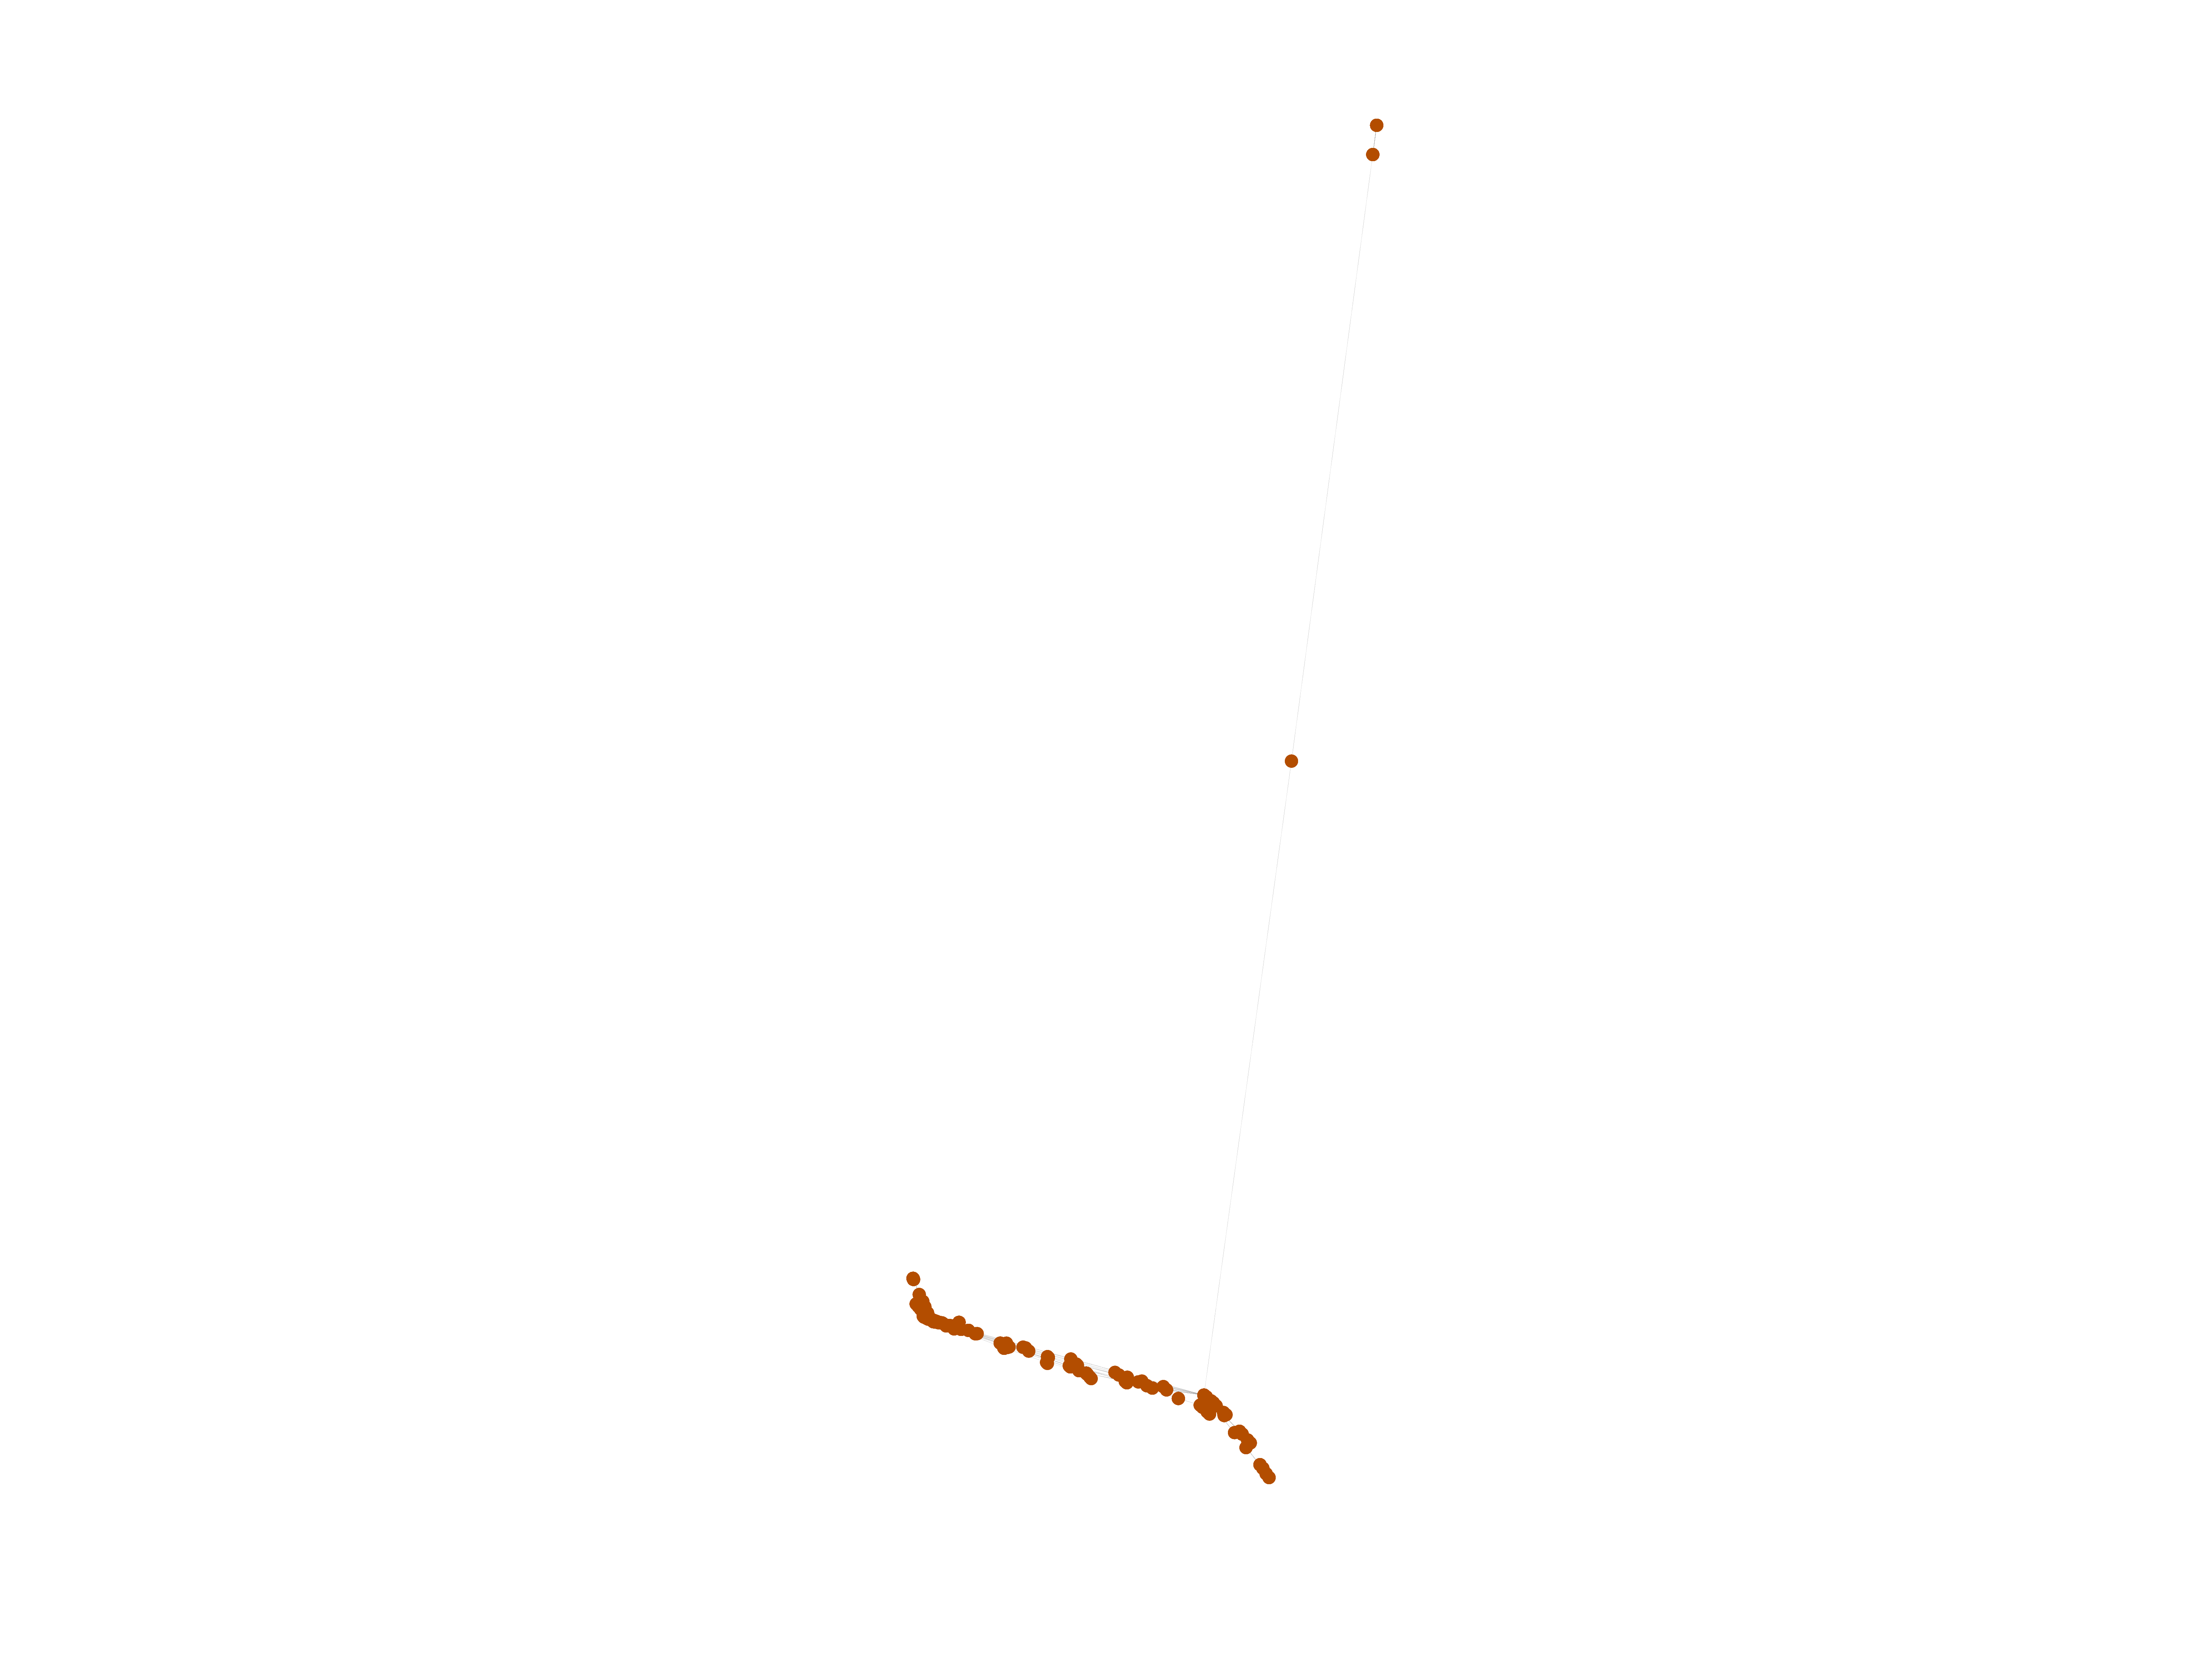
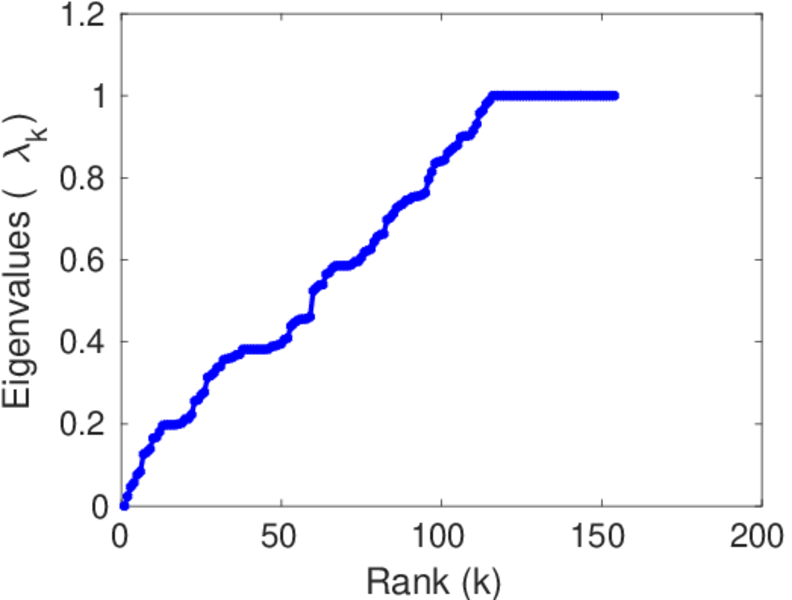
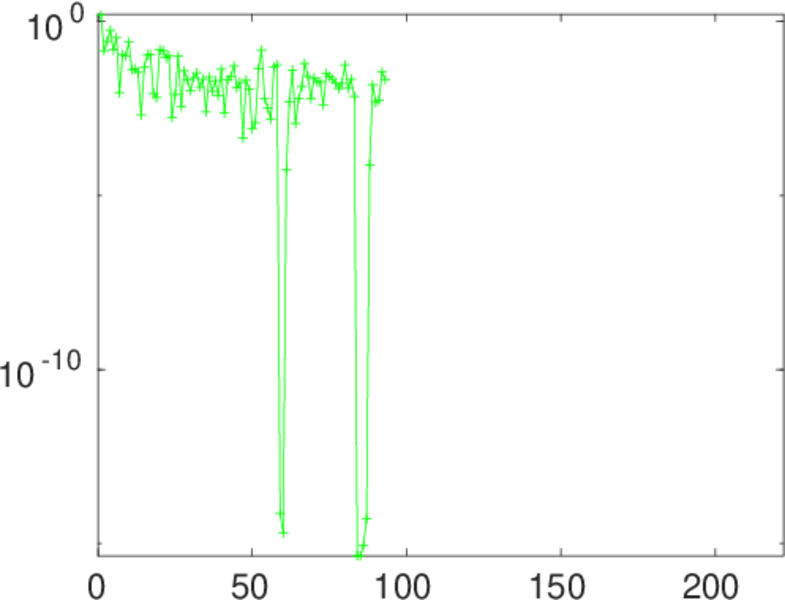
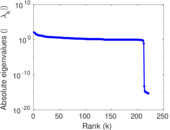
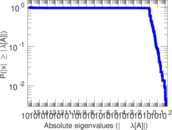
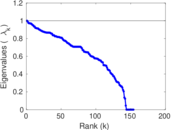
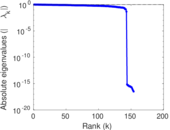
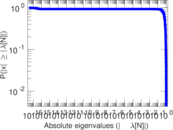
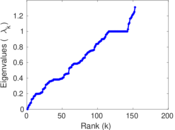
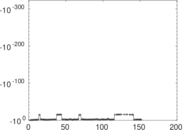
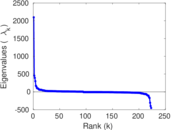
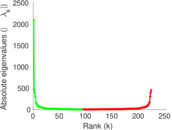
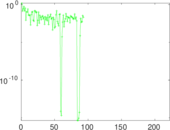
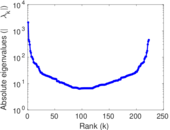
Matrix decompositions plots


Downloads
References
|
[1]
|
Jérôme Kunegis.
KONECT – The Koblenz Network Collection.
In Proc. Int. Conf. on World Wide Web Companion, pages
1343–1350, 2013.
[ http ]
|
|
[2]
|
Wikimedia Foundation.
Wikimedia downloads.
http://dumps.wikimedia.org/, January 2010.
|
 KONECT ‣ Networks ‣
Buy Me a Coffee
KONECT ‣ Networks ‣
Buy Me a Coffee