Wikipedia edits (mwl)
This is the bipartite edit network of the Mirandese Wikipedia. It contains
users and pages from the Mirandese Wikipedia, connected by edit events. Each
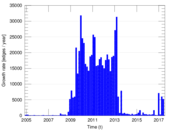
edge represents an edit. The dataset includes the timestamp of each edit.
Metadata
Statistics
| Size | n = | 10,175
|
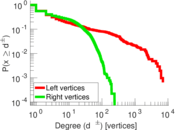
| Left size | n1 = | 1,025
|
| Right size | n2 = | 9,150
|
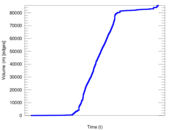
| Volume | m = | 85,777
|
| Unique edge count | m̿ = | 45,002
|
| Wedge count | s = | 20,685,788
|
| Claw count | z = | 9,420,463,683
|
| Cross count | x = | 3,781,570,433,600
|
| Square count | q = | 49,616,387
|
| 4-Tour count | T4 = | 479,799,516
|
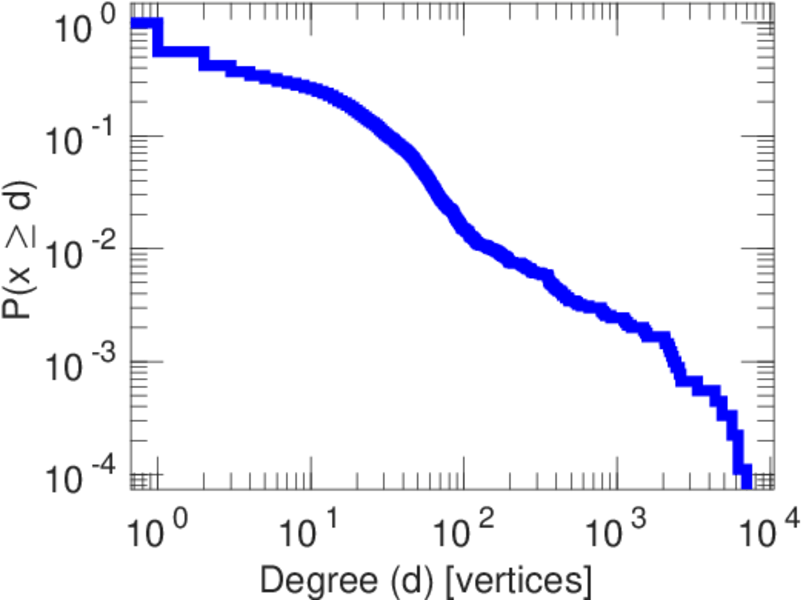
| Maximum degree | dmax = | 6,984
|
| Maximum left degree | d1max = | 6,984
|
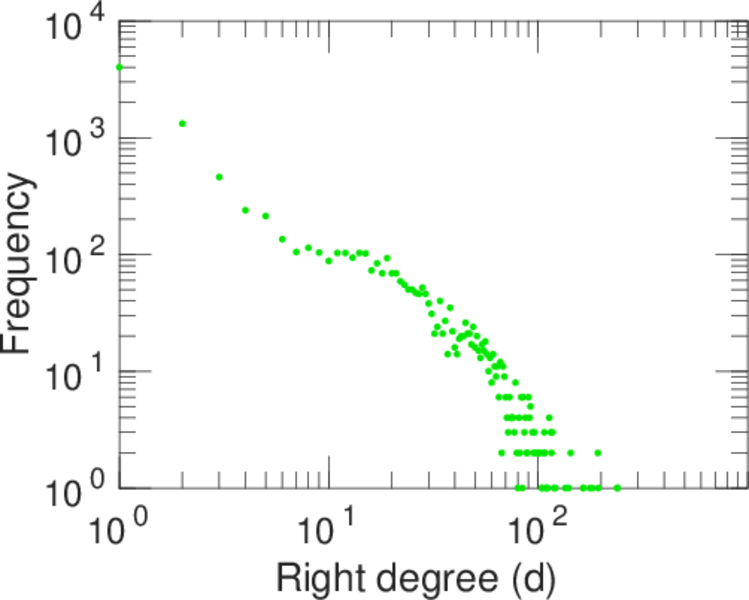
| Maximum right degree | d2max = | 240
|
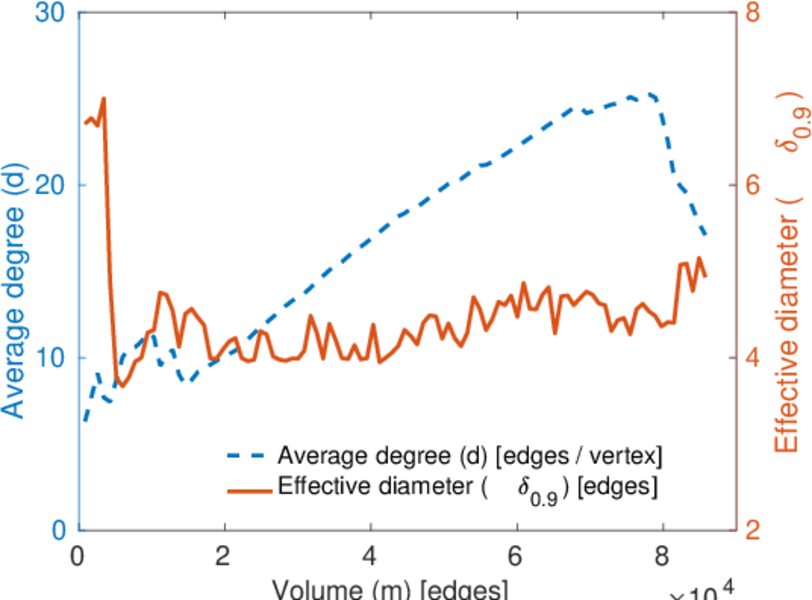
| Average degree | d = | 16.860 3
|
| Average left degree | d1 = | 83.684 9
|
| Average right degree | d2 = | 9.374 54
|
| Fill | p = | 0.004 798 29
|
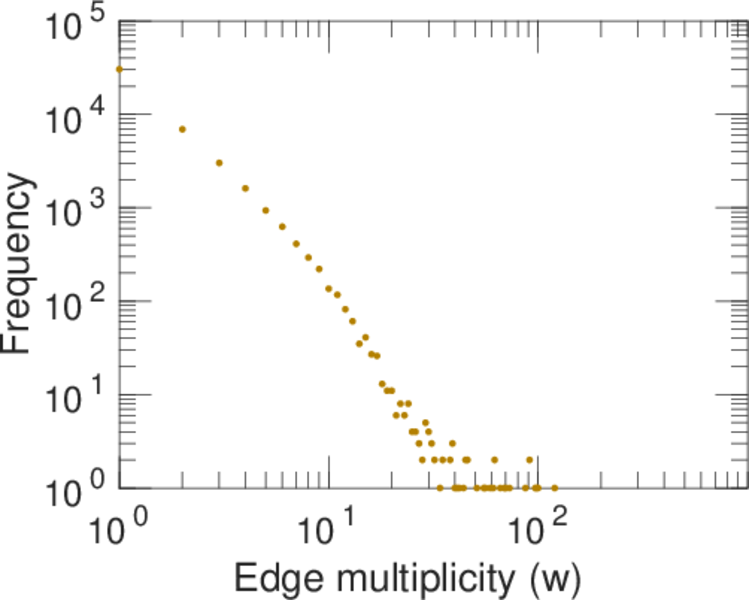
| Average edge multiplicity | m̃ = | 1.906 07
|
| Size of LCC | N = | 9,515
|
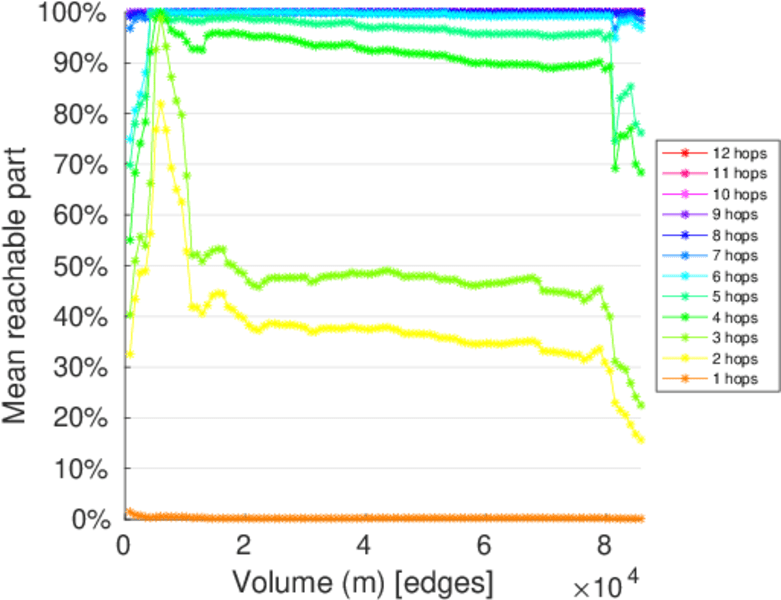
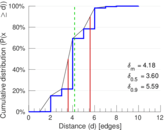
| Diameter | δ = | 12
|
| 50-Percentile effective diameter | δ0.5 = | 3.595 20
|
| 90-Percentile effective diameter | δ0.9 = | 5.587 22
|
| Median distance | δM = | 4
|
| Mean distance | δm = | 4.178 70
|
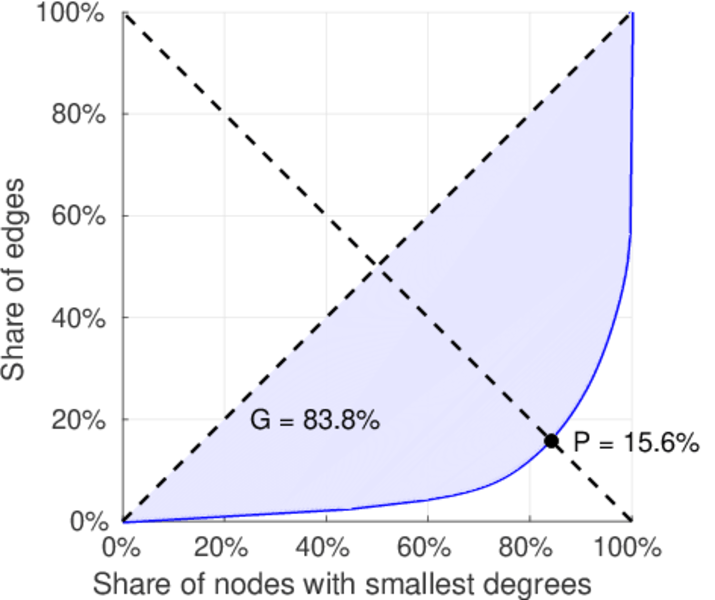
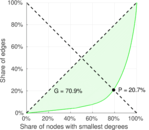
| Gini coefficient | G = | 0.841 809
|
| Balanced inequality ratio | P = | 0.156 108
|
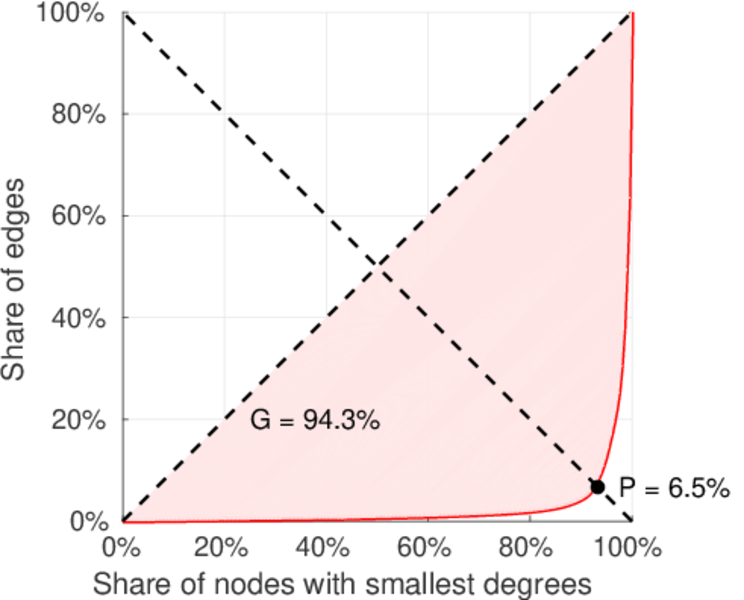
| Left balanced inequality ratio | P1 = | 0.065 495 4
|
| Right balanced inequality ratio | P2 = | 0.206 874
|
| Relative edge distribution entropy | Her = | 0.772 877
|
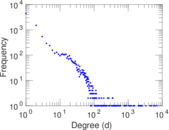
| Power law exponent | γ = | 2.120 83
|
| Tail power law exponent | γt = | 2.521 00
|
| Tail power law exponent with p | γ3 = | 2.521 00
|
| p-value | p = | 0.000 00
|
| Left tail power law exponent with p | γ3,1 = | 1.671 00
|
| Left p-value | p1 = | 0.000 00
|
| Right tail power law exponent with p | γ3,2 = | 6.951 00
|
| Right p-value | p2 = | 0.190 000
|
| Degree assortativity | ρ = | −0.050 343 9
|
| Degree assortativity p-value | pρ = | 1.180 22 × 10−26
|
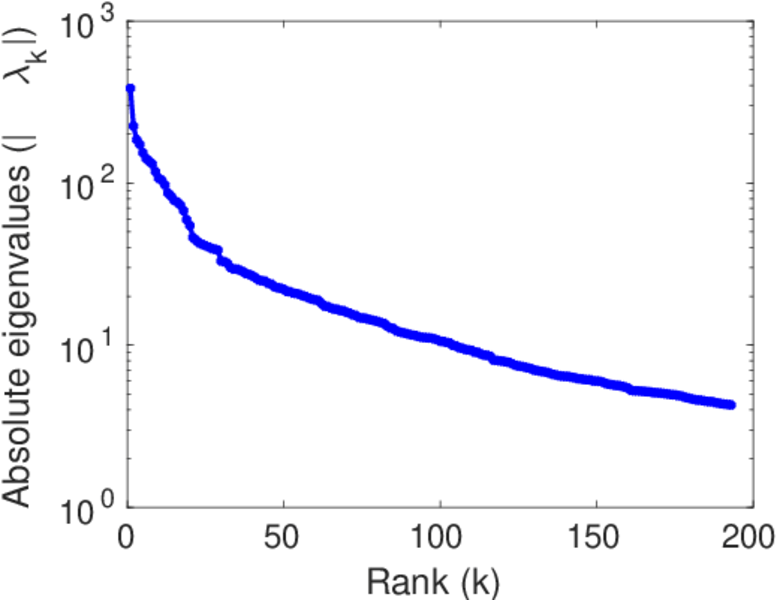
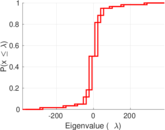
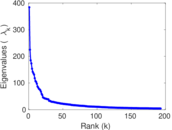
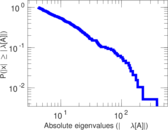
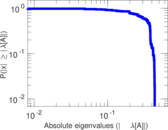
| Spectral norm | α = | 383.904
|
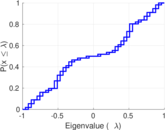
| Algebraic connectivity | a = | 0.008 147 30
|
| Spectral separation | |λ1[A] / λ2[A]| = | 1.708 16
|
| Controllability | C = | 8,263
|
| Relative controllability | Cr = | 0.823 254
|
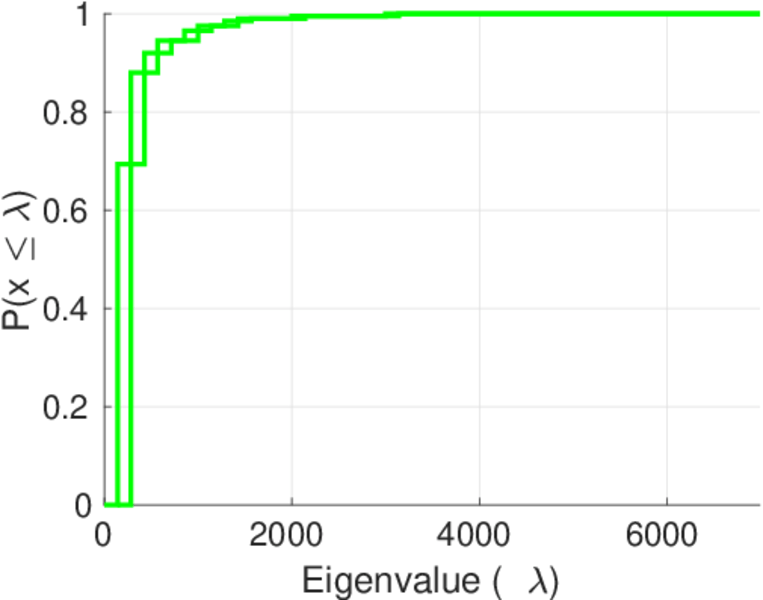
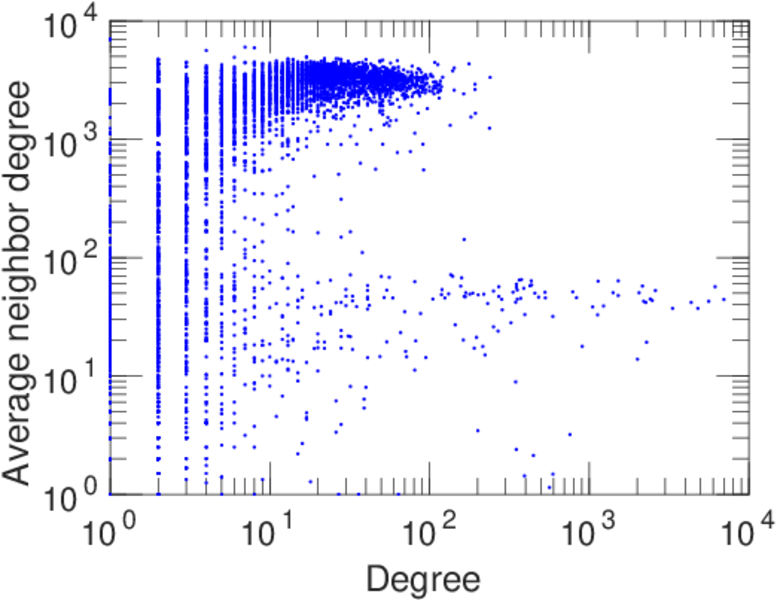
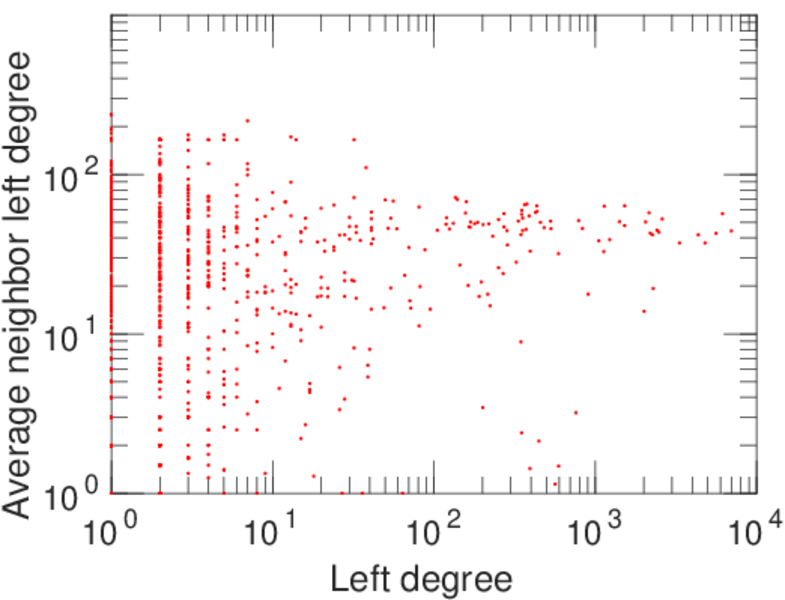
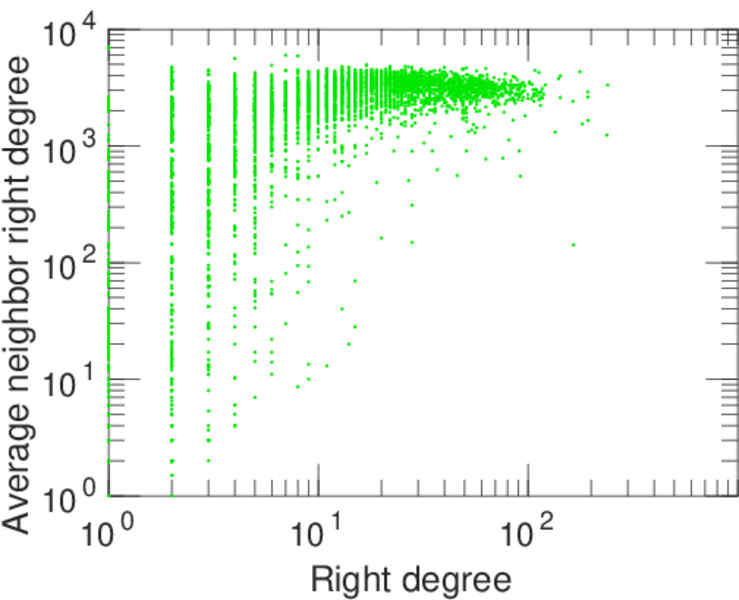
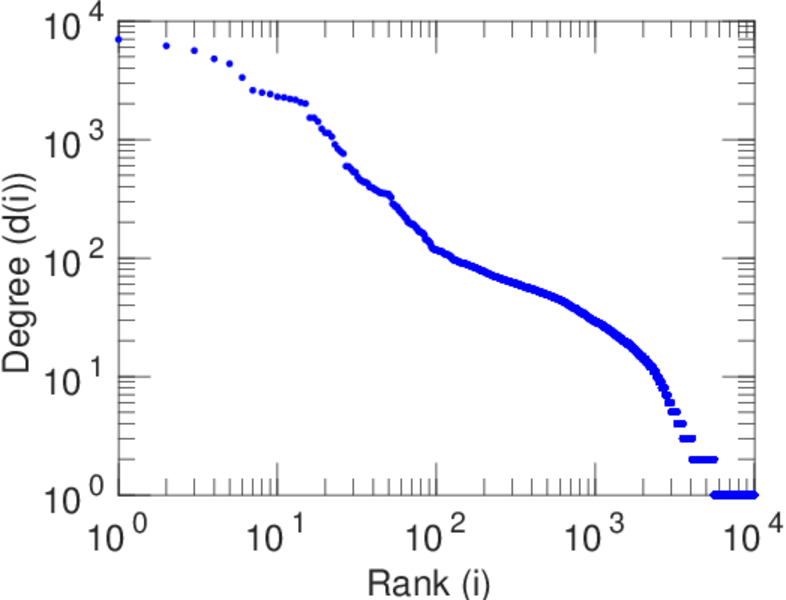
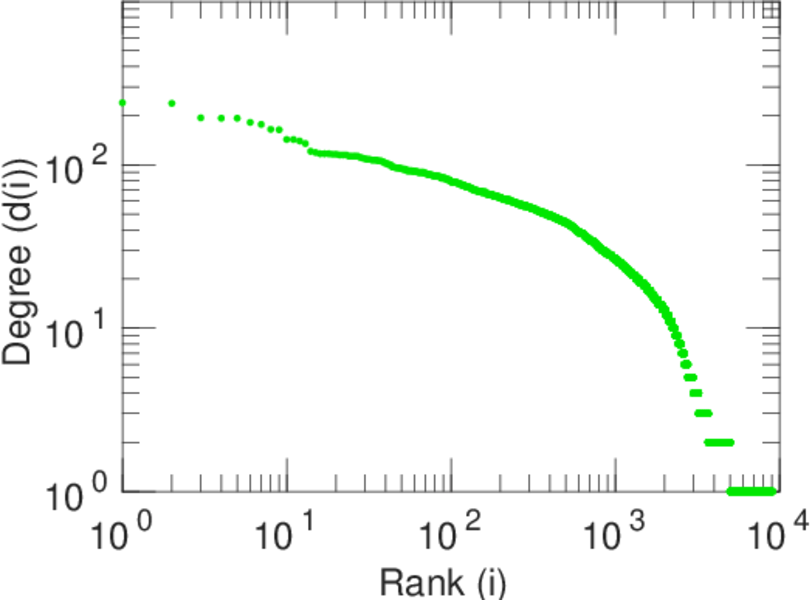
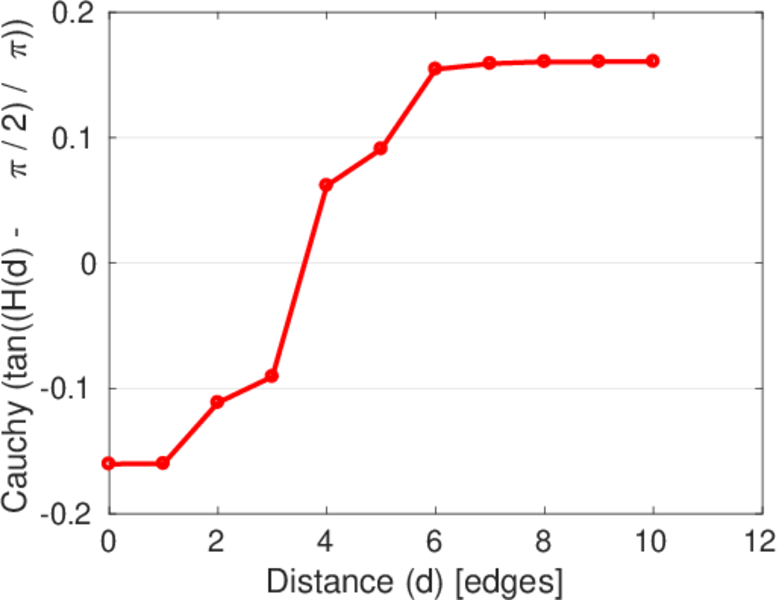
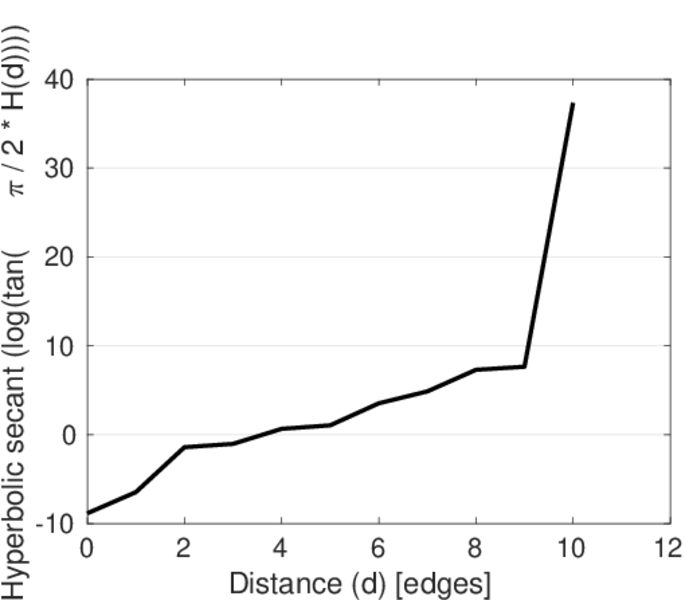
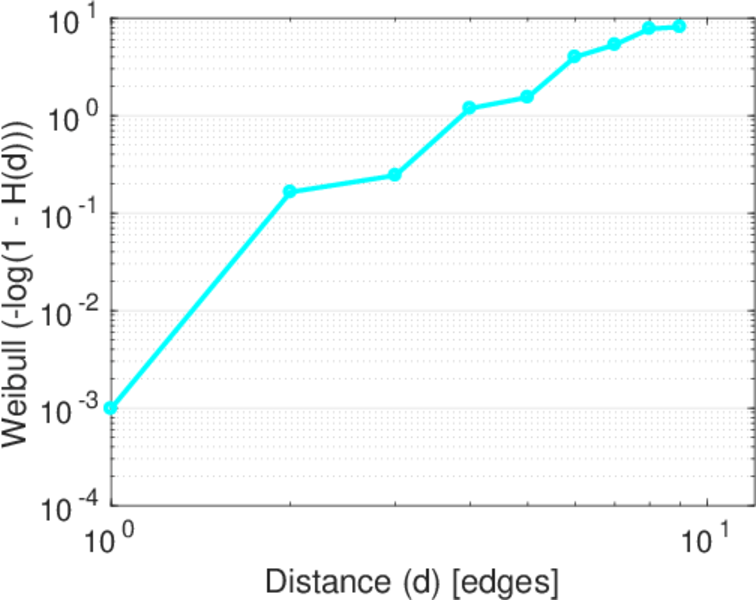
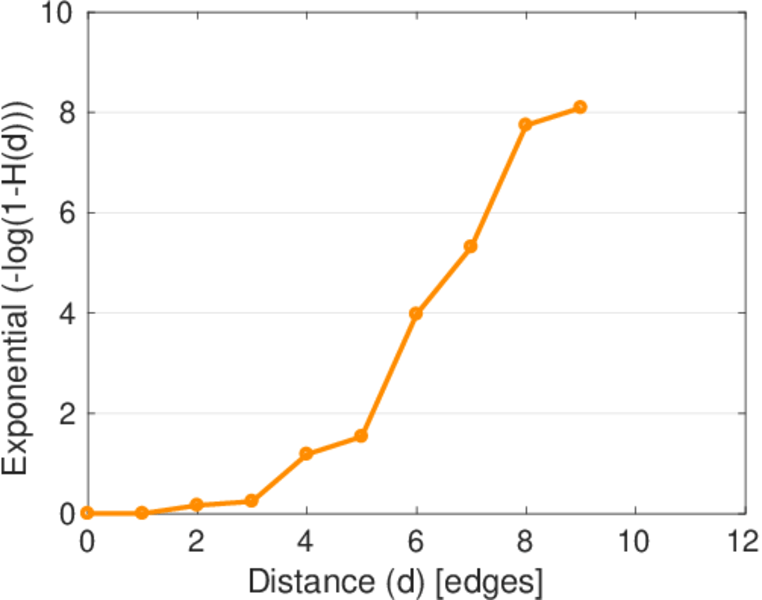
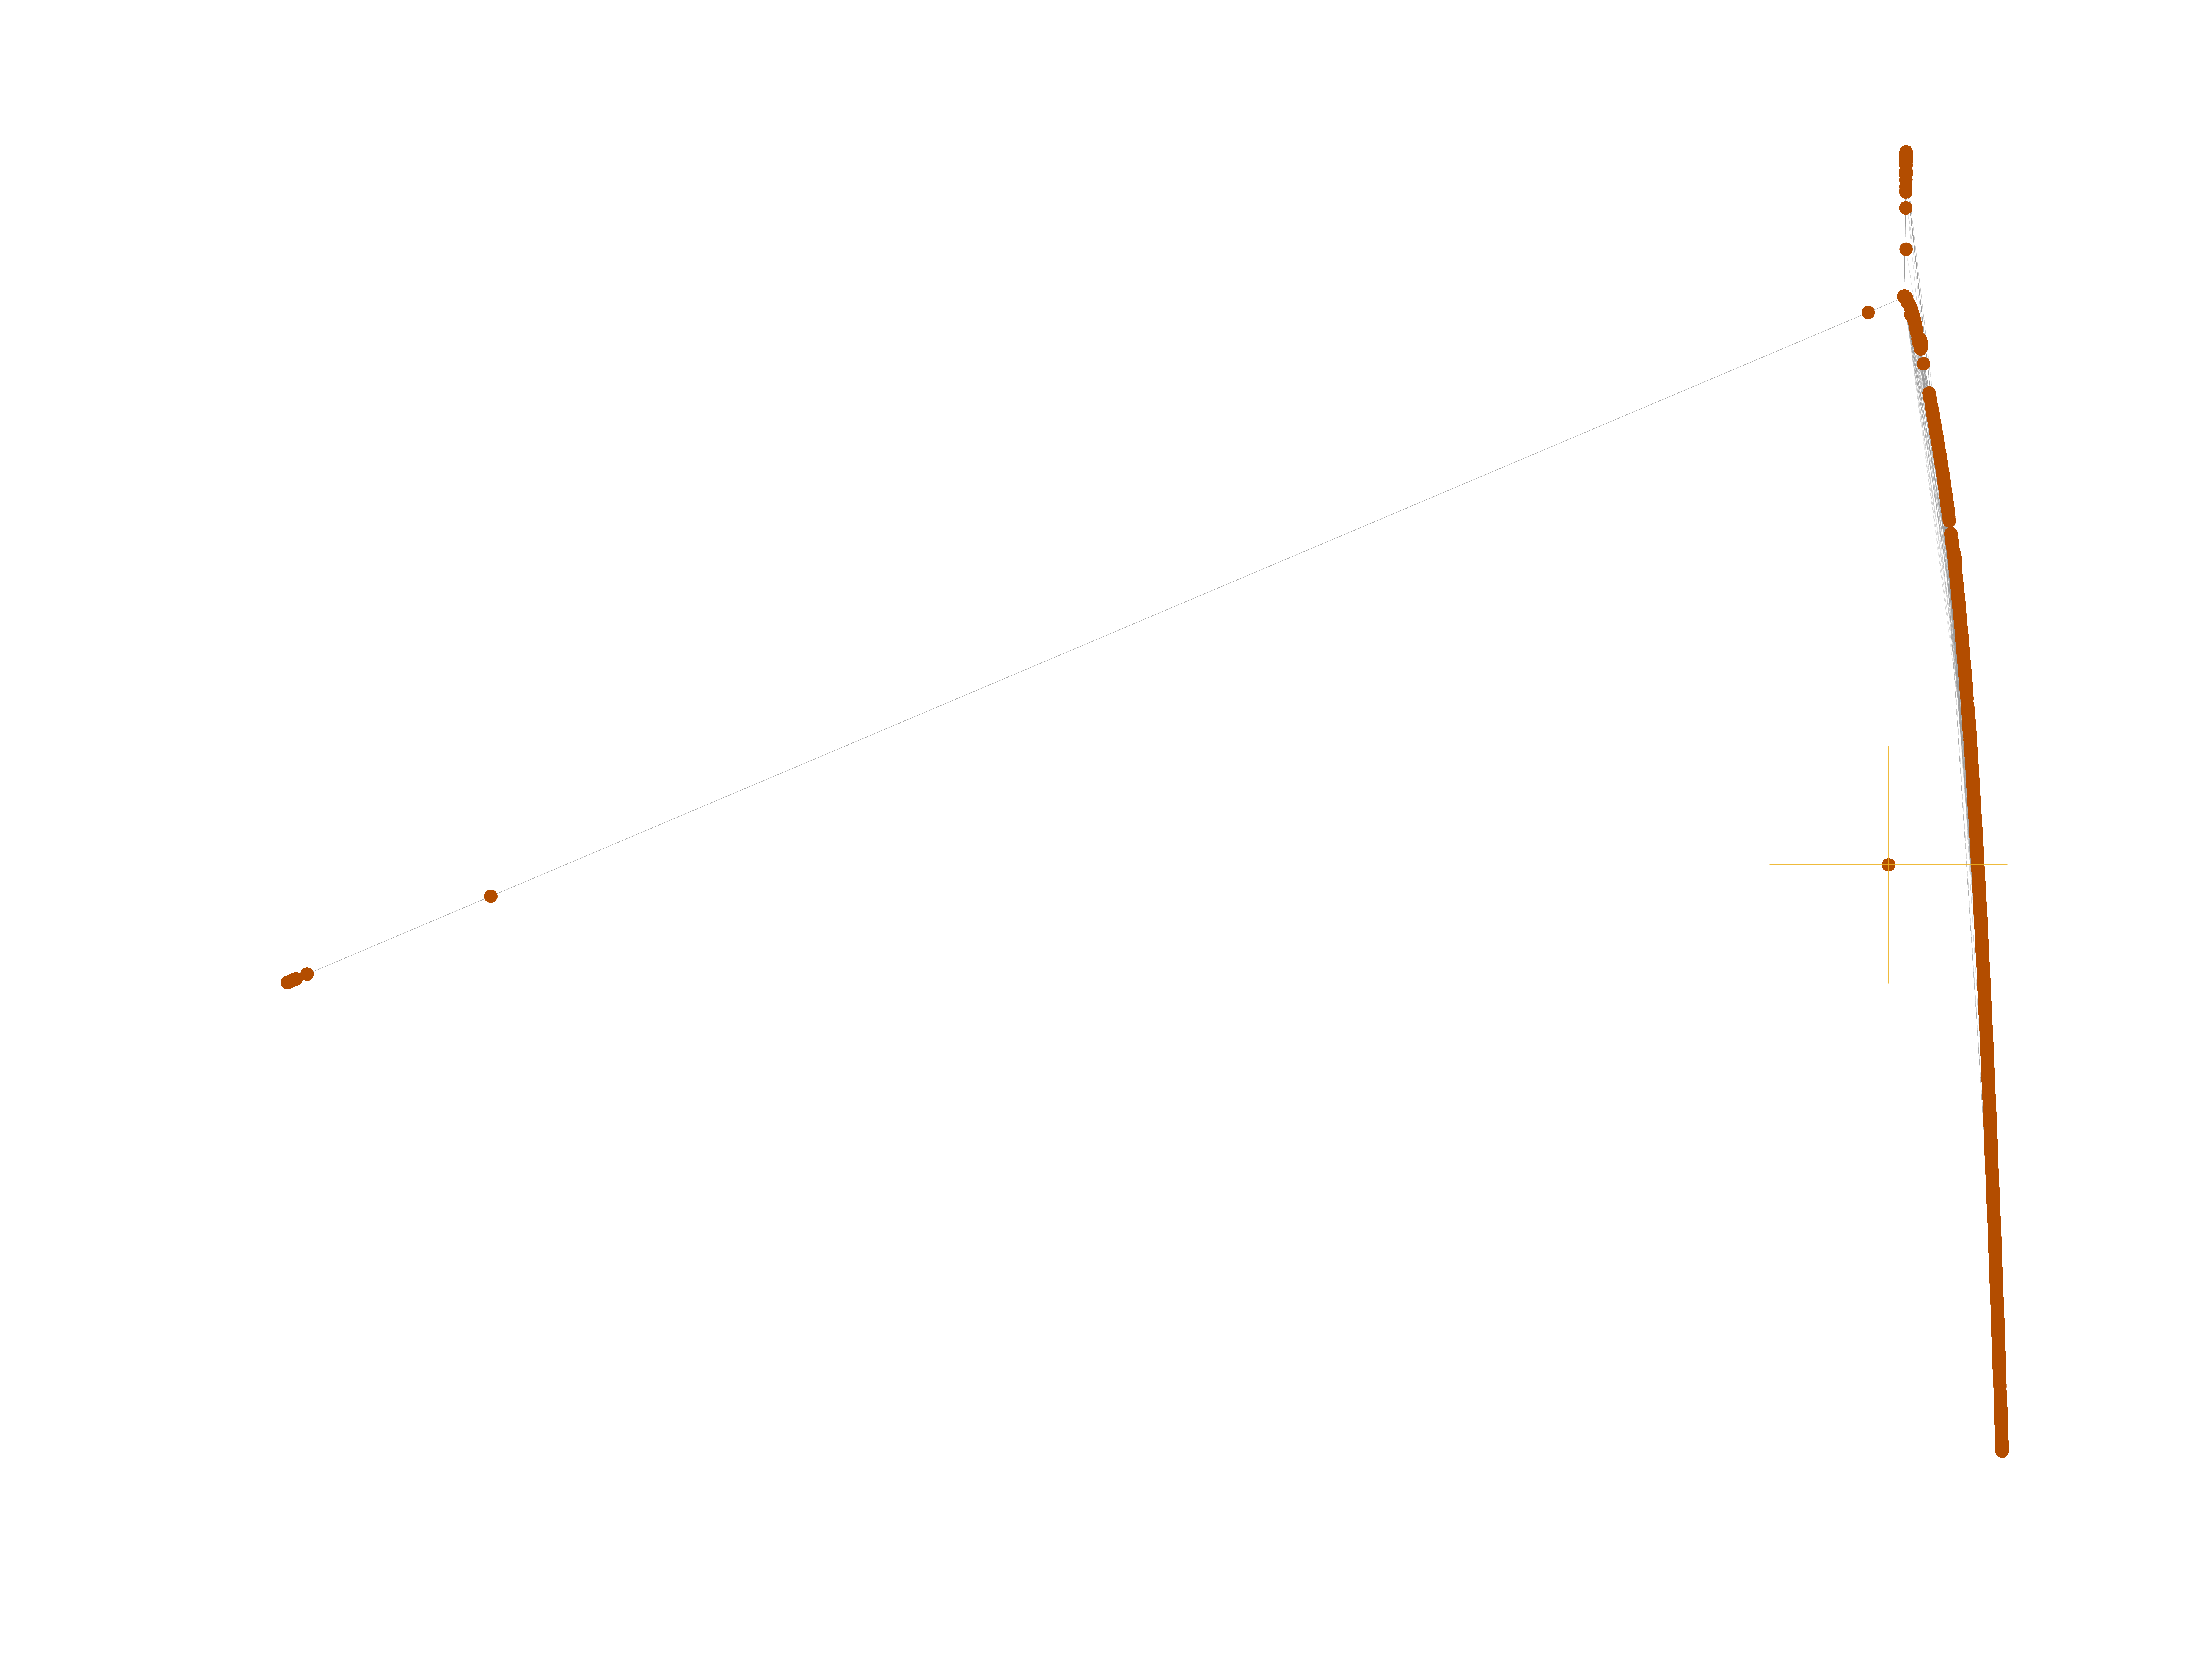
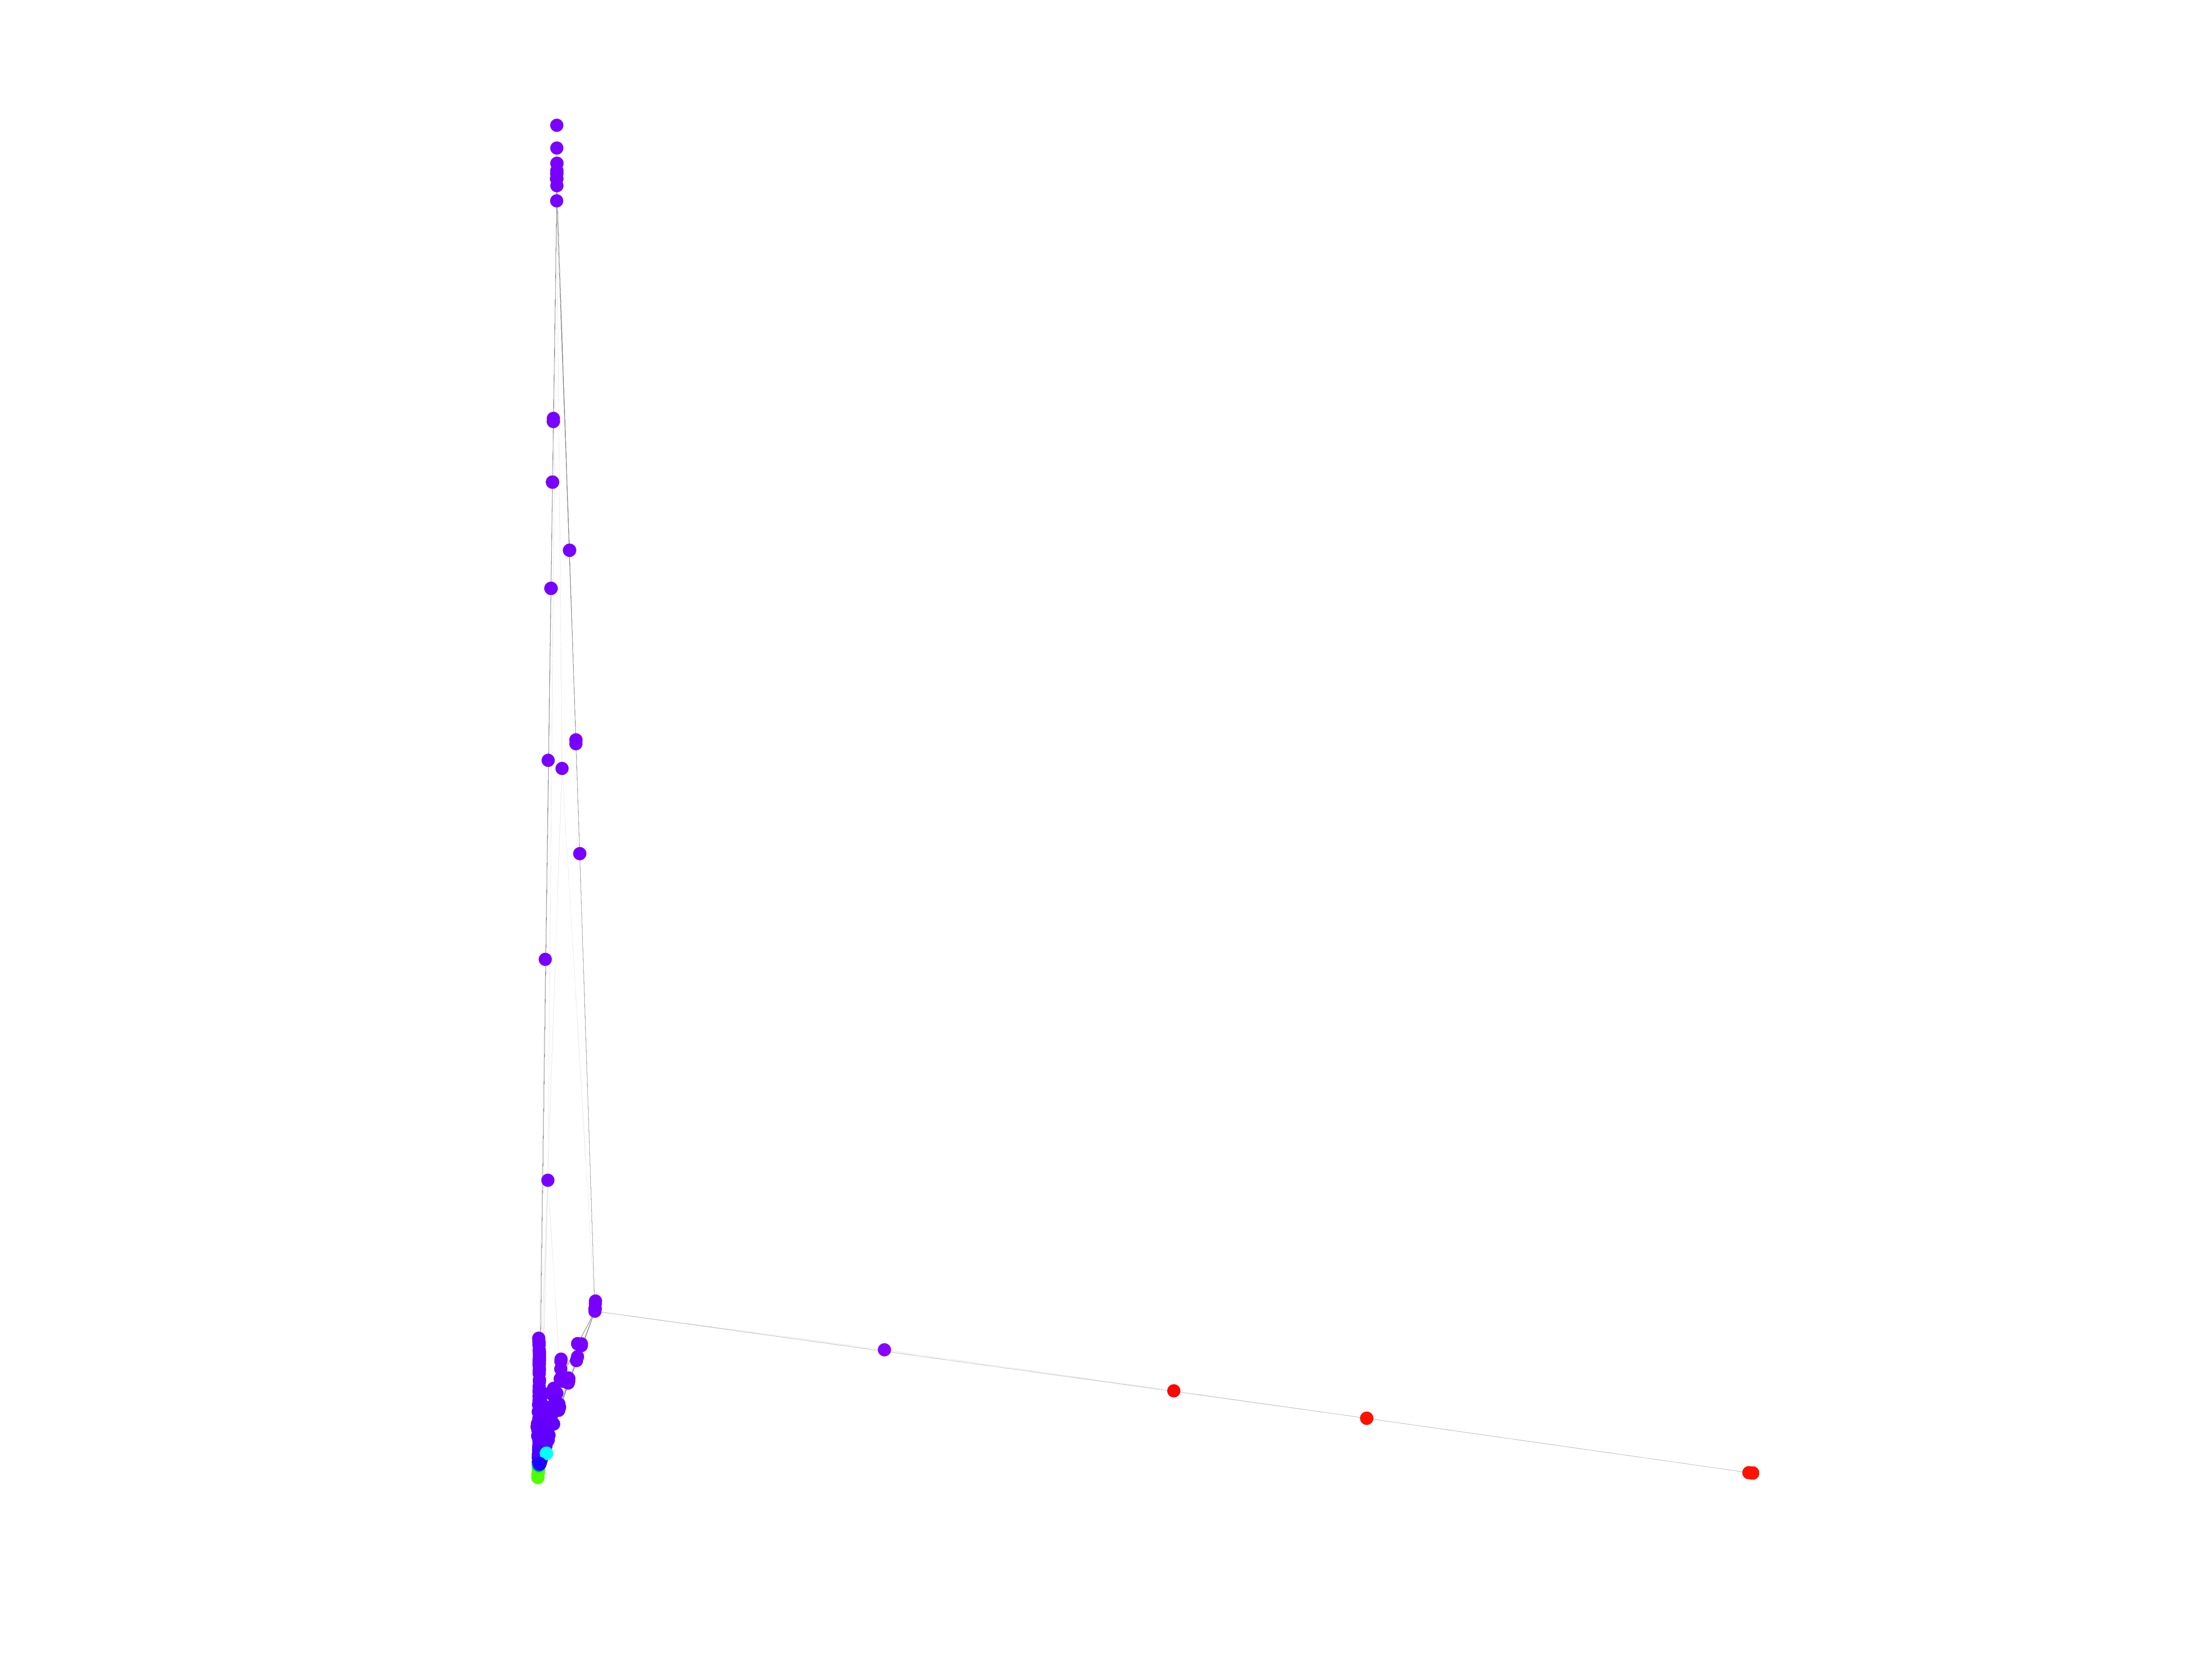
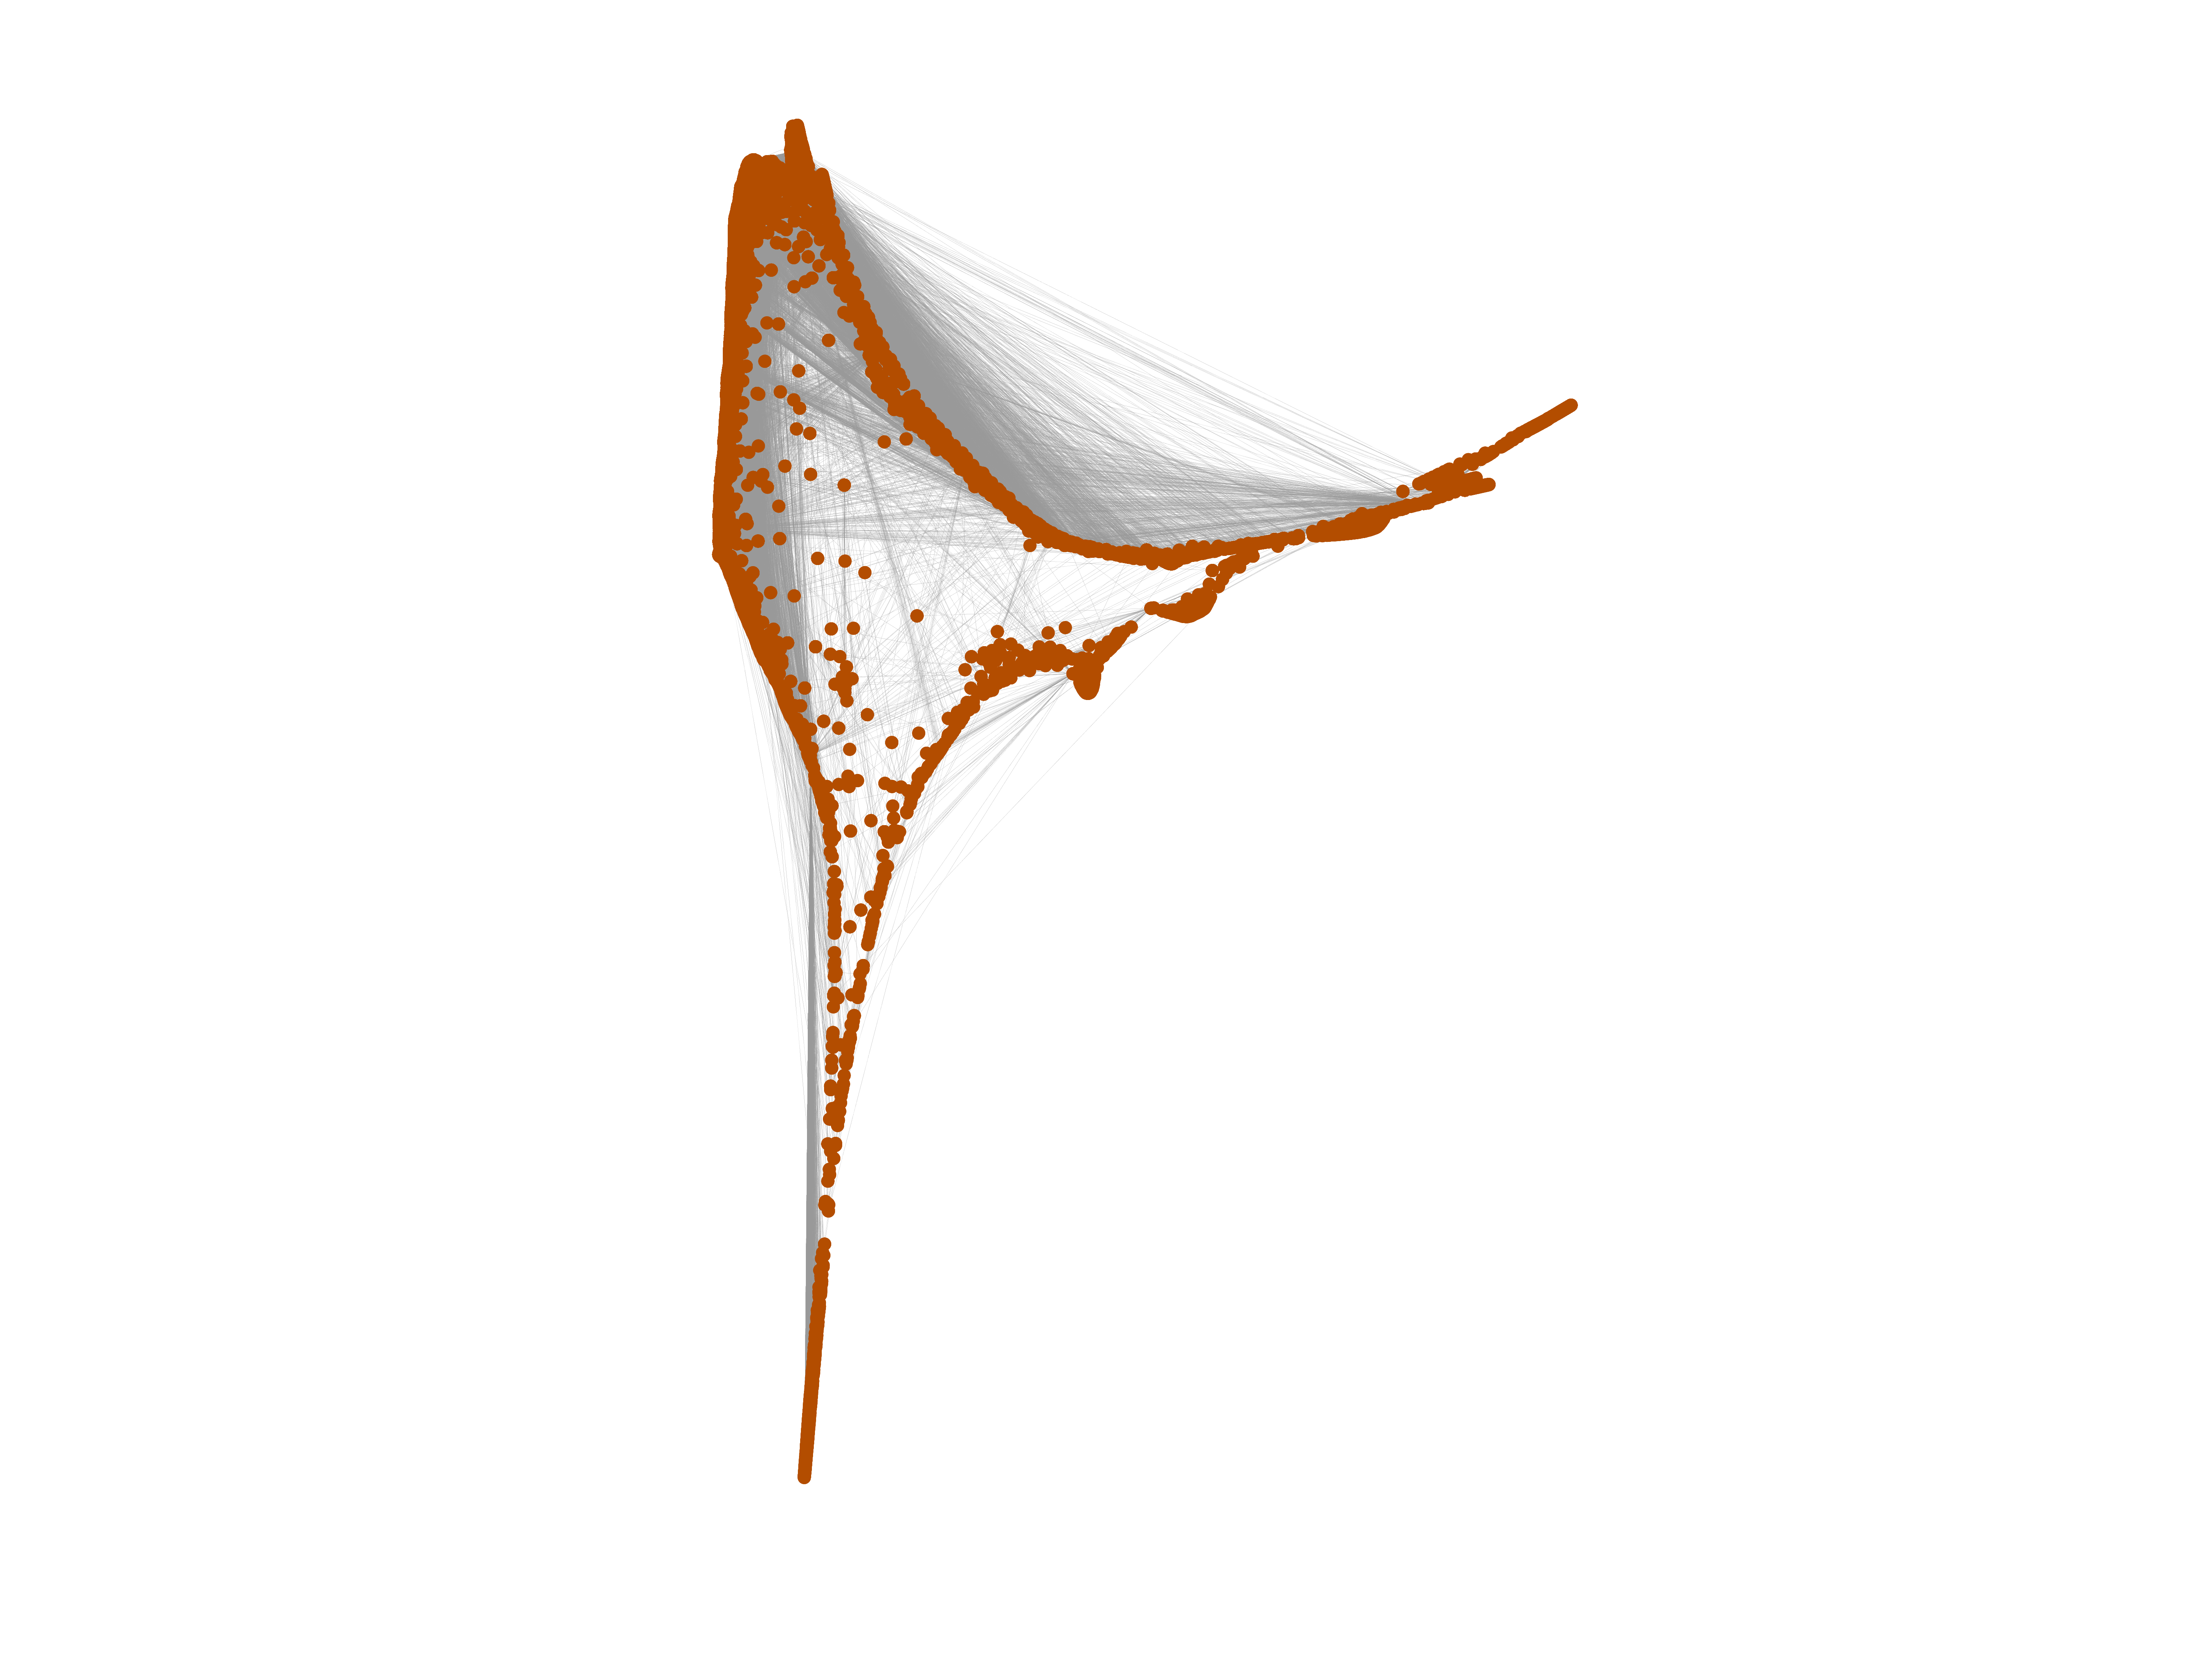
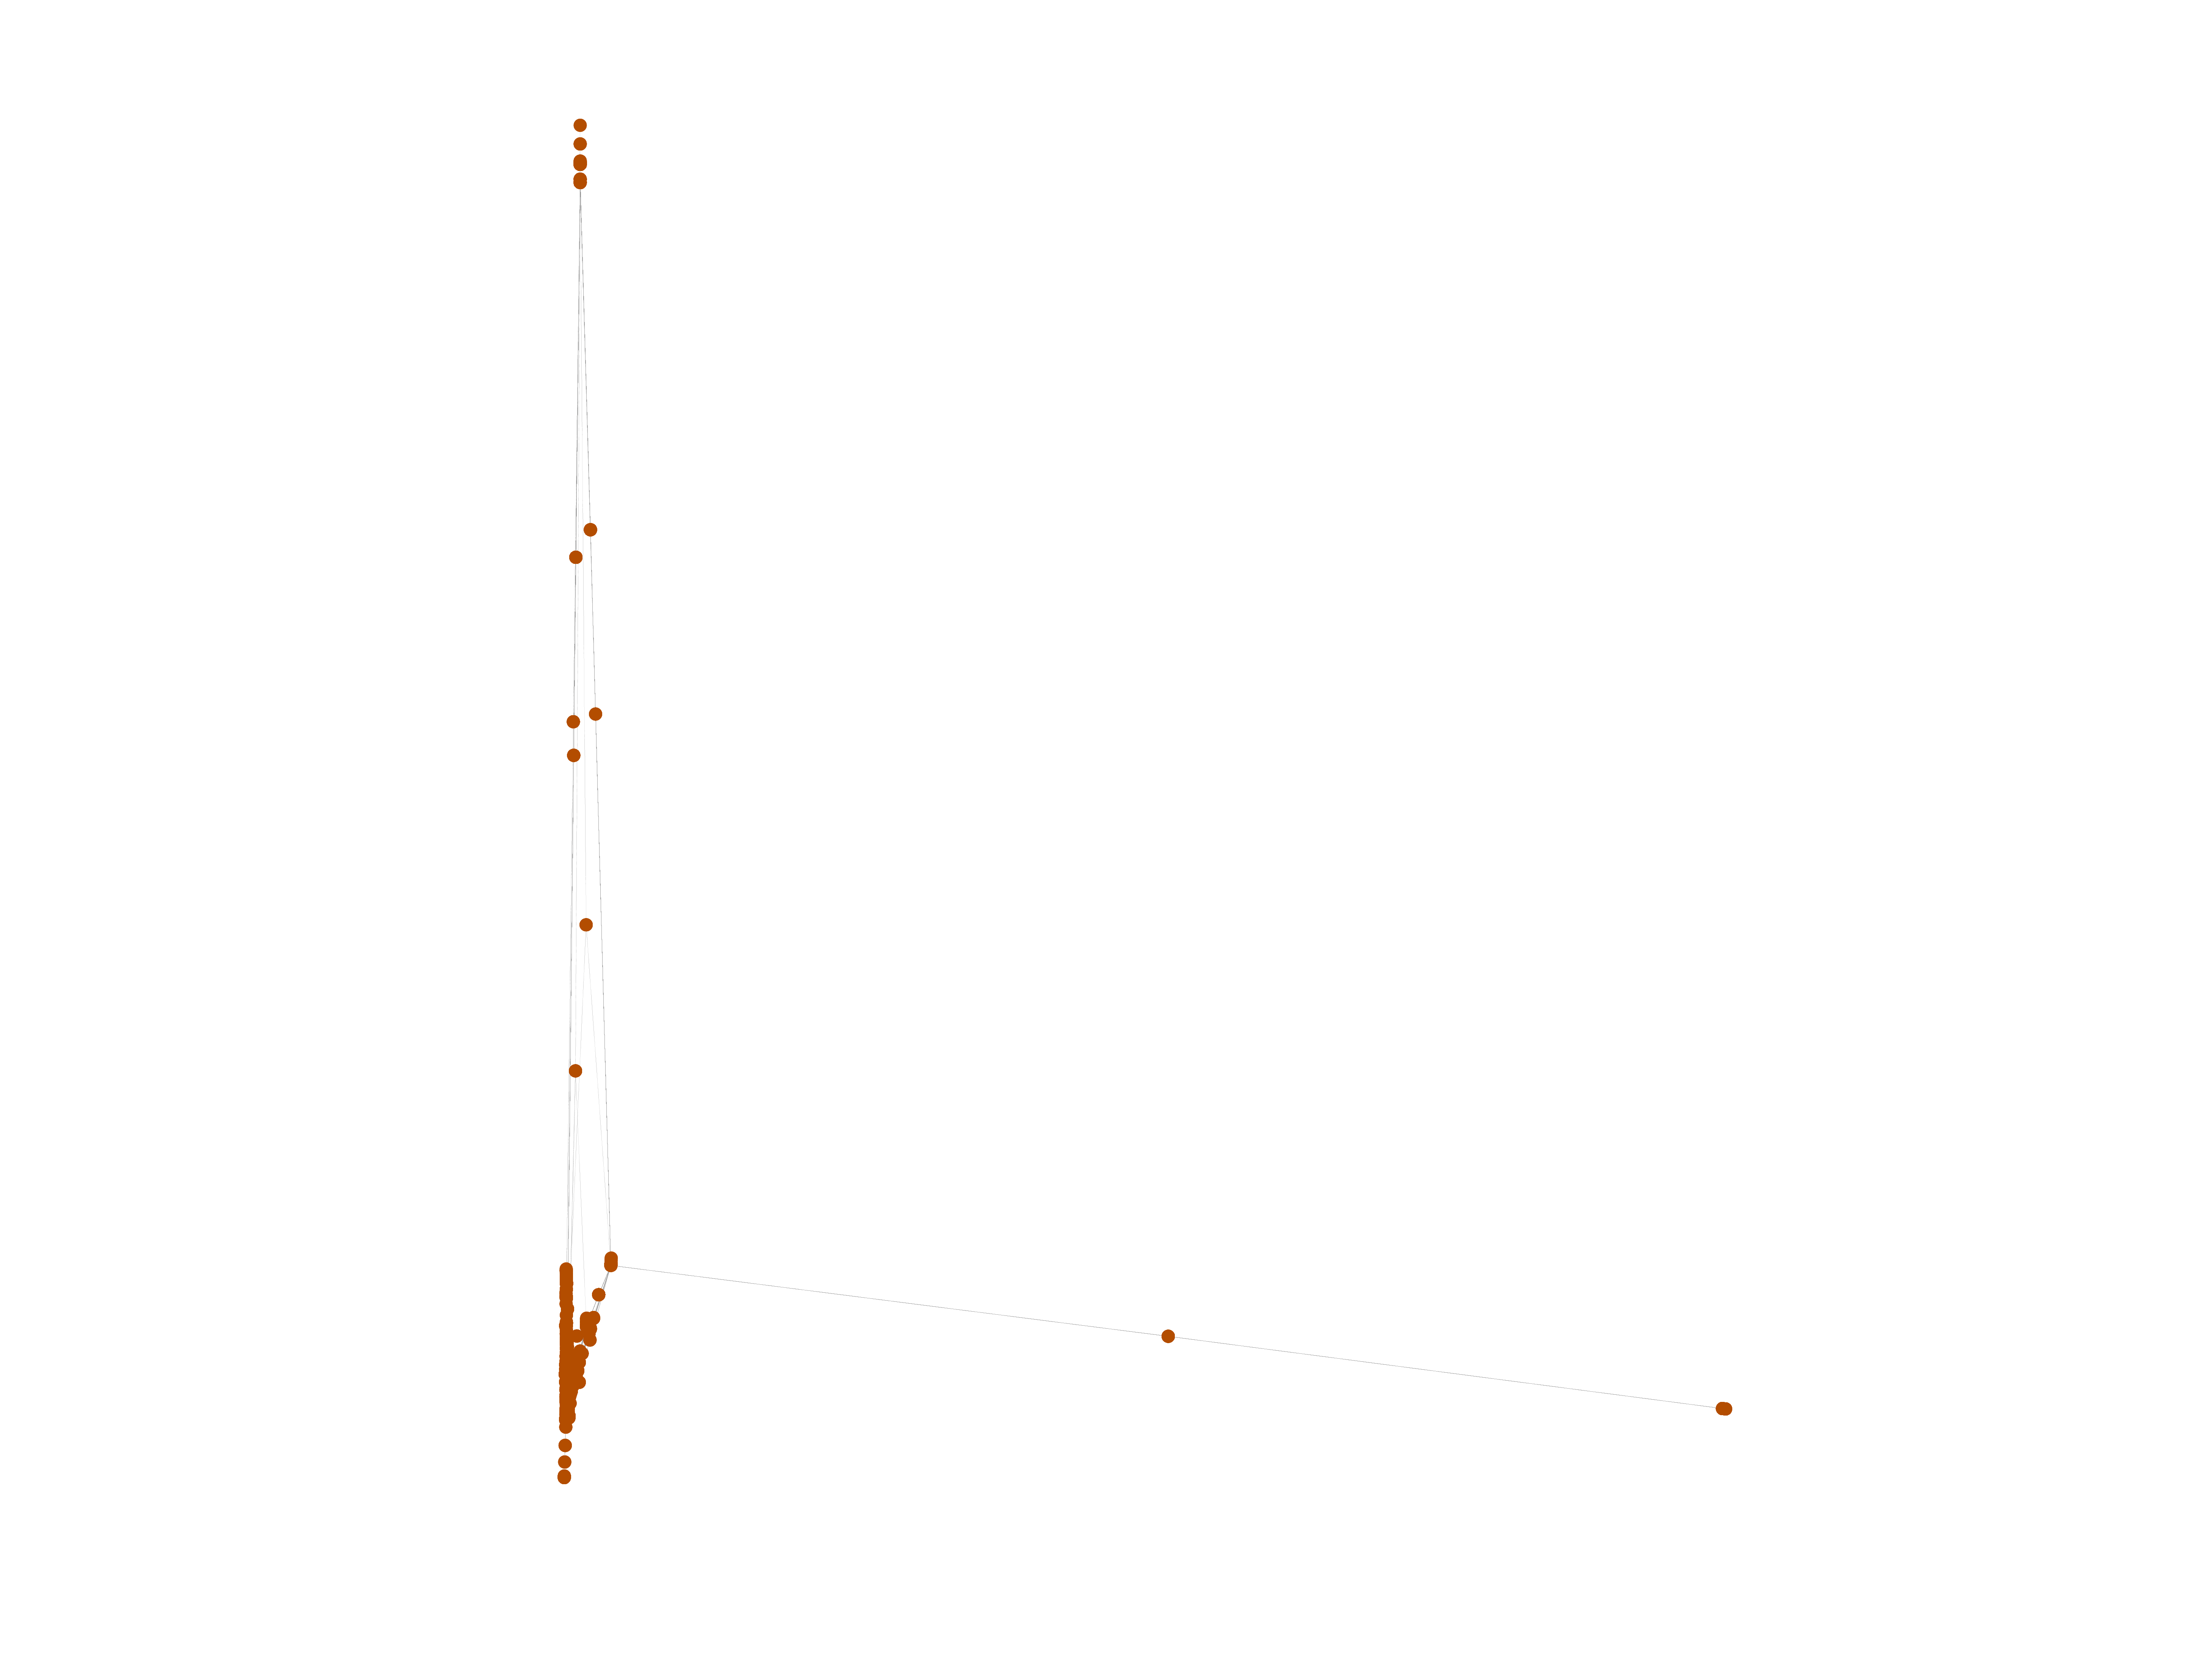
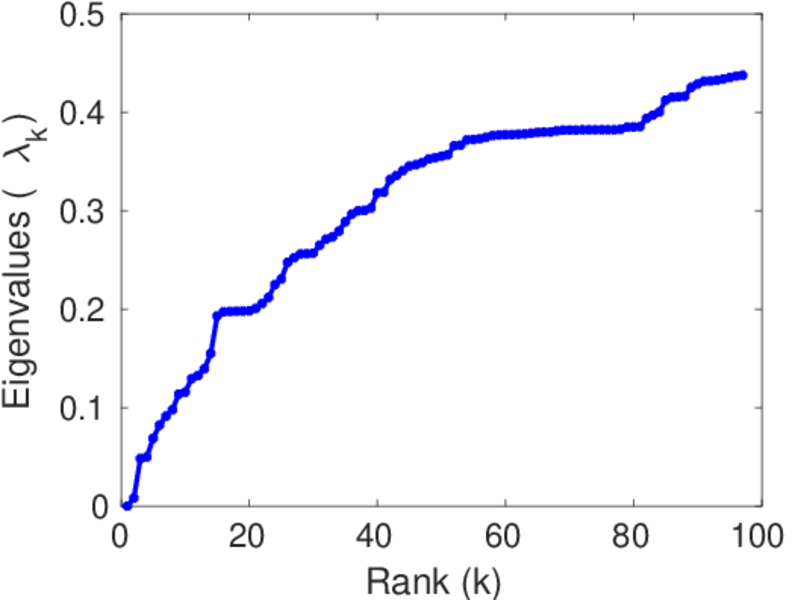
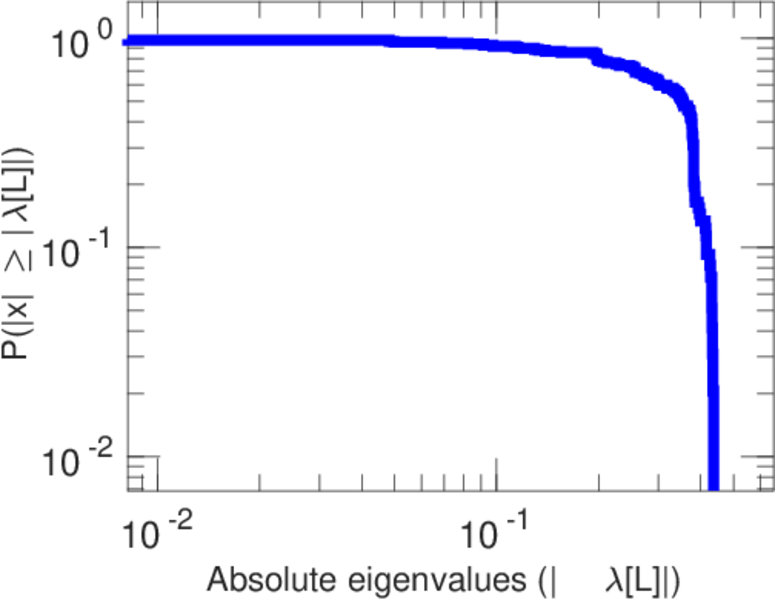
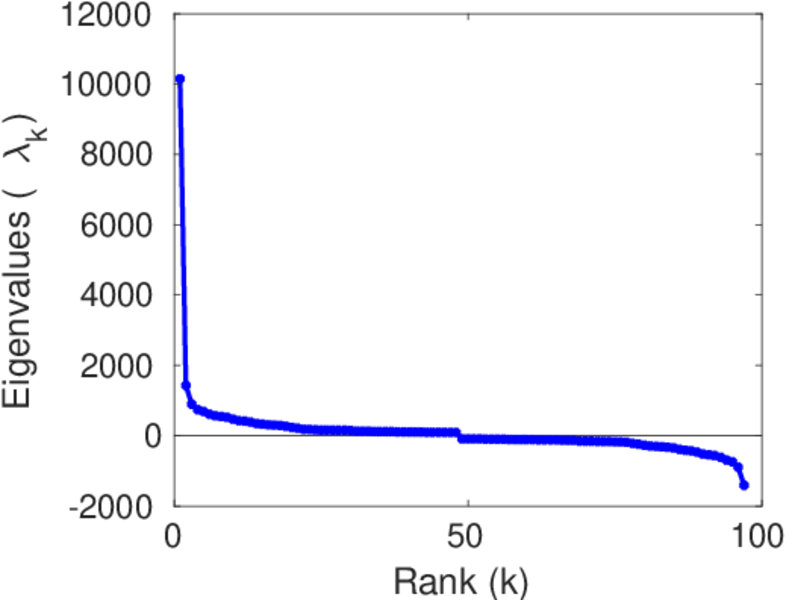
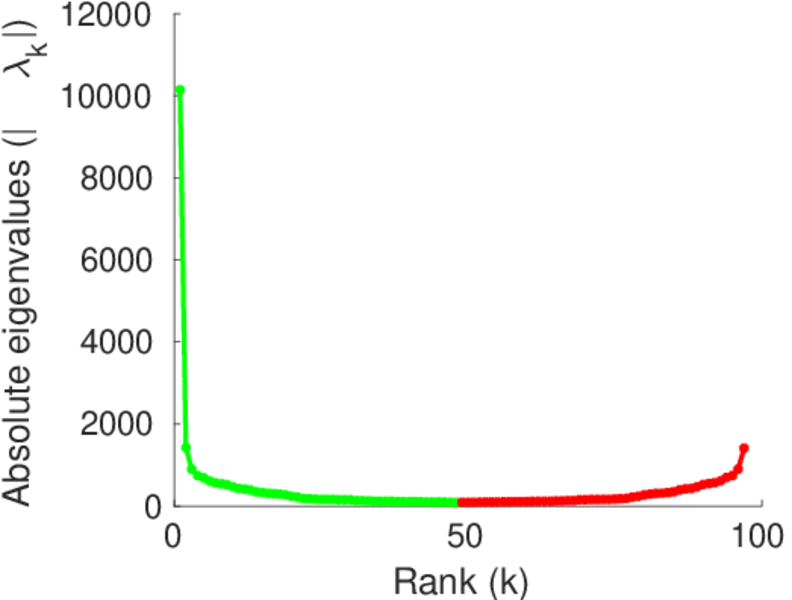
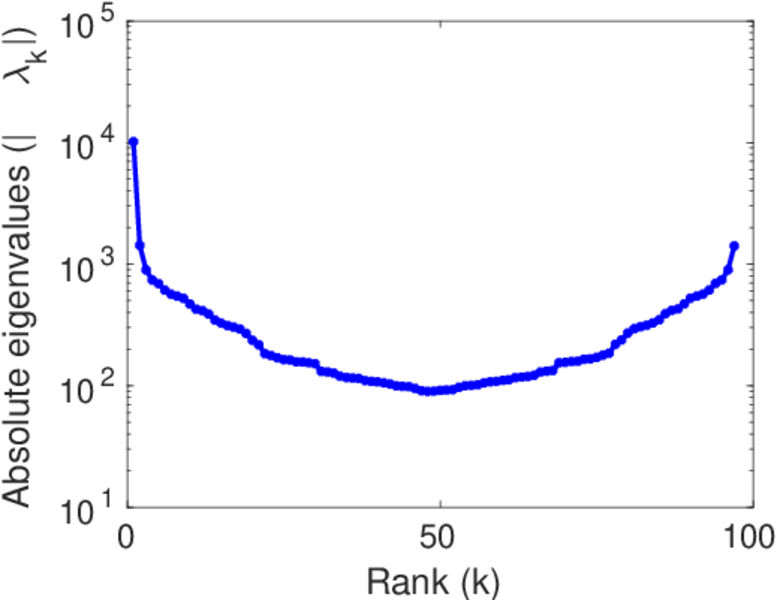
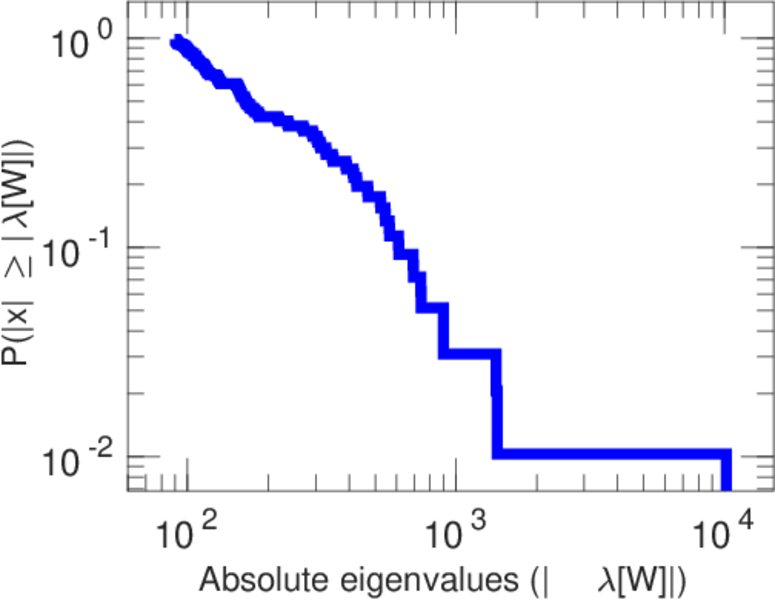
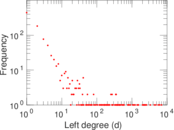
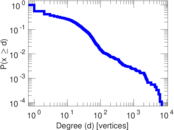
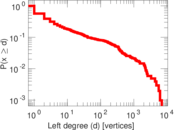
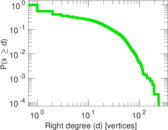
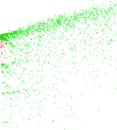
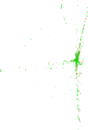
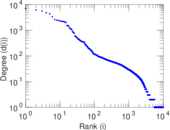
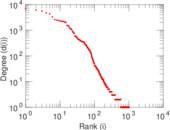
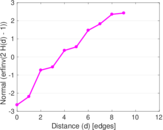
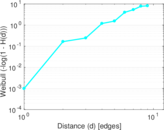
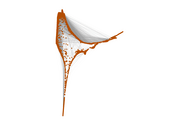
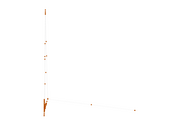
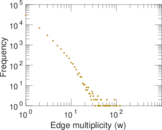
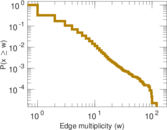
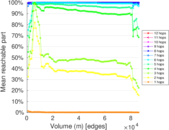
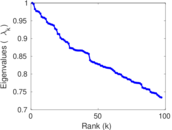
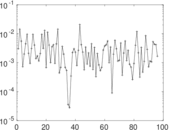
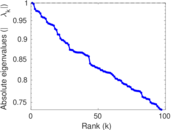
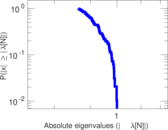
Plots


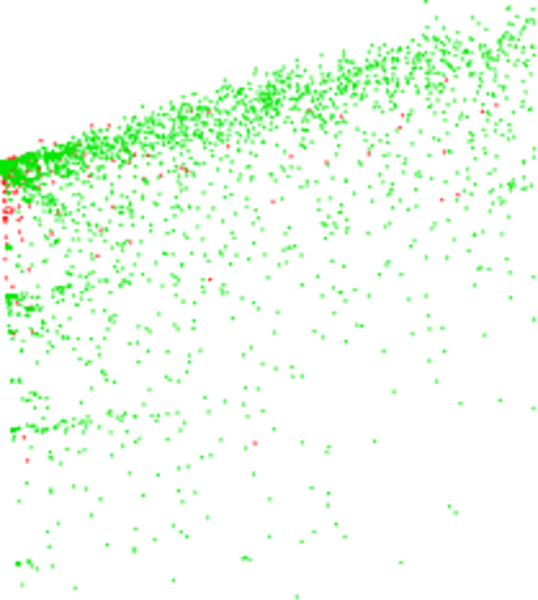
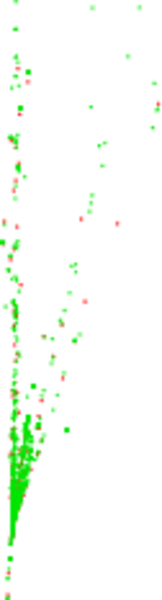
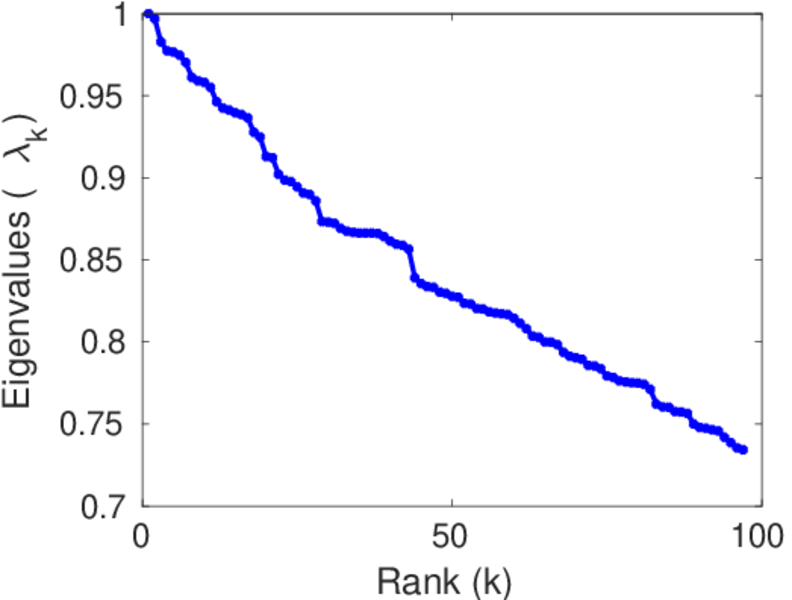
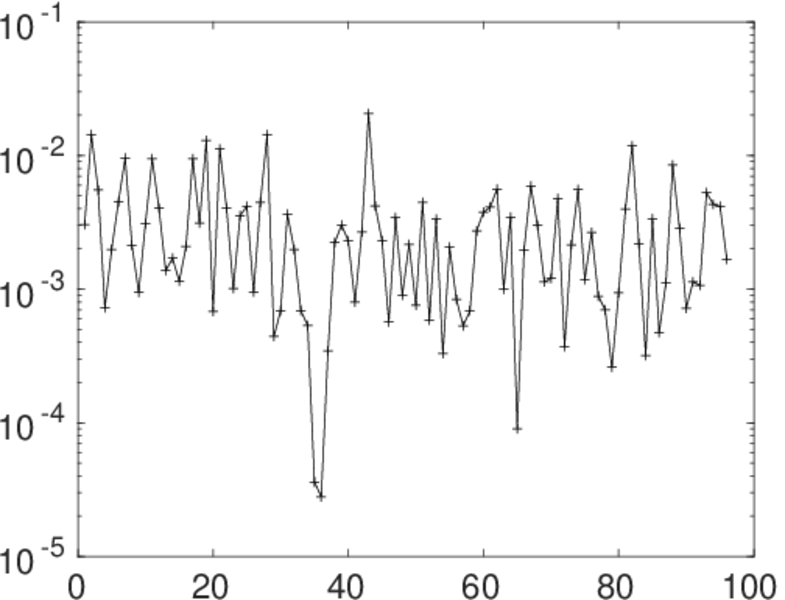
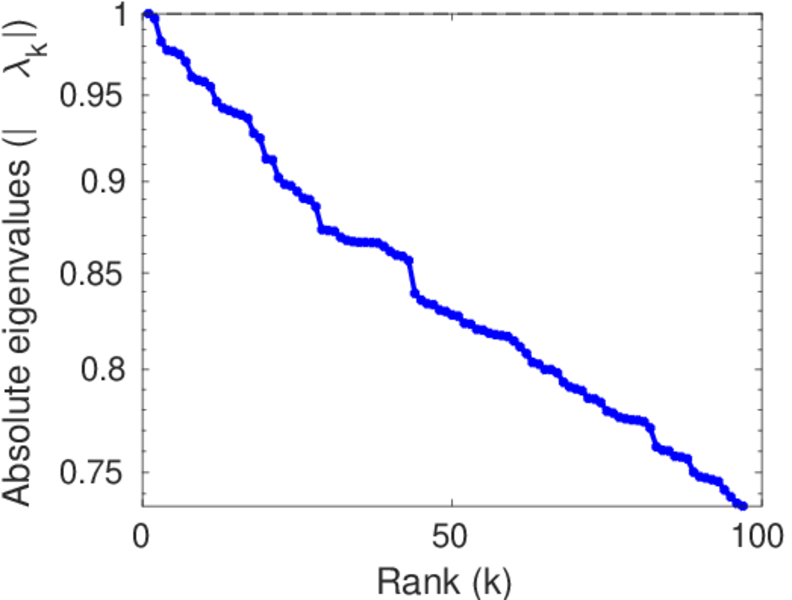
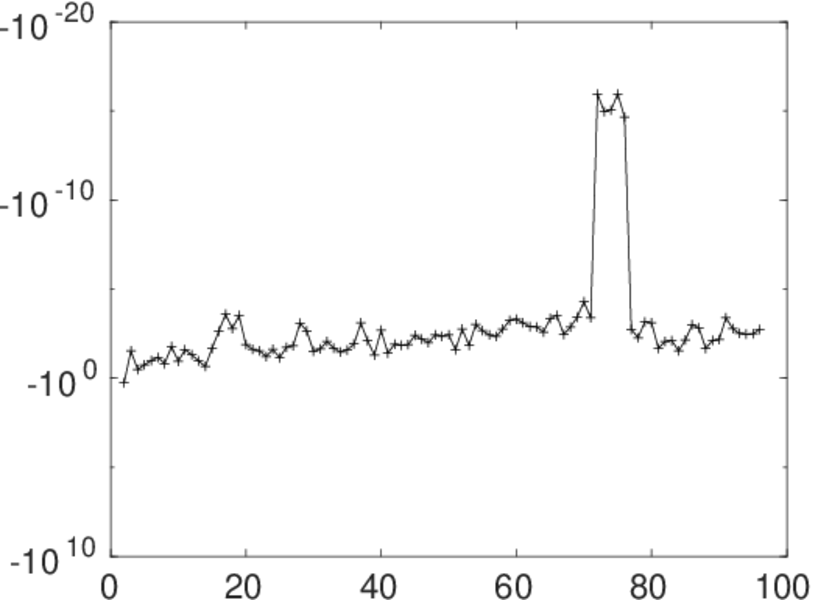
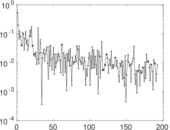
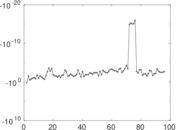
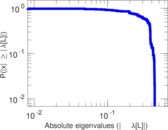
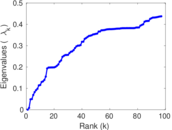
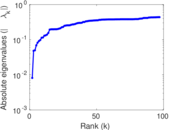
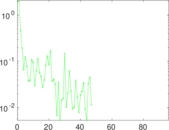
Matrix decompositions plots


Downloads
References
|
[1]
|
Jérôme Kunegis.
KONECT – The Koblenz Network Collection.
In Proc. Int. Conf. on World Wide Web Companion, pages
1343–1350, 2013.
[ http ]
|
|
[2]
|
Wikimedia Foundation.
Wikimedia downloads.
http://dumps.wikimedia.org/, January 2010.
|
 KONECT ‣ Networks ‣
Buy Me a Coffee
KONECT ‣ Networks ‣
Buy Me a Coffee