Wikipedia edits (myv)
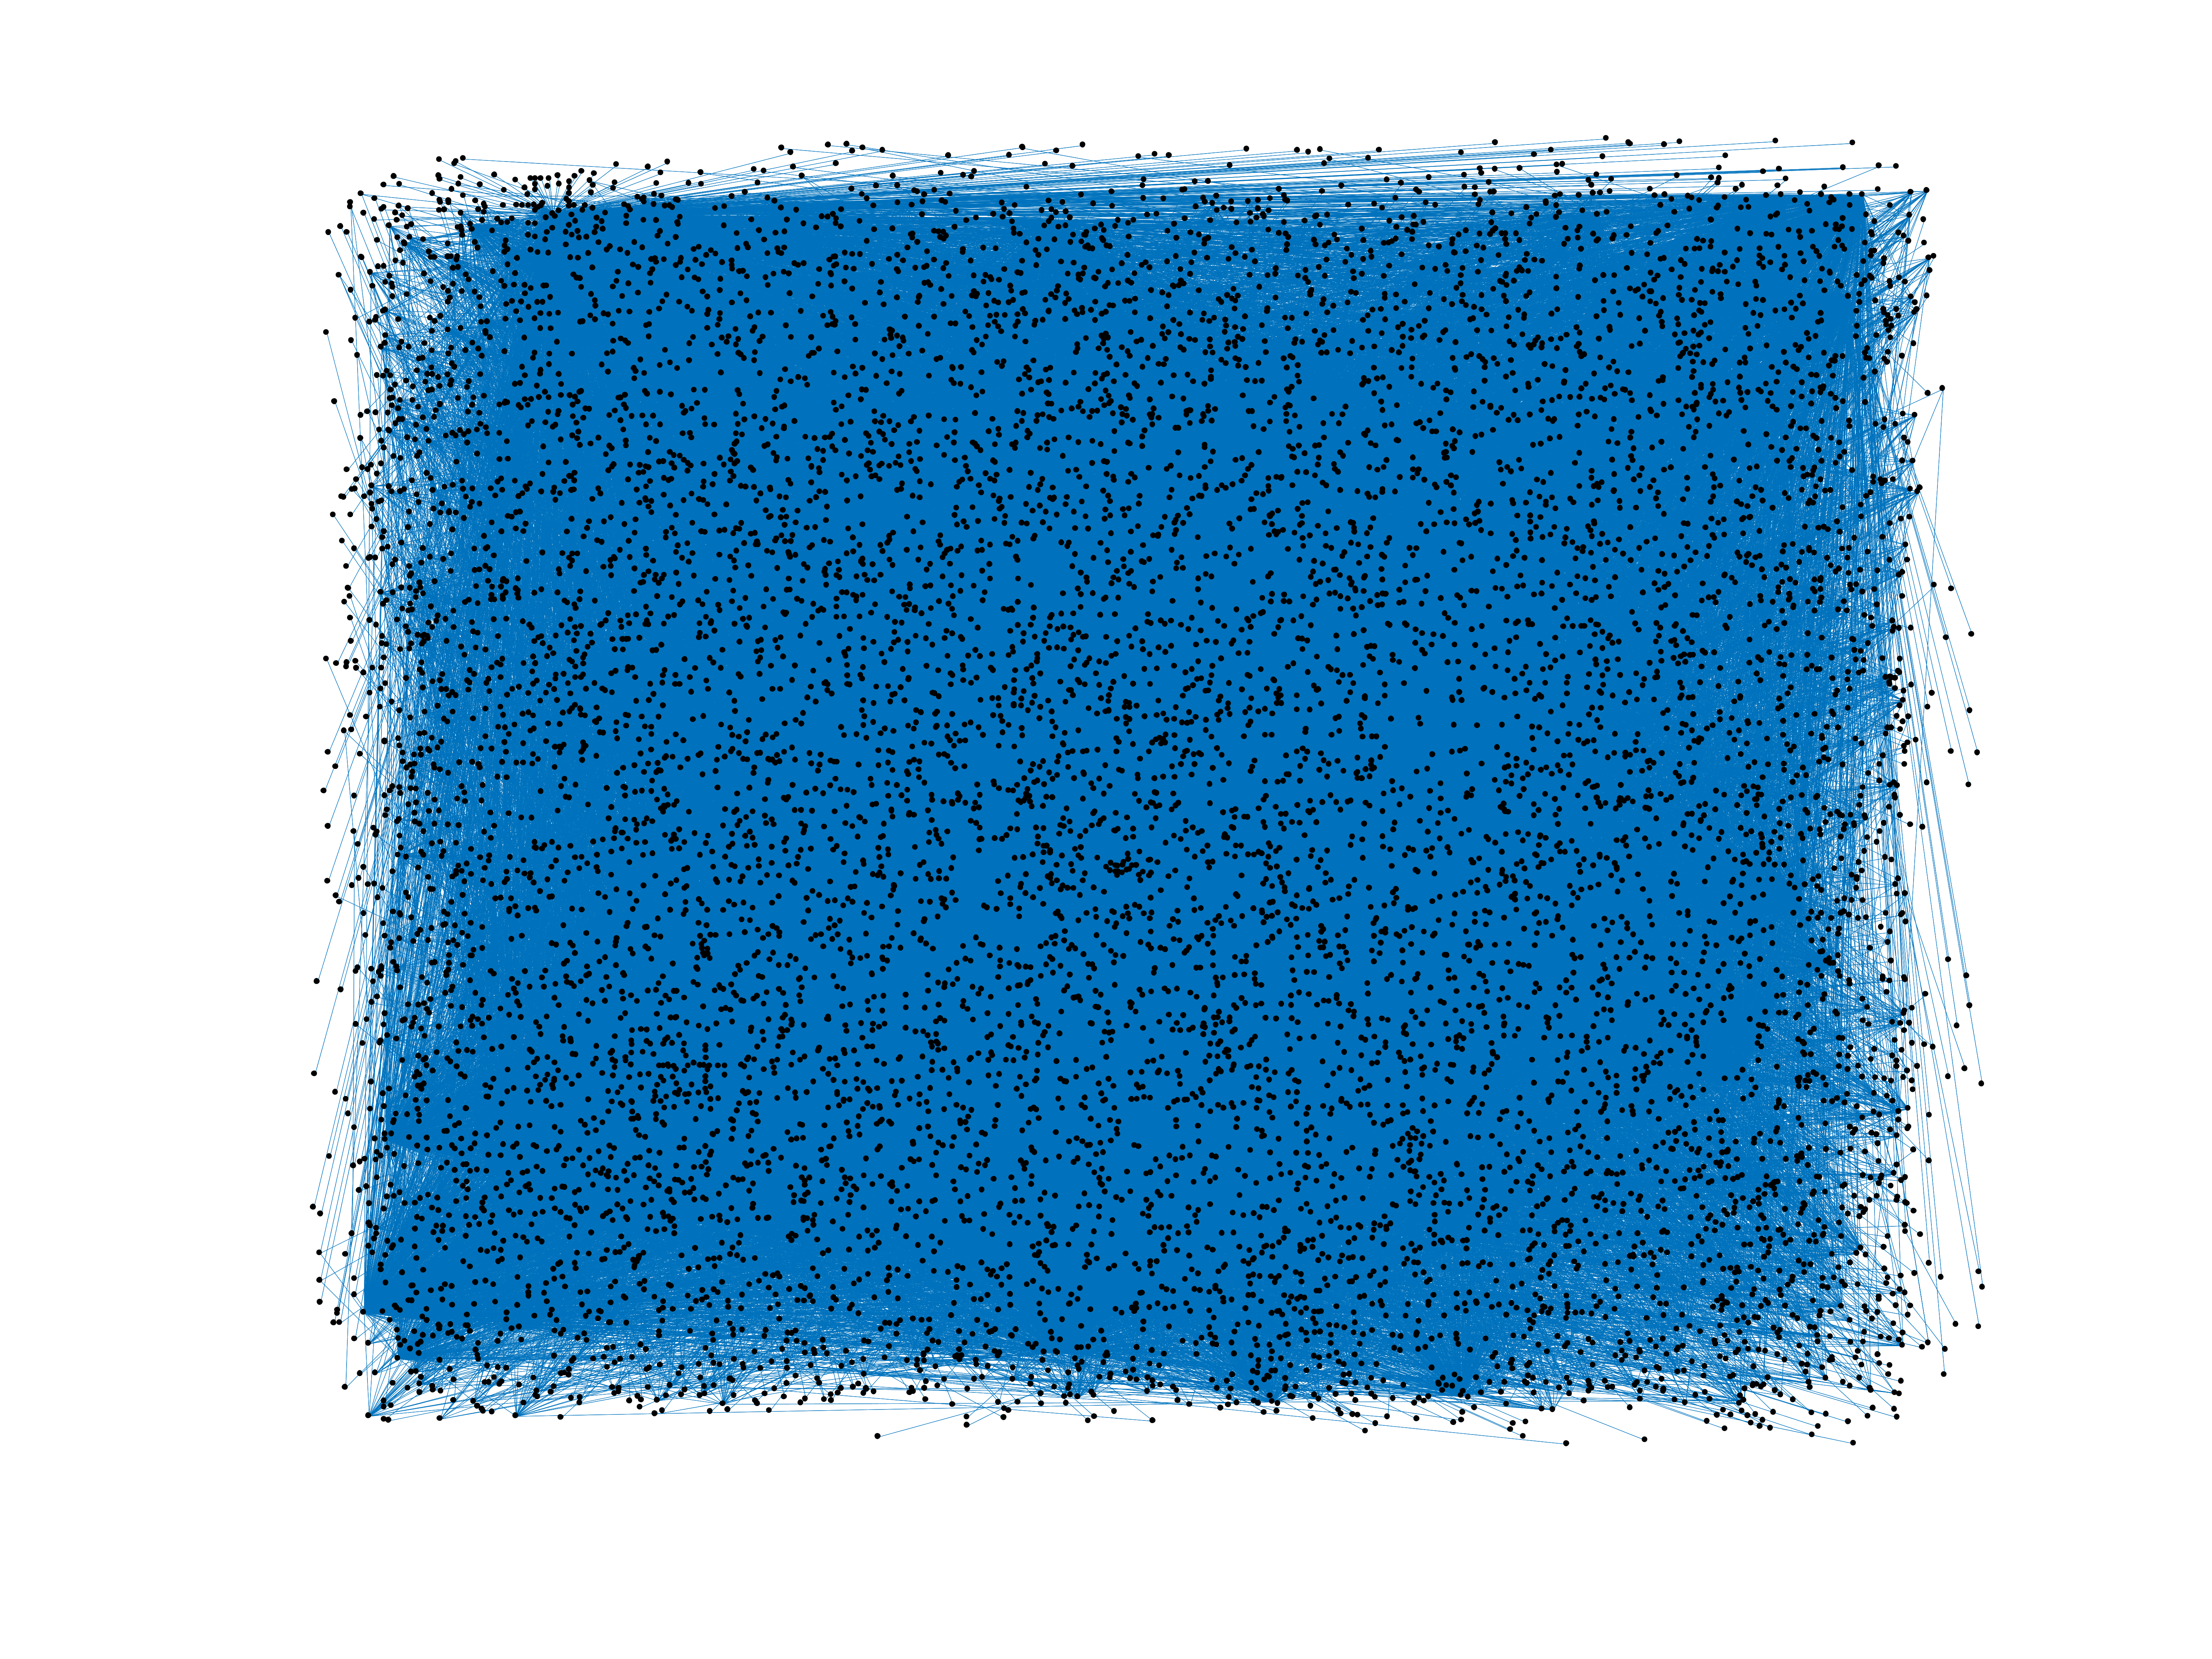
This is the bipartite edit network of the Erzya Wikipedia. It contains users
and pages from the Erzya Wikipedia, connected by edit events. Each edge
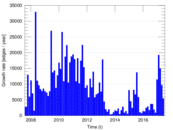
represents an edit. The dataset includes the timestamp of each edit.
Metadata
Statistics
| Size | n = | 9,885
|
| Left size | n1 = | 707
|
| Right size | n2 = | 9,178
|
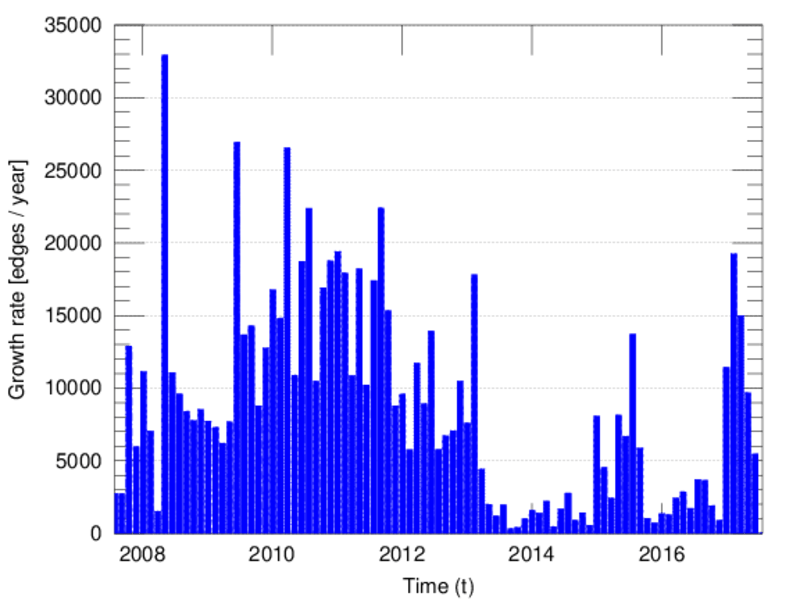
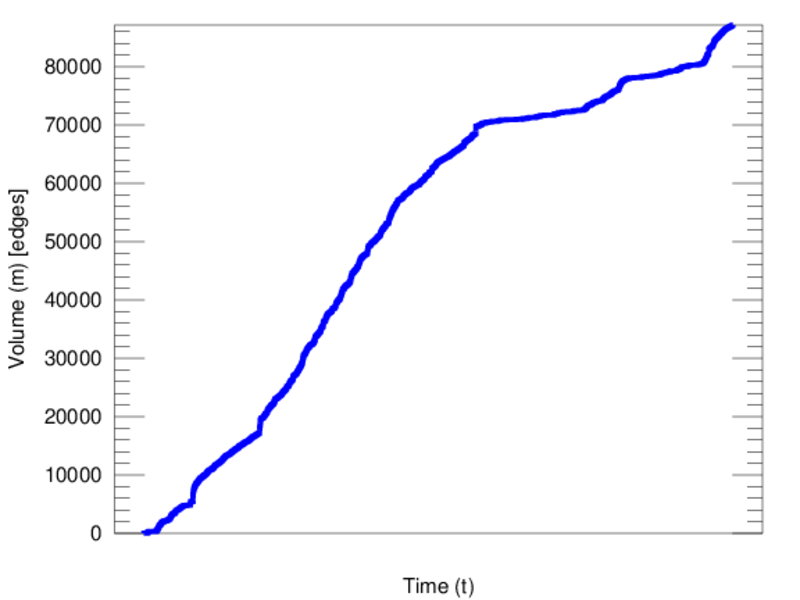
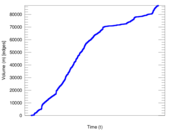
| Volume | m = | 87,120
|
| Unique edge count | m̿ = | 40,924
|
| Wedge count | s = | 23,155,860
|
| Claw count | z = | 16,796,825,650
|
| Cross count | x = | 12,462,636,659,910
|
| Square count | q = | 50,704,277
|
| 4-Tour count | T4 = | 498,374,028
|
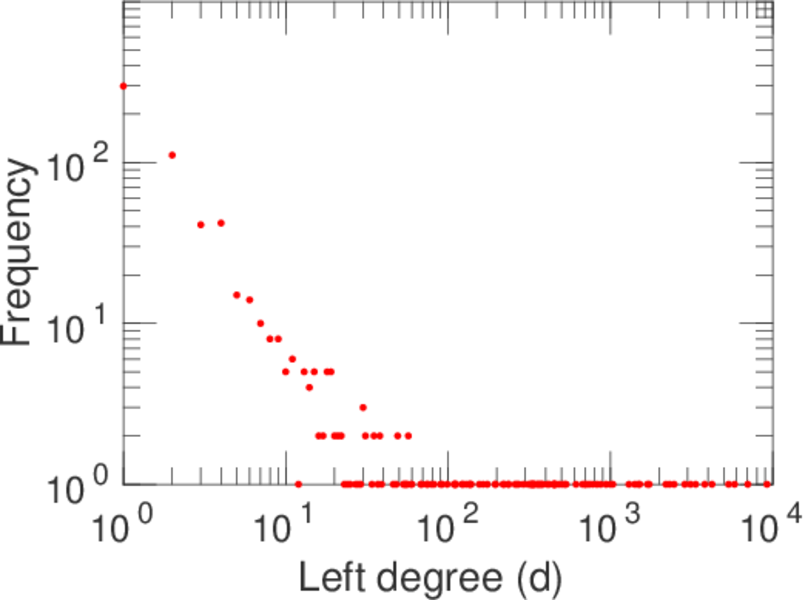
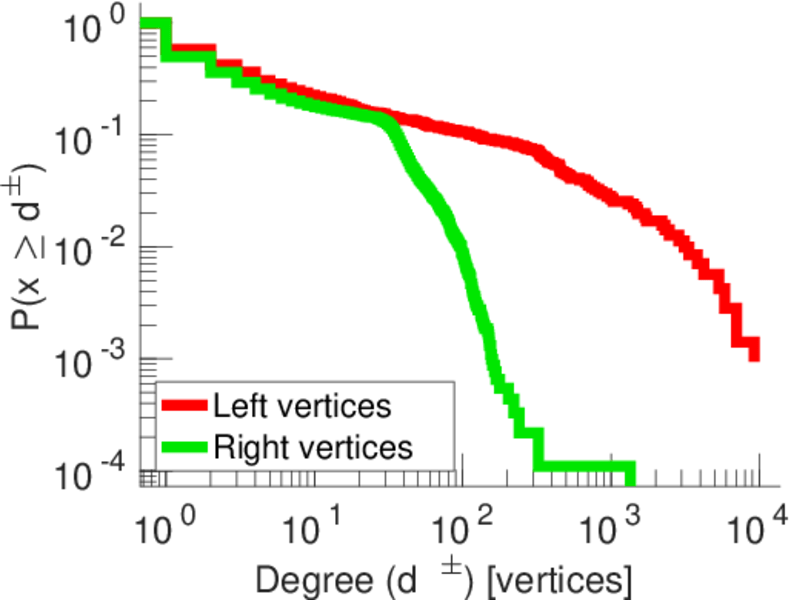
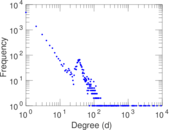
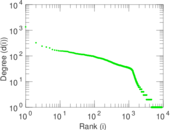
| Maximum degree | dmax = | 9,239
|
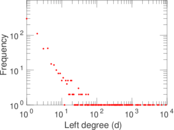
| Maximum left degree | d1max = | 9,239
|
| Maximum right degree | d2max = | 1,352
|
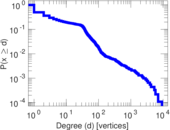
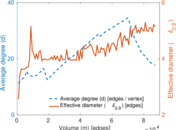
| Average degree | d = | 17.626 7
|
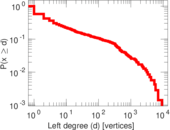
| Average left degree | d1 = | 123.225
|
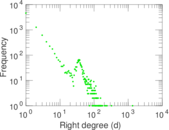
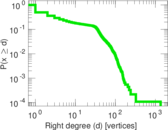
| Average right degree | d2 = | 9.492 26
|
| Fill | p = | 0.006 306 82
|
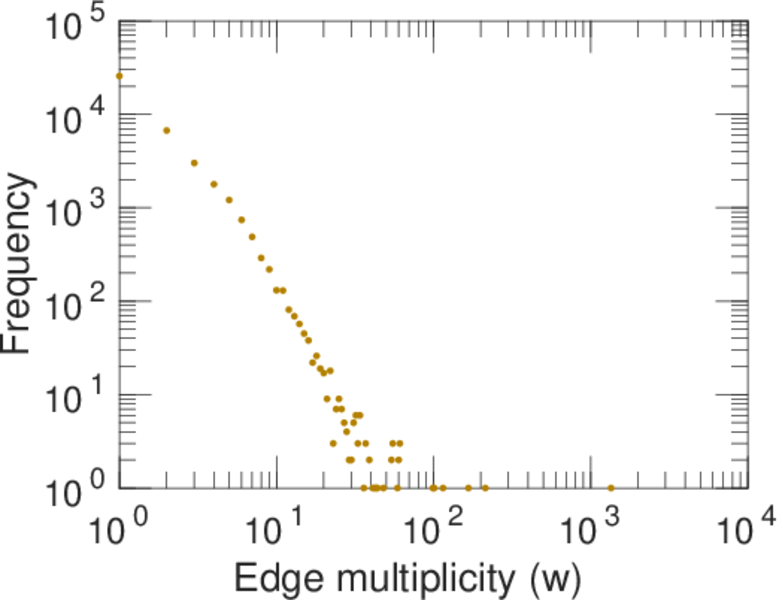
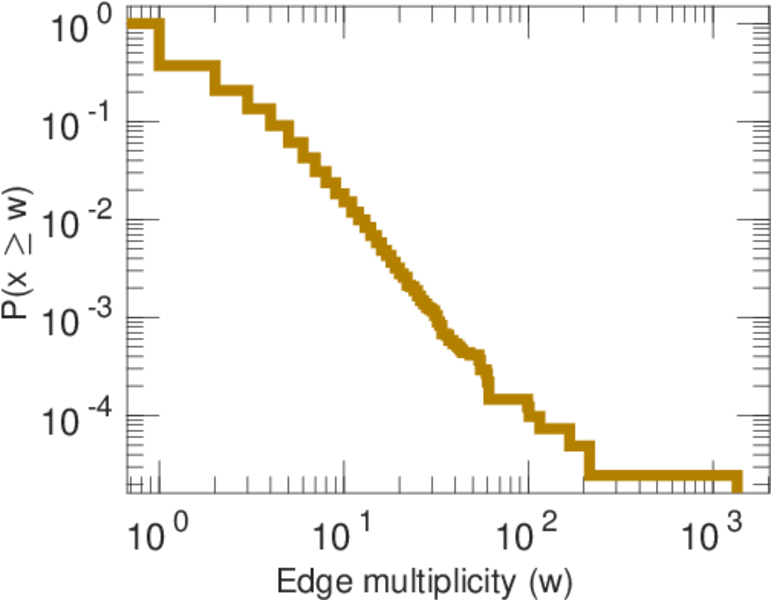
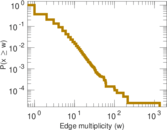
| Average edge multiplicity | m̃ = | 2.128 82
|
| Size of LCC | N = | 9,392
|
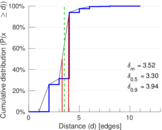
| Diameter | δ = | 14
|
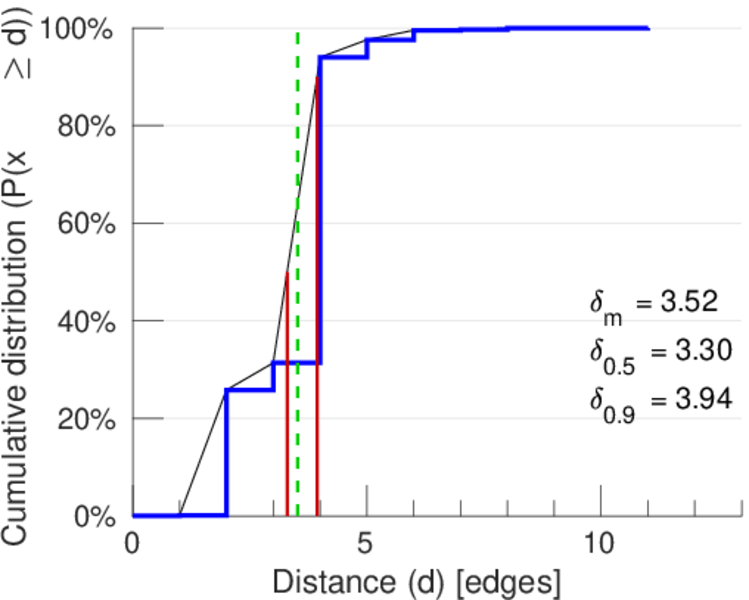
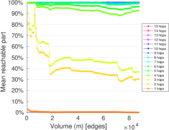
| 50-Percentile effective diameter | δ0.5 = | 3.297 61
|
| 90-Percentile effective diameter | δ0.9 = | 3.936 25
|
| Median distance | δM = | 4
|
| Mean distance | δm = | 3.520 37
|
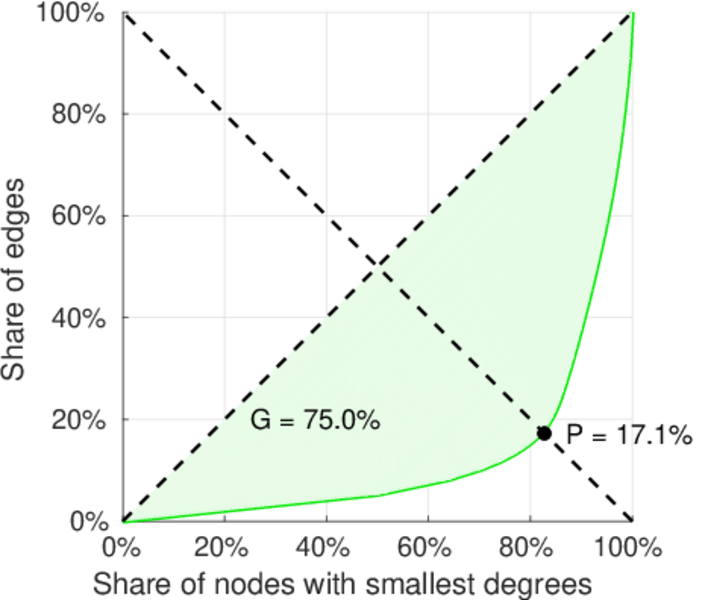
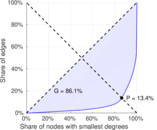
| Gini coefficient | G = | 0.863 850
|
| Balanced inequality ratio | P = | 0.137 741
|
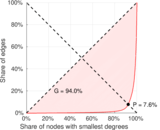
| Left balanced inequality ratio | P1 = | 0.075 803 5
|
| Right balanced inequality ratio | P2 = | 0.170 845
|
| Relative edge distribution entropy | Her = | 0.751 189
|
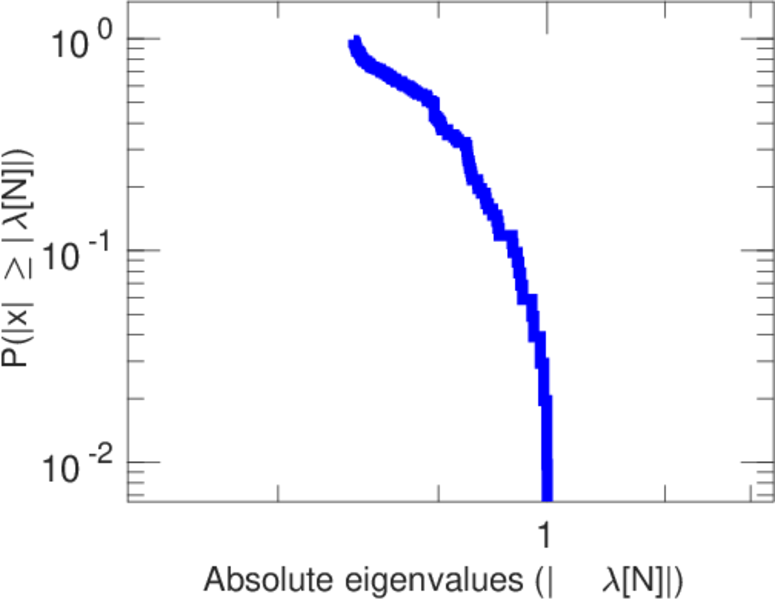
| Power law exponent | γ = | 2.438 42
|
| Tail power law exponent | γt = | 1.881 00
|
| Tail power law exponent with p | γ3 = | 1.881 00
|
| p-value | p = | 0.000 00
|
| Left tail power law exponent with p | γ3,1 = | 1.591 00
|
| Left p-value | p1 = | 0.000 00
|
| Right tail power law exponent with p | γ3,2 = | 5.071 00
|
| Right p-value | p2 = | 0.000 00
|
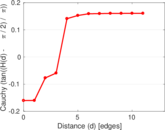
| Degree assortativity | ρ = | −0.472 824
|
| Degree assortativity p-value | pρ = | 0.000 00
|
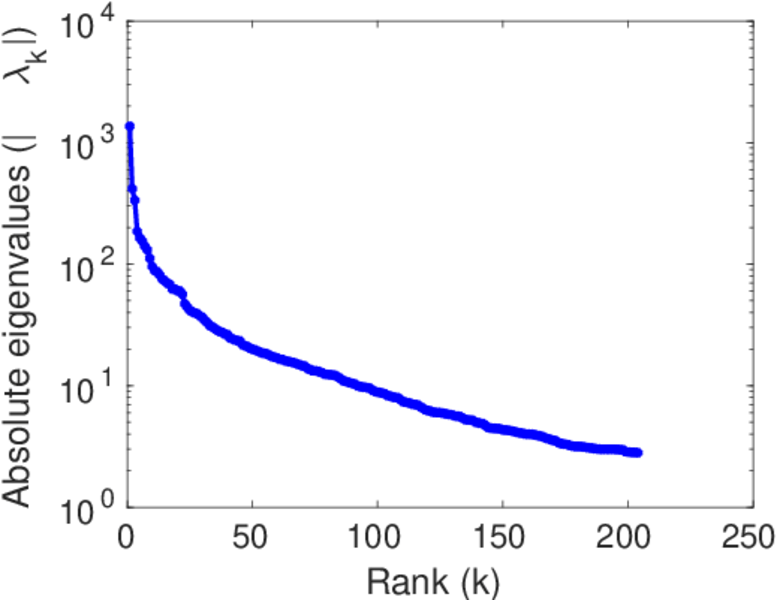
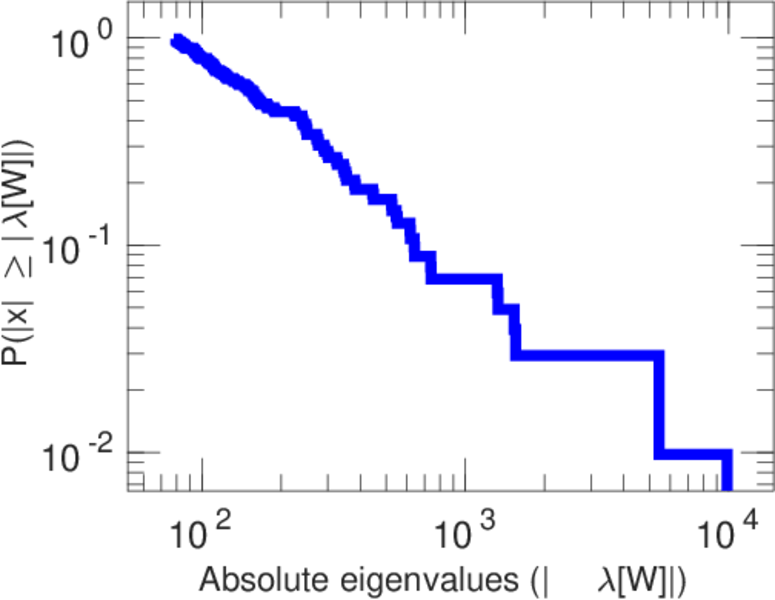
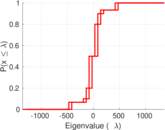
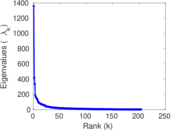
| Spectral norm | α = | 1,360.29
|
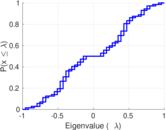
| Algebraic connectivity | a = | 0.012 647 1
|
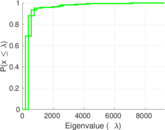
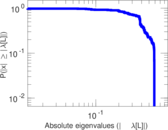
| Spectral separation | |λ1[A] / λ2[A]| = | 3.260 76
|
| Controllability | C = | 8,510
|
| Relative controllability | Cr = | 0.863 959
|
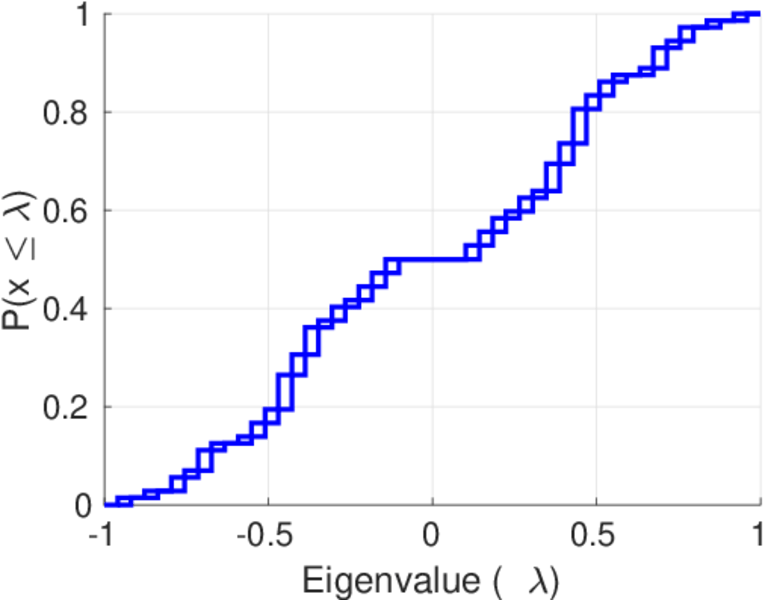
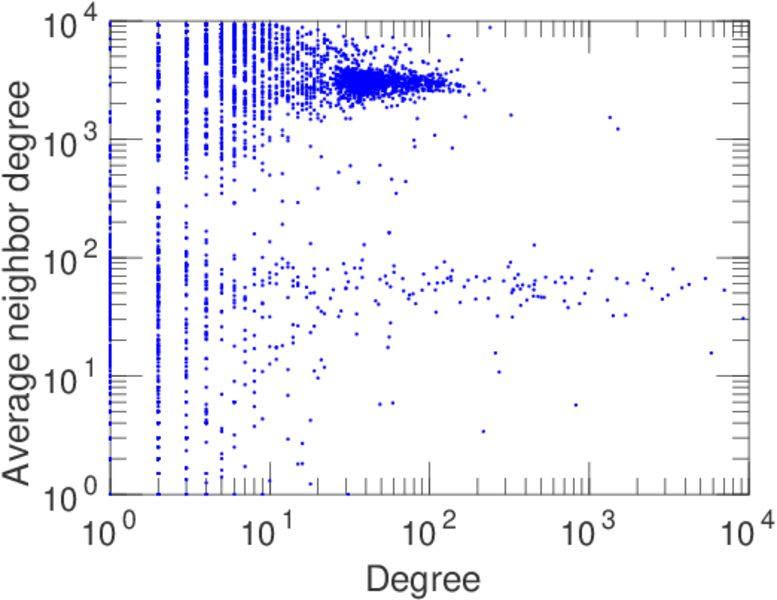
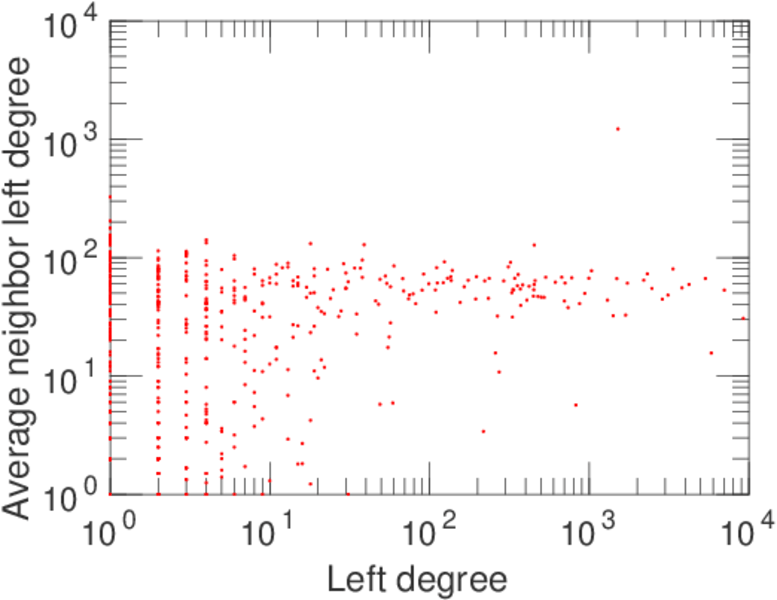
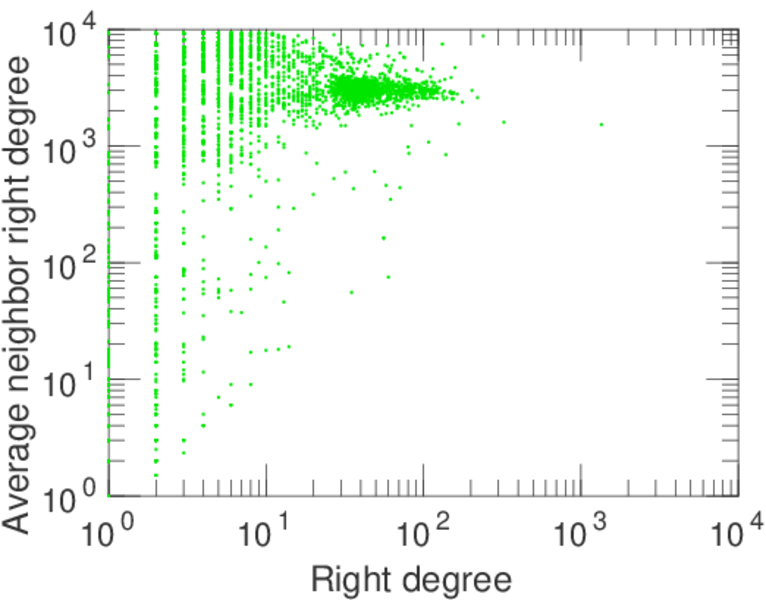
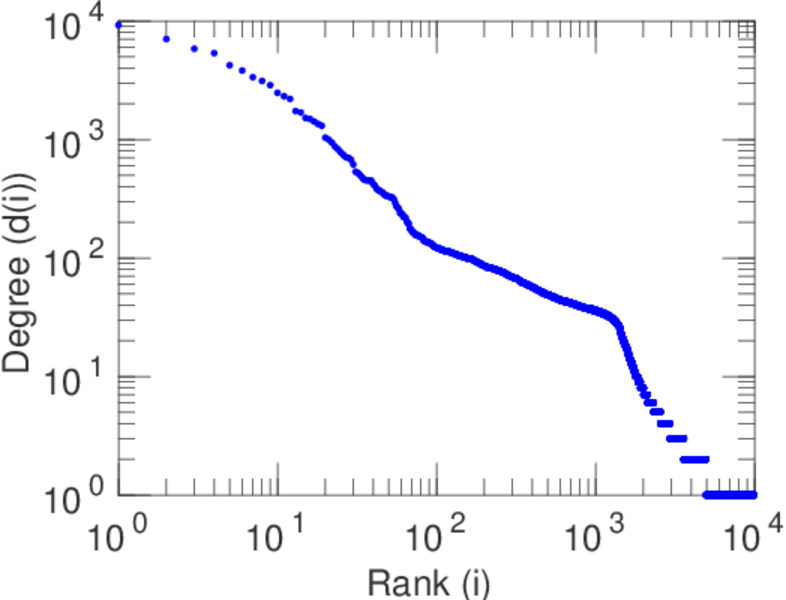
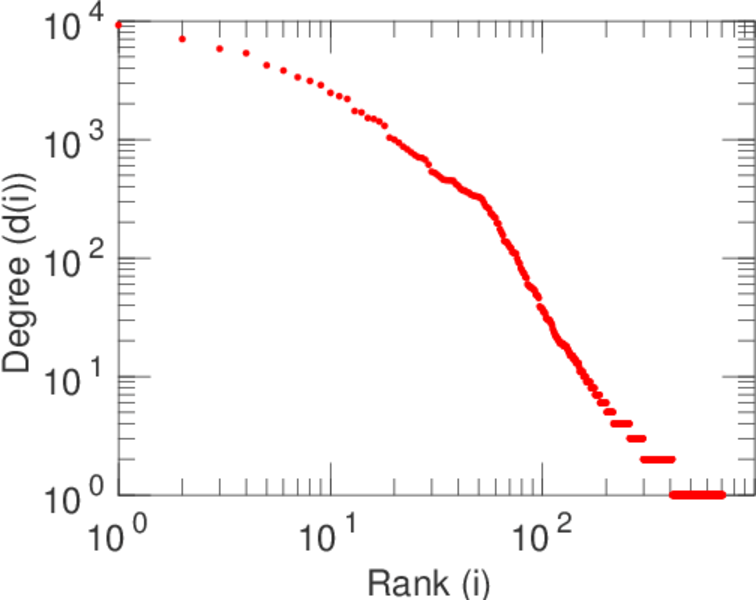
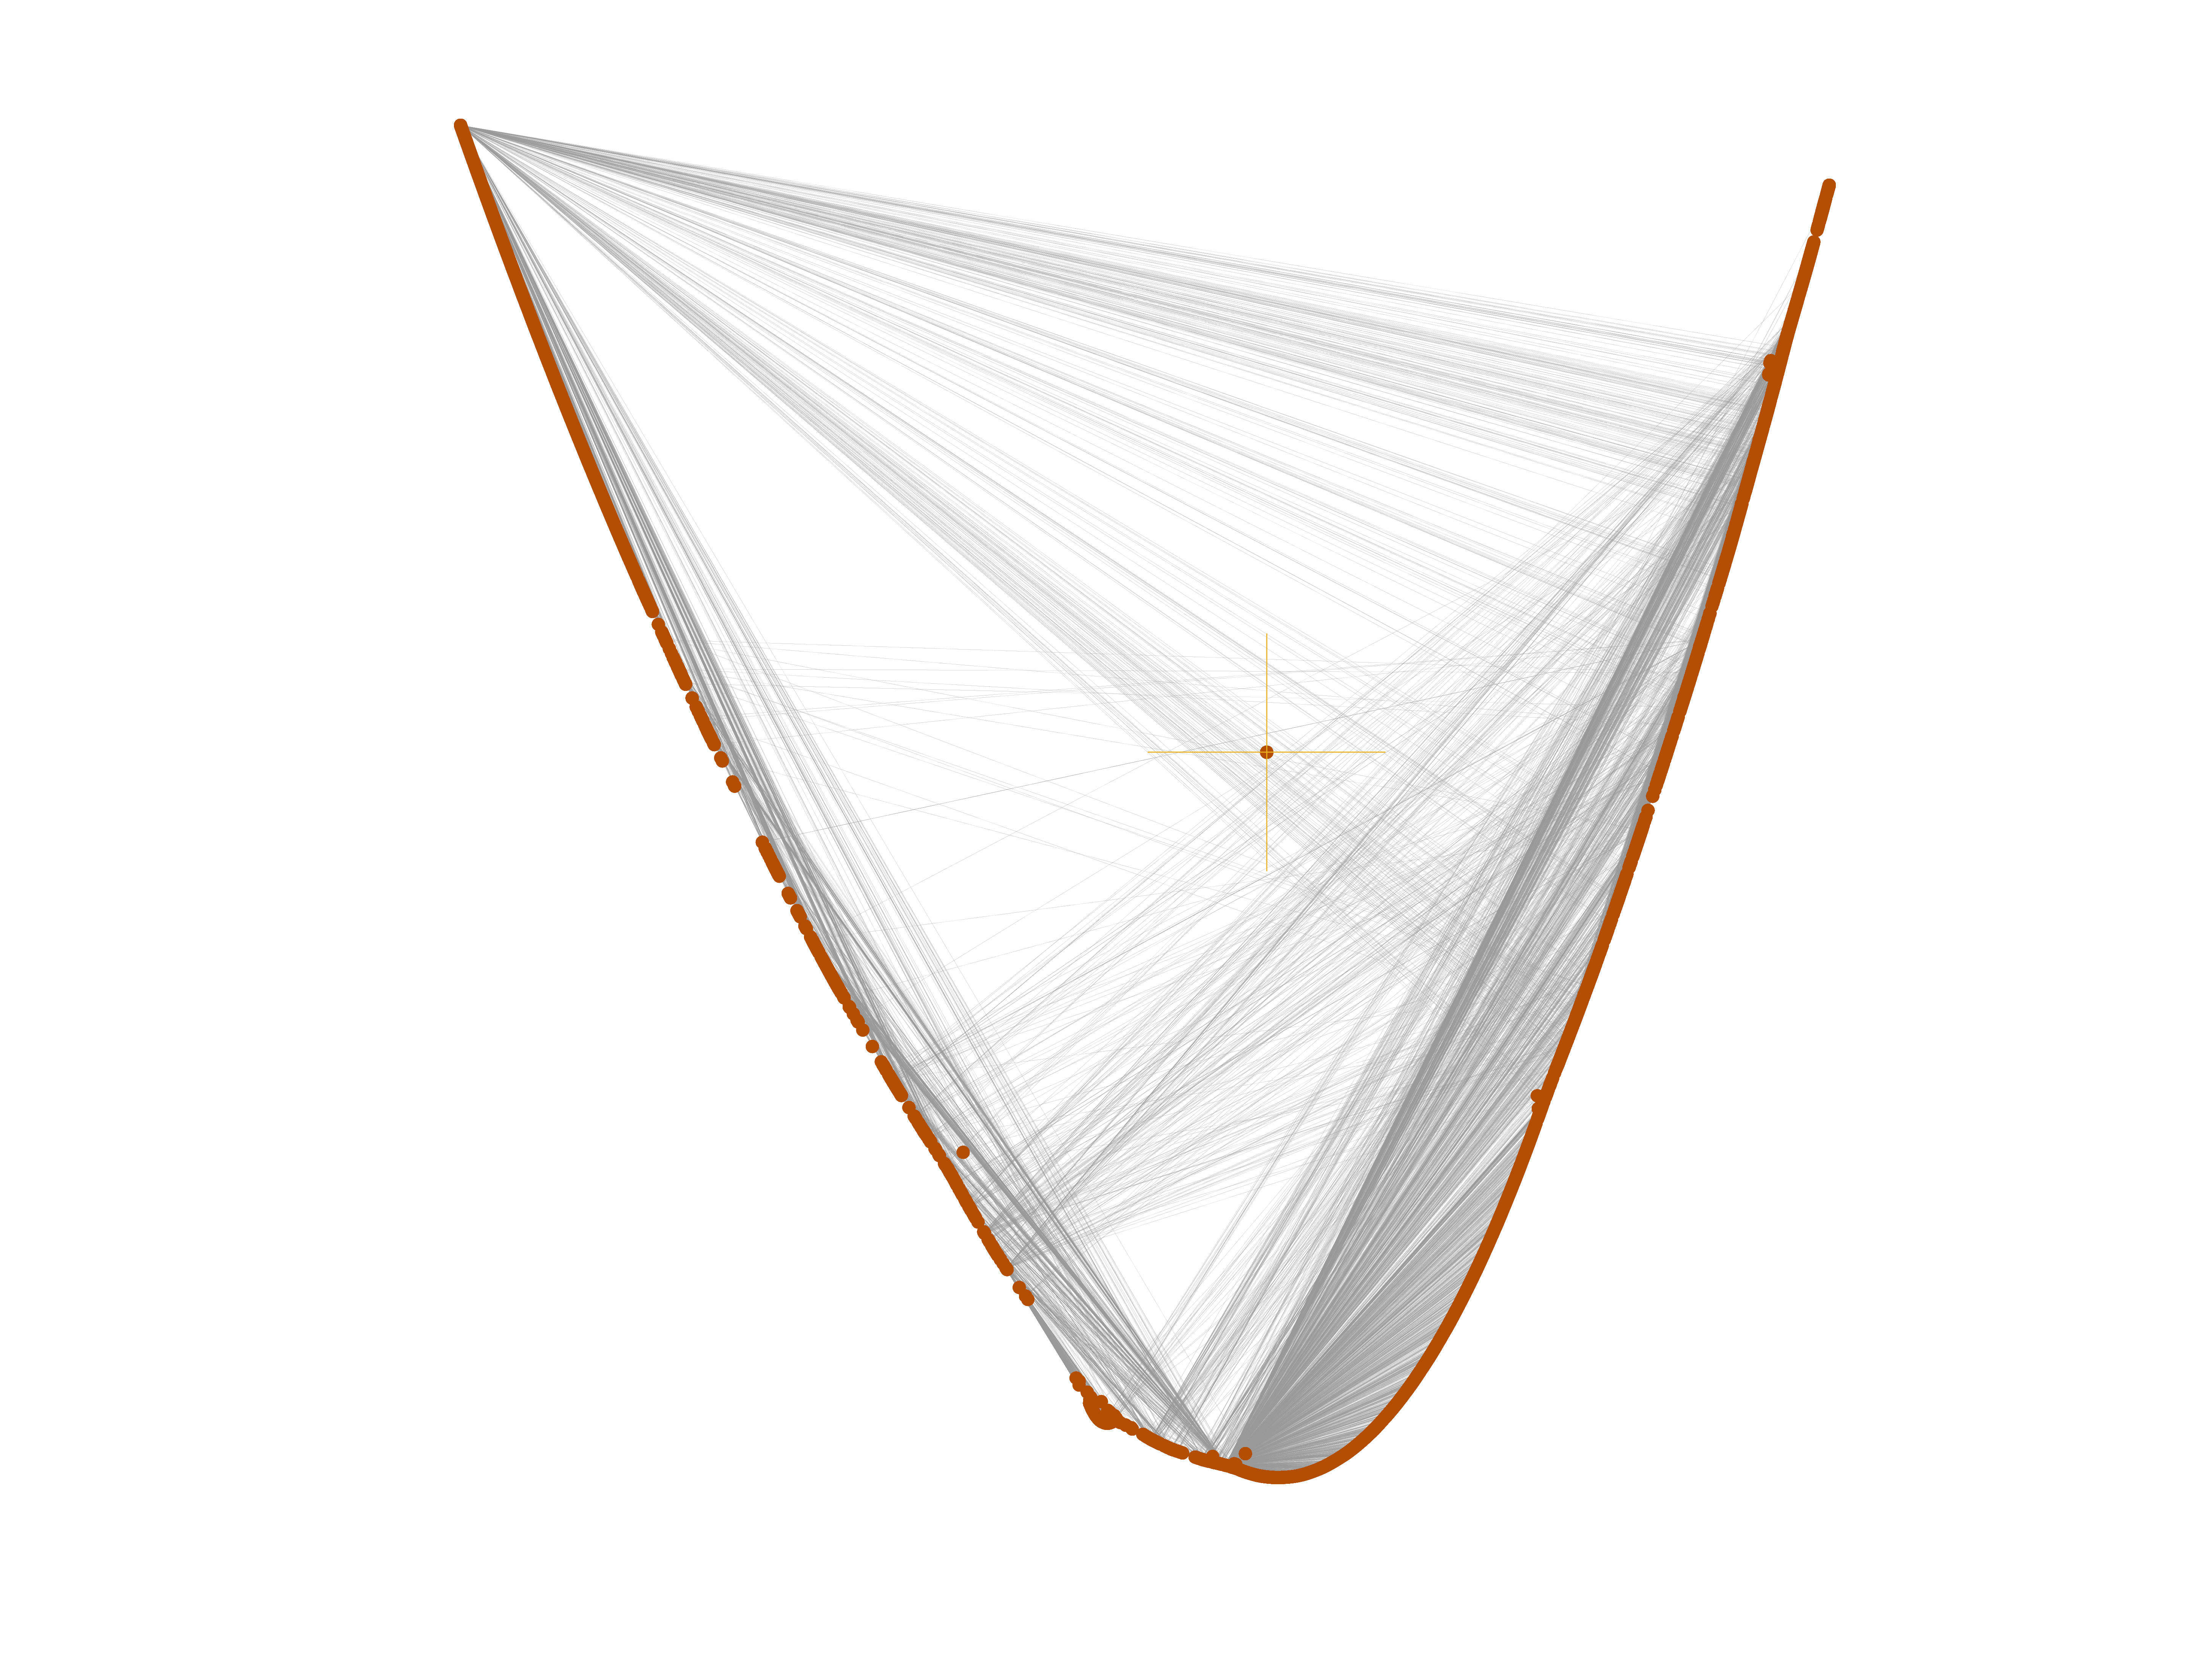
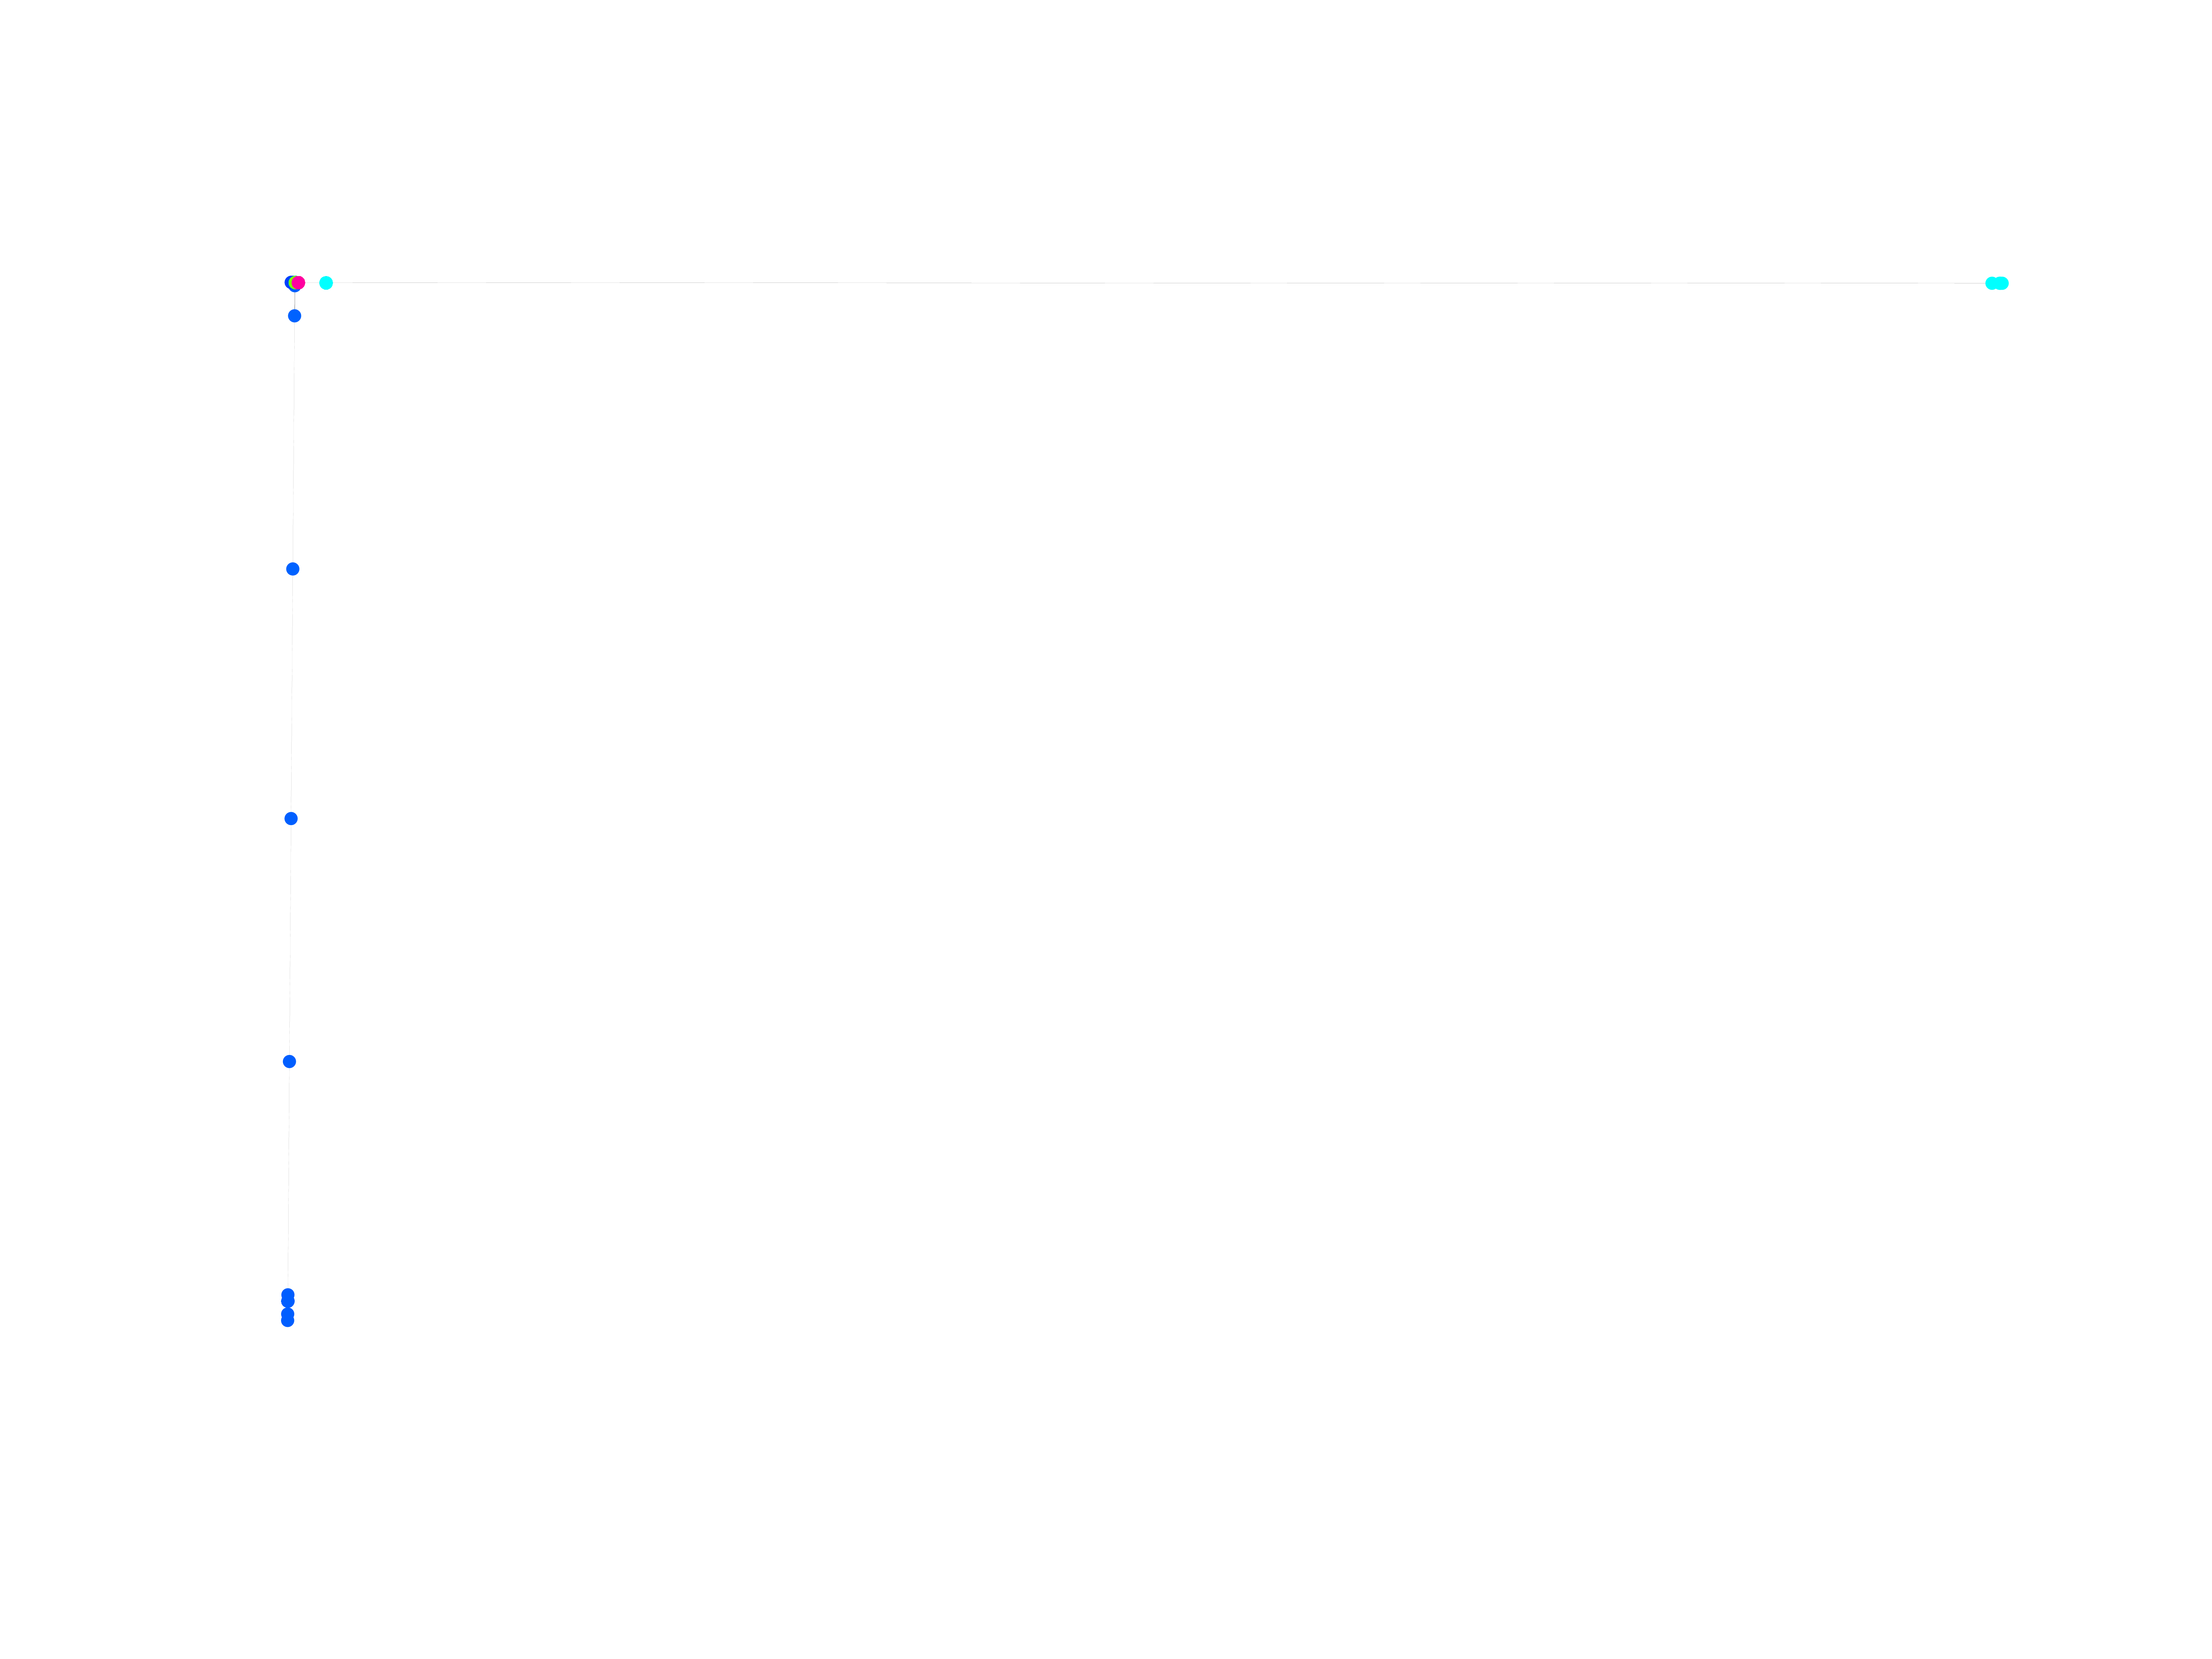
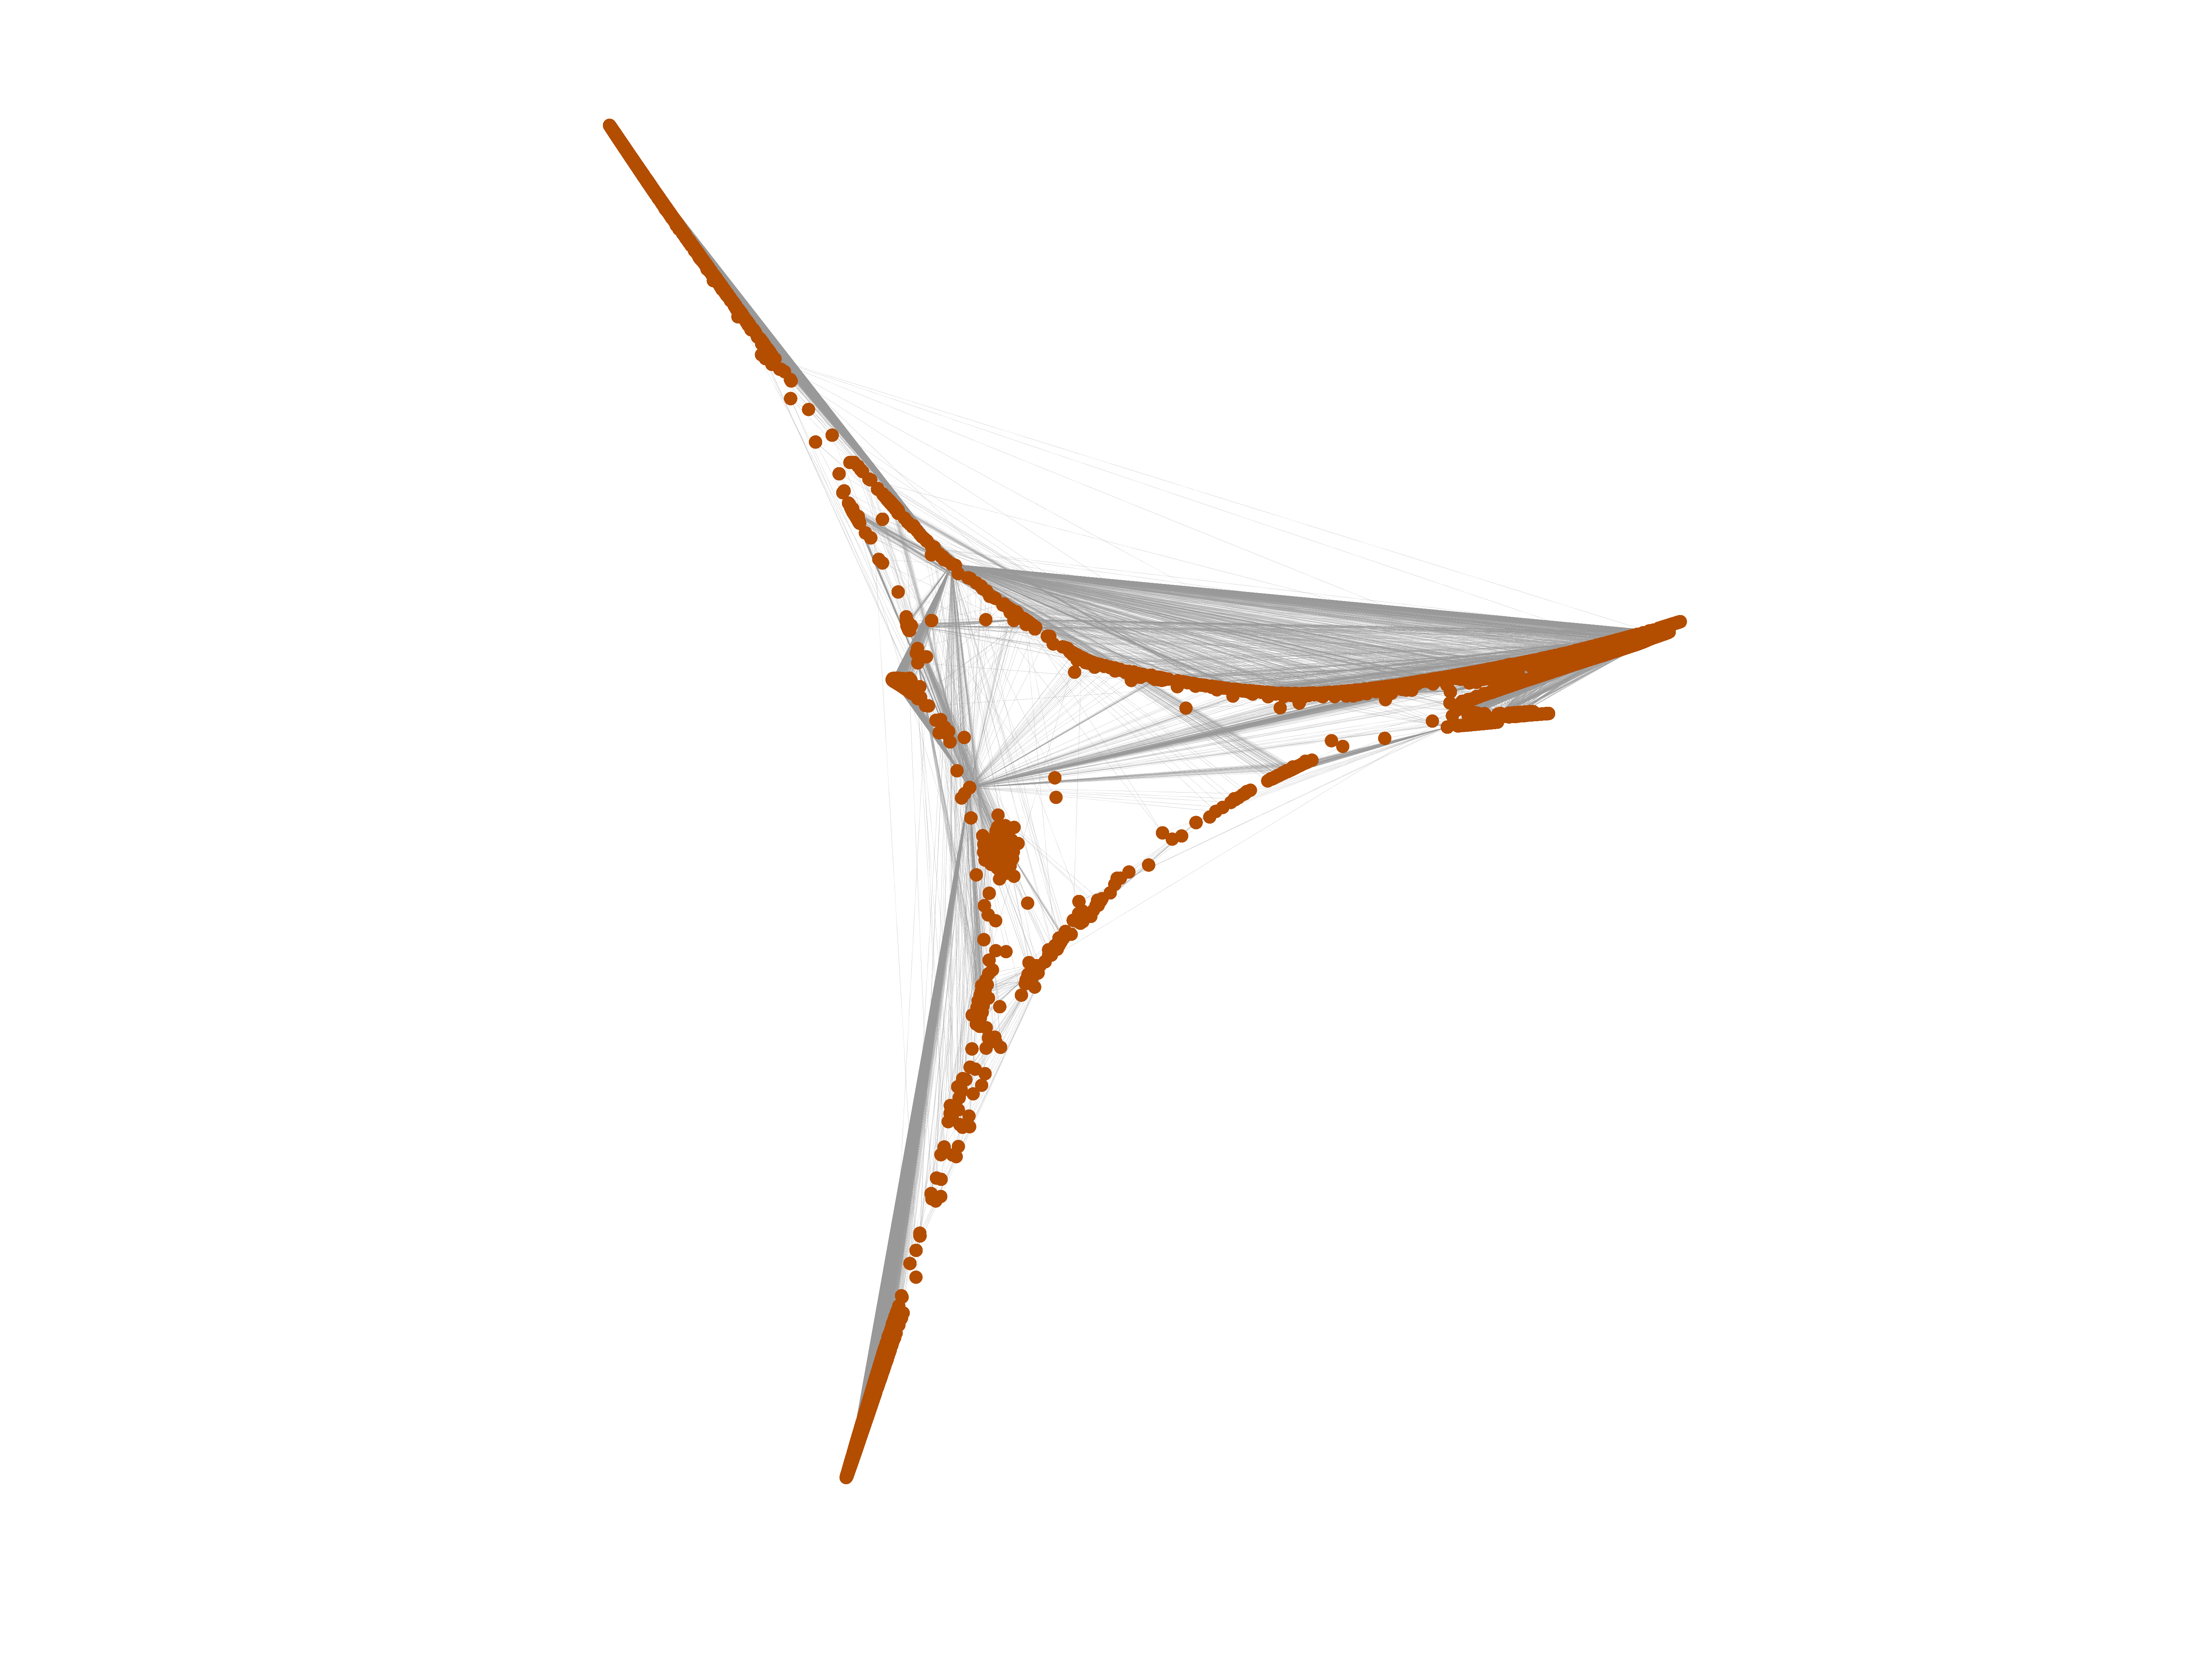
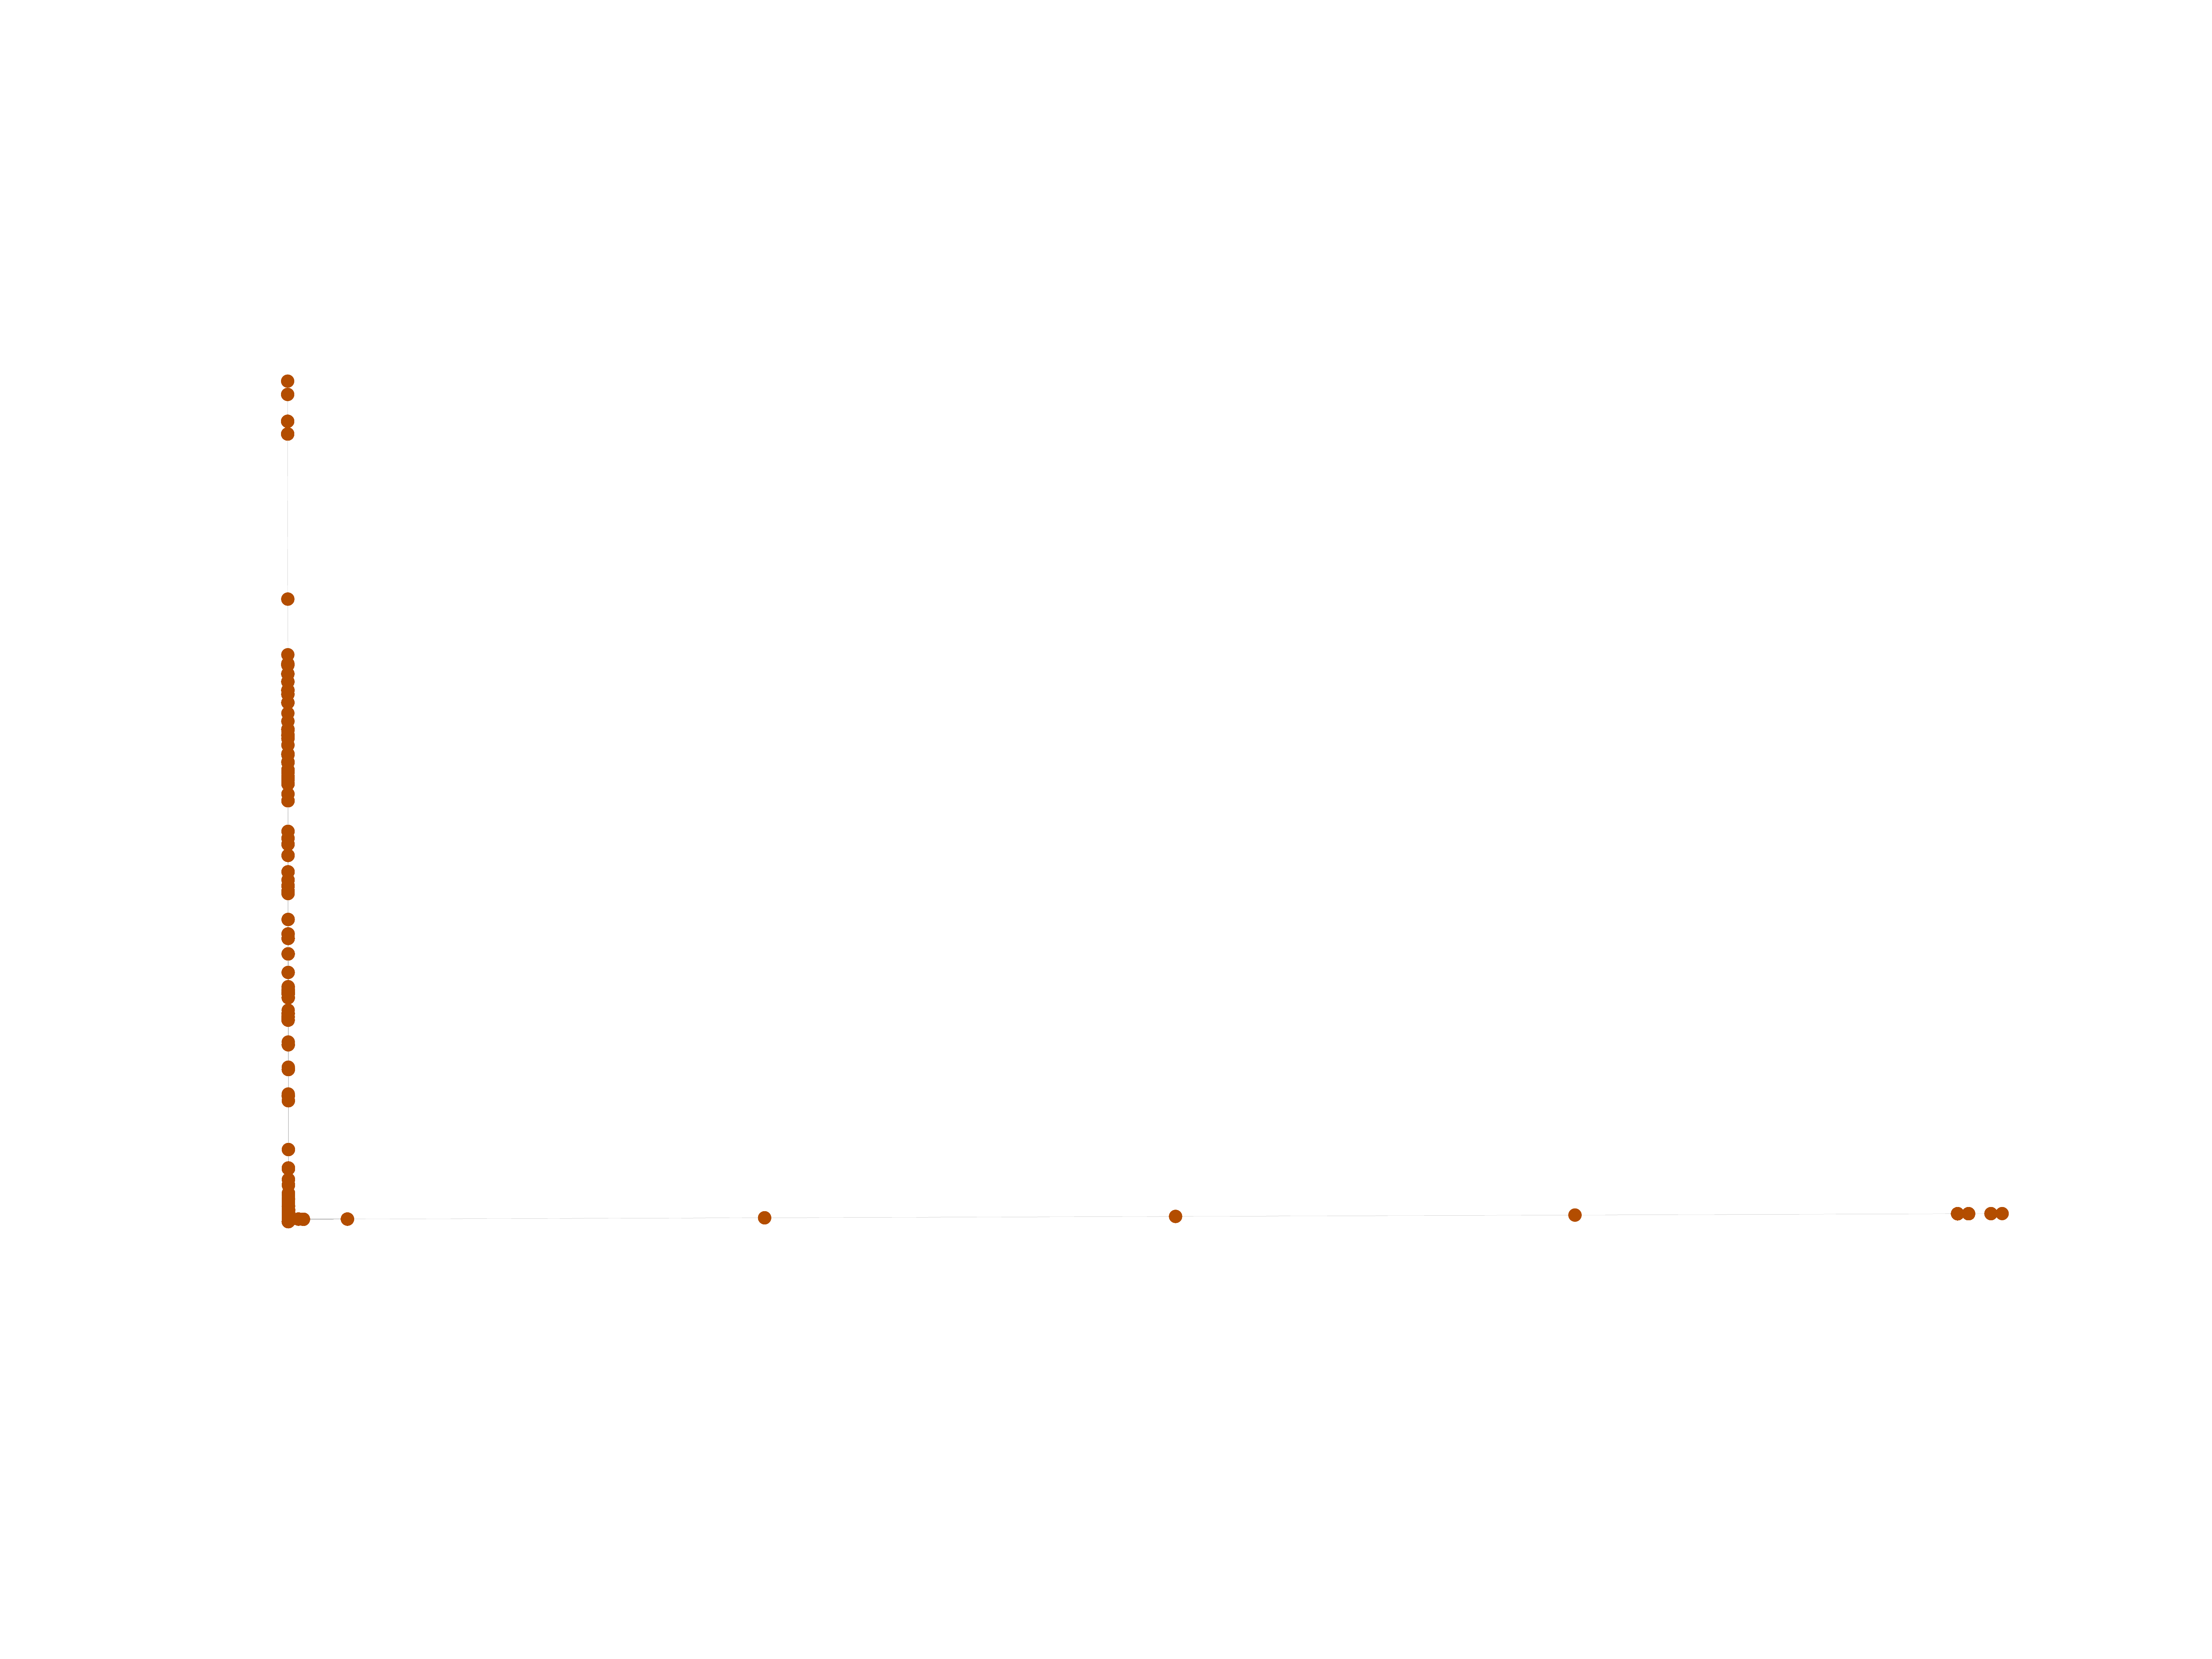
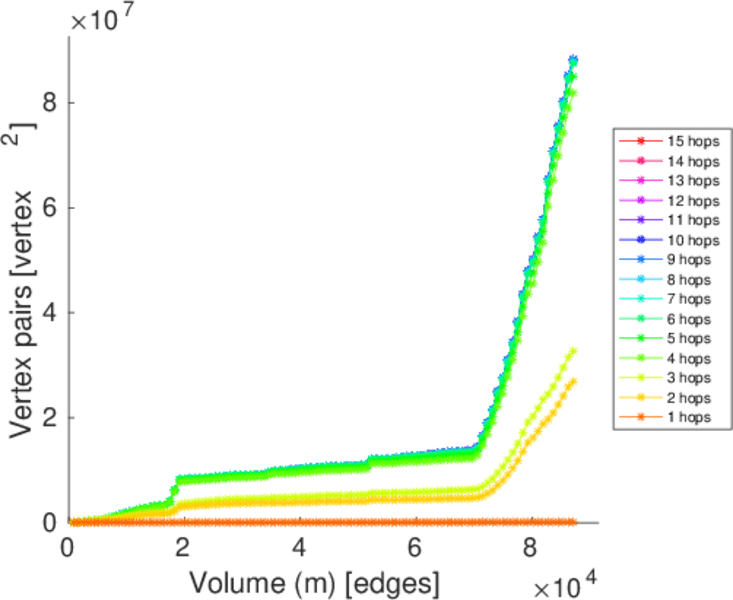
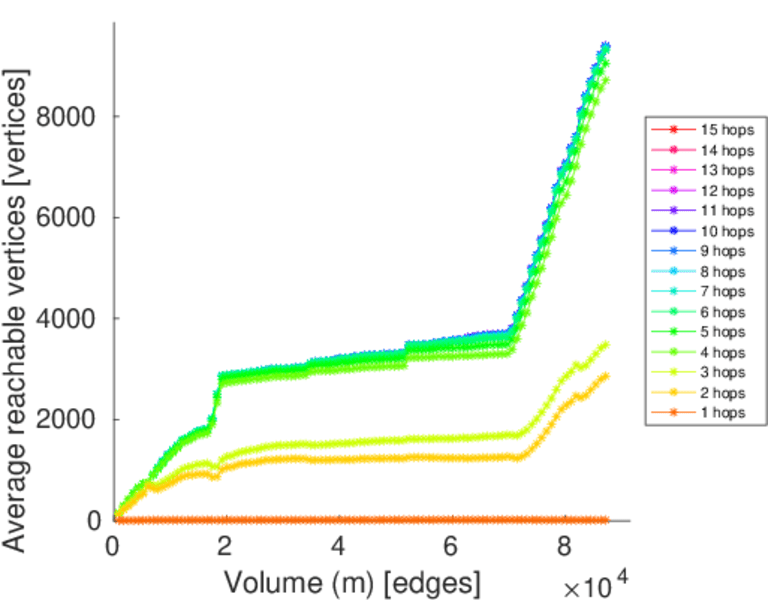
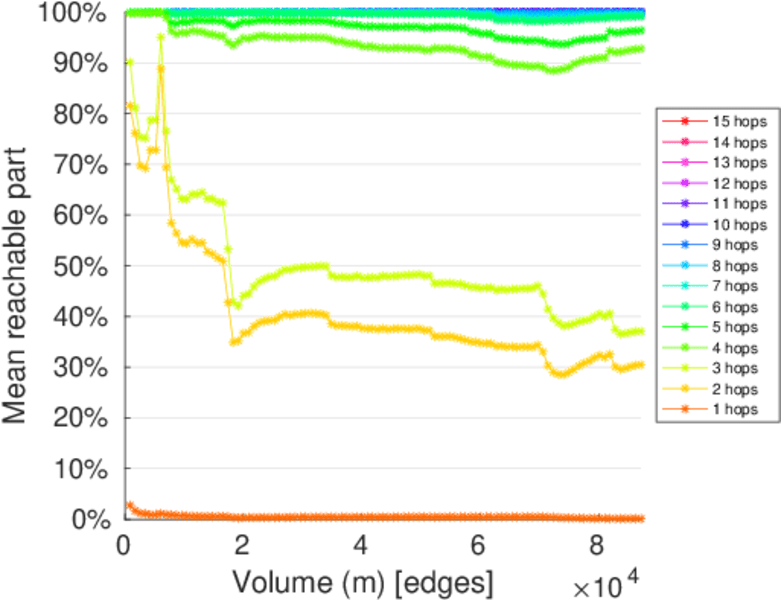
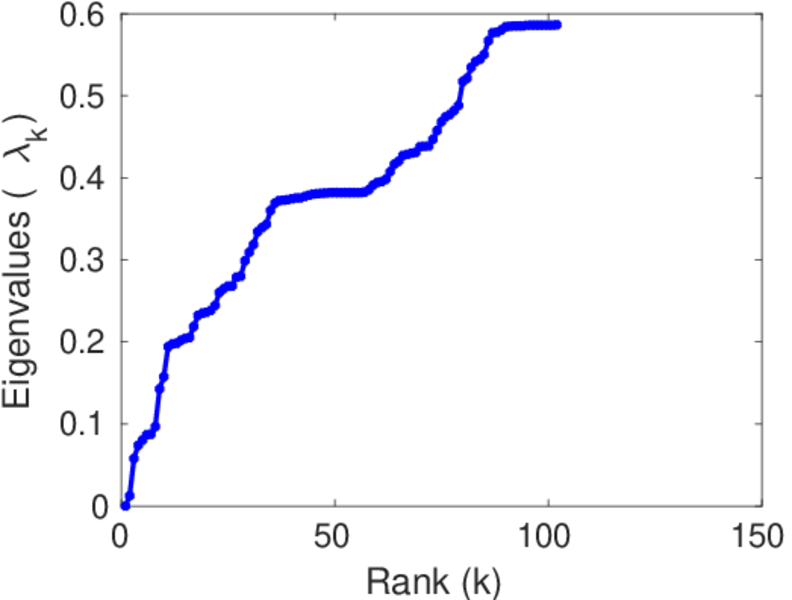
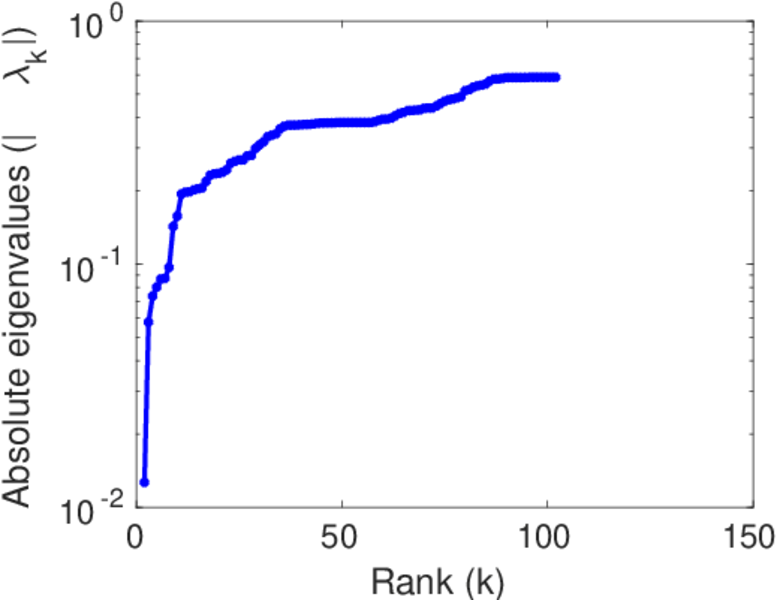
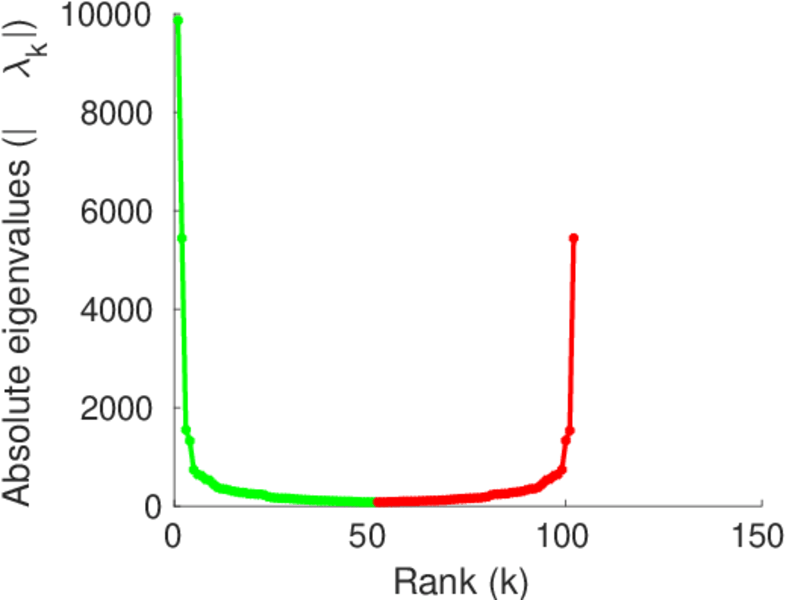
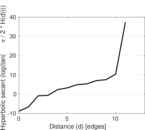
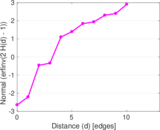
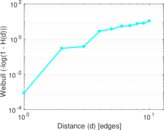
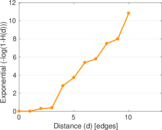
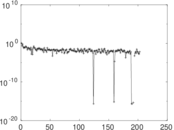
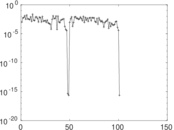
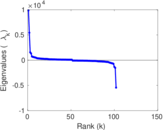
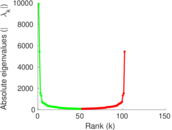
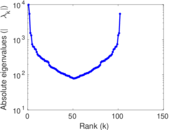
Plots


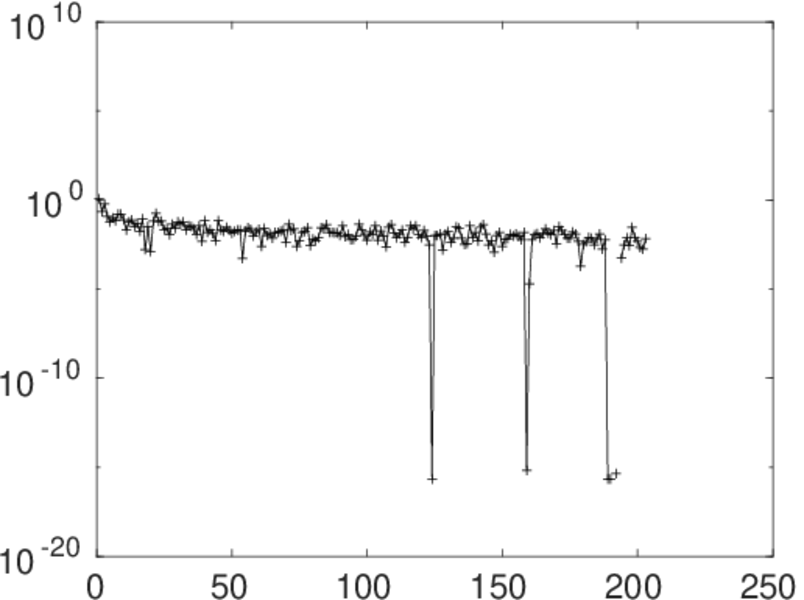
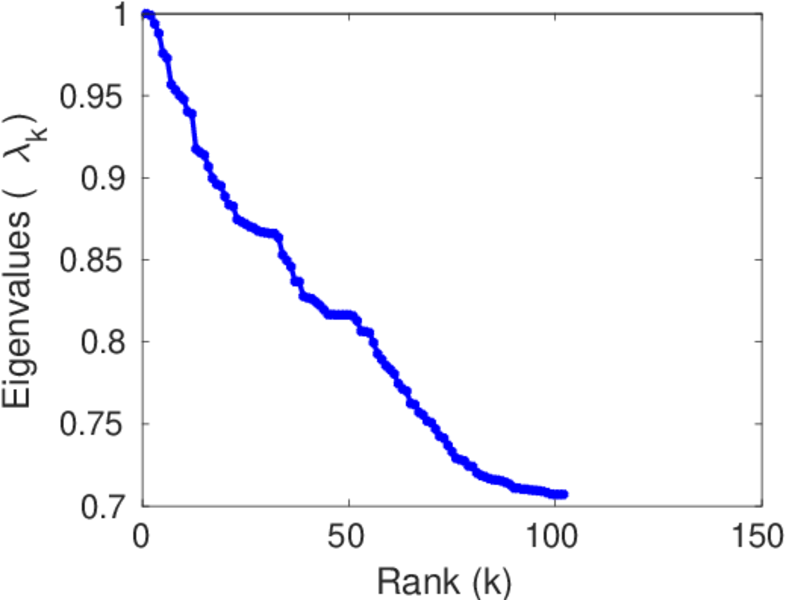
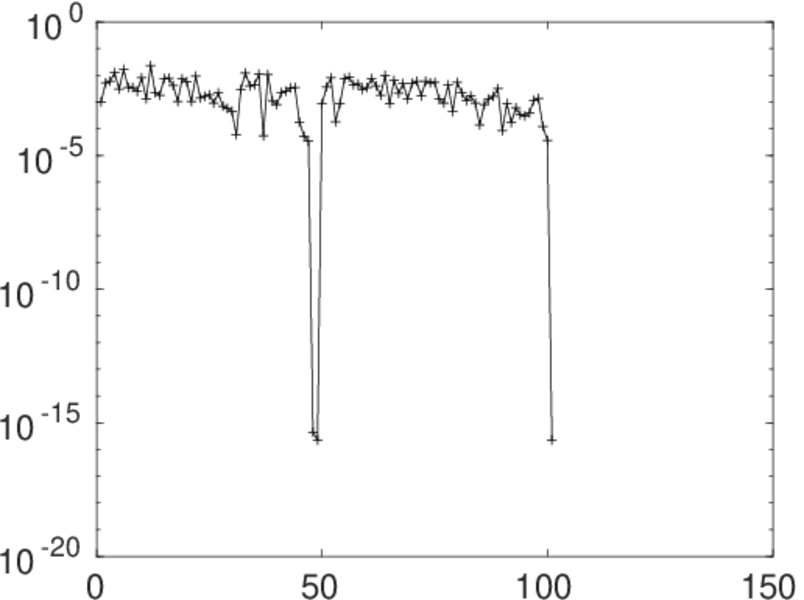
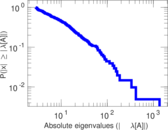
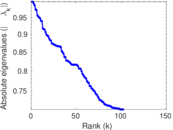
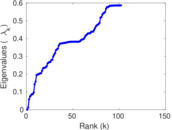
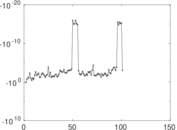
Matrix decompositions plots


Downloads
References
|
[1]
|
Jérôme Kunegis.
KONECT – The Koblenz Network Collection.
In Proc. Int. Conf. on World Wide Web Companion, pages
1343–1350, 2013.
[ http ]
|
|
[2]
|
Wikimedia Foundation.
Wikimedia downloads.
http://dumps.wikimedia.org/, January 2010.
|
 KONECT ‣ Networks ‣
Buy Me a Coffee
KONECT ‣ Networks ‣
Buy Me a Coffee