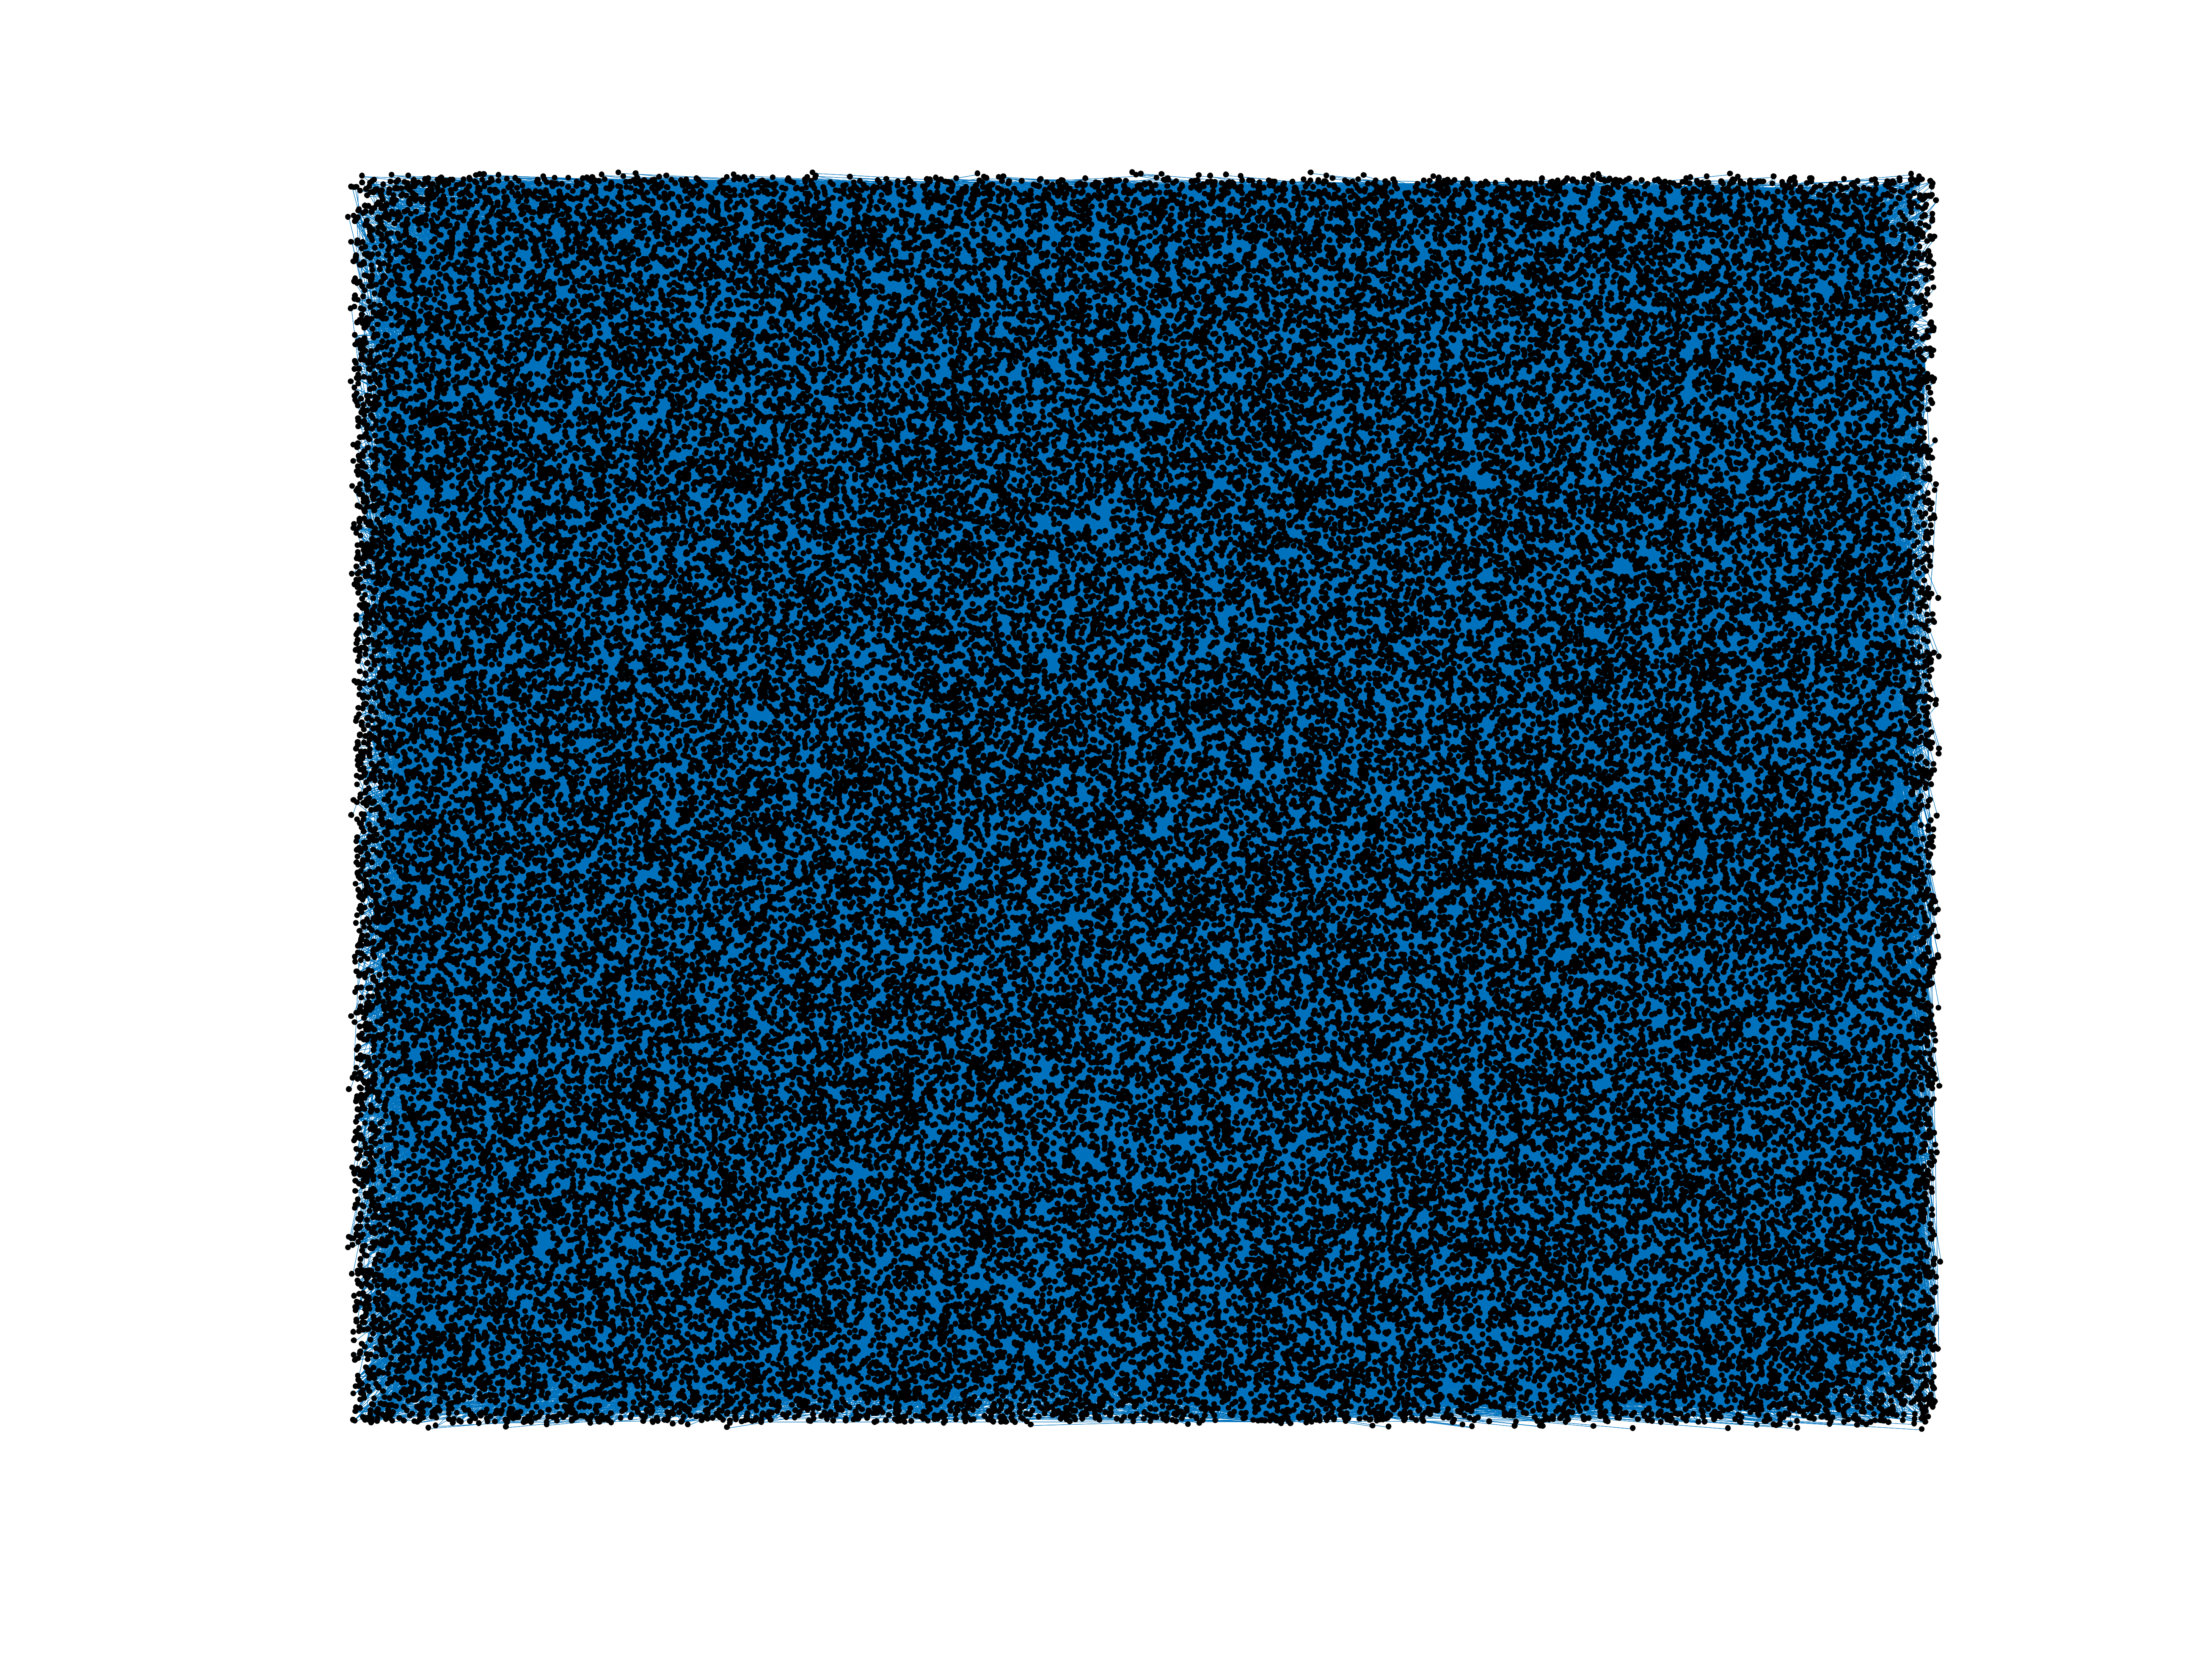
Wikipedia edits (my)
This is the bipartite edit network of the Burmese Wikipedia. It contains users
and pages from the Burmese Wikipedia, connected by edit events. Each edge
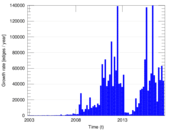
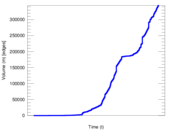
represents an edit. The dataset includes the timestamp of each edit.
Metadata
Statistics
| Size | n = | 74,452
|
| Left size | n1 = | 2,747
|
| Right size | n2 = | 71,705
|
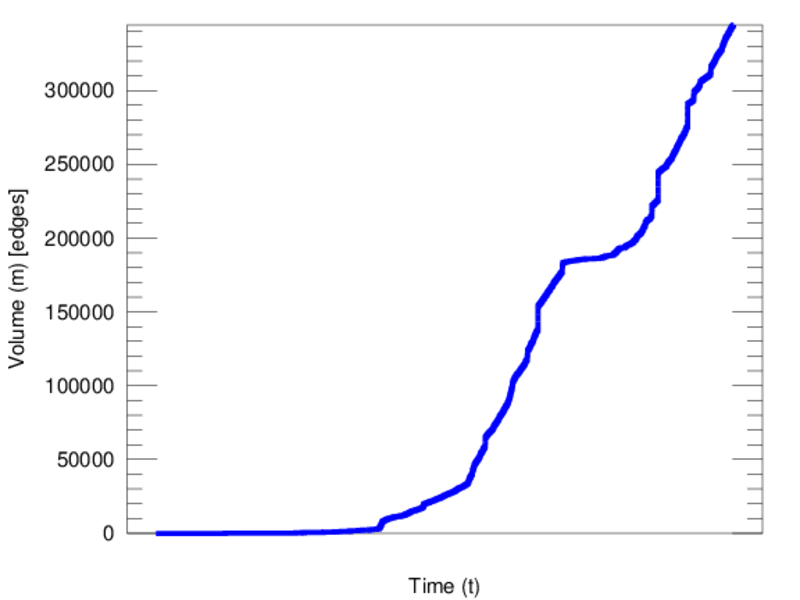
| Volume | m = | 344,419
|
| Unique edge count | m̿ = | 219,554
|
| Wedge count | s = | 1,743,261,347
|
| Claw count | z = | 17,061,011,890,027
|
| Cross count | x = | 143,142,751,049,479,216
|
| Square count | q = | 1,042,547,679
|
| 4-Tour count | T4 = | 15,314,006,864
|
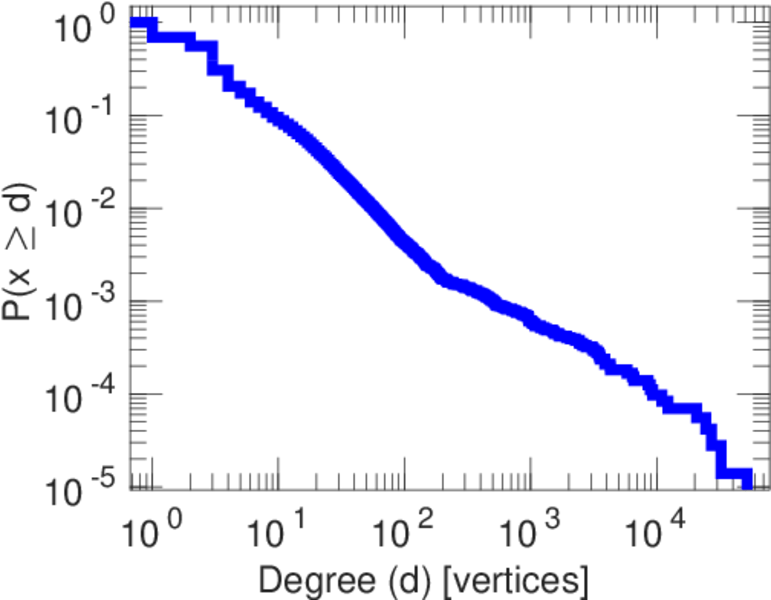
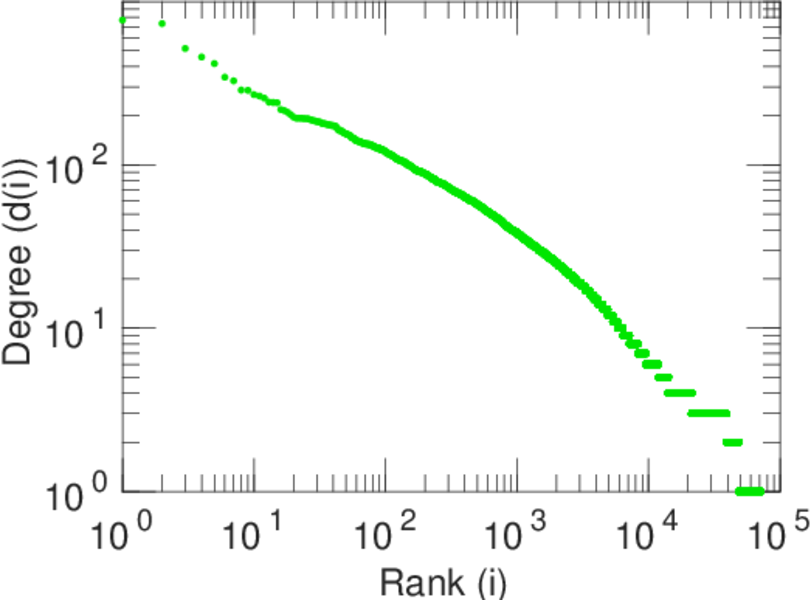
| Maximum degree | dmax = | 52,027
|
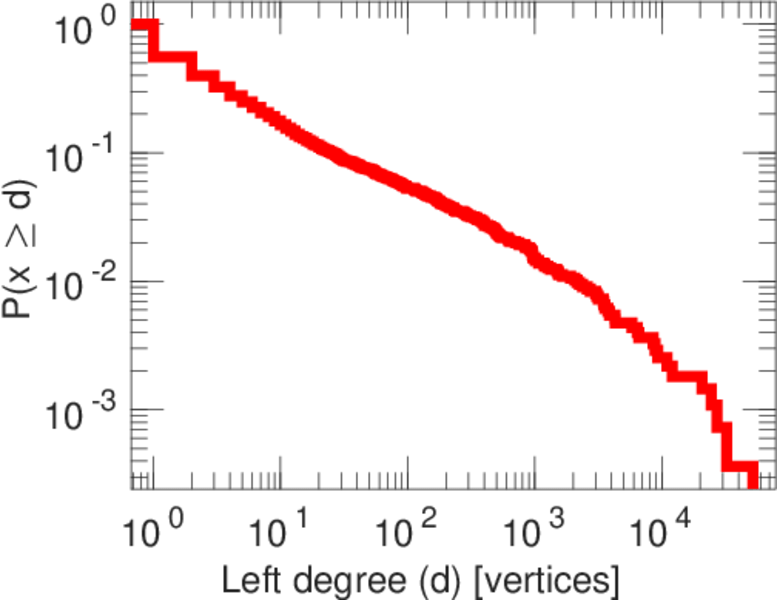
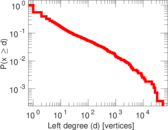
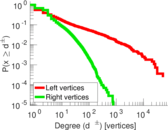
| Maximum left degree | d1max = | 52,027
|
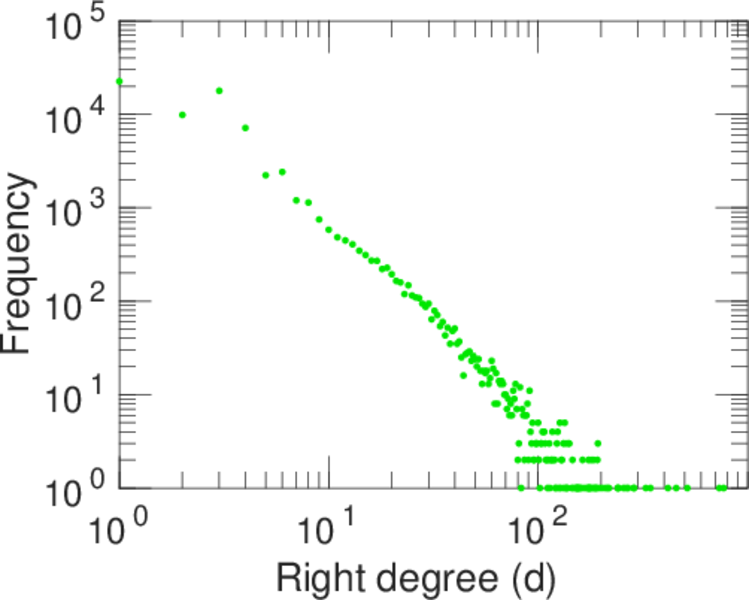
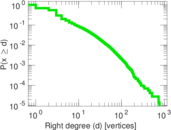
| Maximum right degree | d2max = | 770
|
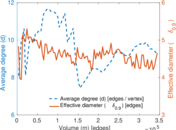
| Average degree | d = | 9.252 11
|
| Average left degree | d1 = | 125.380
|
| Average right degree | d2 = | 4.803 28
|
| Fill | p = | 0.001 114 64
|
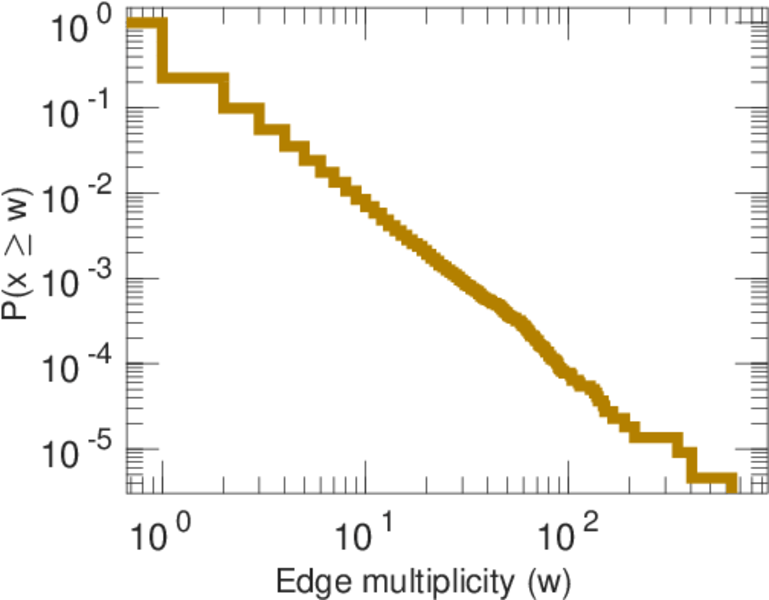
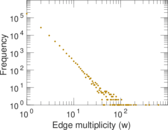
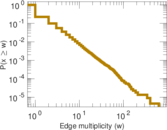
| Average edge multiplicity | m̃ = | 1.568 72
|
| Size of LCC | N = | 73,364
|
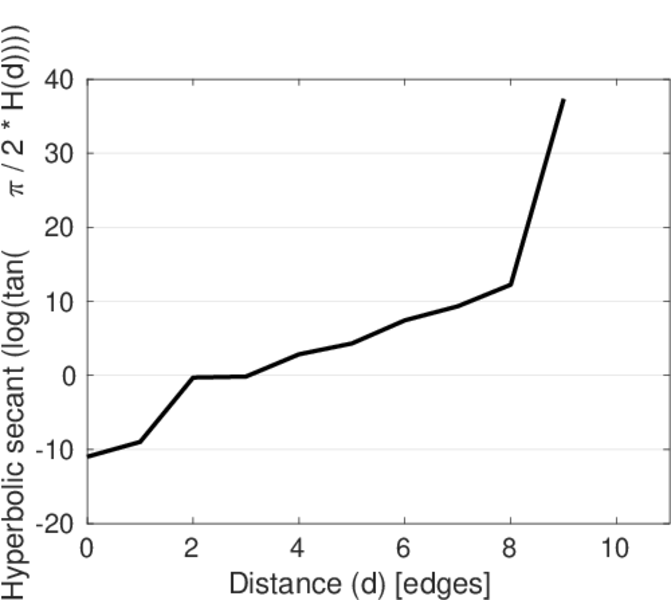
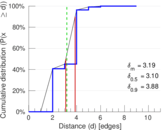
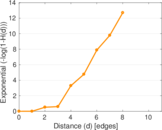
| Diameter | δ = | 12
|
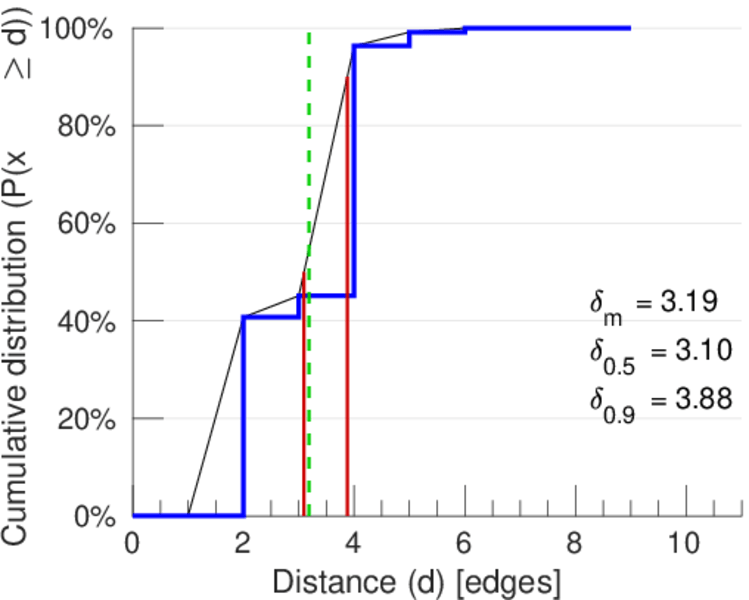
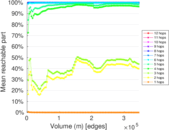
| 50-Percentile effective diameter | δ0.5 = | 3.095 45
|
| 90-Percentile effective diameter | δ0.9 = | 3.876 84
|
| Median distance | δM = | 4
|
| Mean distance | δm = | 3.187 56
|
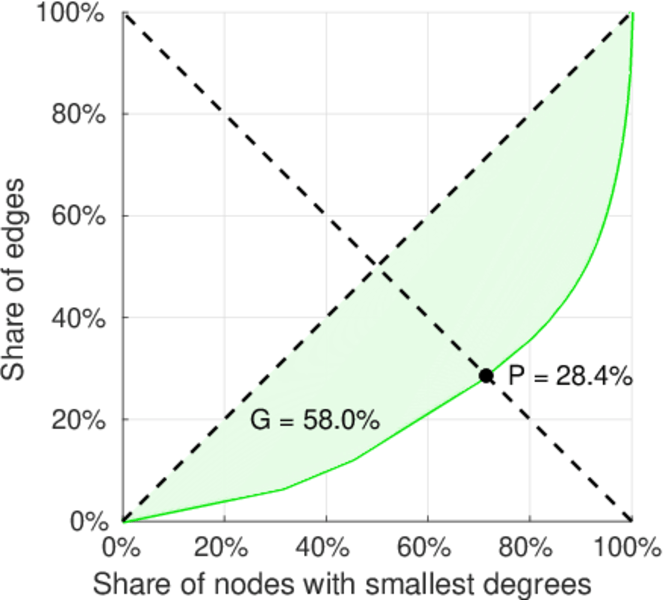
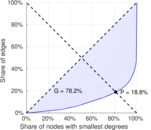
| Gini coefficient | G = | 0.785 118
|
| Balanced inequality ratio | P = | 0.187 545
|
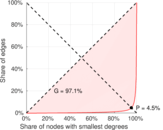
| Left balanced inequality ratio | P1 = | 0.045 488 2
|
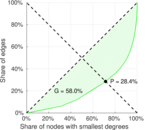
| Right balanced inequality ratio | P2 = | 0.284 424
|
| Relative edge distribution entropy | Her = | 0.704 531
|
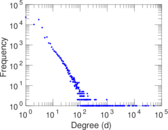
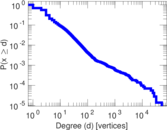
| Power law exponent | γ = | 2.286 30
|
| Tail power law exponent | γt = | 2.931 00
|
| Tail power law exponent with p | γ3 = | 2.931 00
|
| p-value | p = | 0.000 00
|
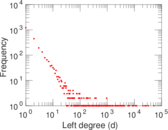
| Left tail power law exponent with p | γ3,1 = | 1.771 00
|
| Left p-value | p1 = | 0.000 00
|
| Right tail power law exponent with p | γ3,2 = | 6.741 00
|
| Right p-value | p2 = | 0.822 000
|
| Degree assortativity | ρ = | −0.387 735
|
| Degree assortativity p-value | pρ = | 0.000 00
|
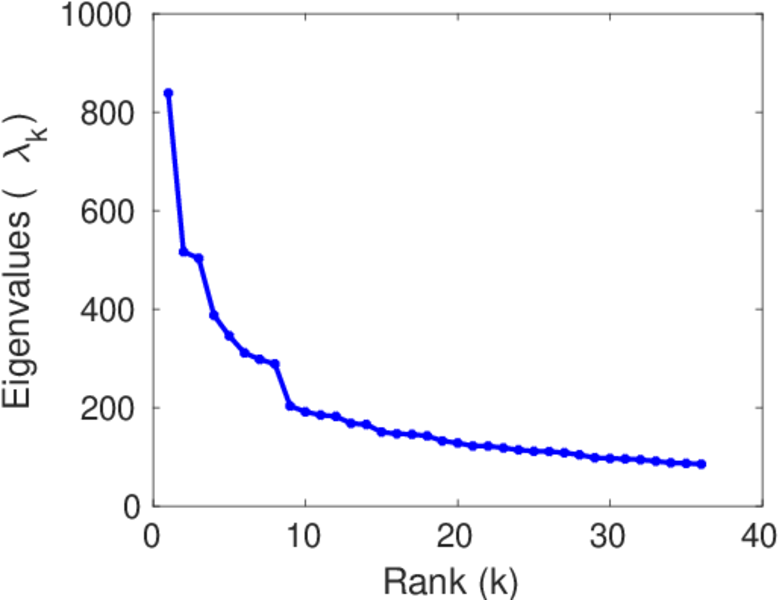
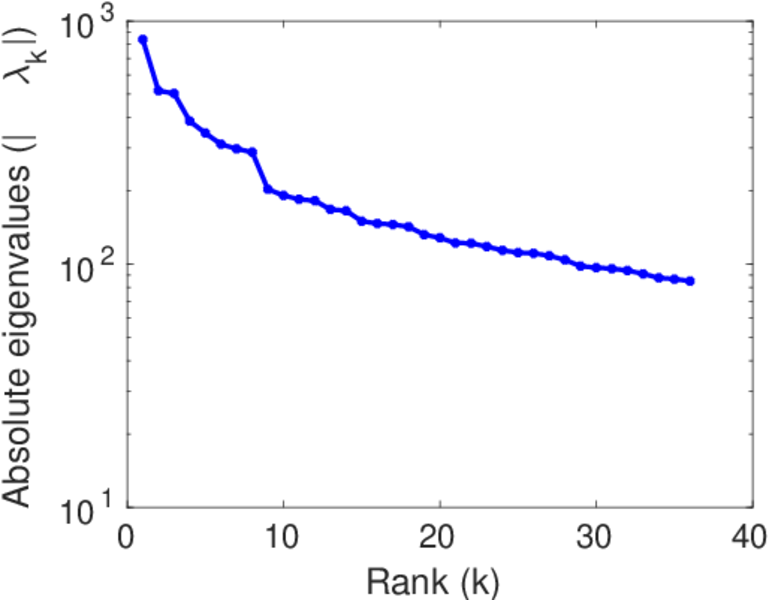
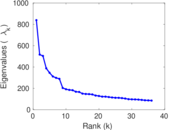
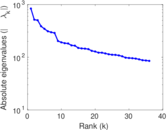
| Spectral norm | α = | 838.620
|
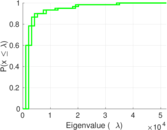
| Algebraic connectivity | a = | 0.006 433 99
|
| Spectral separation | |λ1[A] / λ2[A]| = | 1.624 25
|
| Controllability | C = | 69,334
|
| Relative controllability | Cr = | 0.933 314
|
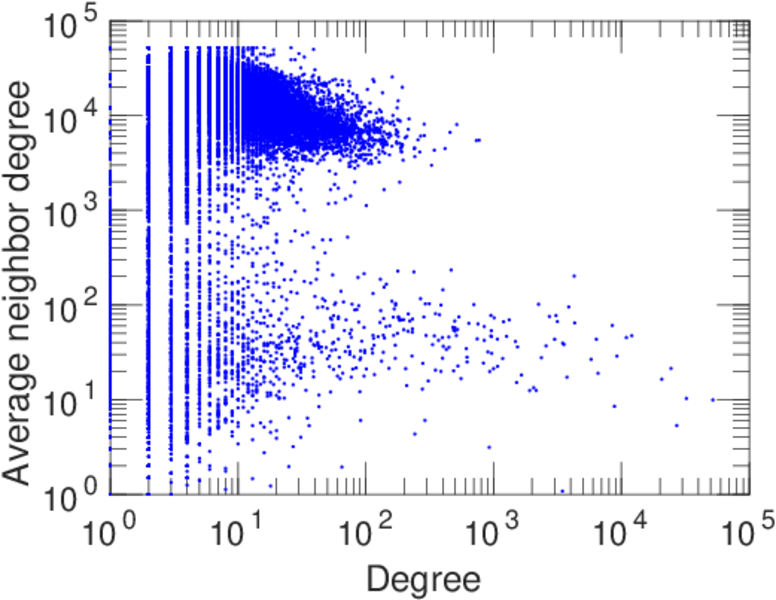
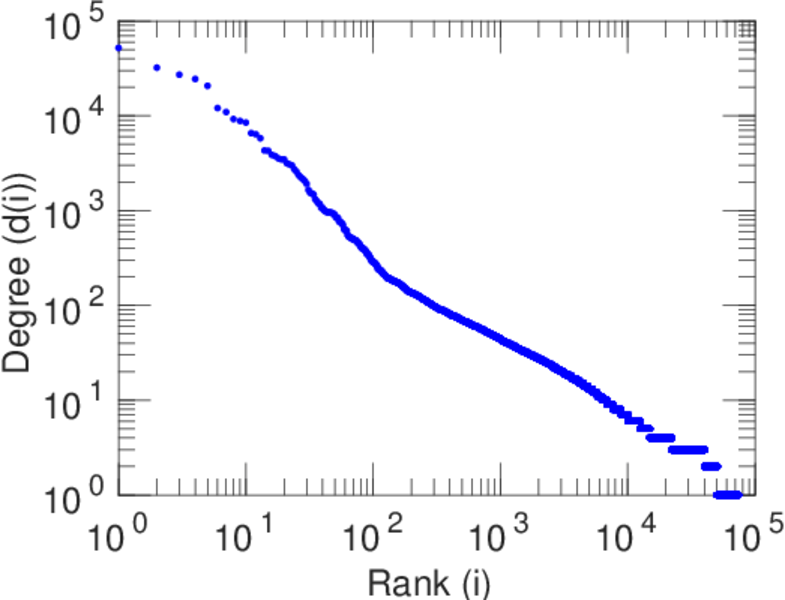
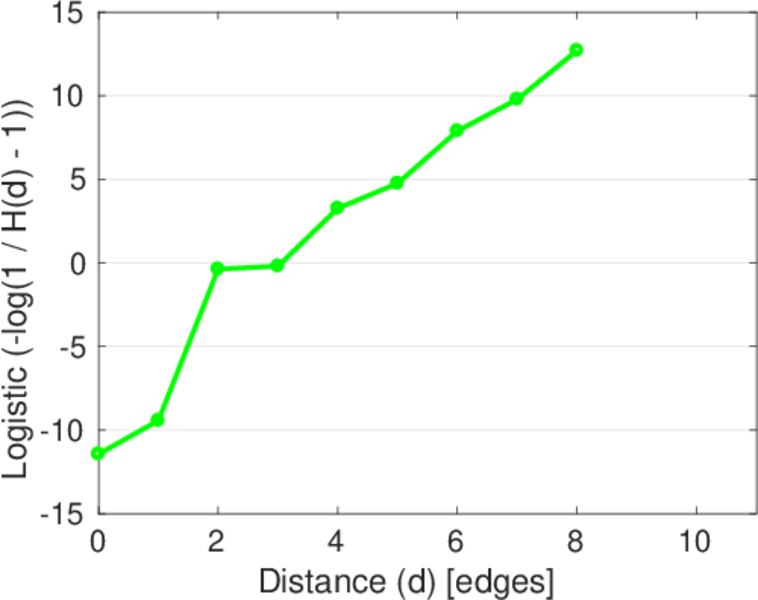
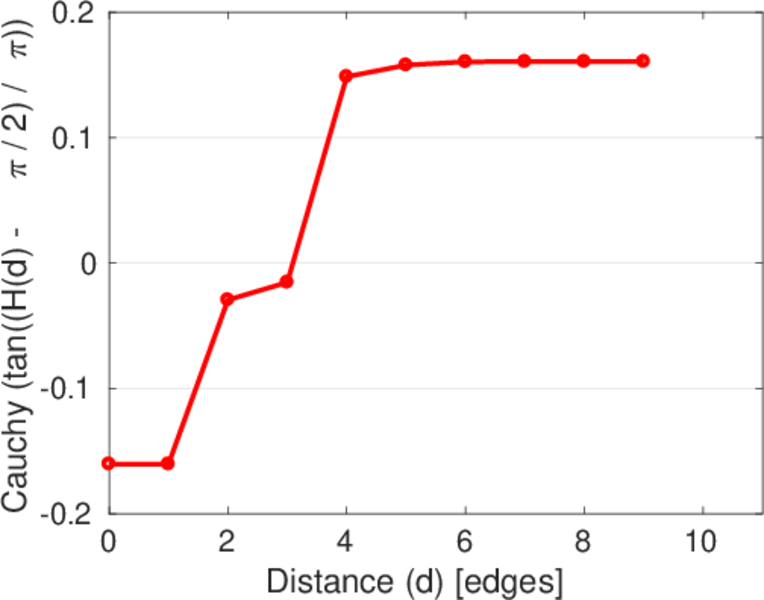
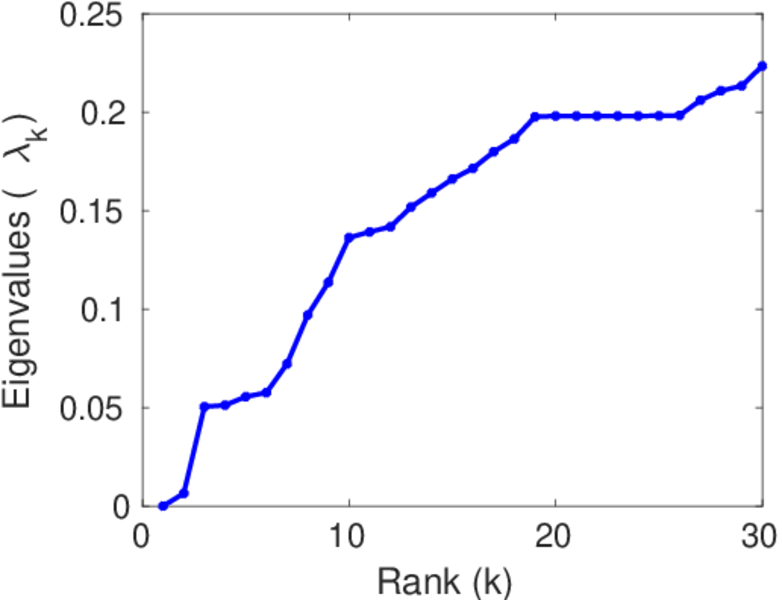
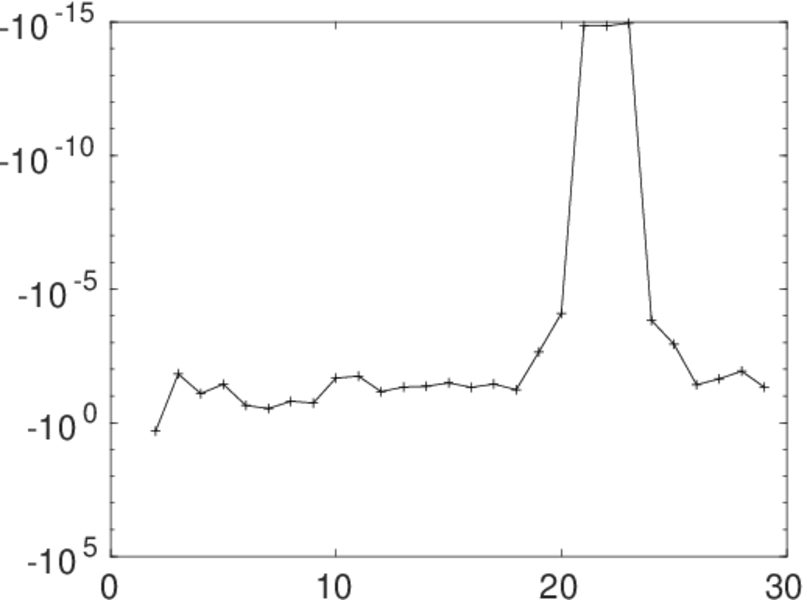
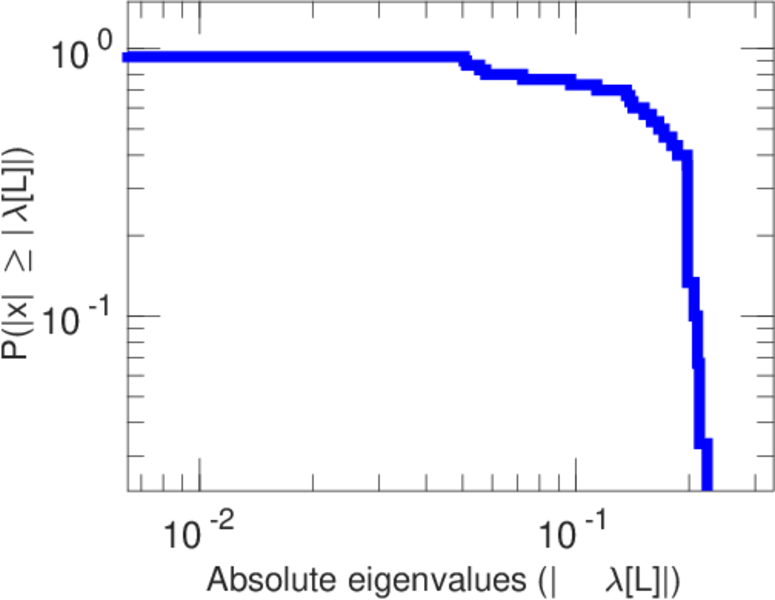
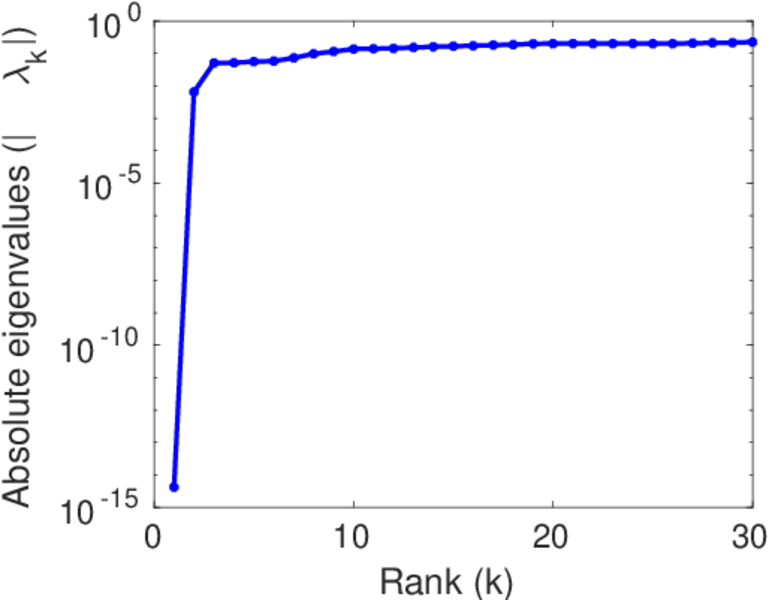
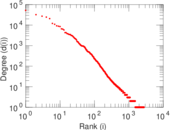
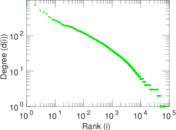
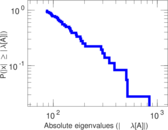
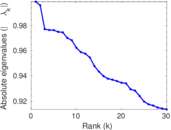
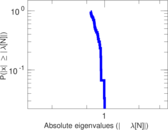
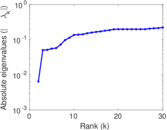
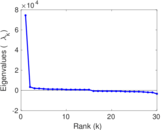
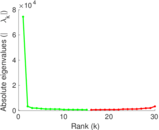
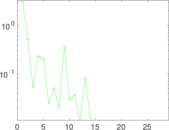
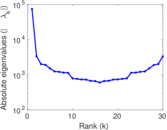
Plots


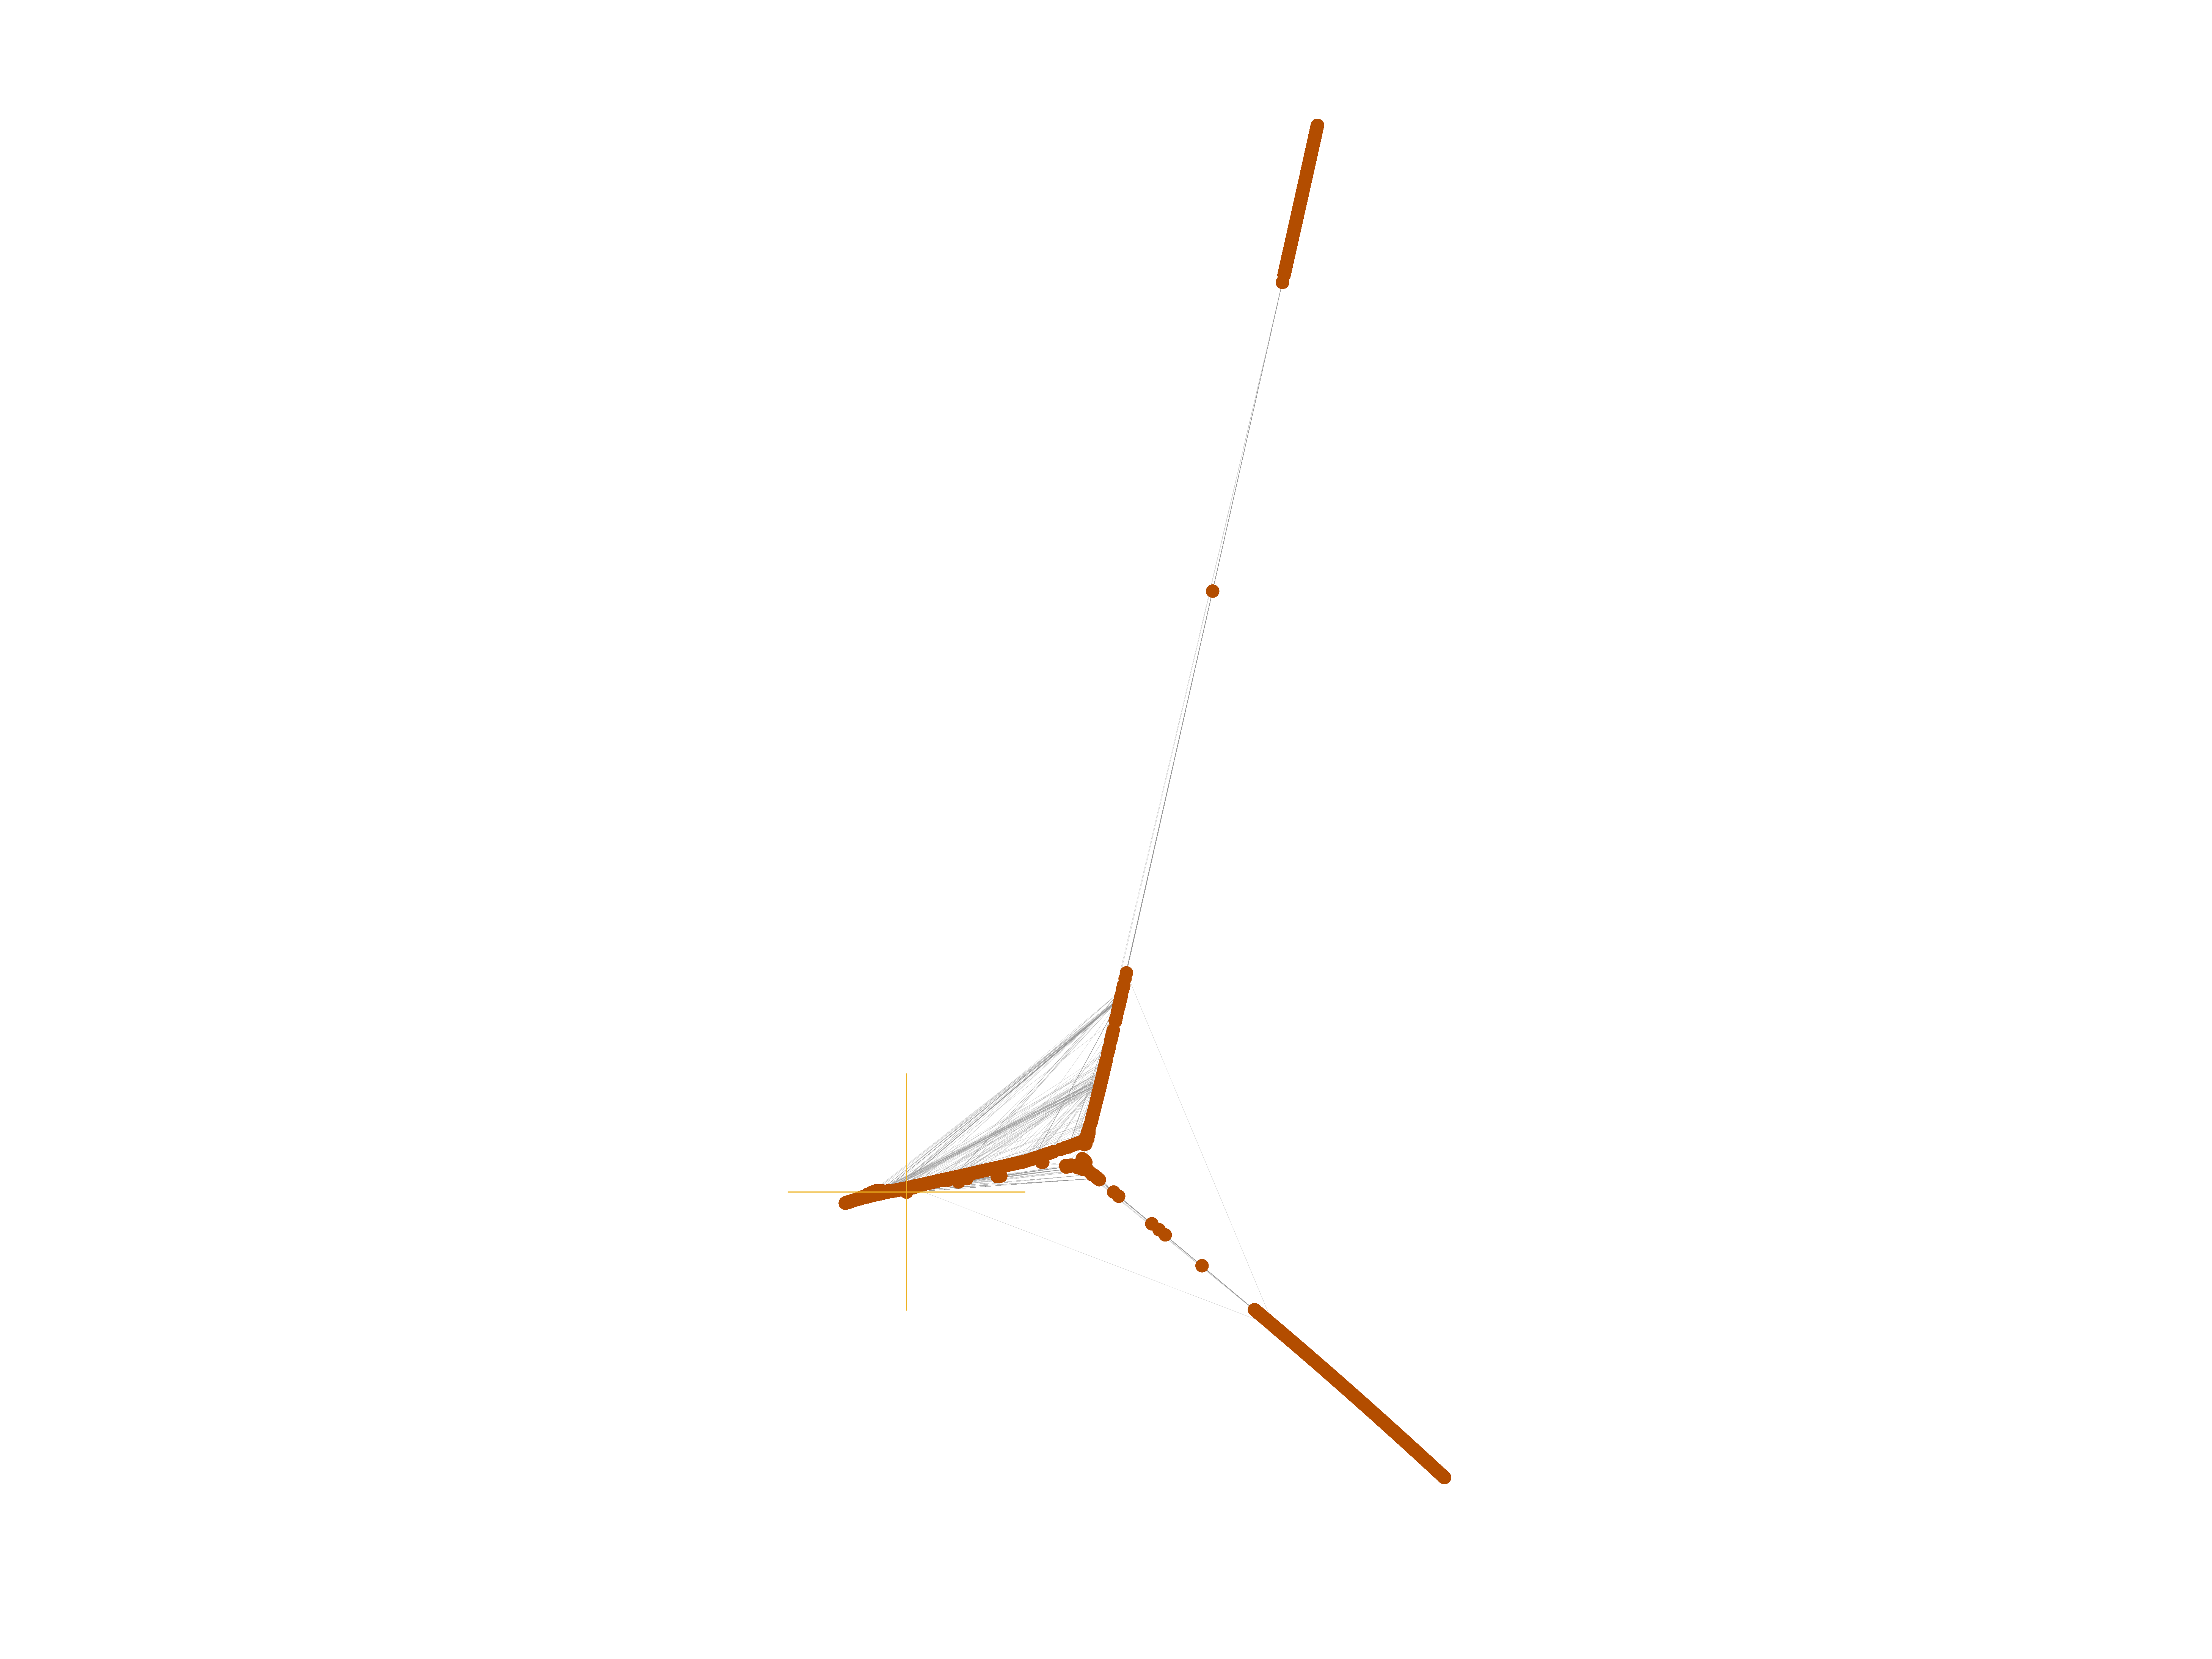
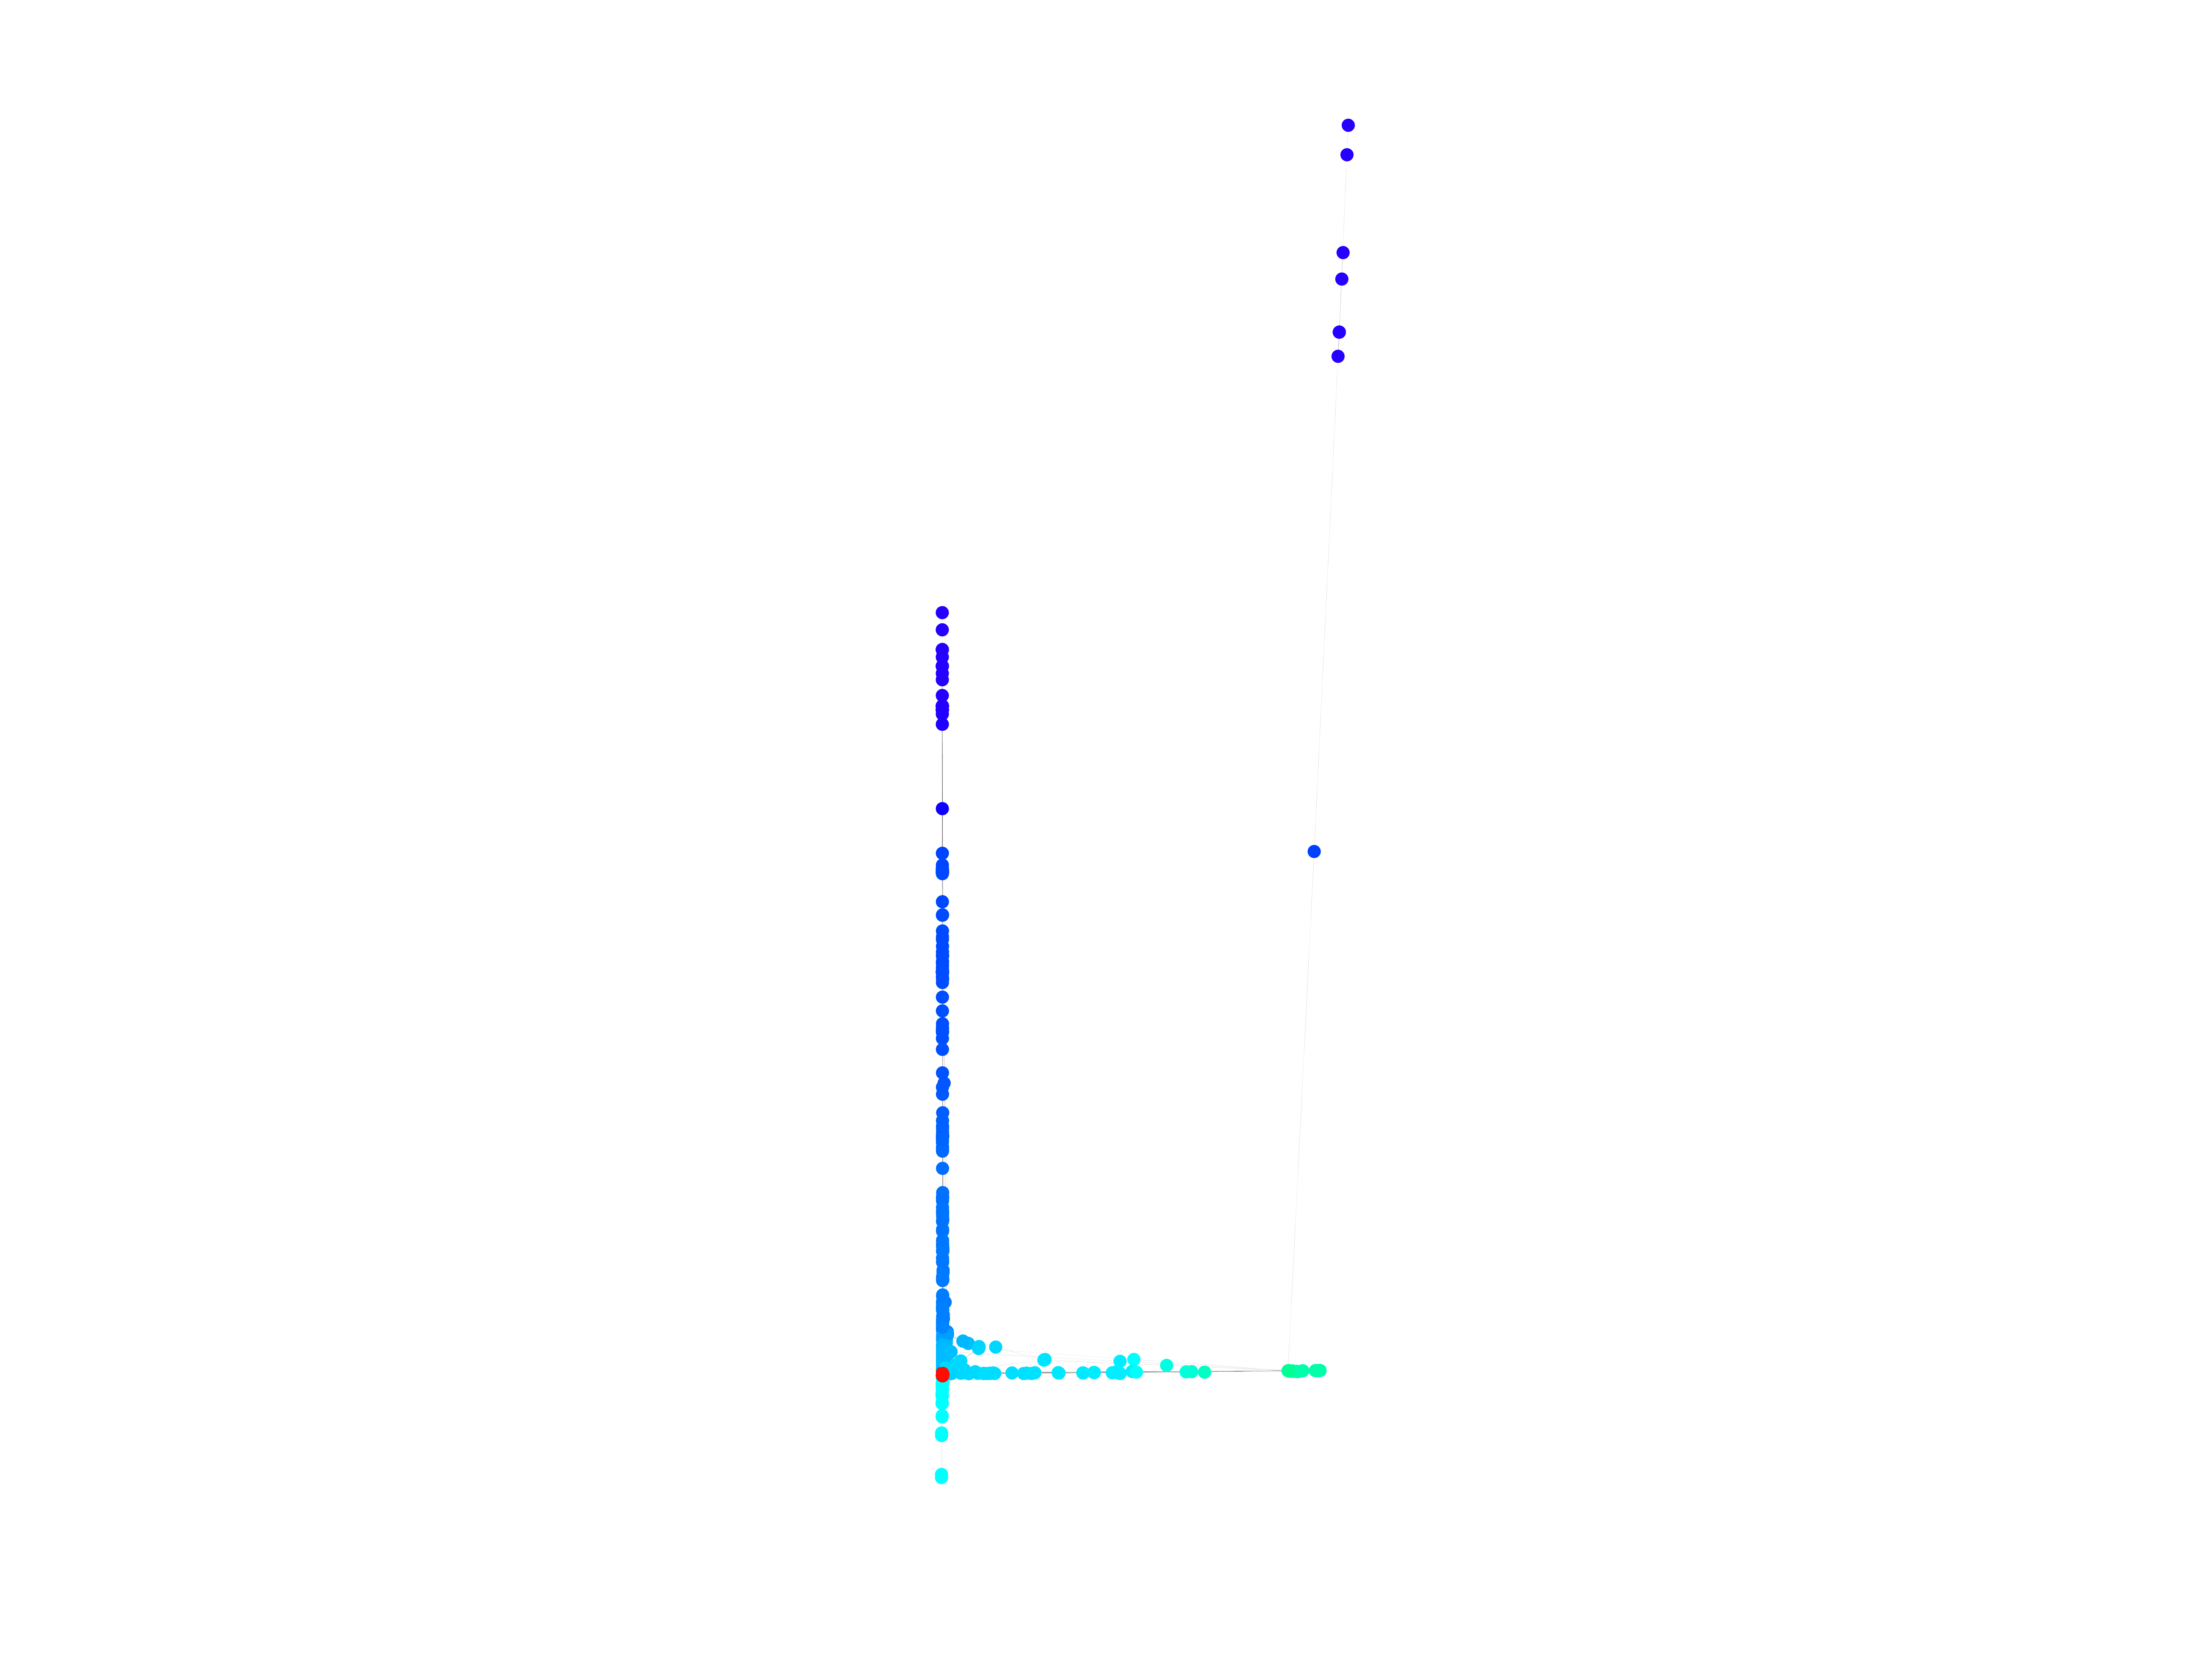
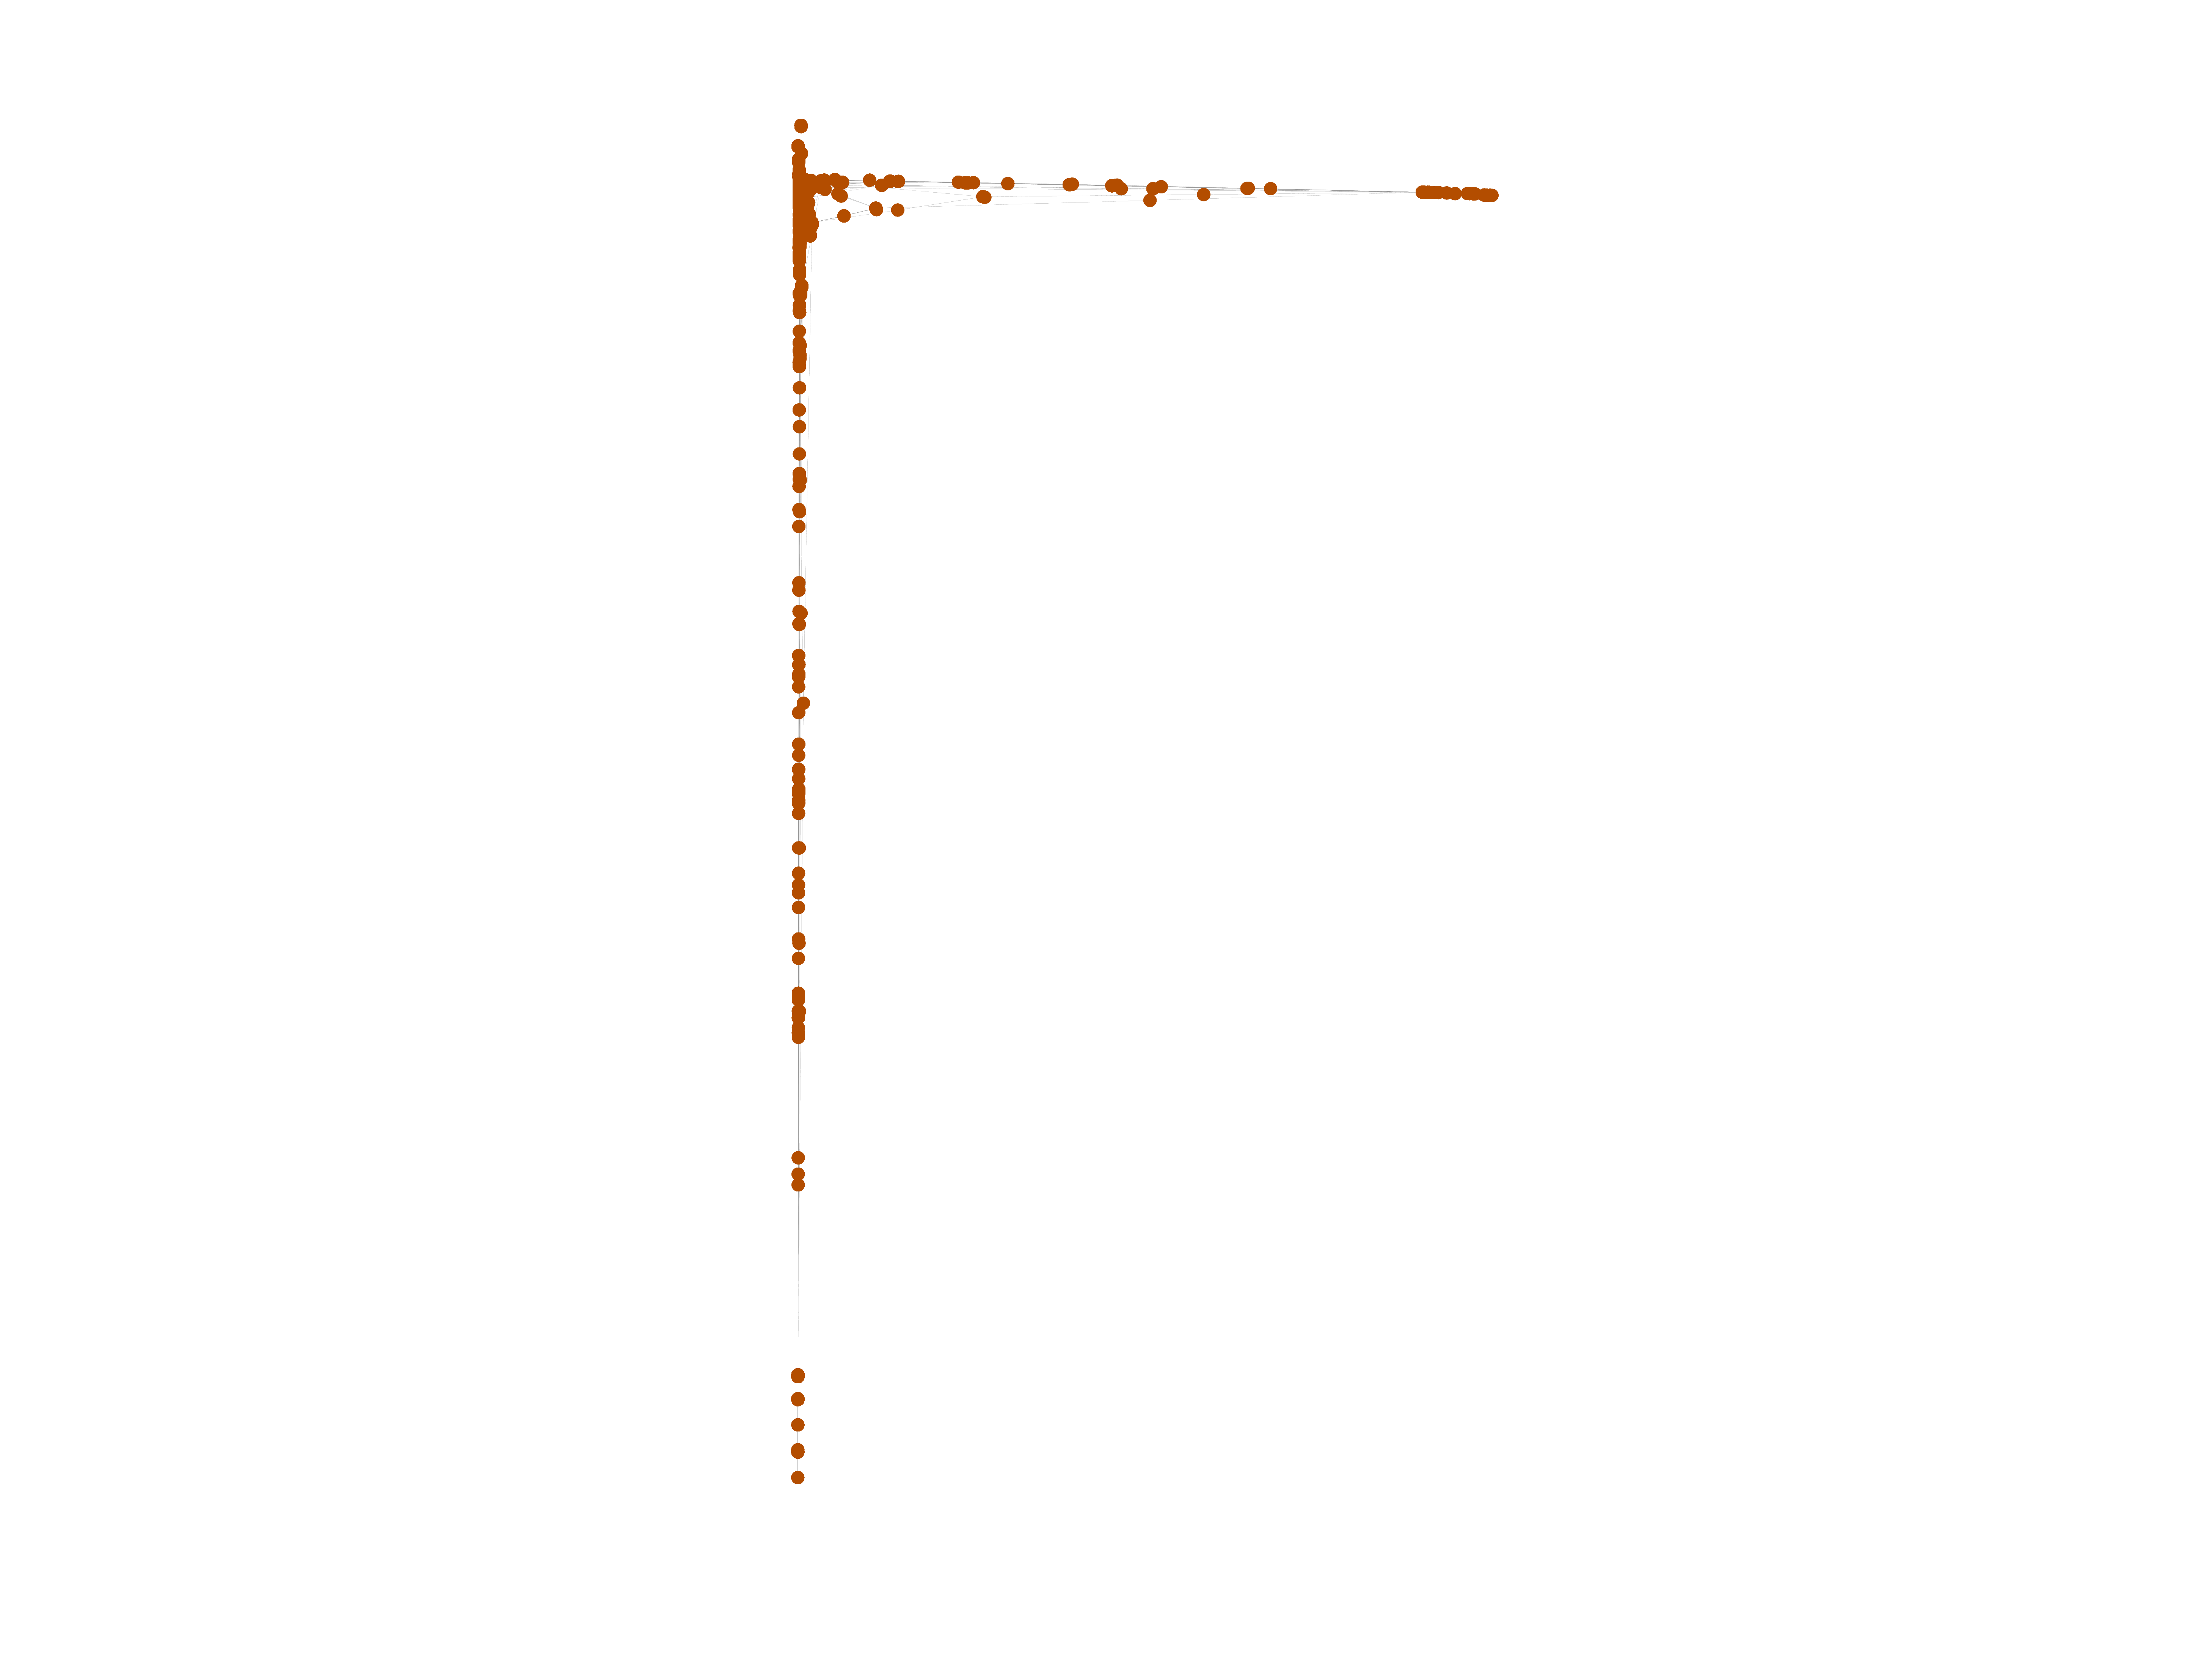
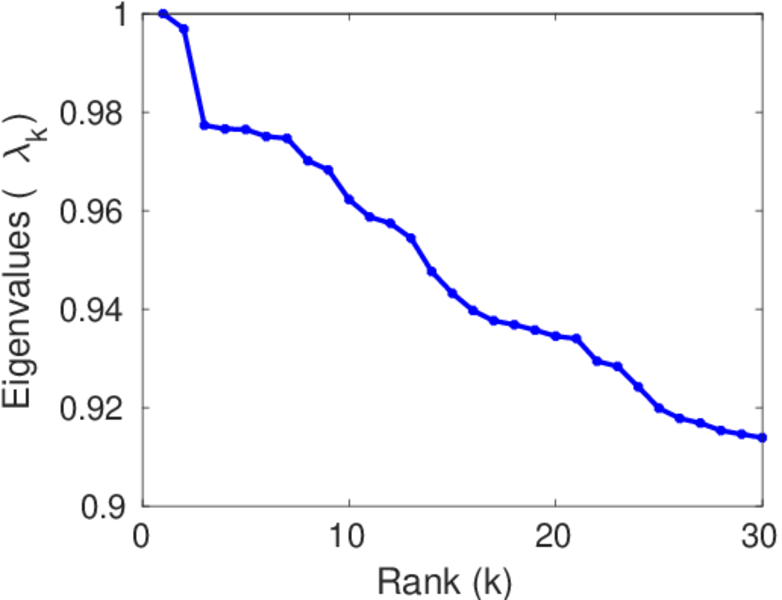
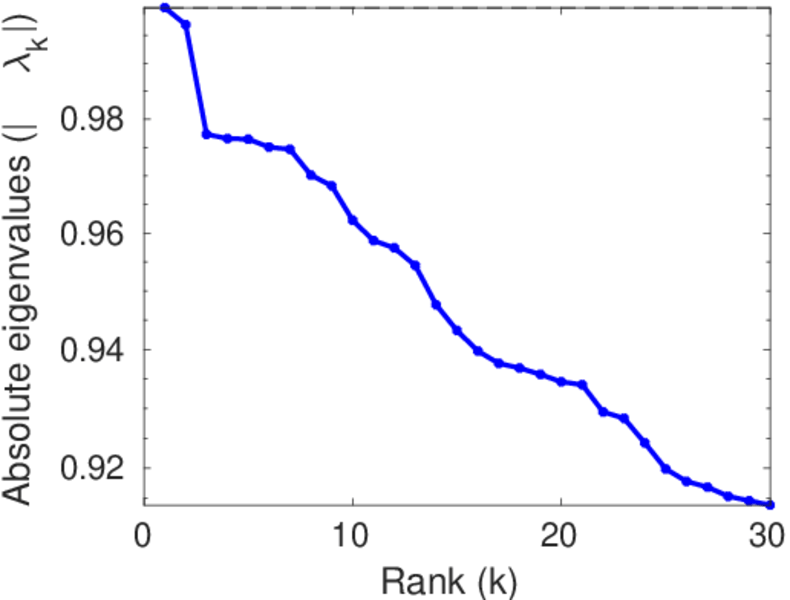
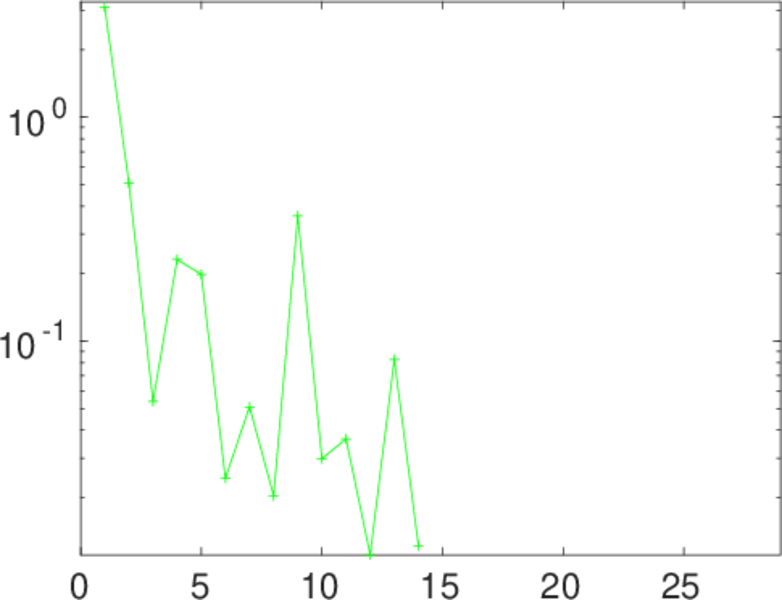
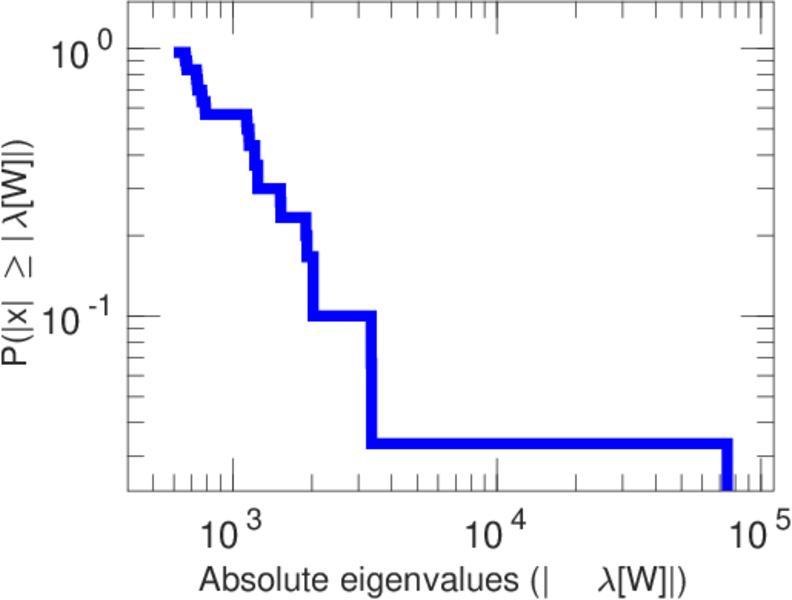
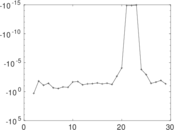
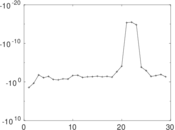
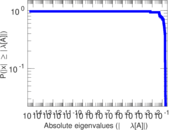
Matrix decompositions plots


Downloads
References
|
[1]
|
Jérôme Kunegis.
KONECT – The Koblenz Network Collection.
In Proc. Int. Conf. on World Wide Web Companion, pages
1343–1350, 2013.
[ http ]
|
|
[2]
|
Wikimedia Foundation.
Wikimedia downloads.
http://dumps.wikimedia.org/, January 2010.
|
 KONECT ‣ Networks ‣
Buy Me a Coffee
KONECT ‣ Networks ‣
Buy Me a Coffee