Wiktionary edits (my)
This is the bipartite edit network of the Burmese Wiktionary. It contains users
and pages from the Burmese Wiktionary, connected by edit events. Each edge
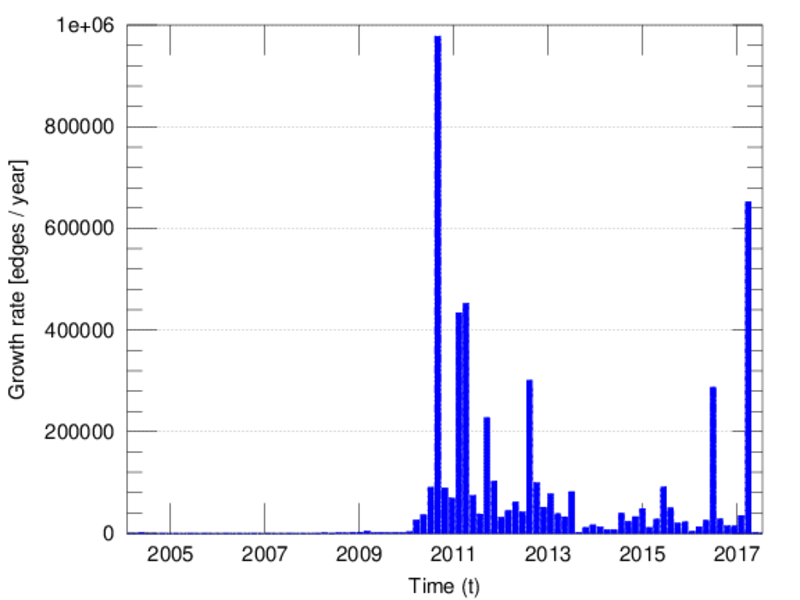
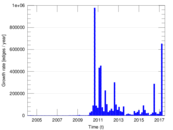
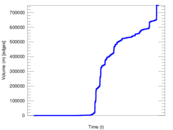
represents an edit. The dataset includes the timestamp of each edit.
Metadata
Statistics
| Size | n = | 125,132
|
| Left size | n1 = | 364
|
| Right size | n2 = | 124,768
|
| Volume | m = | 748,234
|
| Unique edge count | m̿ = | 512,367
|
| Wedge count | s = | 13,618,688,882
|
| Claw count | z = | 314,552,427,348,145
|
| Cross count | x = | 6,102,580,581,510,914,048
|
| Square count | q = | 11,263,889,888
|
| 4-Tour count | T4 = | 144,586,899,678
|
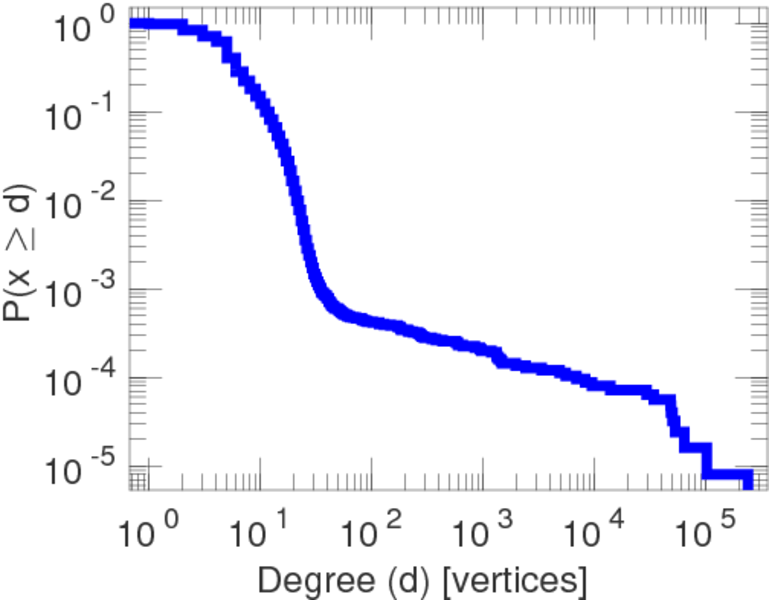
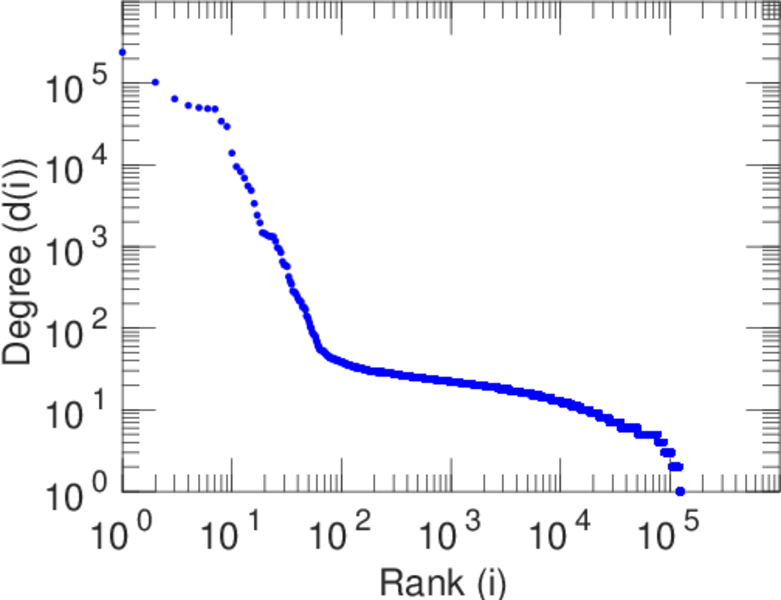
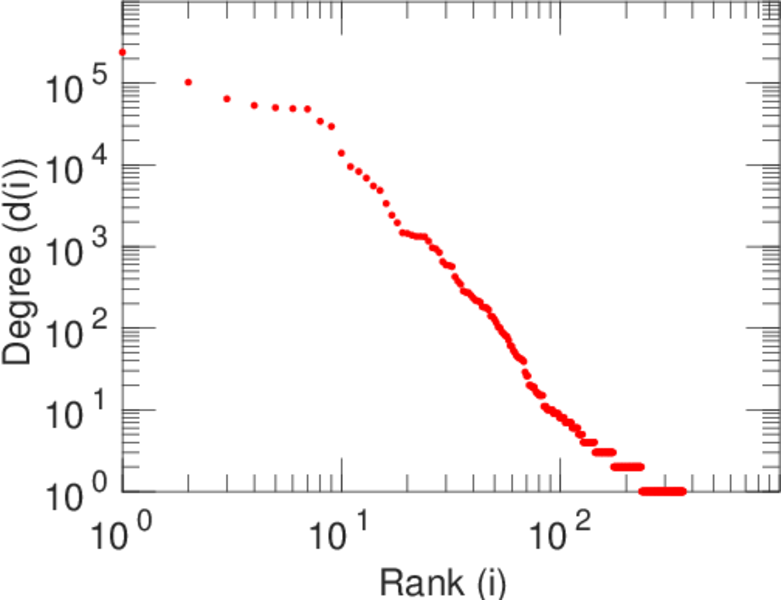
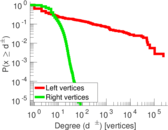
| Maximum degree | dmax = | 239,375
|
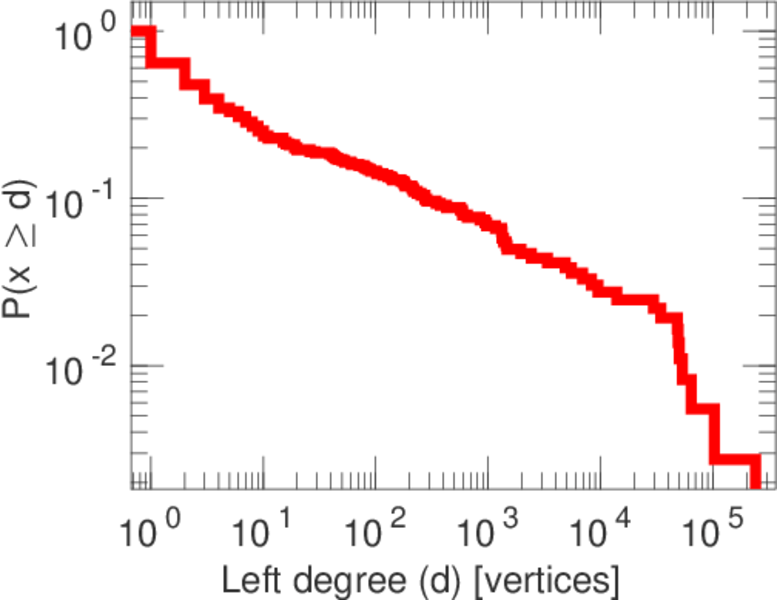
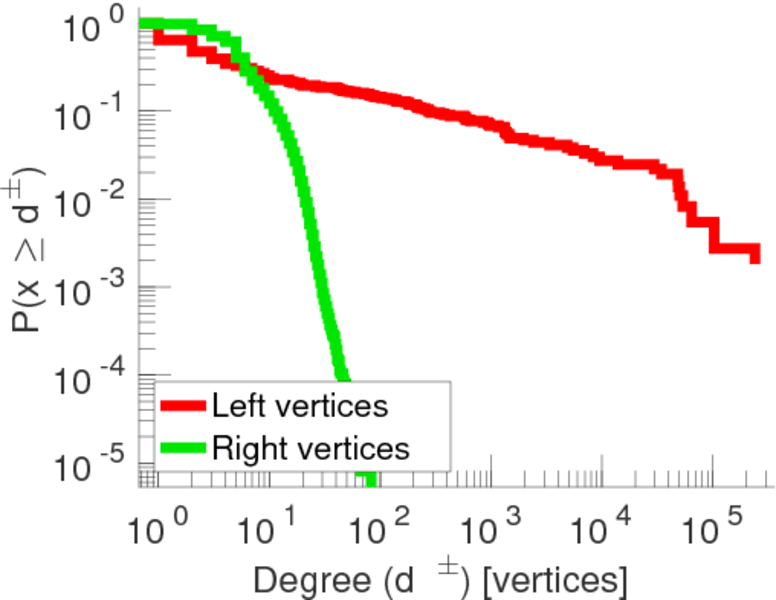
| Maximum left degree | d1max = | 239,375
|
| Maximum right degree | d2max = | 83
|
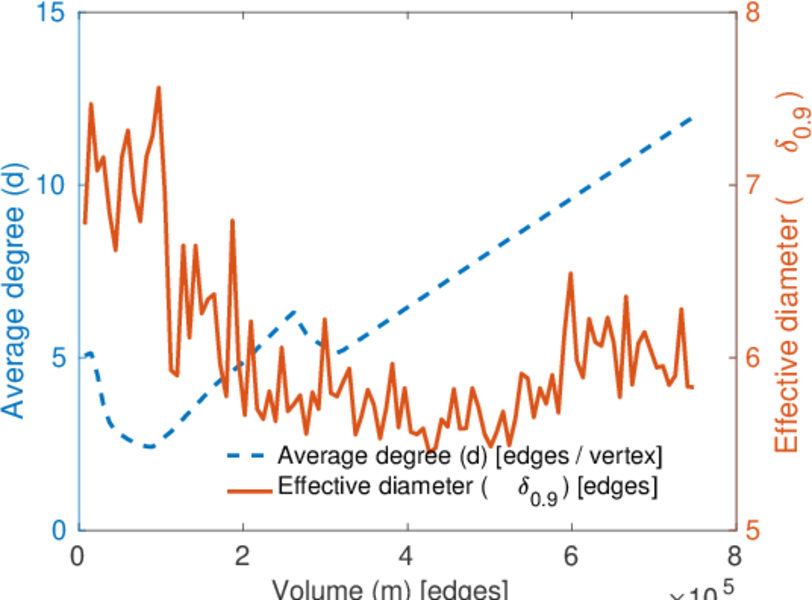
| Average degree | d = | 11.959 1
|
| Average left degree | d1 = | 2,055.59
|
| Average right degree | d2 = | 5.997 00
|
| Fill | p = | 0.011 281 8
|
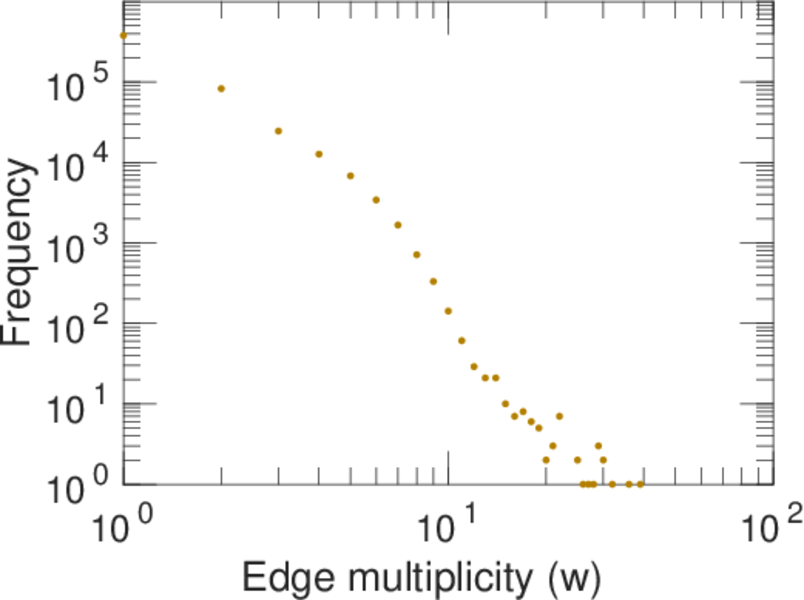
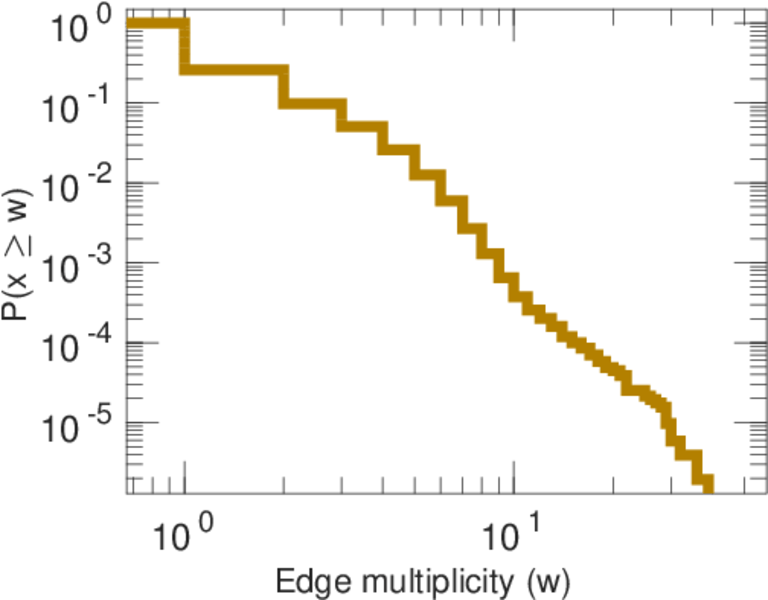
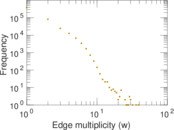
| Average edge multiplicity | m̃ = | 1.460 35
|
| Size of LCC | N = | 124,818
|
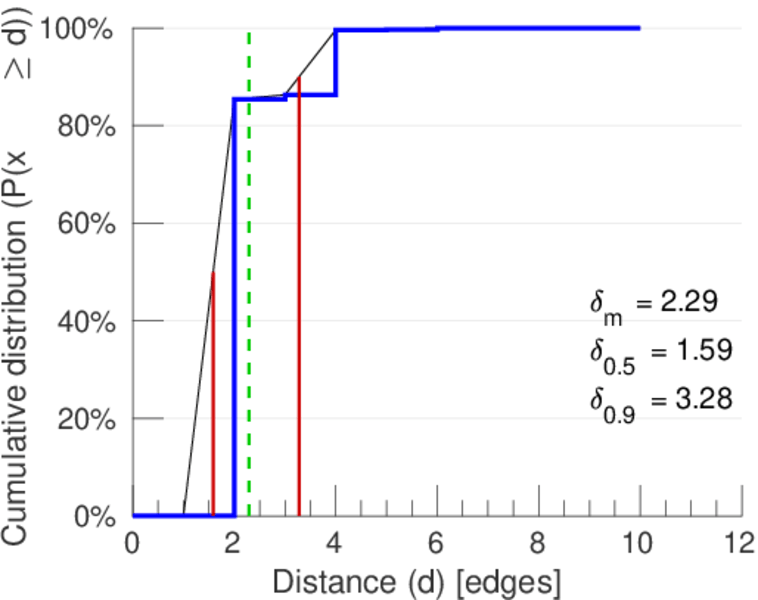
| Diameter | δ = | 13
|
| 50-Percentile effective diameter | δ0.5 = | 1.585 74
|
| 90-Percentile effective diameter | δ0.9 = | 3.278 23
|
| Median distance | δM = | 2
|
| Mean distance | δm = | 2.291 39
|
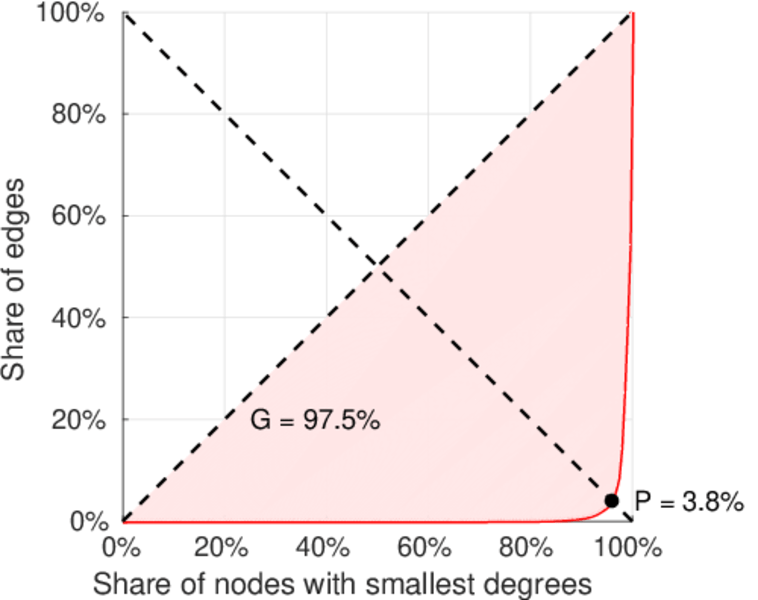
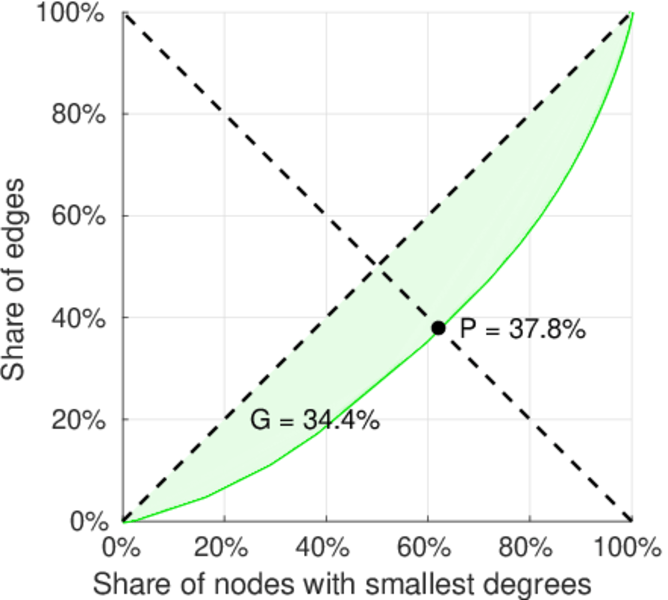
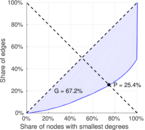
| Balanced inequality ratio | P = | 0.254 404
|
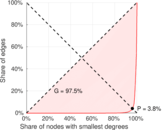
| Left balanced inequality ratio | P1 = | 0.038 433 2
|
| Right balanced inequality ratio | P2 = | 0.378 154
|
| Relative edge distribution entropy | Her = | 0.665 676
|
| Tail power law exponent | γt = | 4.431 00
|
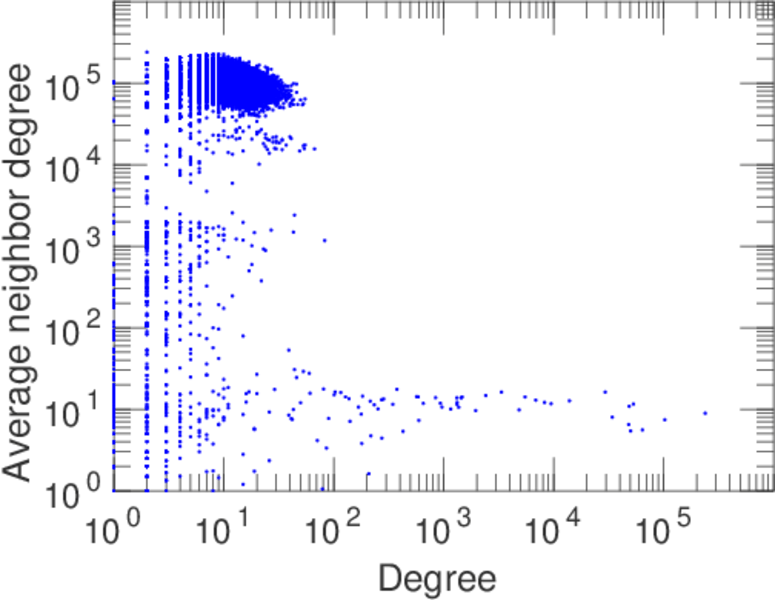
| Degree assortativity | ρ = | −0.314 950
|
| Degree assortativity p-value | pρ = | 0.000 00
|
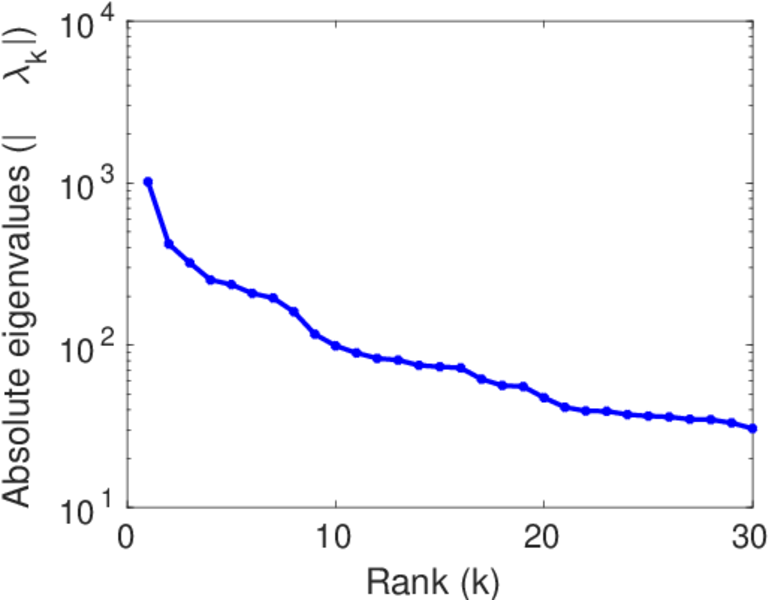
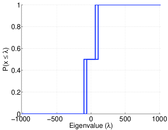
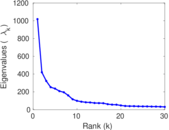
| Spectral norm | α = | 1,018.05
|
| Algebraic connectivity | a = | 0.010 020 8
|
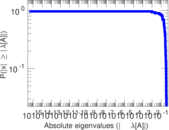
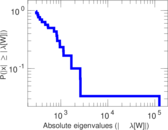
| Spectral separation | |λ1[A] / λ2[A]| = | 2.421 77
|
| Controllability | C = | 124,339
|
| Relative controllability | Cr = | 0.994 259
|
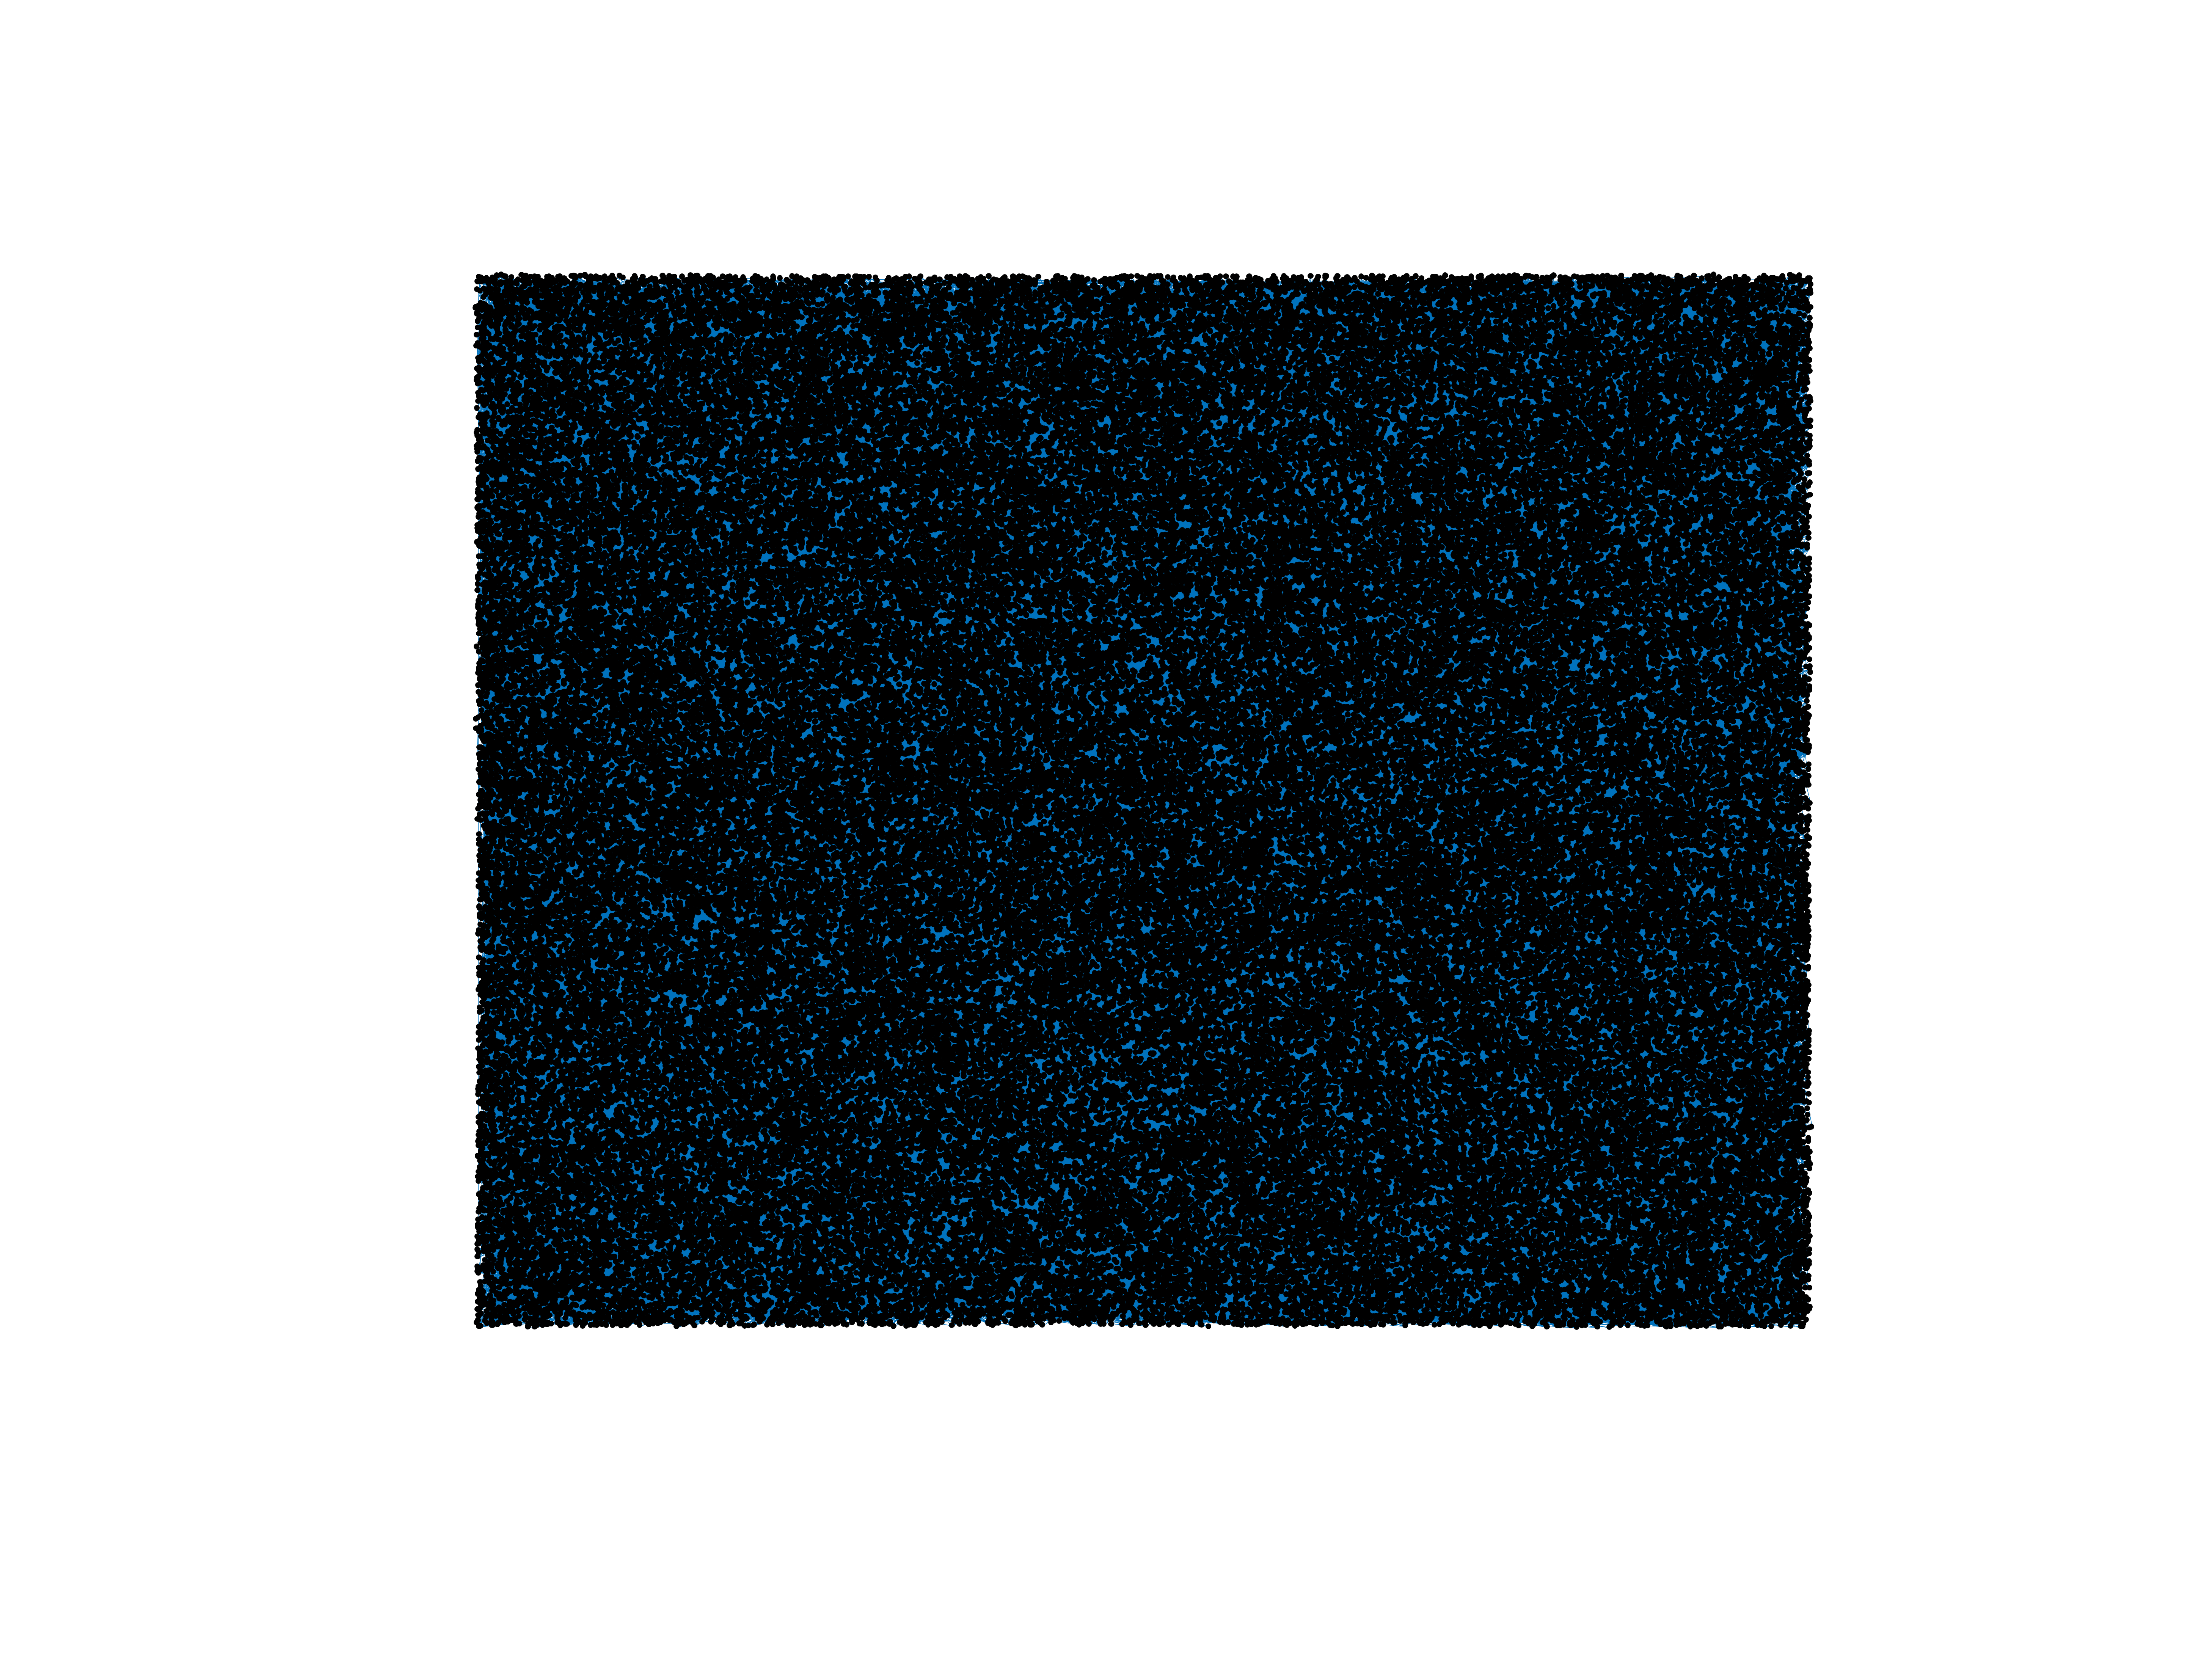
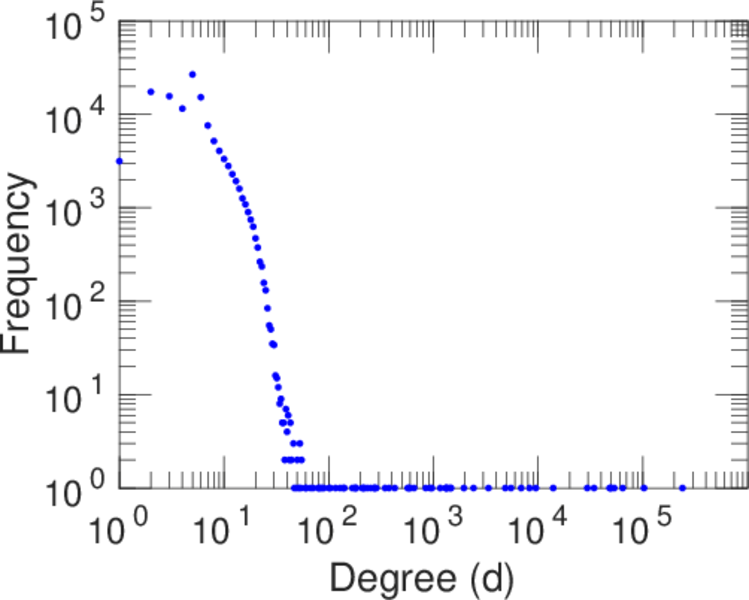
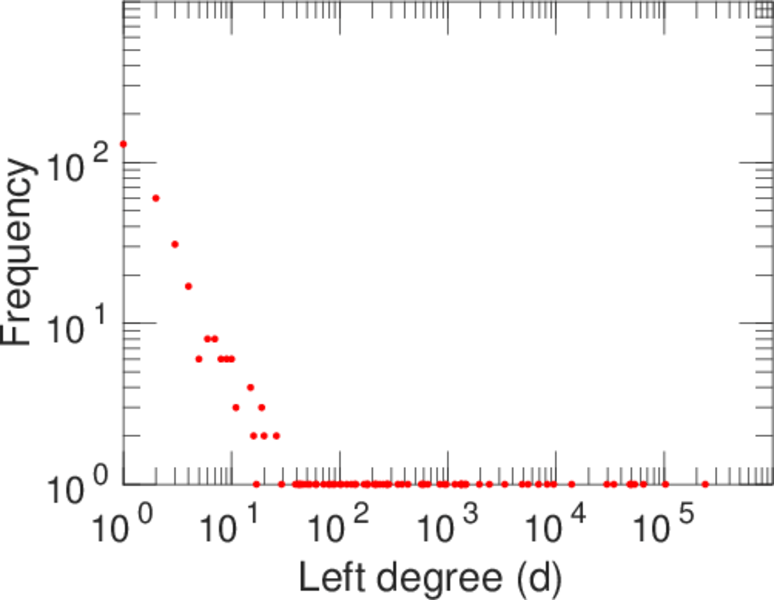
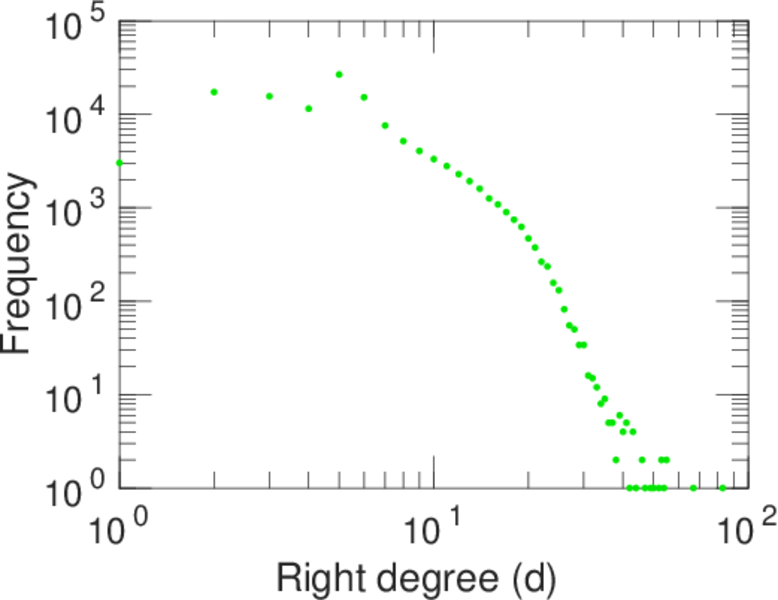
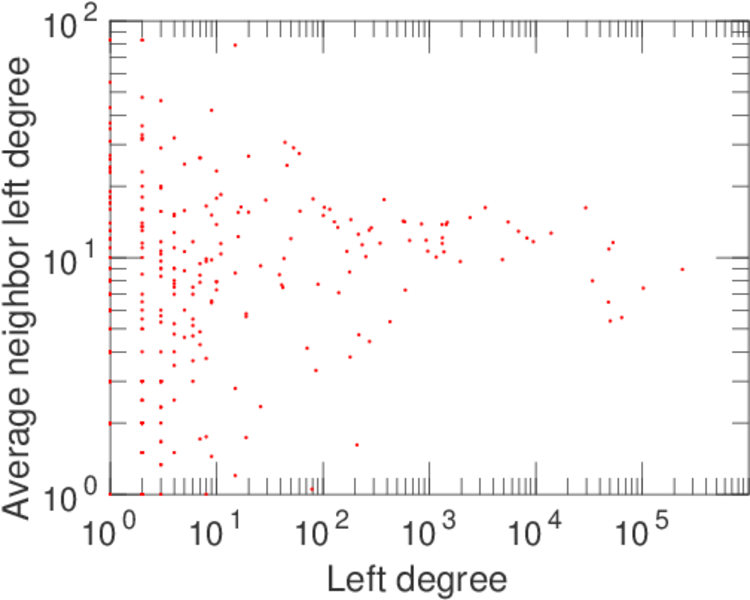
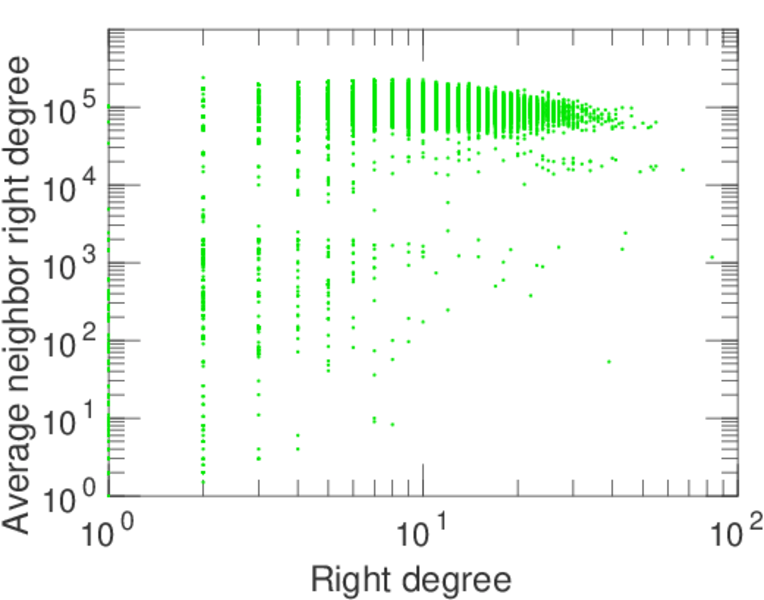
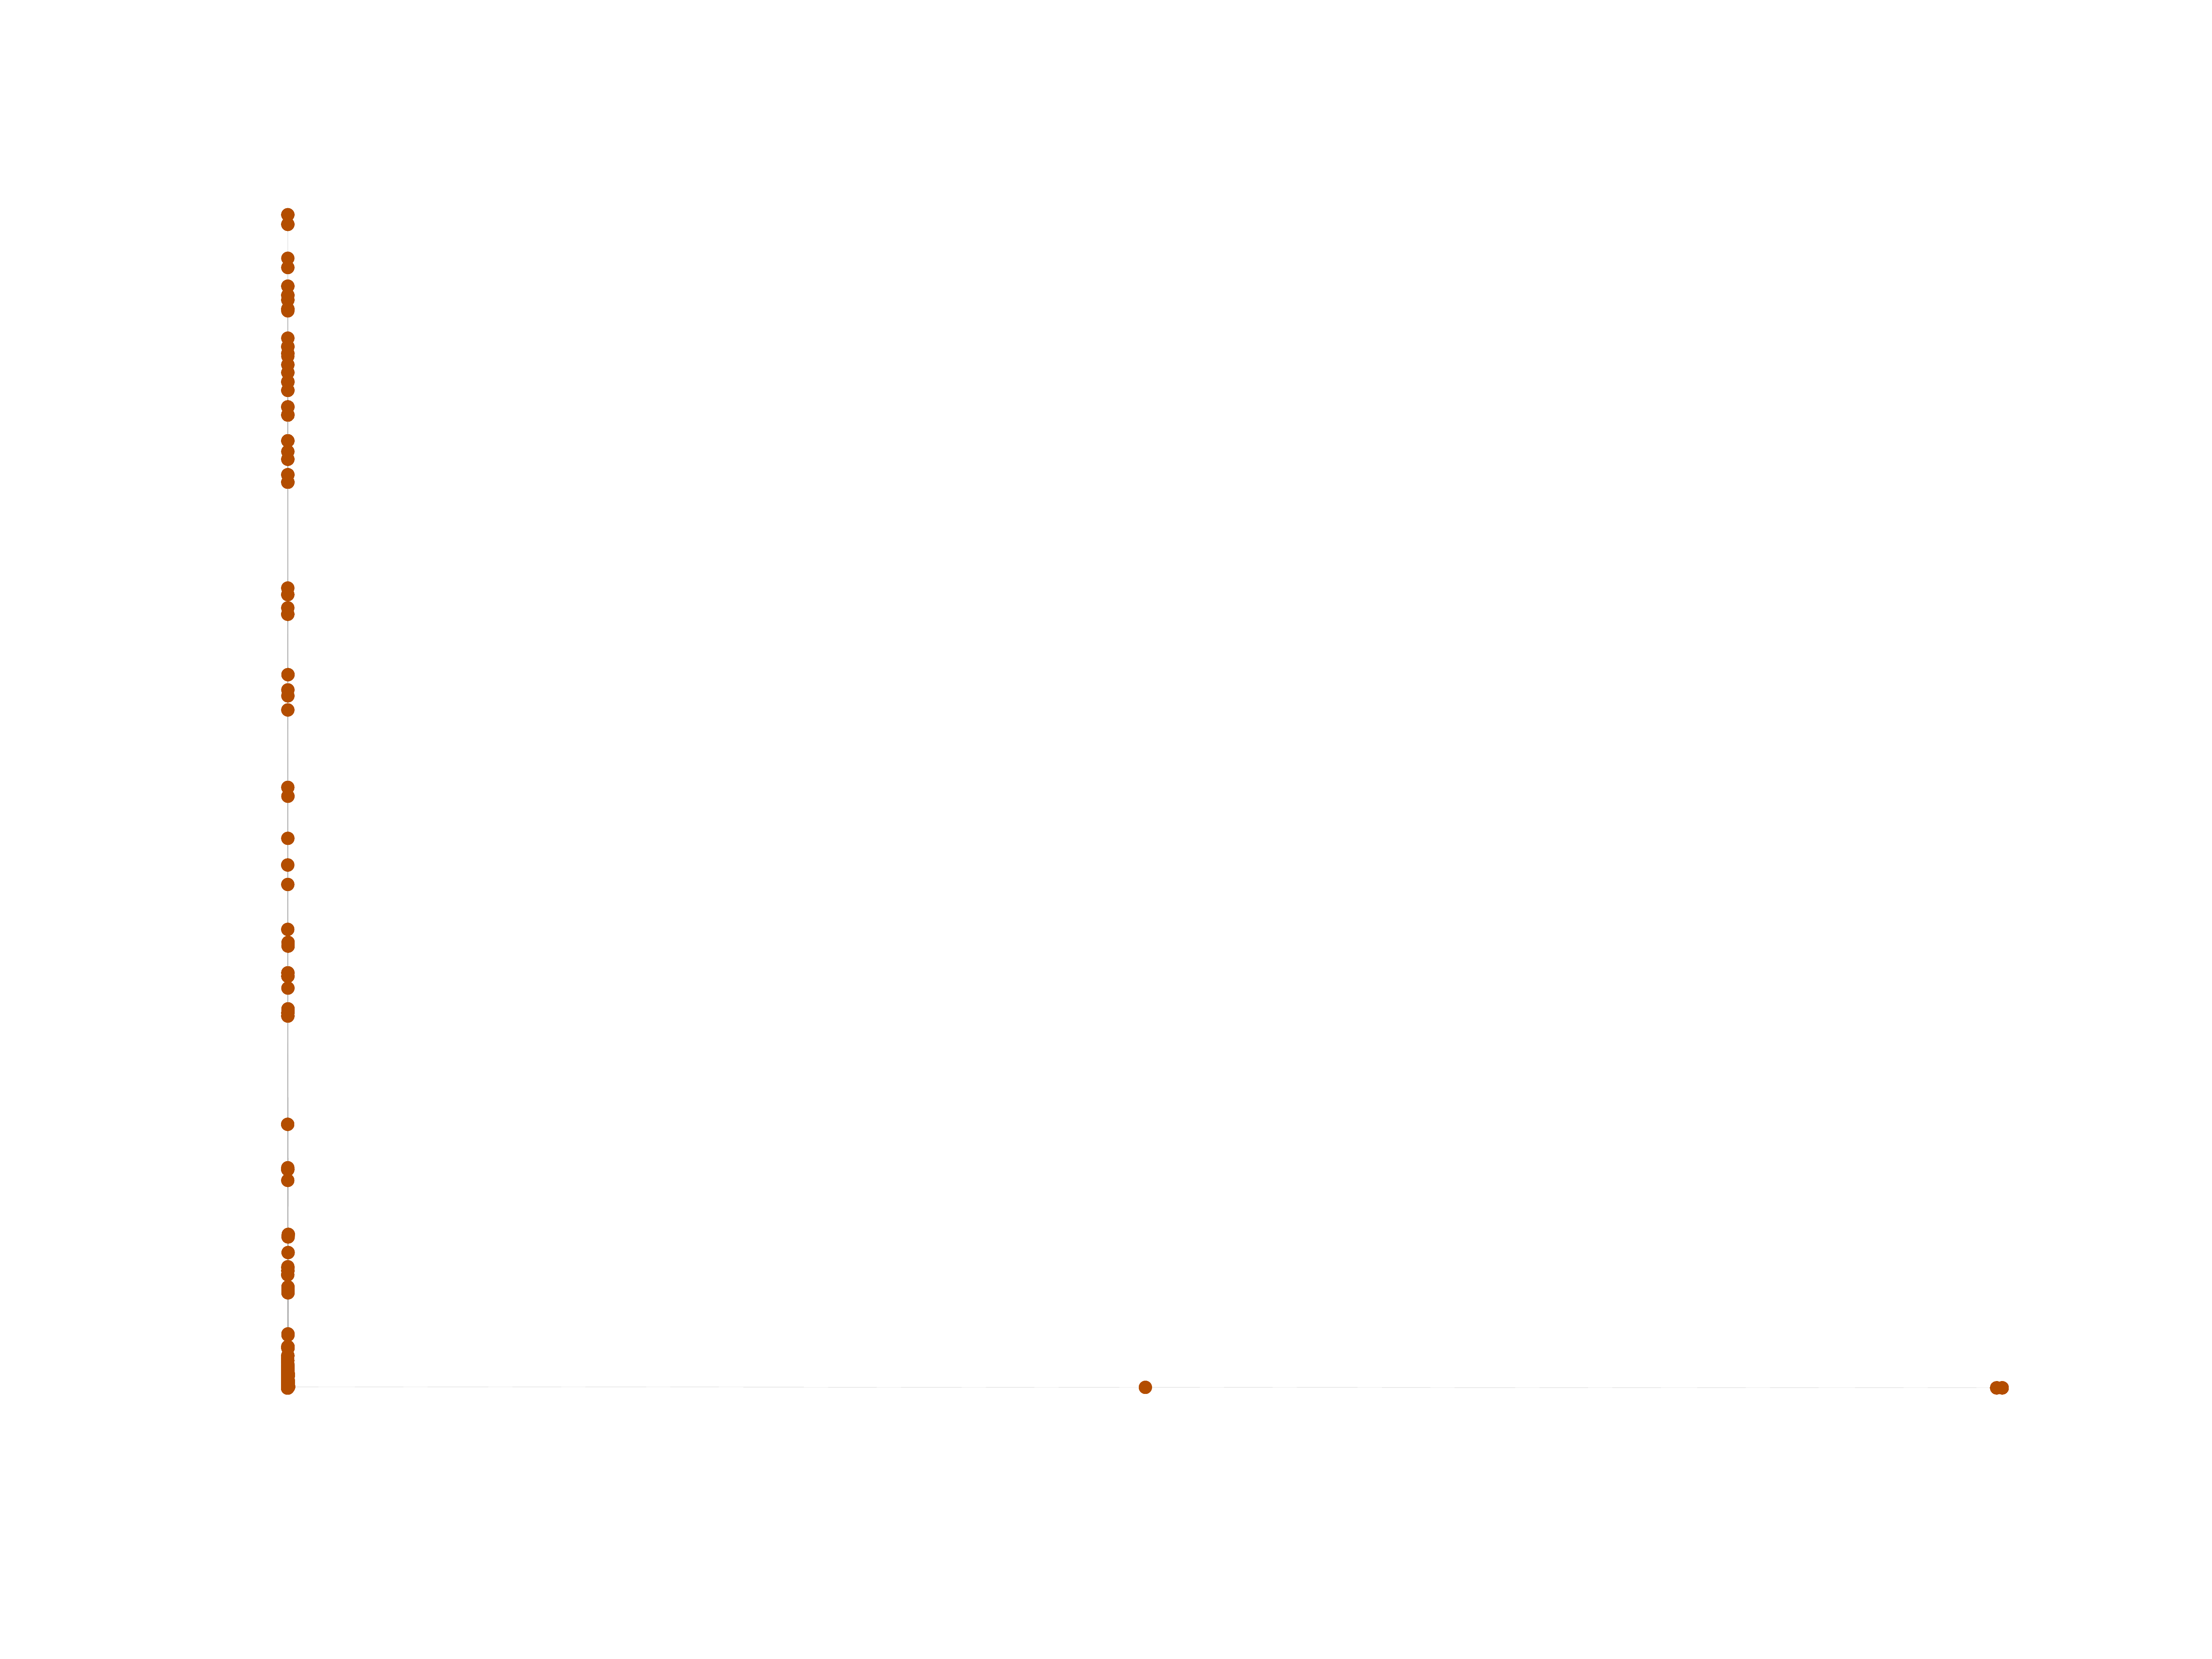
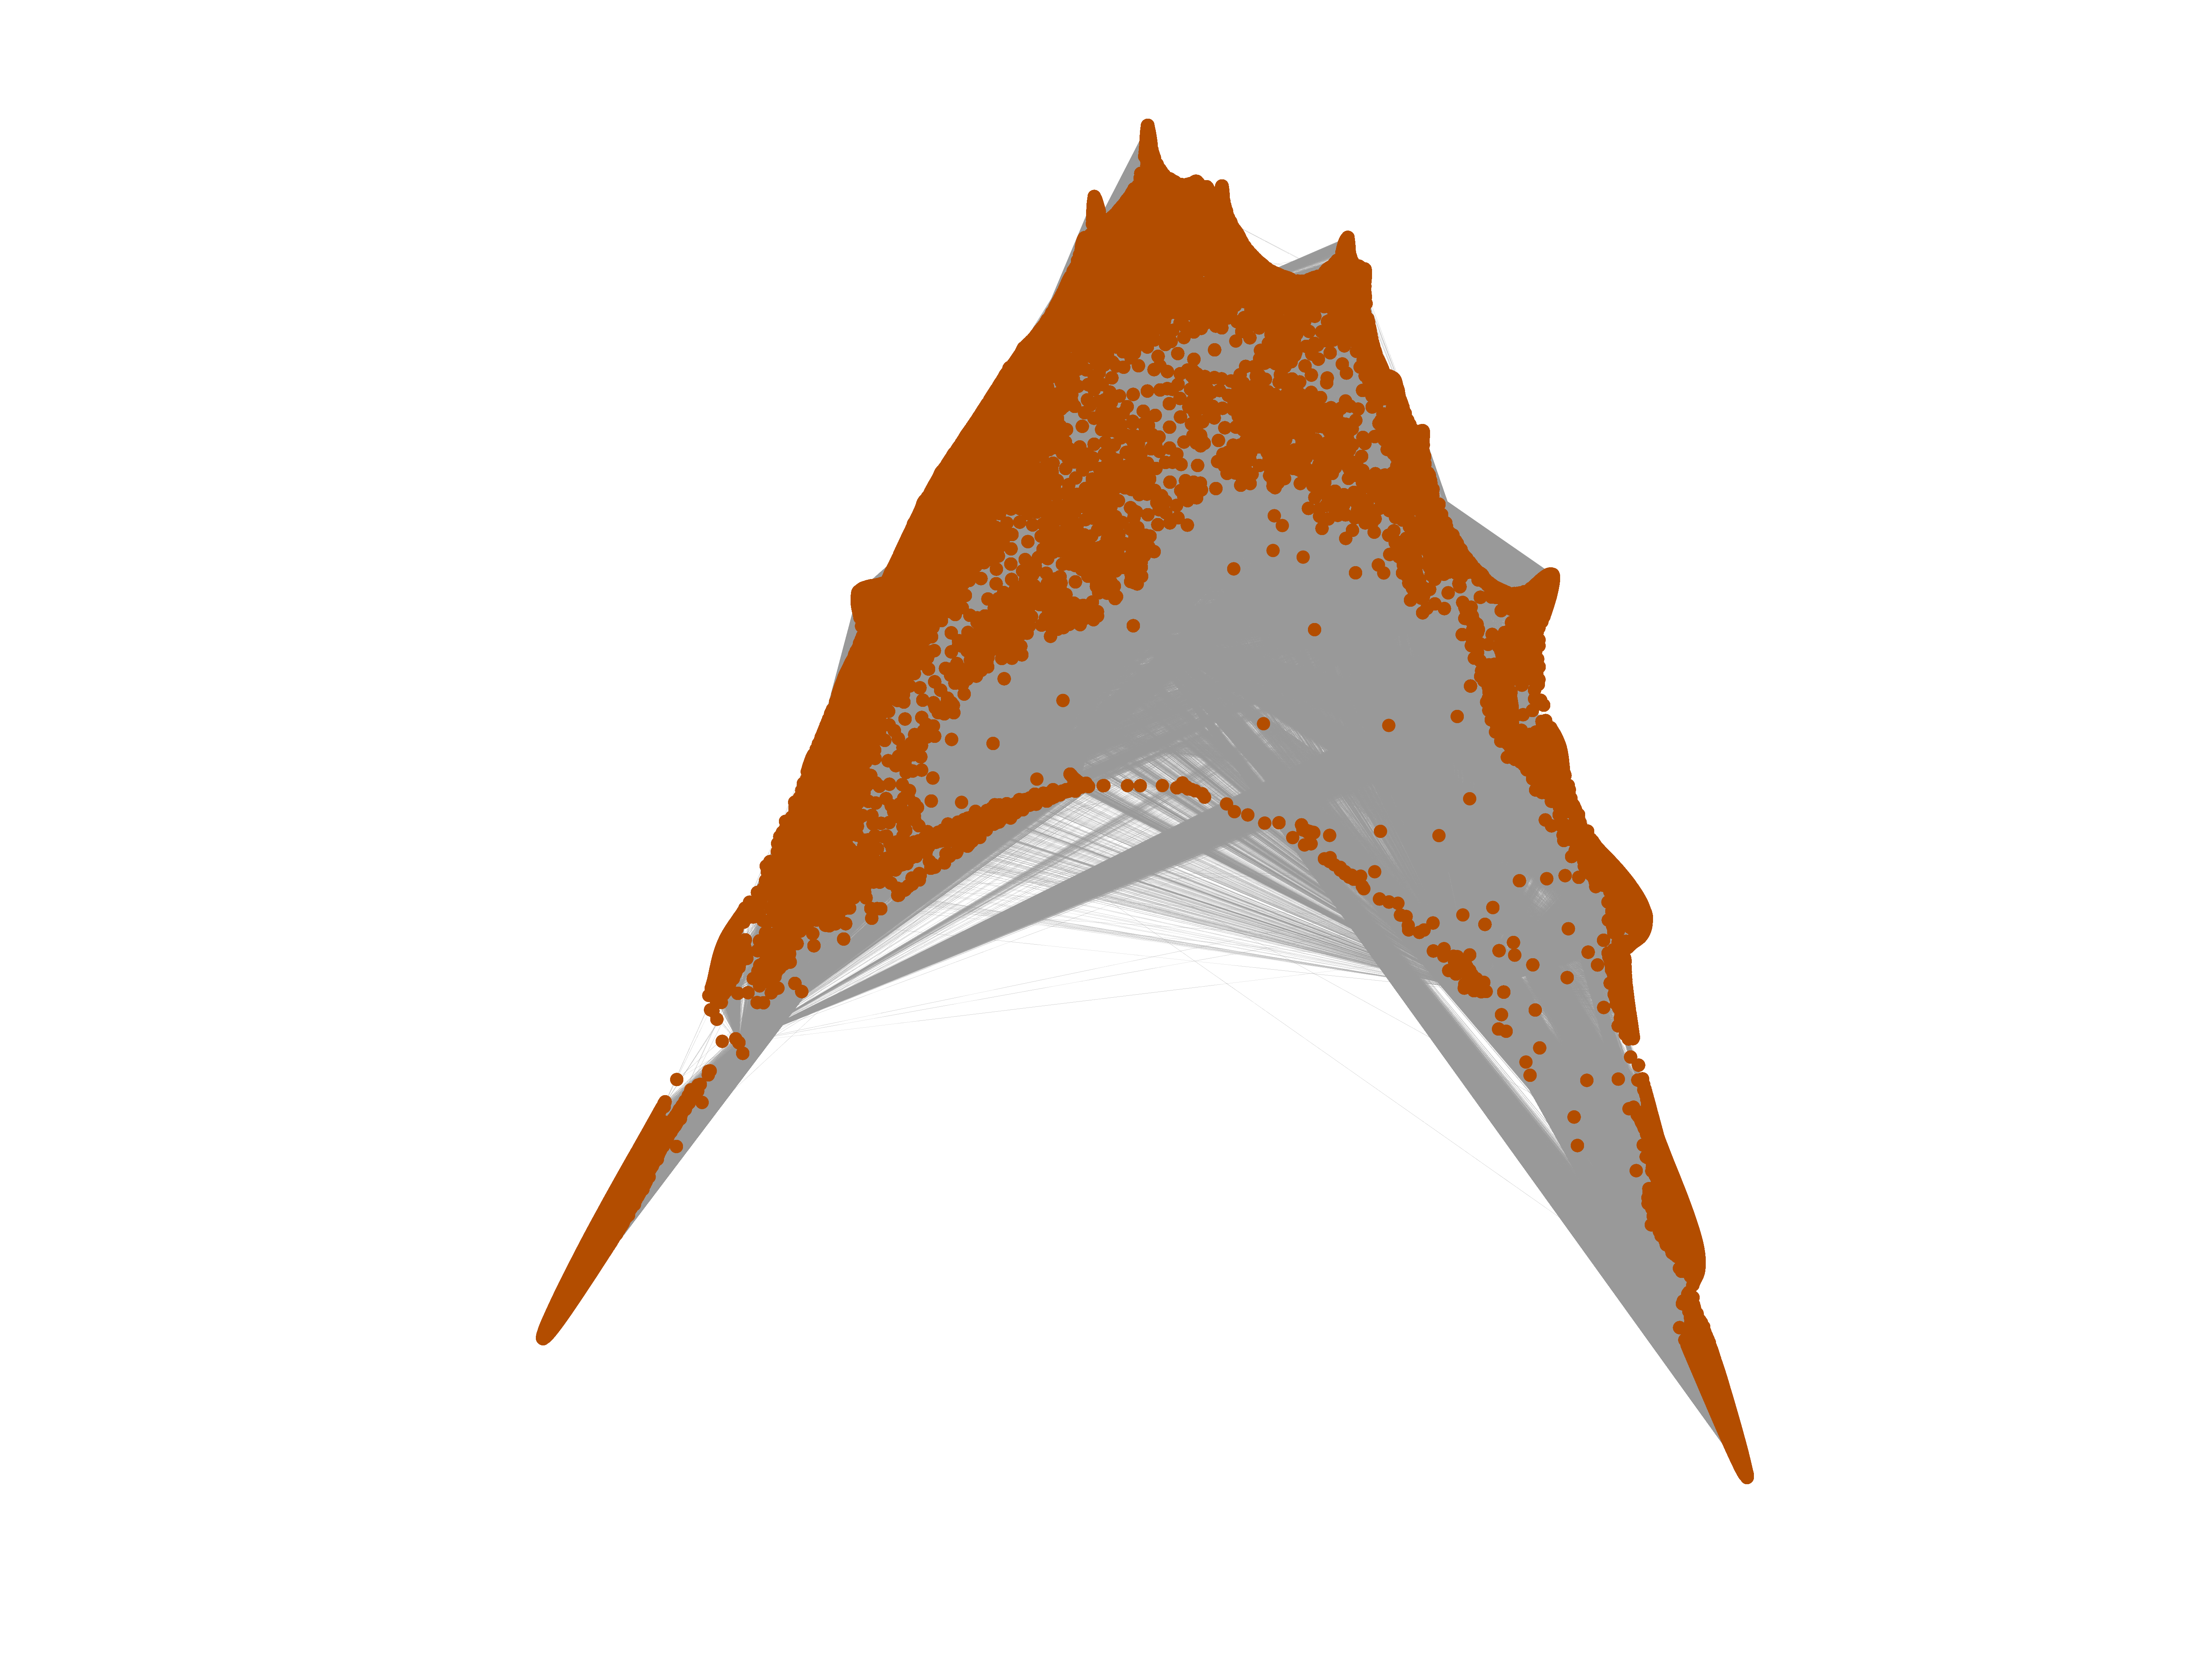
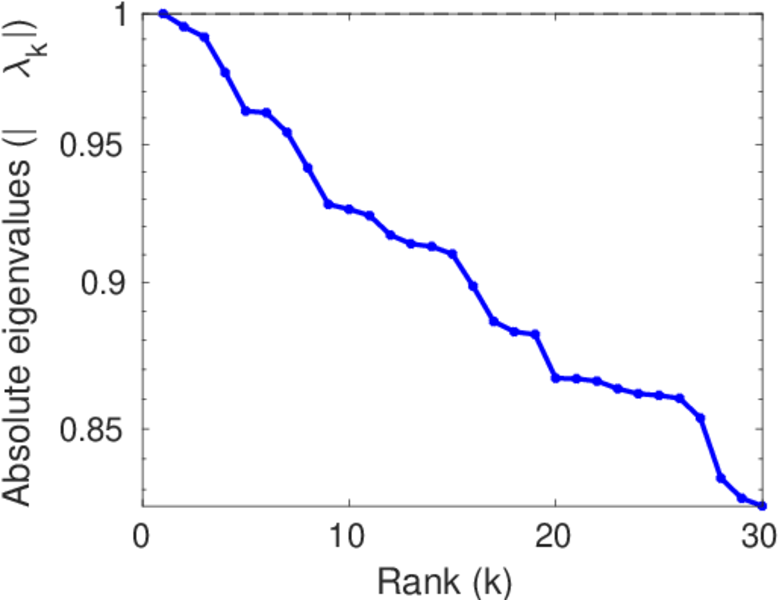
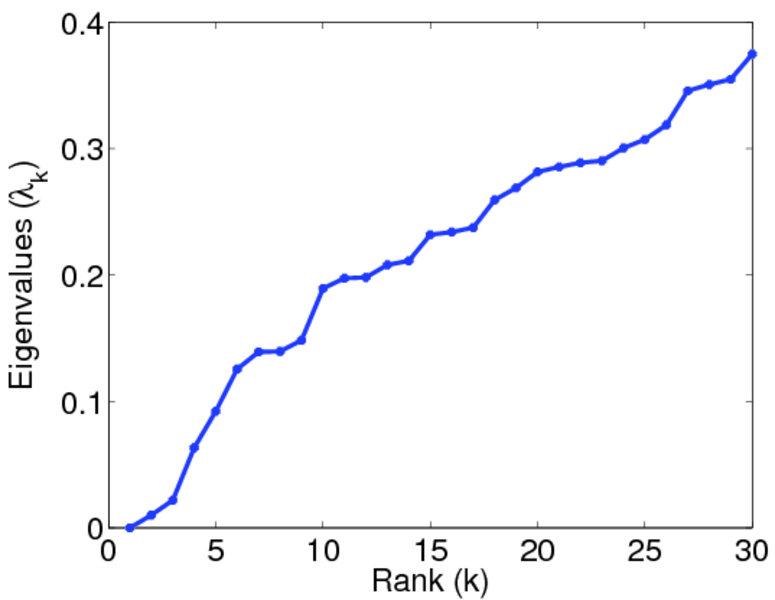
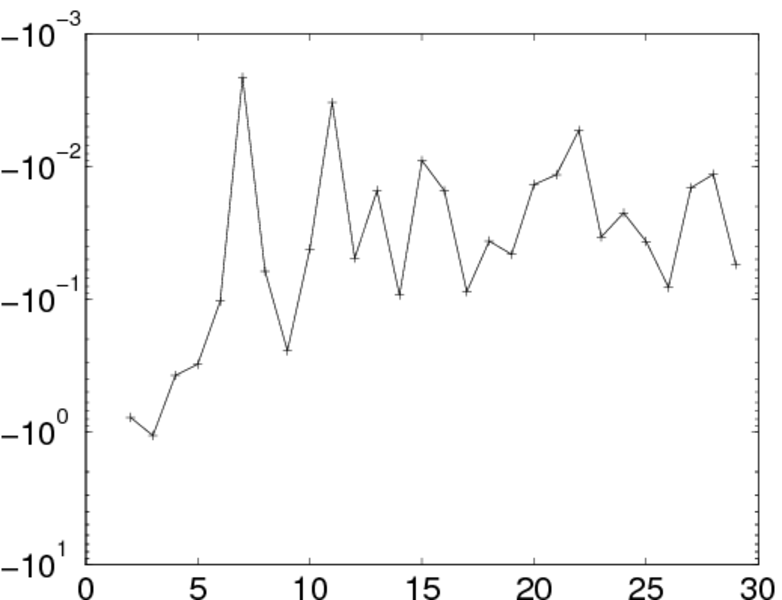
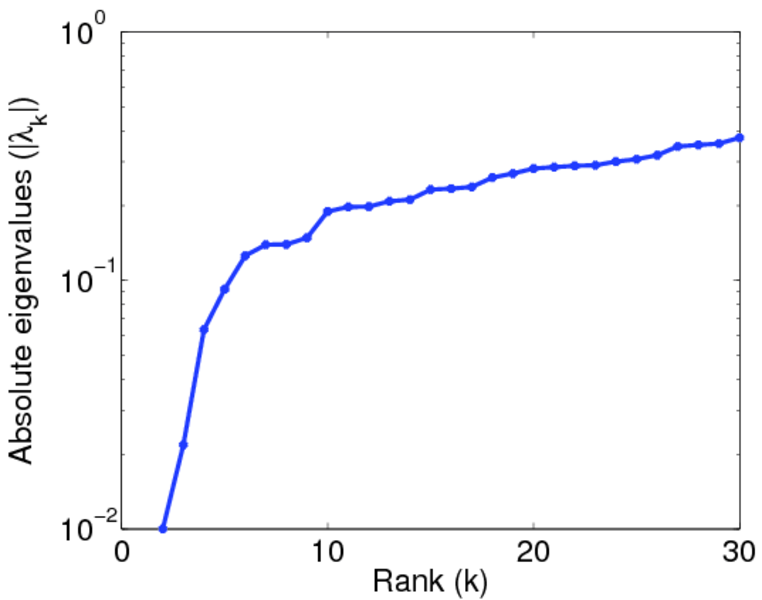
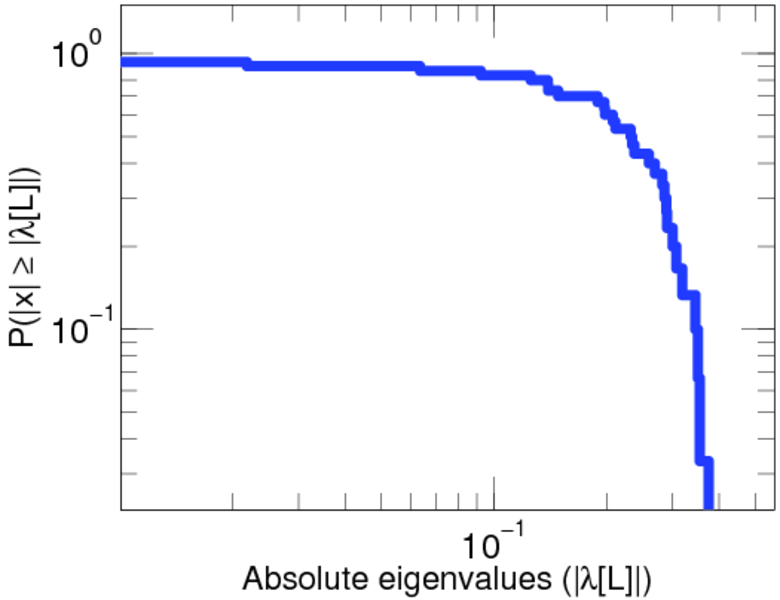
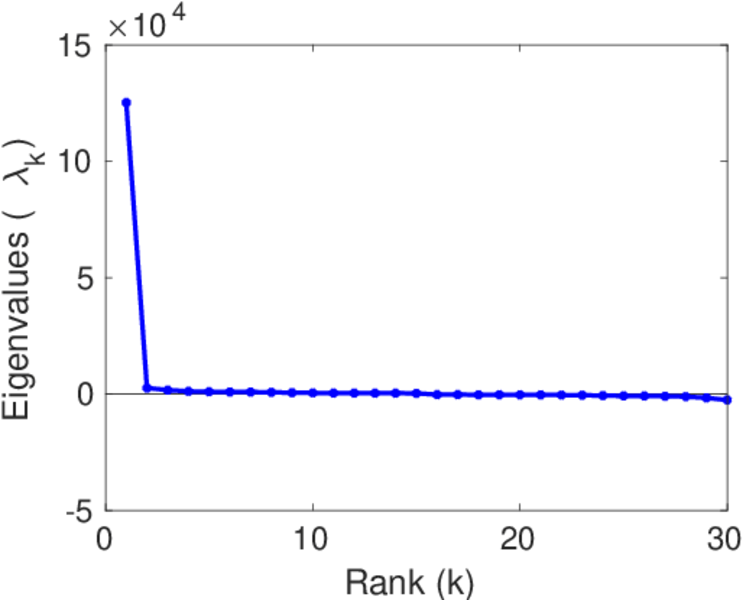
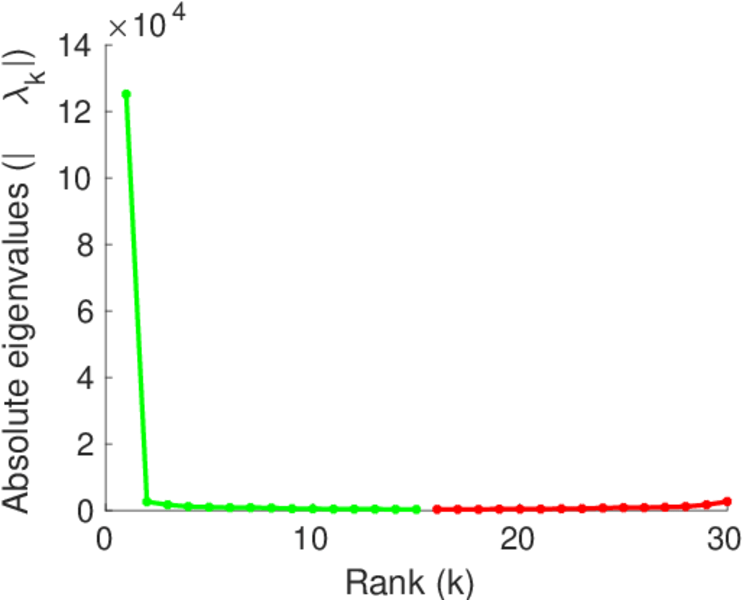
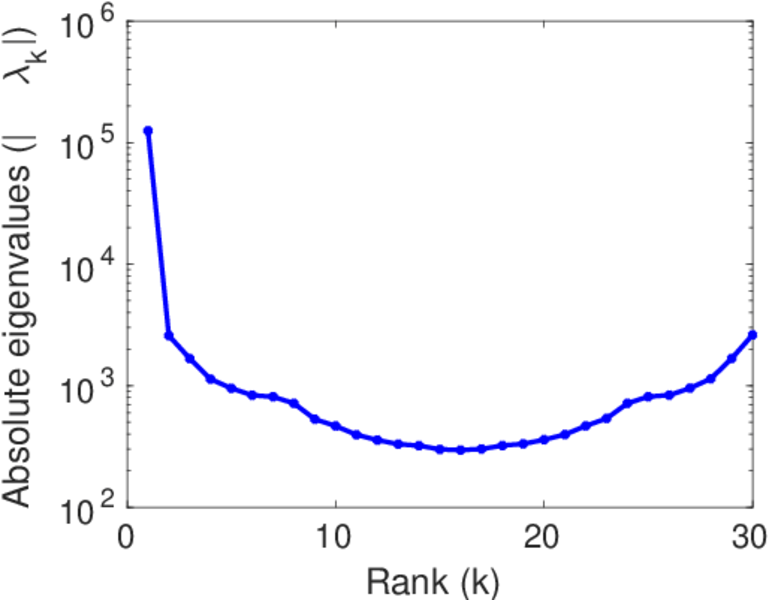
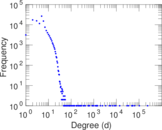
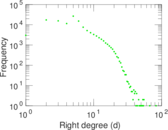
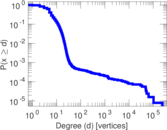
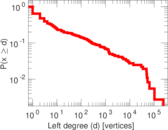
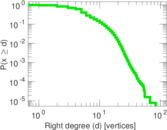
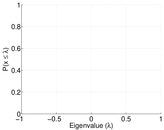
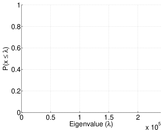
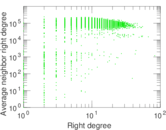
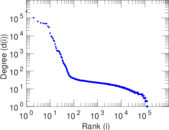
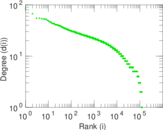
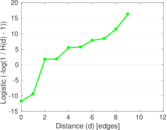
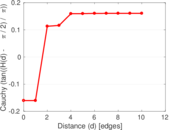
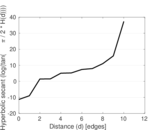
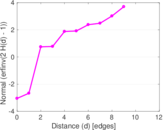
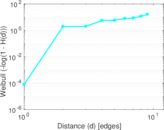
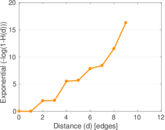
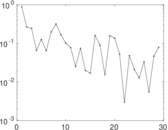
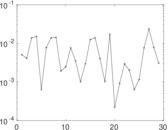
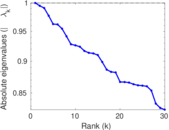
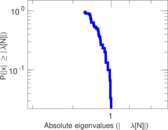
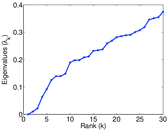
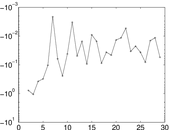
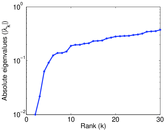
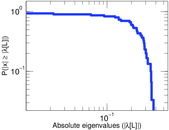
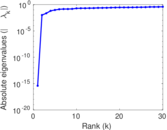
Plots


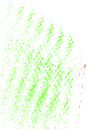
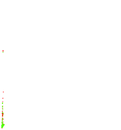


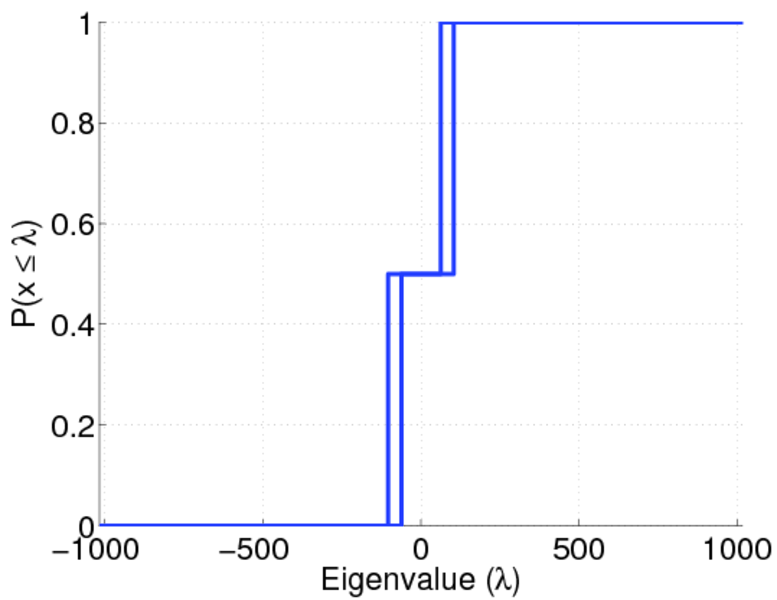
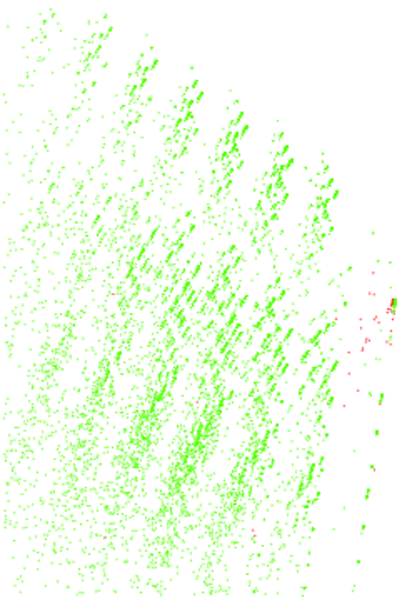
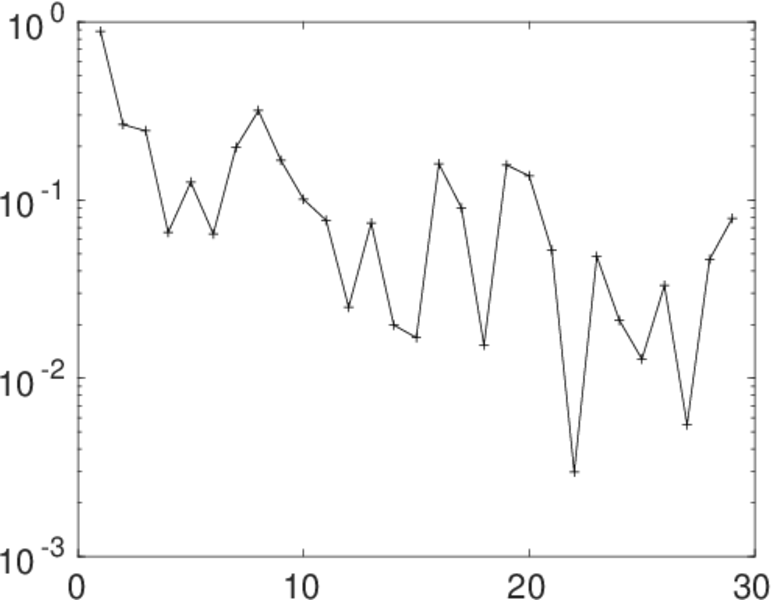
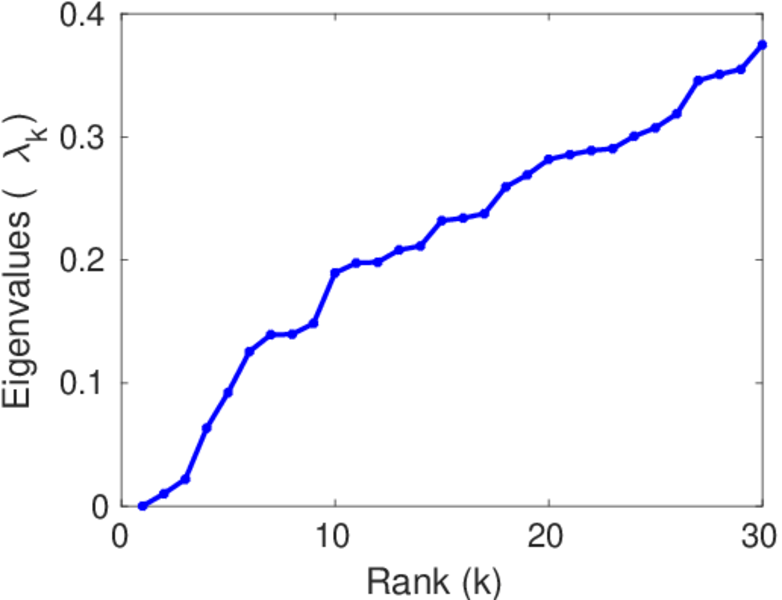
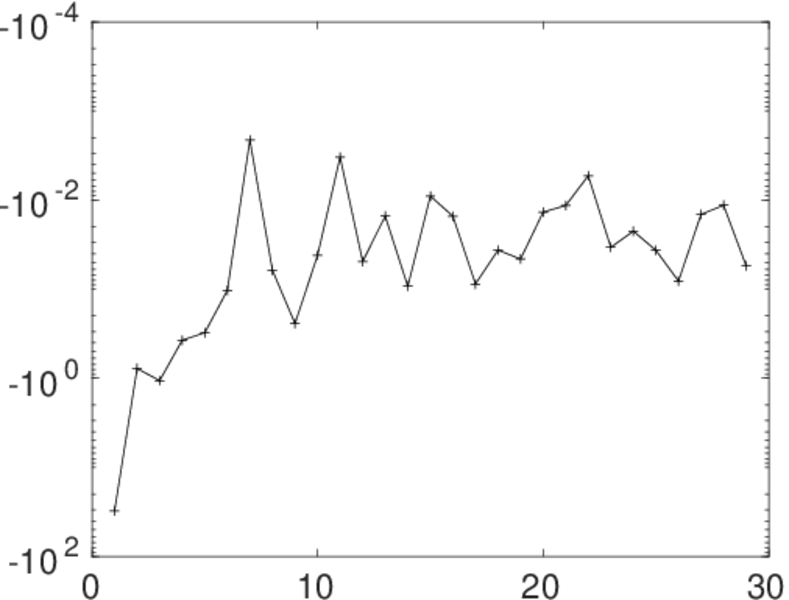
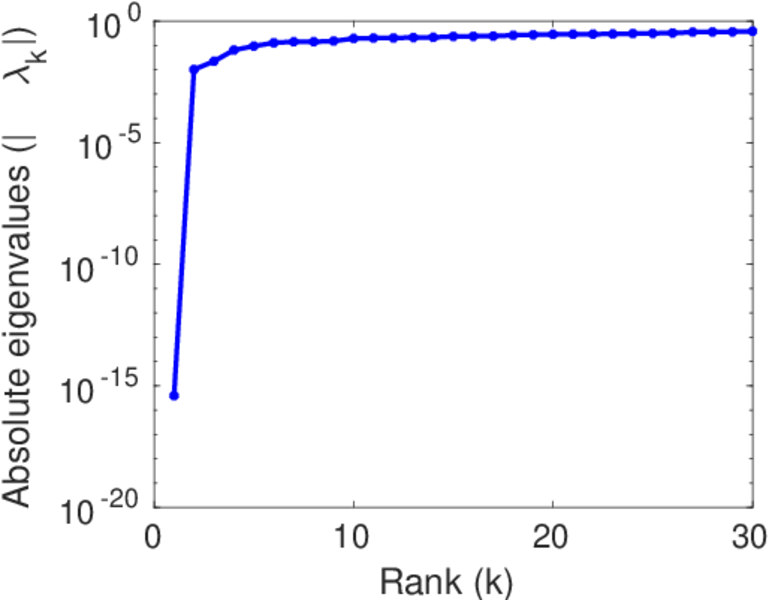
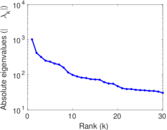
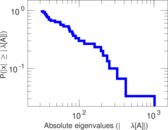
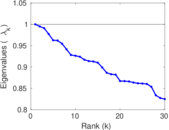
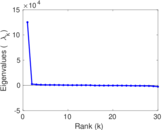
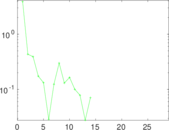
Matrix decompositions plots


Downloads
References
|
[1]
|
Jérôme Kunegis.
KONECT – The Koblenz Network Collection.
In Proc. Int. Conf. on World Wide Web Companion, pages
1343–1350, 2013.
[ http ]
|
|
[2]
|
Wikimedia Foundation.
Wikimedia downloads.
http://dumps.wikimedia.org/, January 2010.
|
 KONECT ‣ Networks ‣
Buy Me a Coffee
KONECT ‣ Networks ‣
Buy Me a Coffee