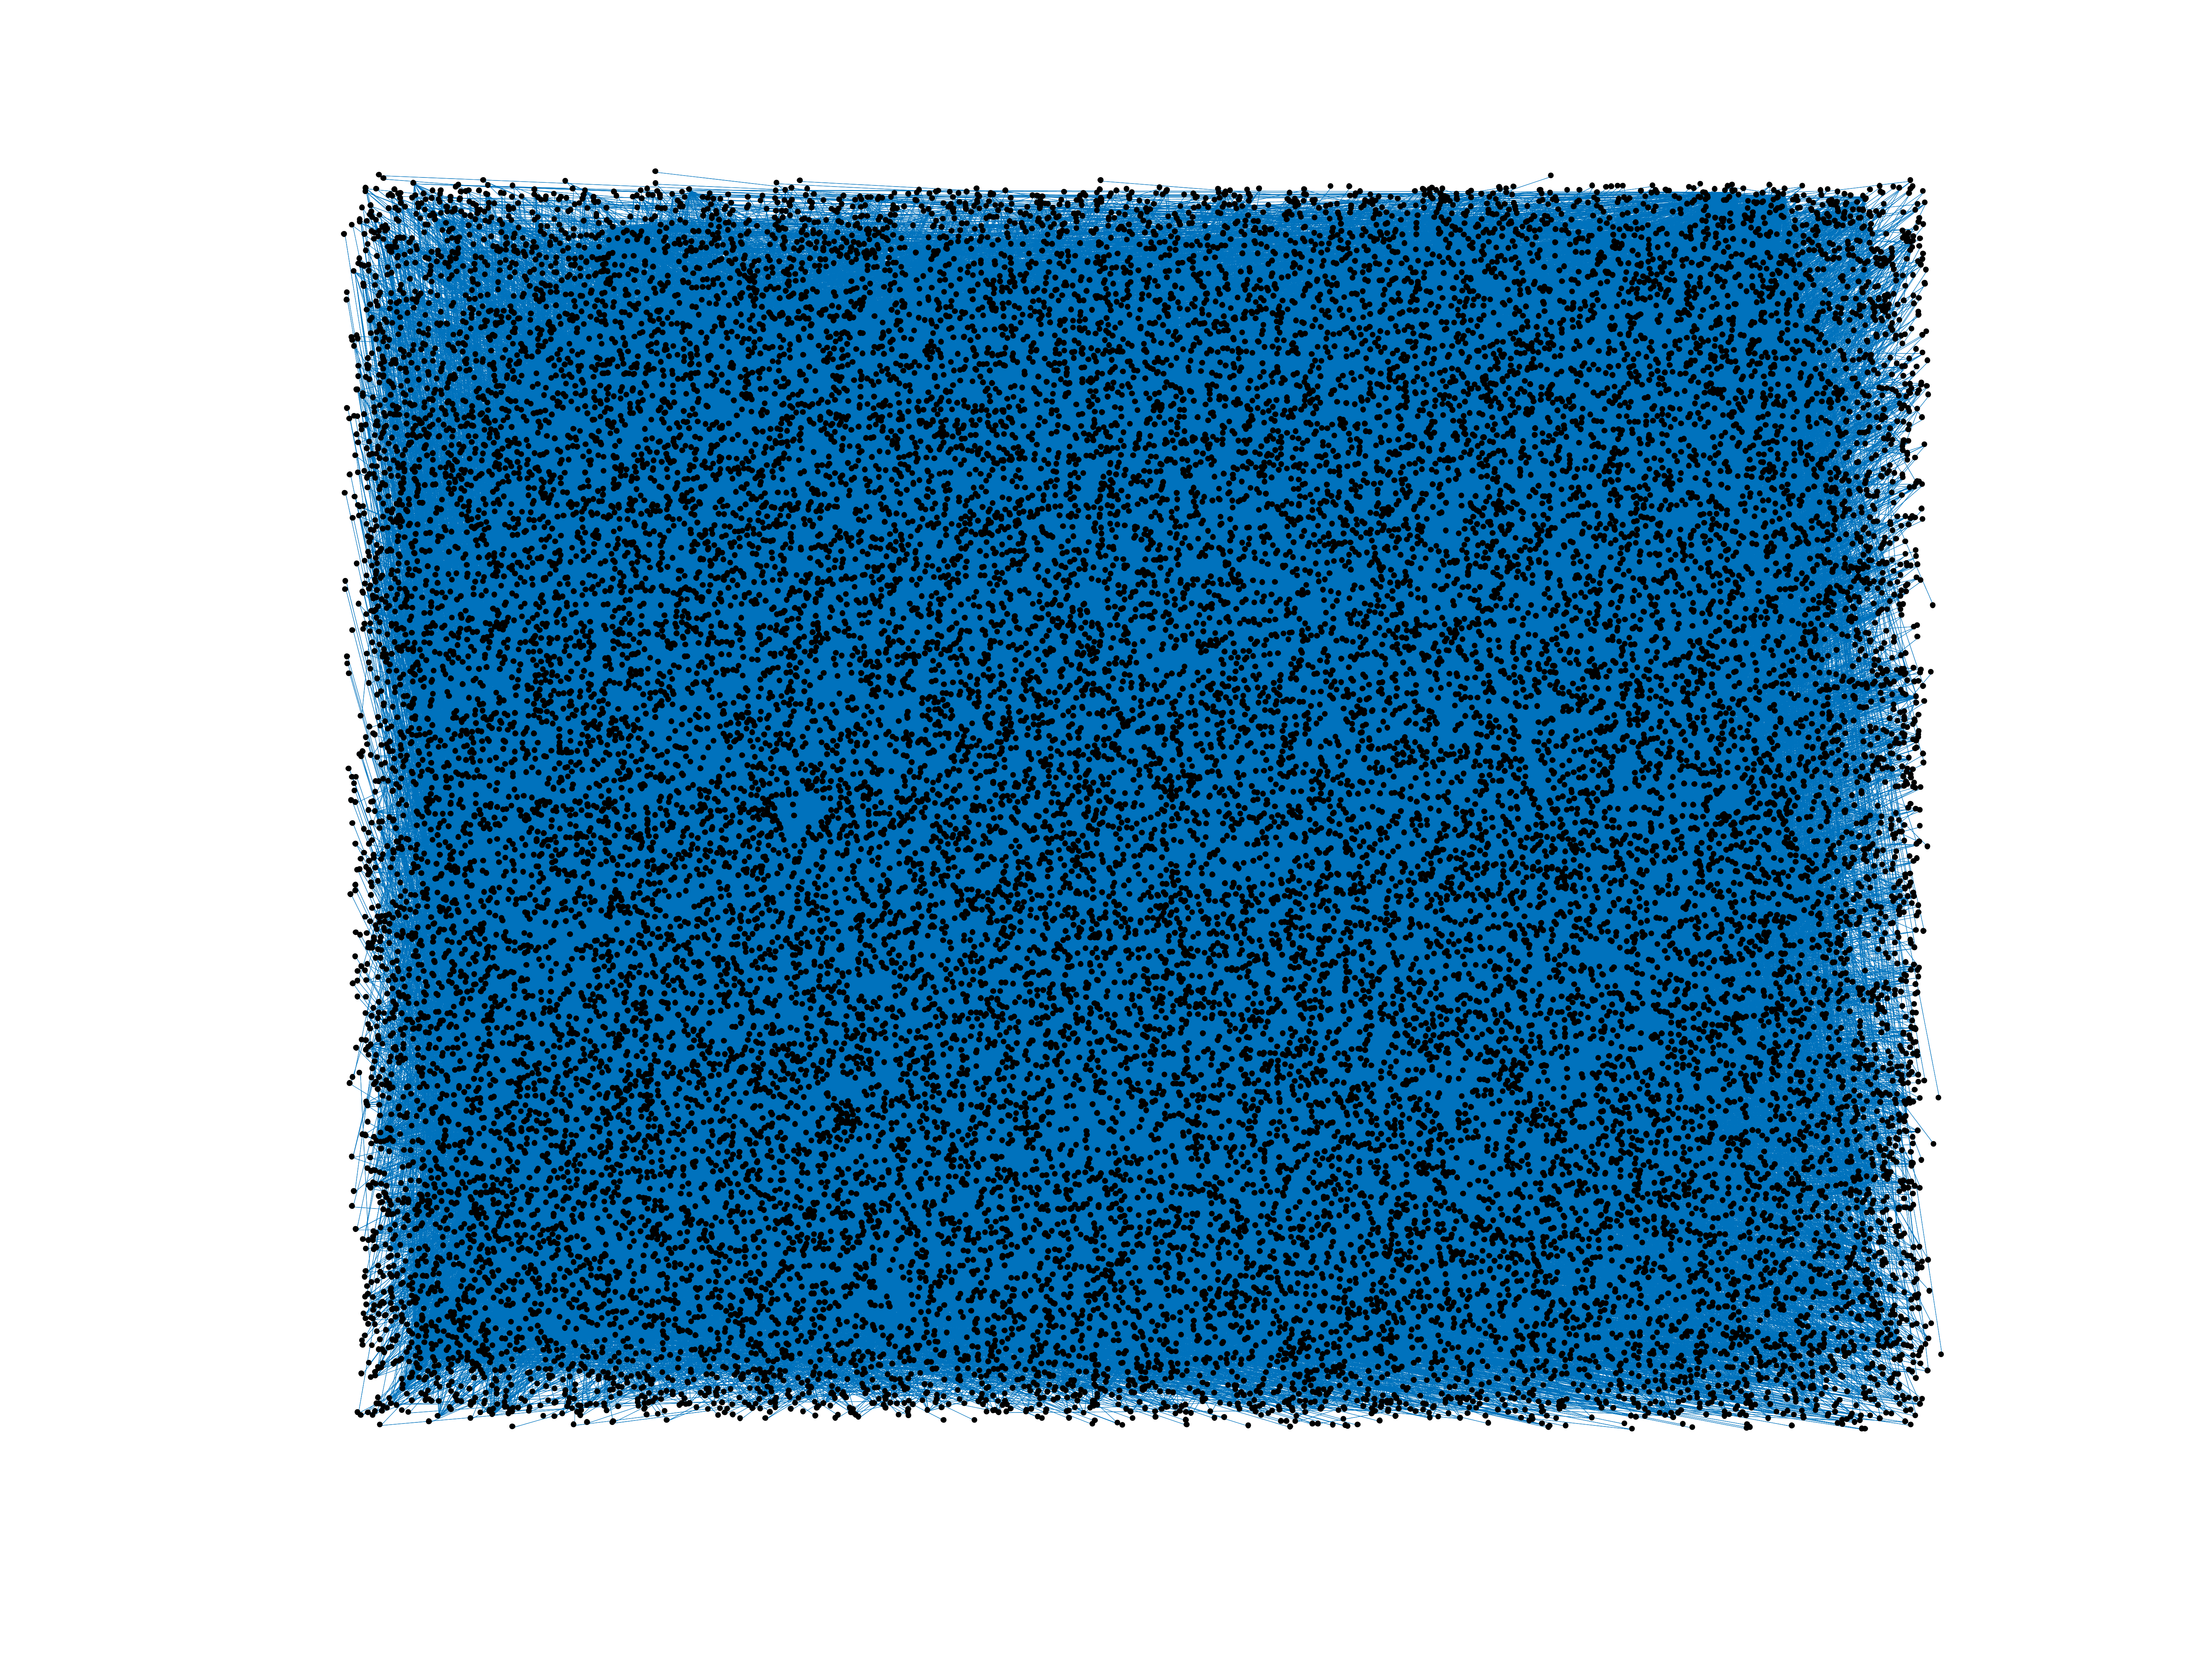
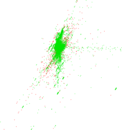
Wikipedia edits (mzn)
This is the bipartite edit network of the Mazanderani Wikipedia. It contains
users and pages from the Mazanderani Wikipedia, connected by edit events. Each
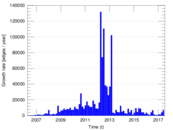
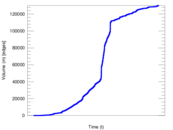
edge represents an edit. The dataset includes the timestamp of each edit.
Metadata
Statistics
| Size | n = | 28,129
|
| Left size | n1 = | 1,111
|
| Right size | n2 = | 27,018
|
| Volume | m = | 130,249
|
| Unique edge count | m̿ = | 79,542
|
| Wedge count | s = | 178,357,843
|
| Claw count | z = | 483,830,140,606
|
| Cross count | x = | 1,143,010,098,967,327
|
| Square count | q = | 76,263,065
|
| 4-Tour count | T4 = | 1,323,729,004
|
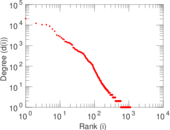
| Maximum degree | dmax = | 20,914
|
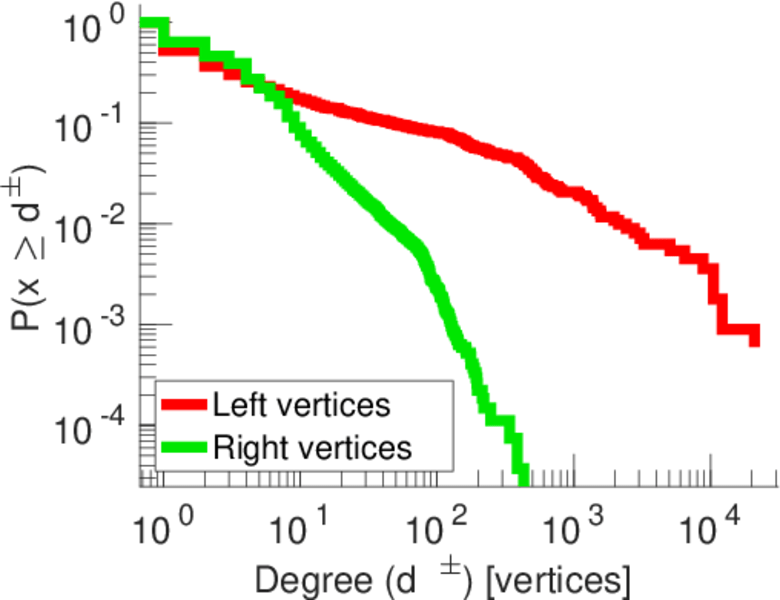
| Maximum left degree | d1max = | 20,914
|
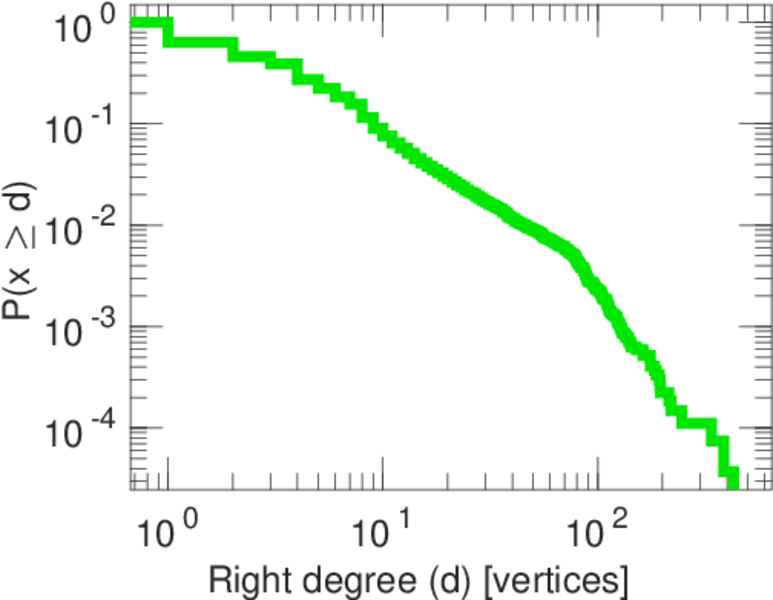
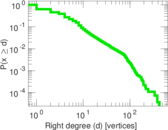
| Maximum right degree | d2max = | 429
|
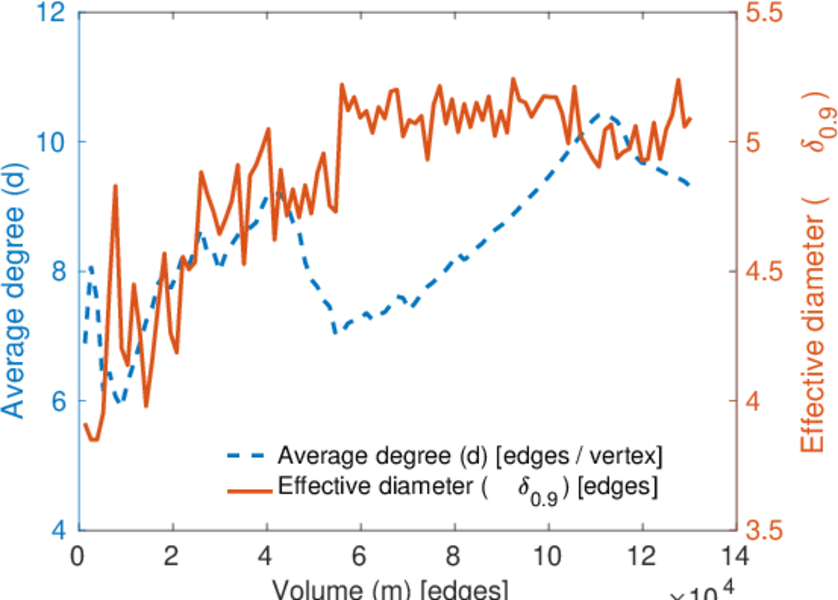
| Average degree | d = | 9.260 83
|
| Average left degree | d1 = | 117.236
|
| Average right degree | d2 = | 4.820 82
|
| Fill | p = | 0.002 649 90
|
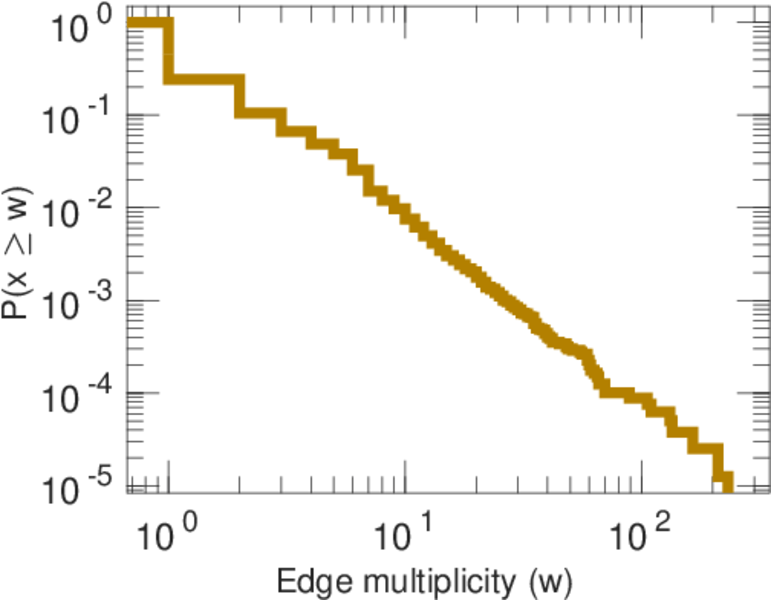
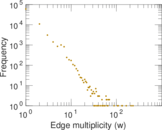
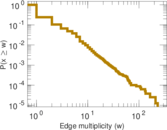
| Average edge multiplicity | m̃ = | 1.637 49
|
| Size of LCC | N = | 27,442
|
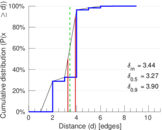
| Diameter | δ = | 12
|
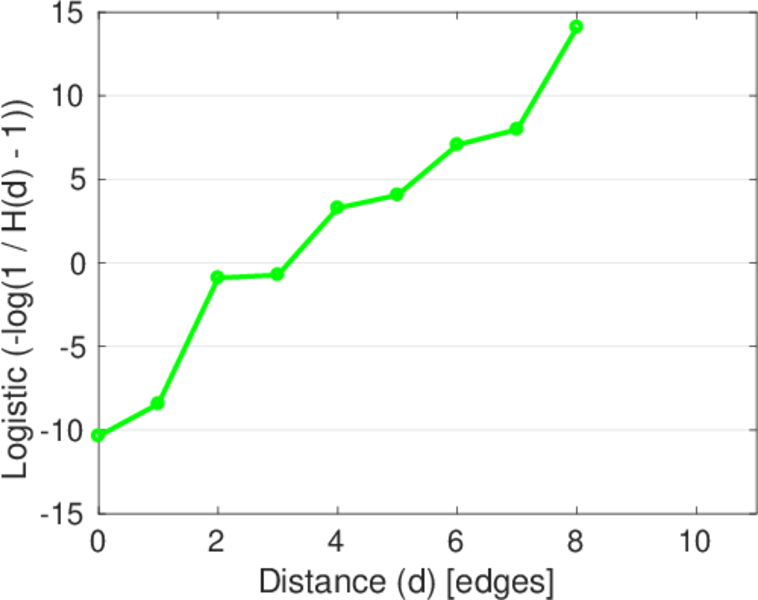
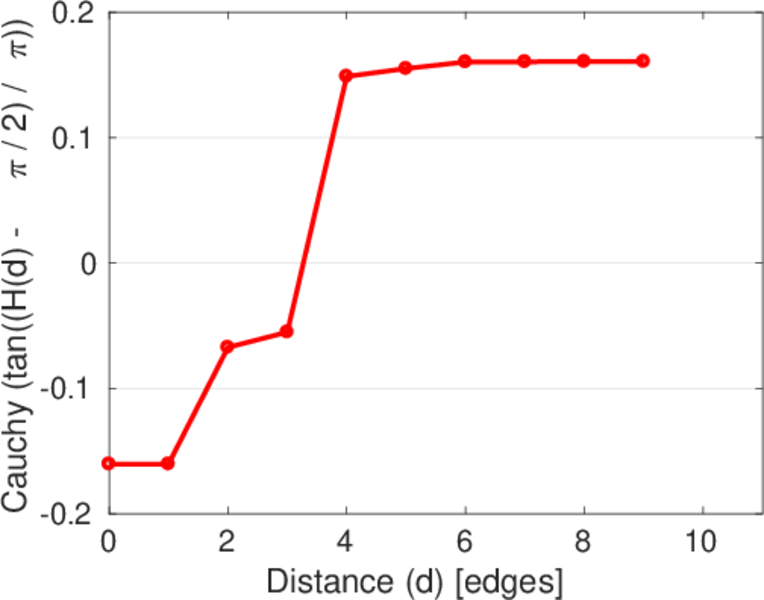
| 50-Percentile effective diameter | δ0.5 = | 3.272 19
|
| 90-Percentile effective diameter | δ0.9 = | 3.899 94
|
| Median distance | δM = | 4
|
| Mean distance | δm = | 3.439 14
|
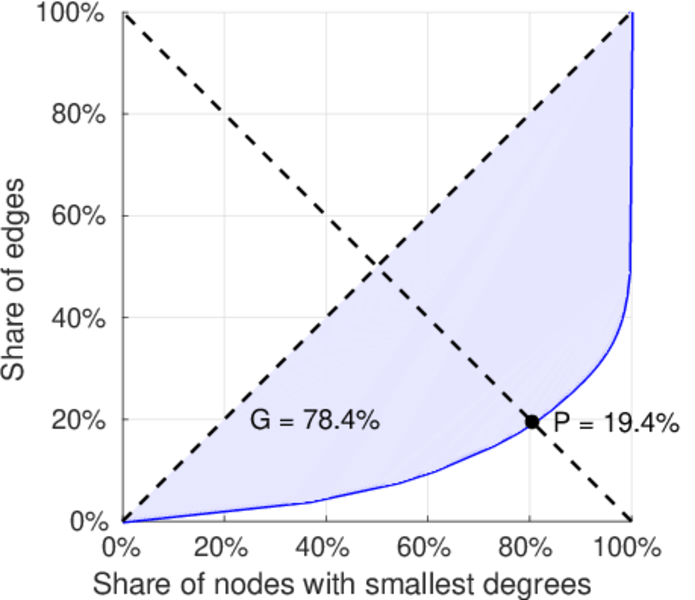
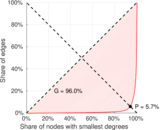
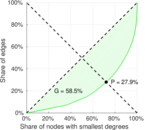
| Gini coefficient | G = | 0.785 820
|
| Balanced inequality ratio | P = | 0.192 385
|
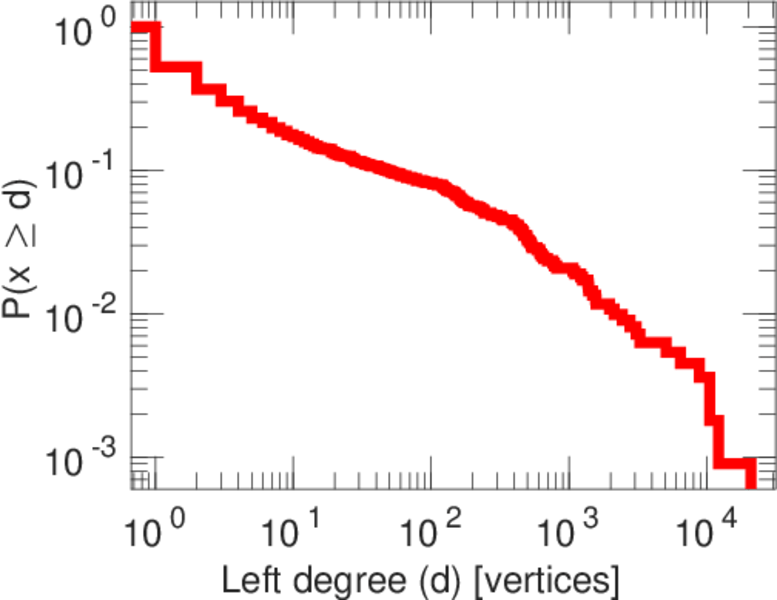
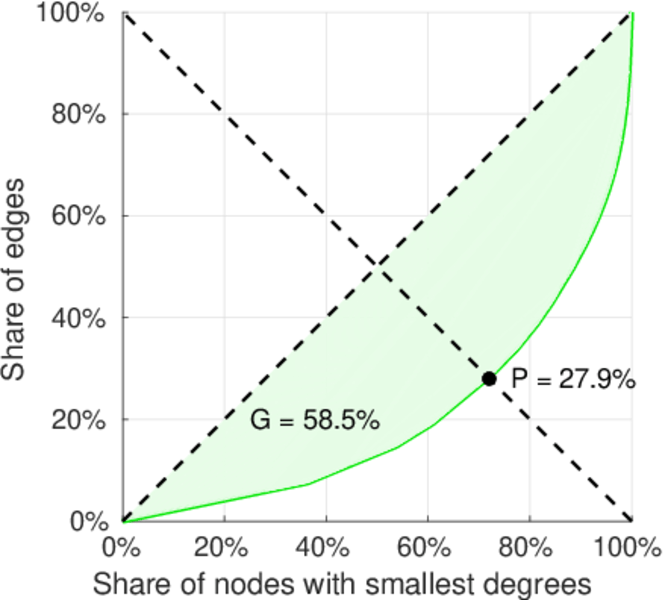
| Left balanced inequality ratio | P1 = | 0.056 553 2
|
| Right balanced inequality ratio | P2 = | 0.278 505
|
| Relative edge distribution entropy | Her = | 0.727 700
|
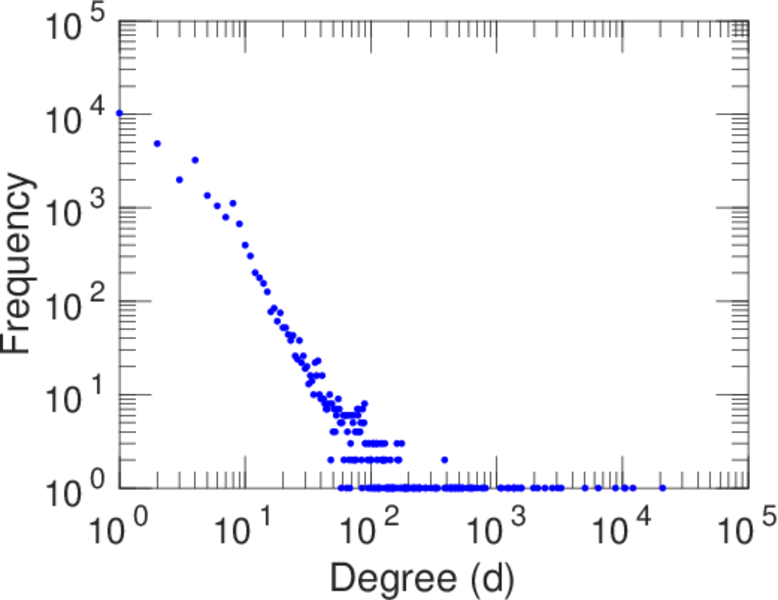
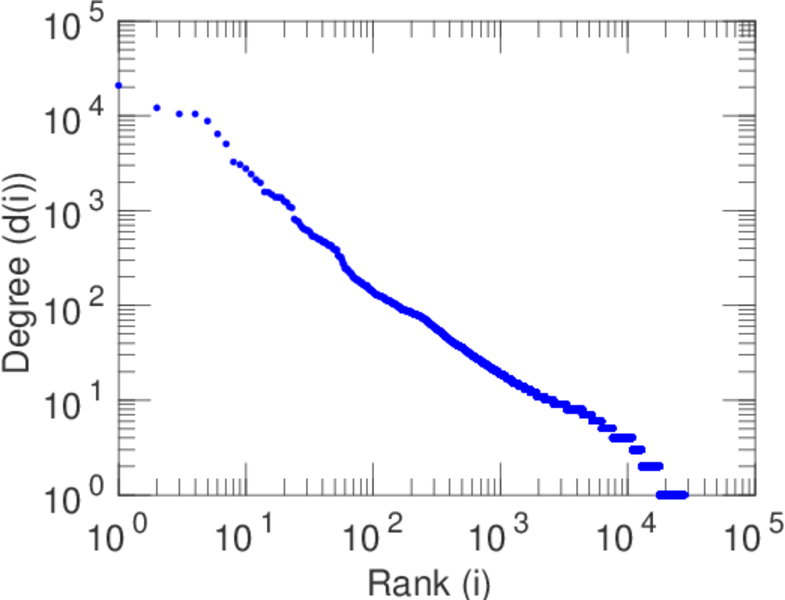
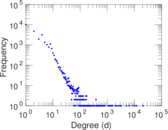
| Power law exponent | γ = | 2.355 20
|
| Tail power law exponent | γt = | 2.211 00
|
| Tail power law exponent with p | γ3 = | 2.211 00
|
| p-value | p = | 0.000 00
|
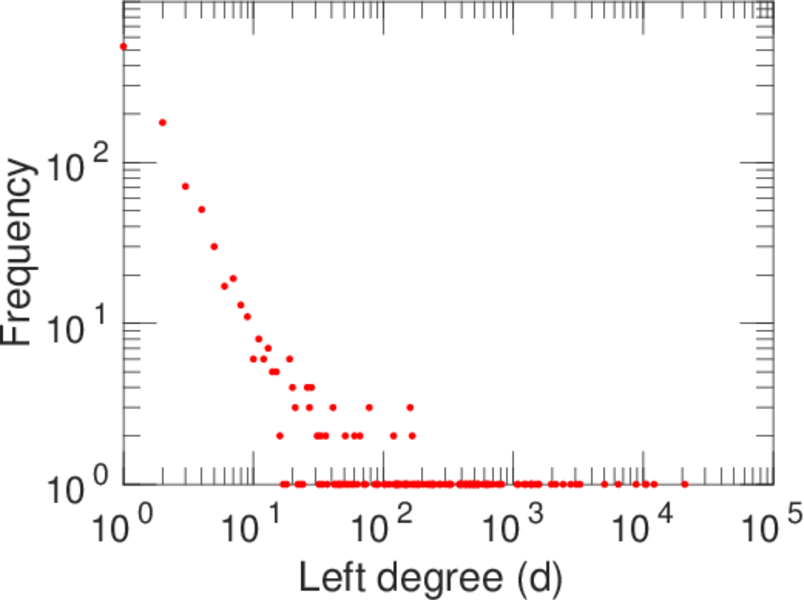
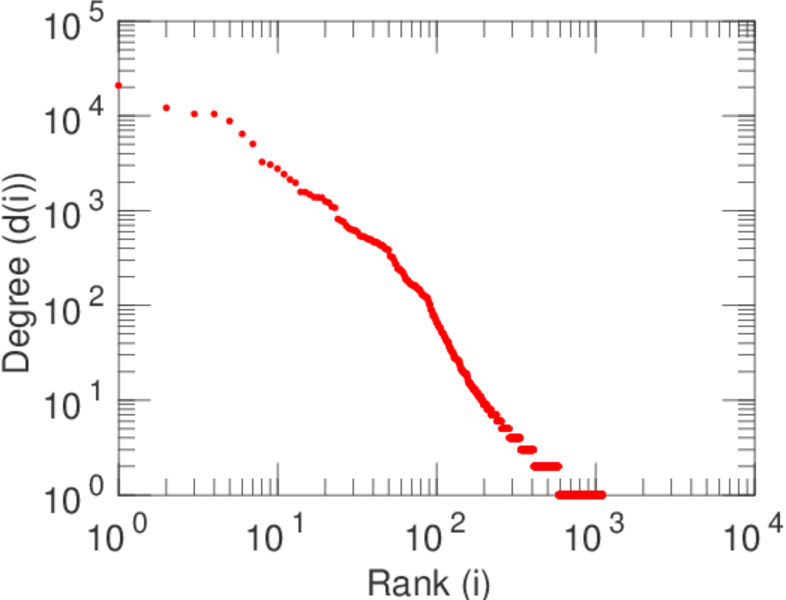
| Left tail power law exponent with p | γ3,1 = | 1.471 00
|
| Left p-value | p1 = | 0.000 00
|
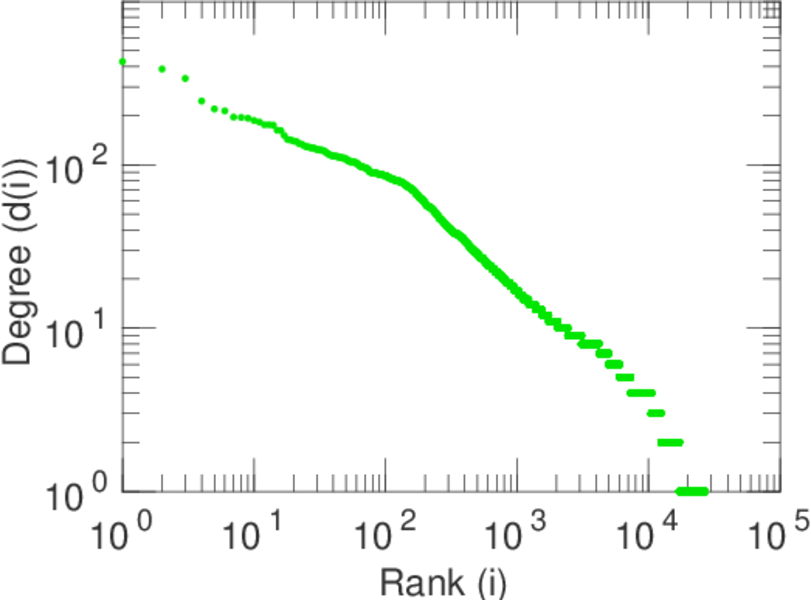
| Right tail power law exponent with p | γ3,2 = | 3.171 00
|
| Right p-value | p2 = | 0.000 00
|
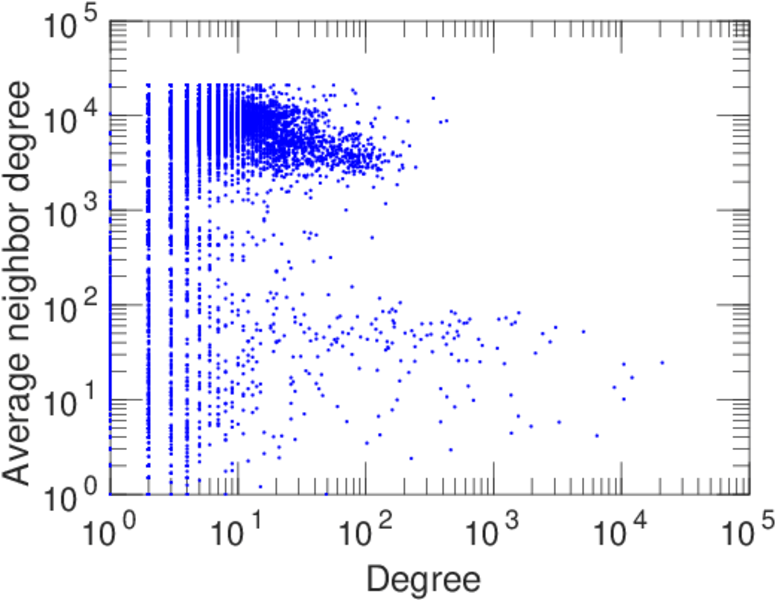
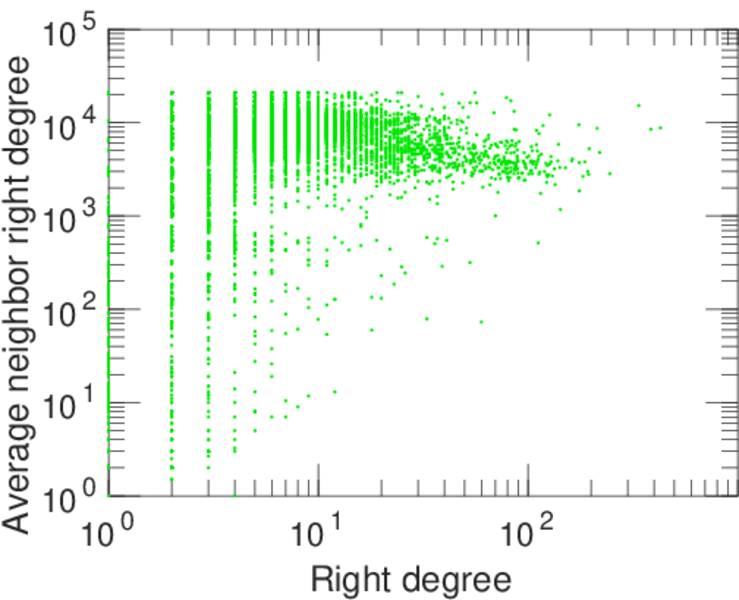
| Degree assortativity | ρ = | −0.325 909
|
| Degree assortativity p-value | pρ = | 0.000 00
|
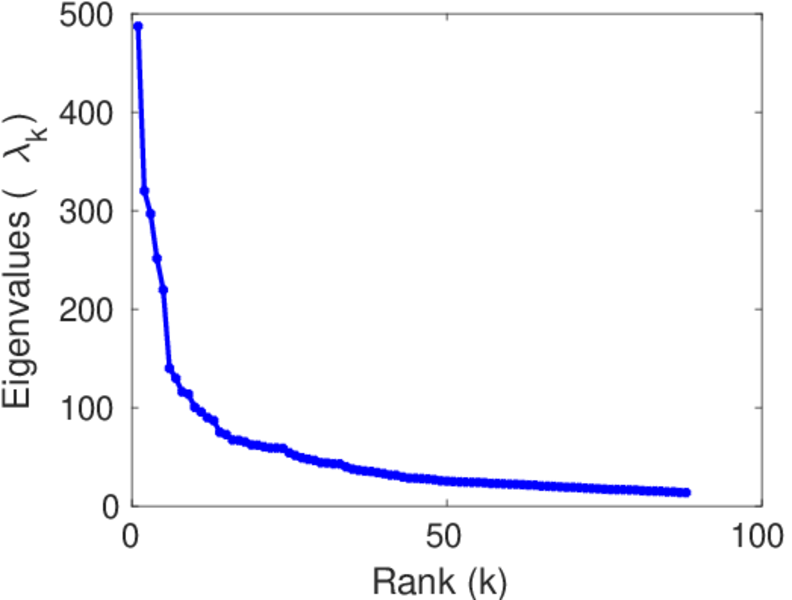
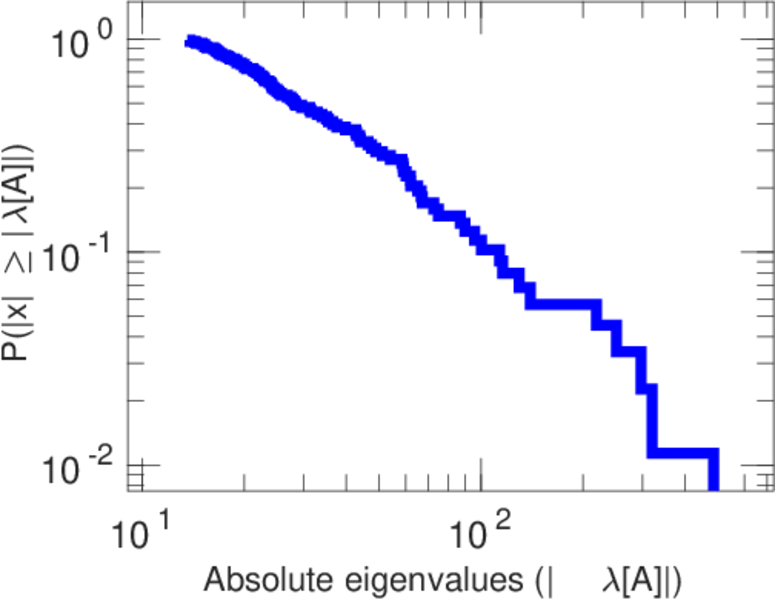
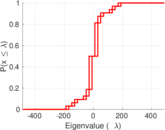
| Spectral norm | α = | 487.169
|
| Algebraic connectivity | a = | 0.067 673 8
|
| Spectral separation | |λ1[A] / λ2[A]| = | 1.521 86
|
| Controllability | C = | 25,930
|
| Relative controllability | Cr = | 0.926 005
|
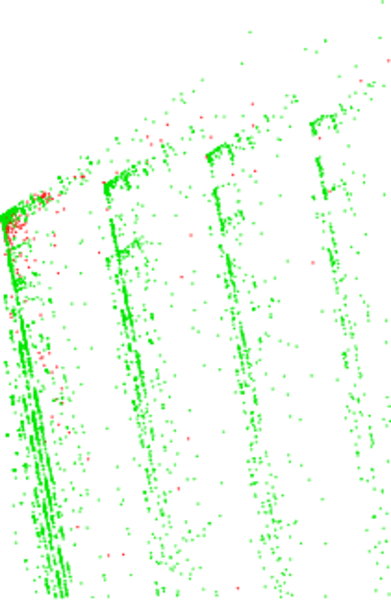
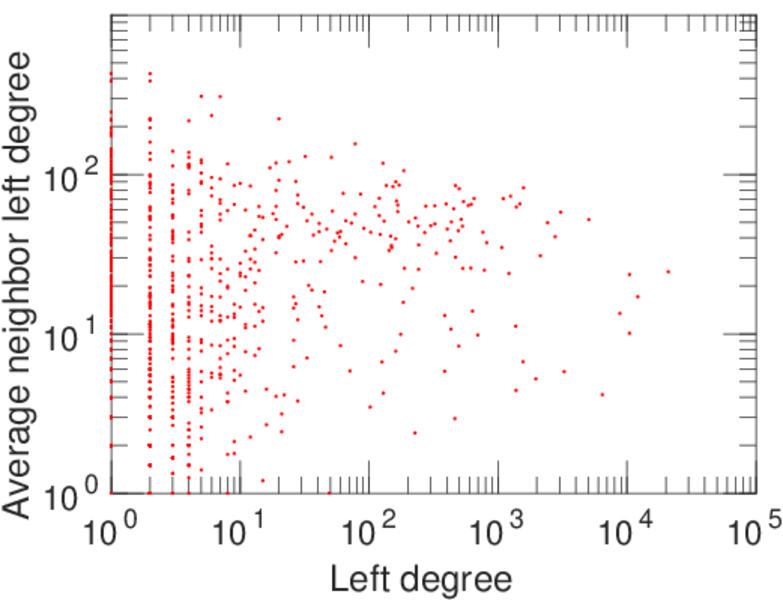
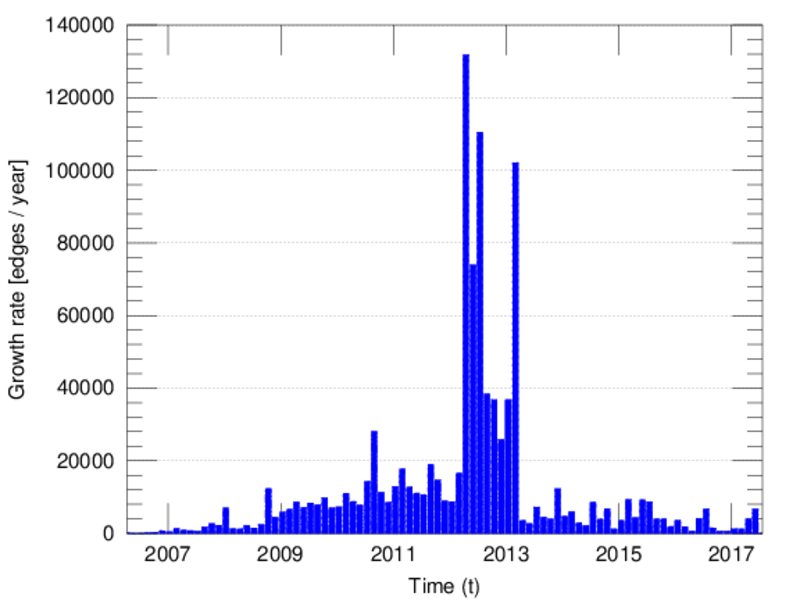
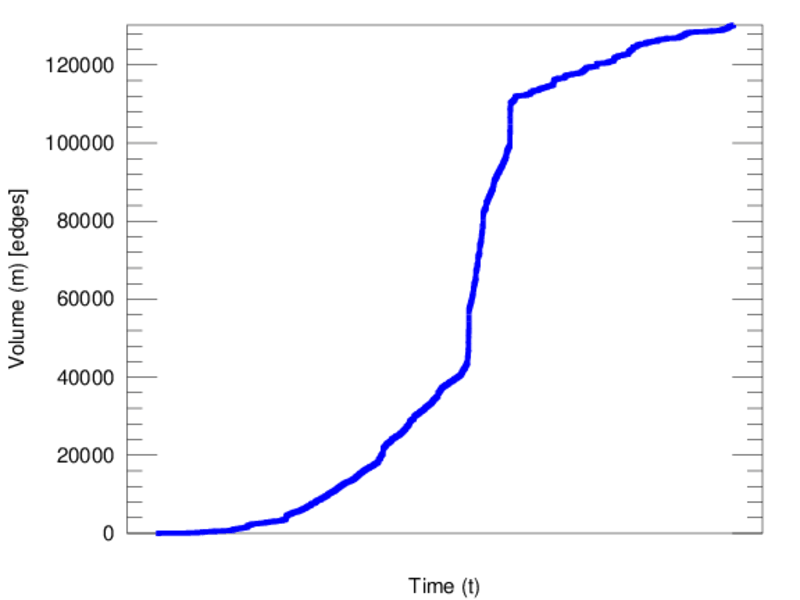
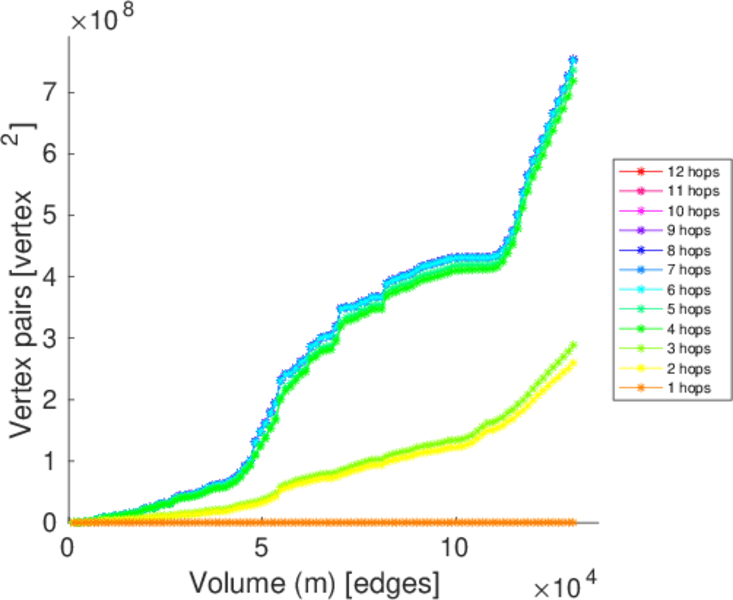
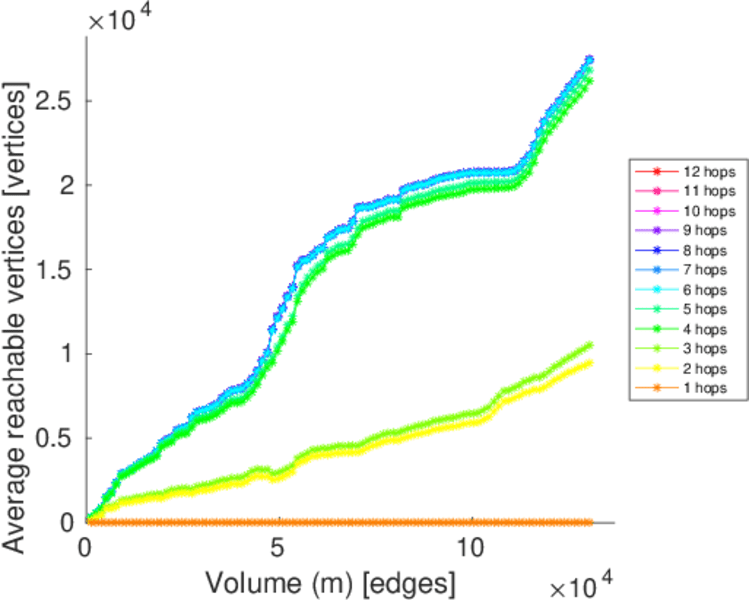
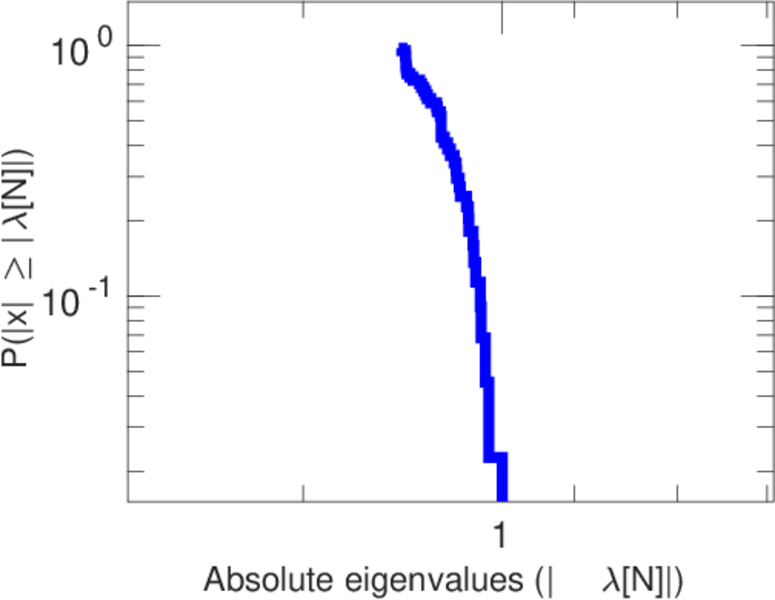
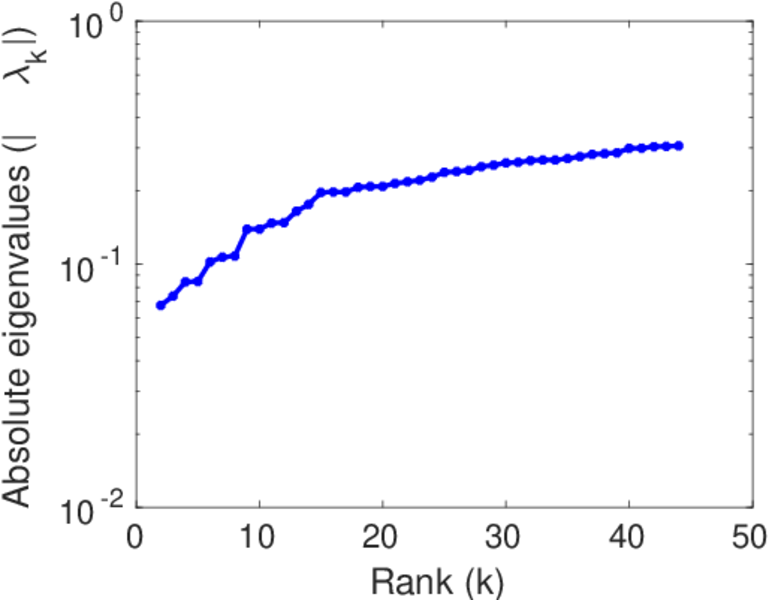
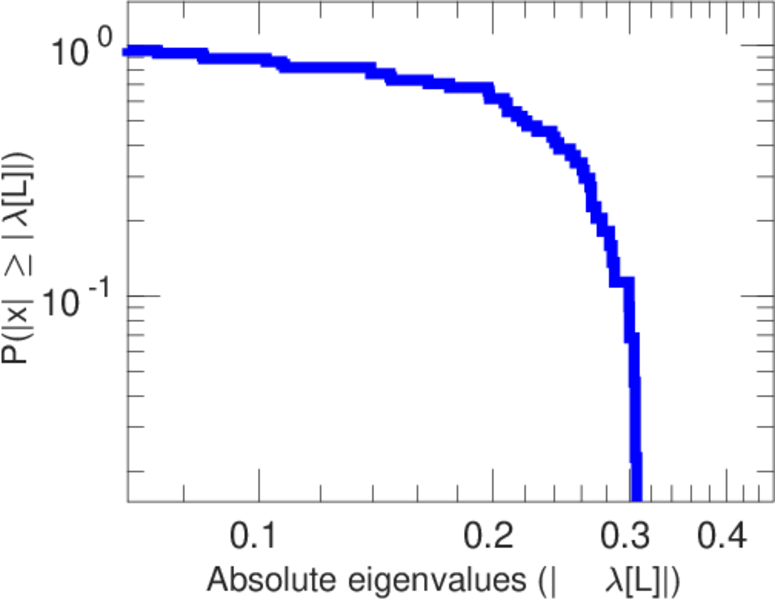
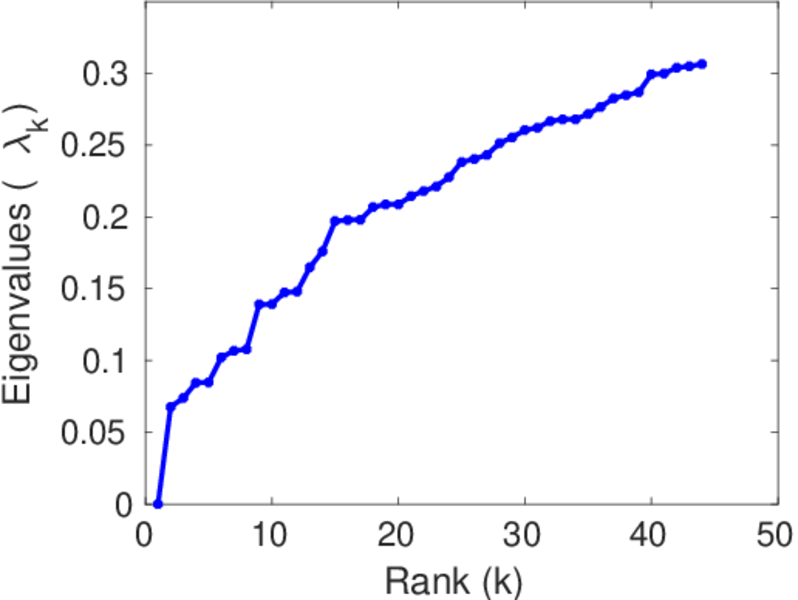
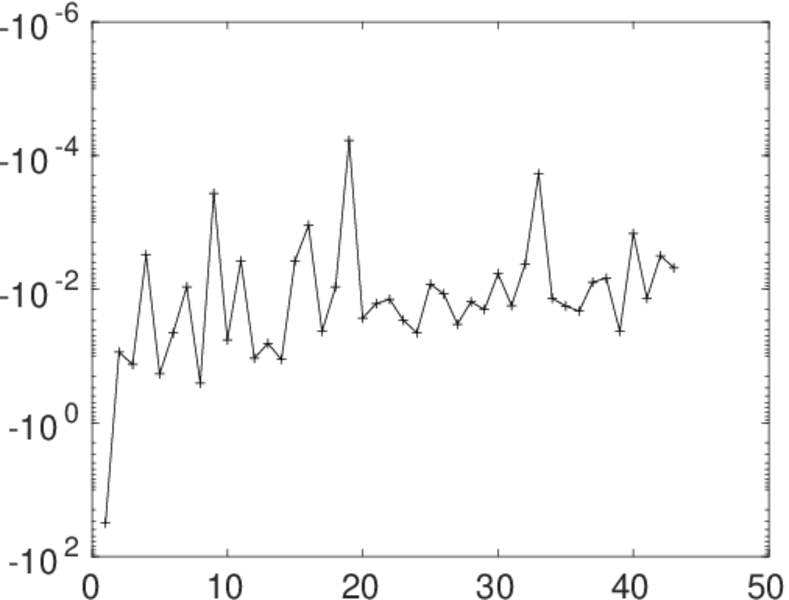
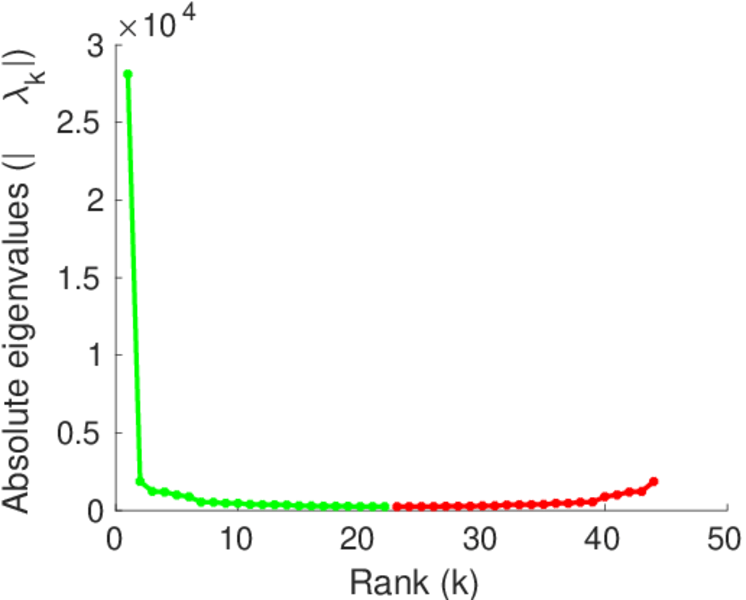
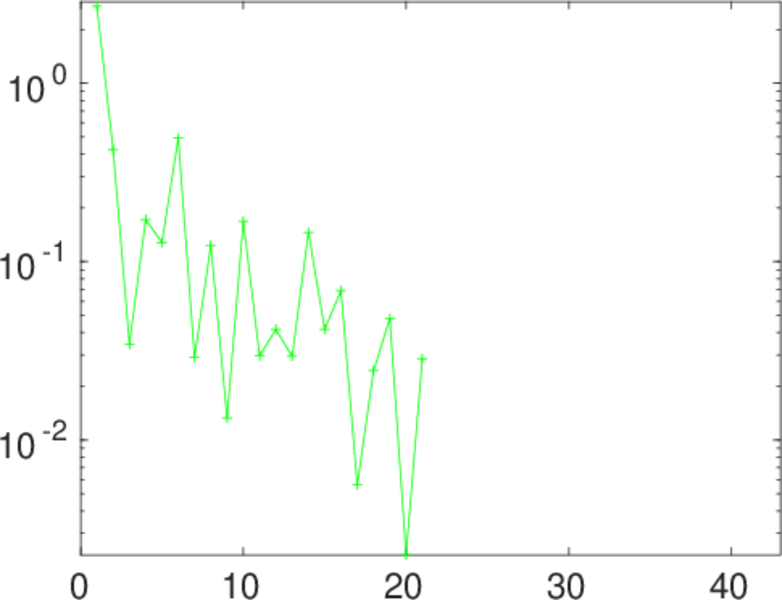
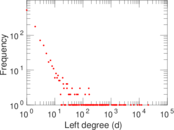
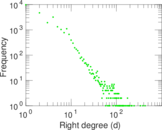
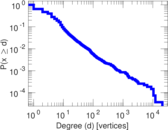
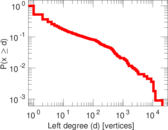
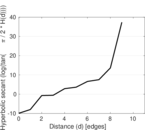
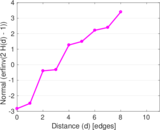
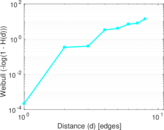
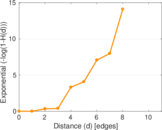
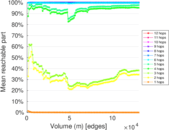
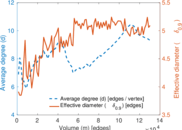
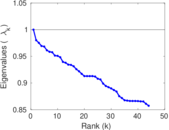
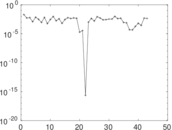
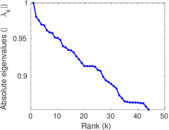
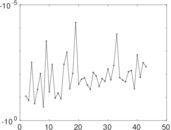
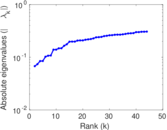
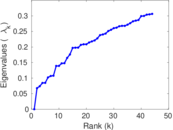
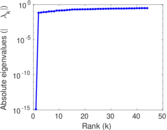
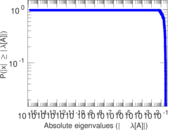
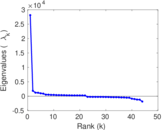
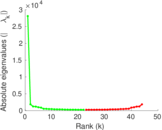
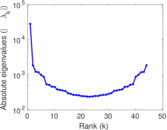
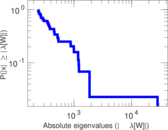
Plots


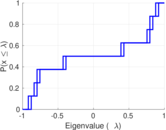
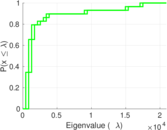
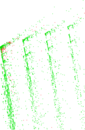
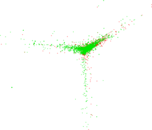


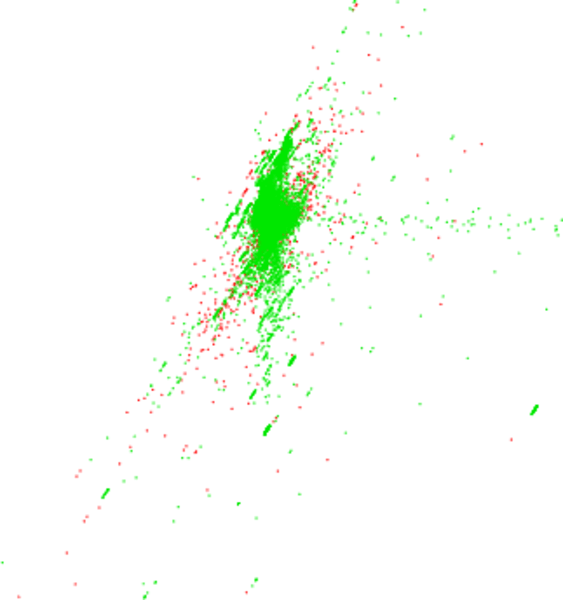
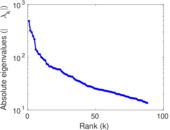
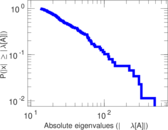
Matrix decompositions plots


Downloads
References
|
[1]
|
Jérôme Kunegis.
KONECT – The Koblenz Network Collection.
In Proc. Int. Conf. on World Wide Web Companion, pages
1343–1350, 2013.
[ http ]
|
|
[2]
|
Wikimedia Foundation.
Wikimedia downloads.
http://dumps.wikimedia.org/, January 2010.
|
 KONECT ‣ Networks ‣
Buy Me a Coffee
KONECT ‣ Networks ‣
Buy Me a Coffee