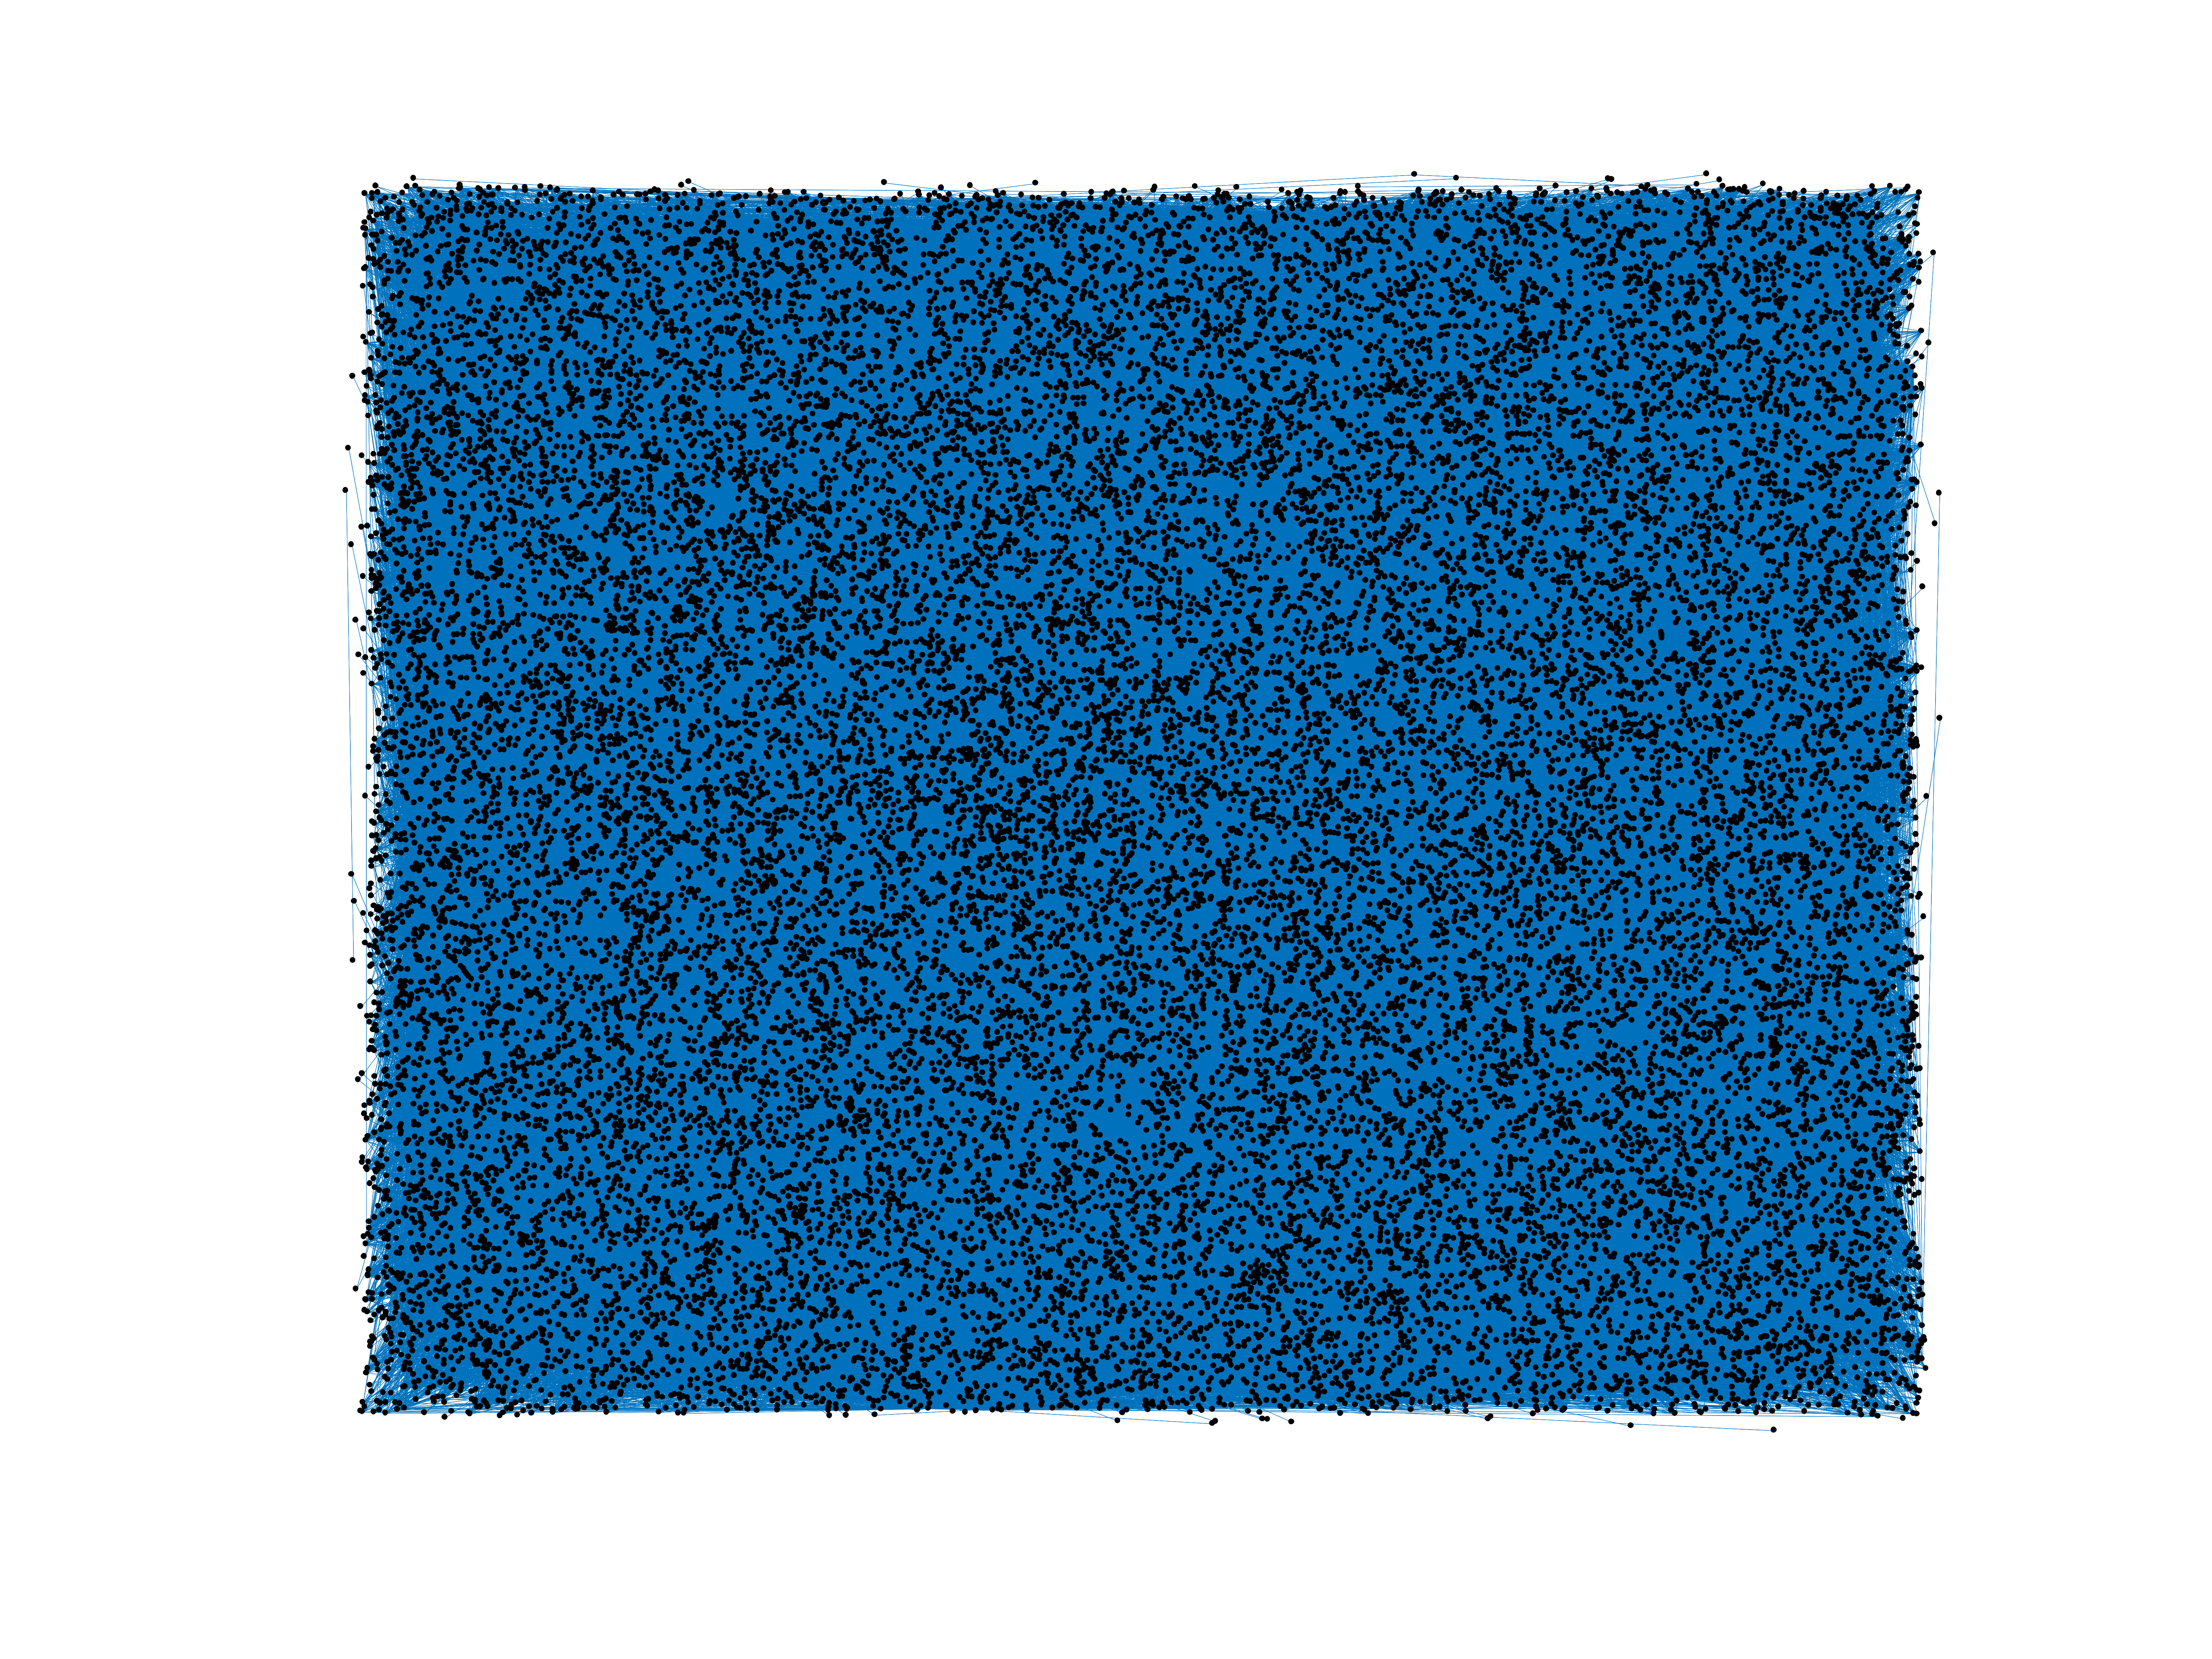
Wikipedia edits (nap)
This is the bipartite edit network of the Neapolitan Wikipedia. It contains
users and pages from the Neapolitan Wikipedia, connected by edit events. Each
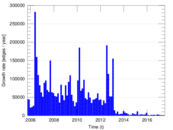
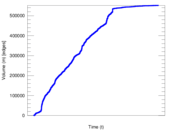
edge represents an edit. The dataset includes the timestamp of each edit.
Metadata
Statistics
| Size | n = | 28,033
|
| Left size | n1 = | 1,753
|
| Right size | n2 = | 26,280
|
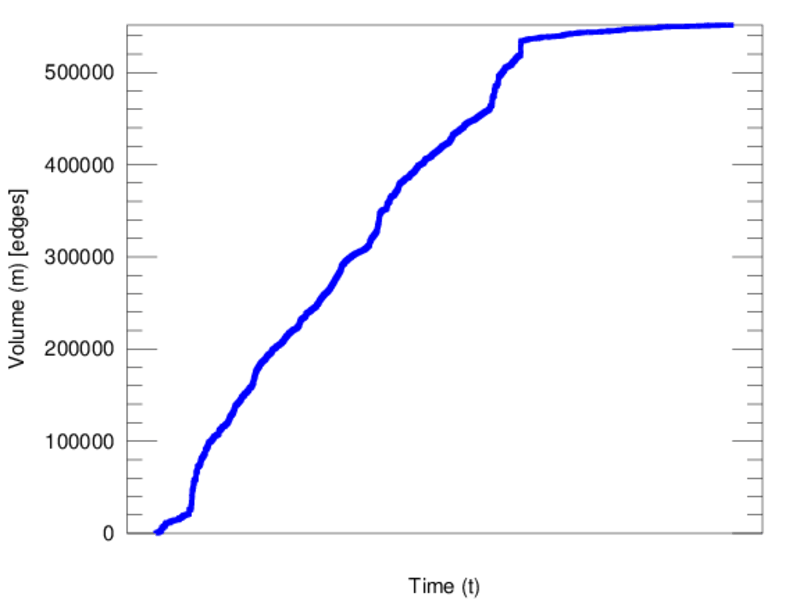
| Volume | m = | 551,457
|
| Unique edge count | m̿ = | 265,546
|
| Wedge count | s = | 947,140,686
|
| Claw count | z = | 3,123,173,015,633
|
| Cross count | x = | 8,552,181,875,246,009
|
| Square count | q = | 4,465,223,754
|
| 4-Tour count | T4 = | 39,511,009,436
|
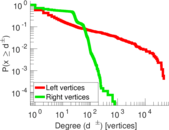
| Maximum degree | dmax = | 47,591
|
| Maximum left degree | d1max = | 47,591
|
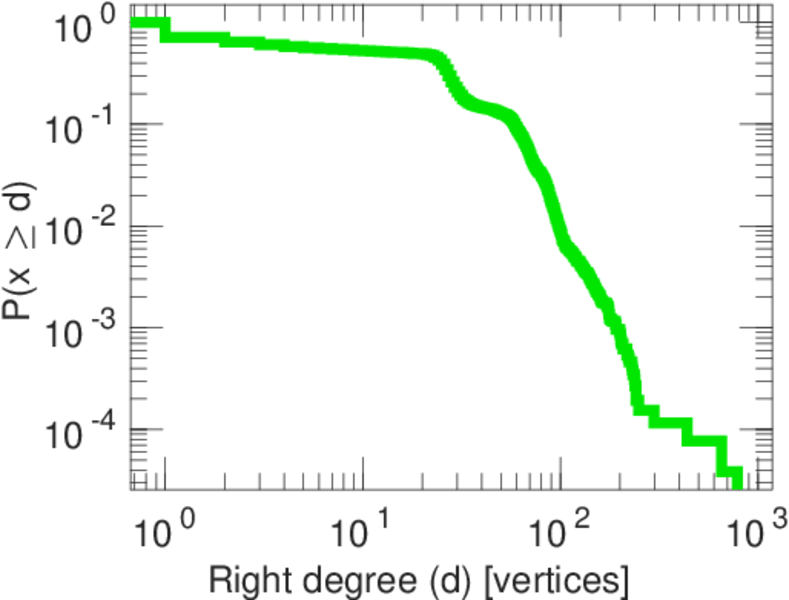
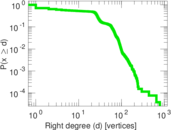
| Maximum right degree | d2max = | 786
|
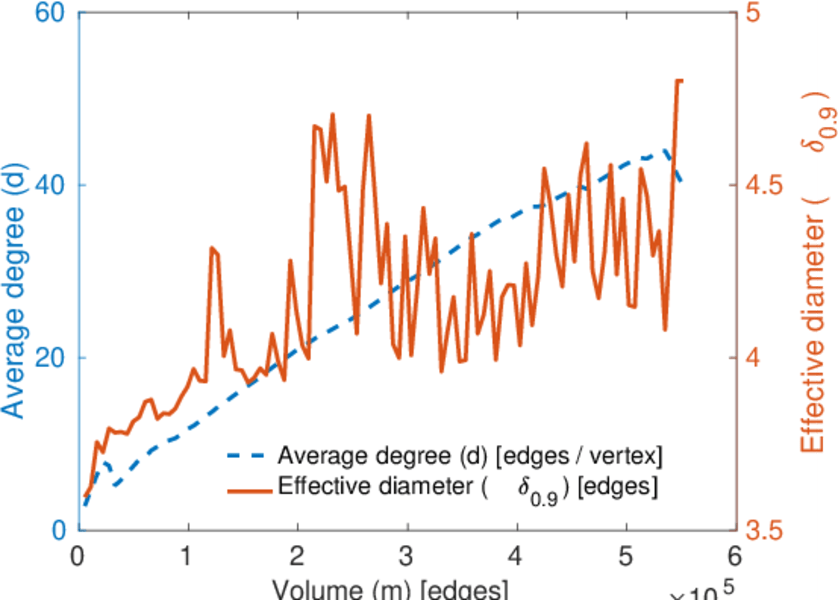
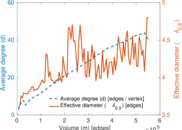
| Average degree | d = | 39.343 4
|
| Average left degree | d1 = | 314.579
|
| Average right degree | d2 = | 20.983 9
|
| Fill | p = | 0.005 764 11
|
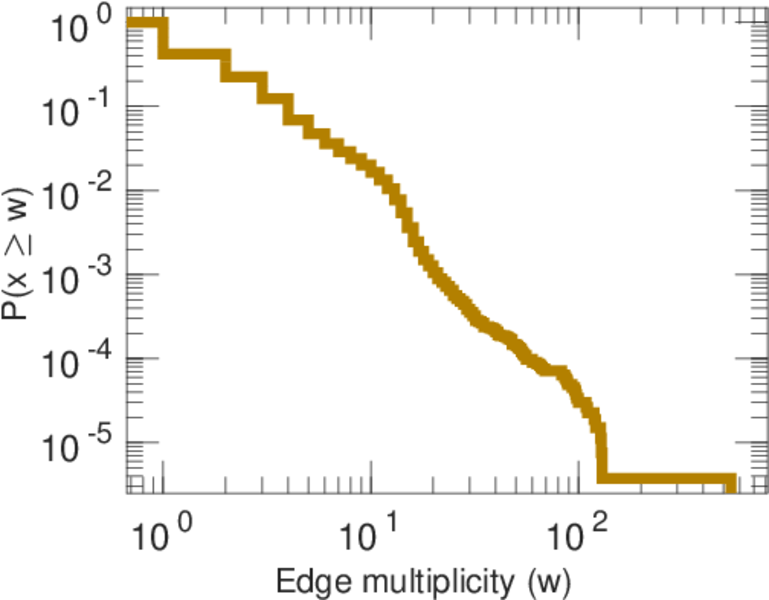
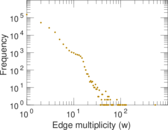
| Average edge multiplicity | m̃ = | 2.076 69
|
| Size of LCC | N = | 27,048
|
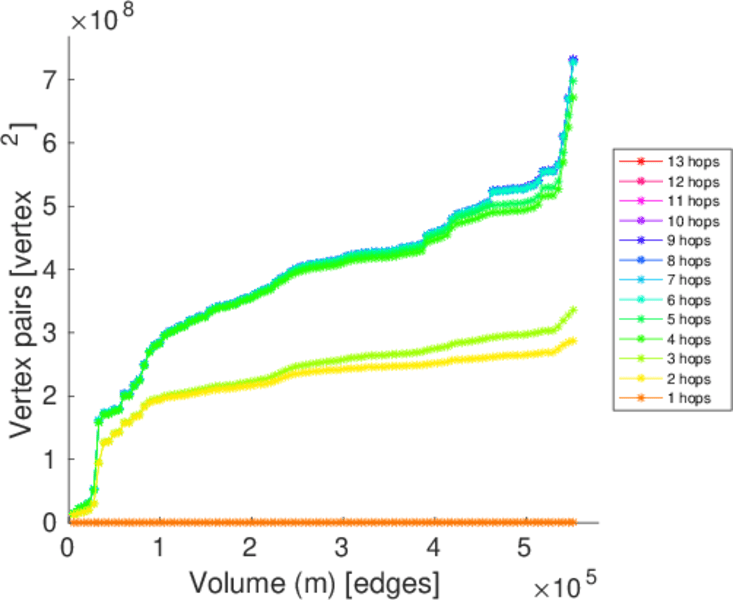
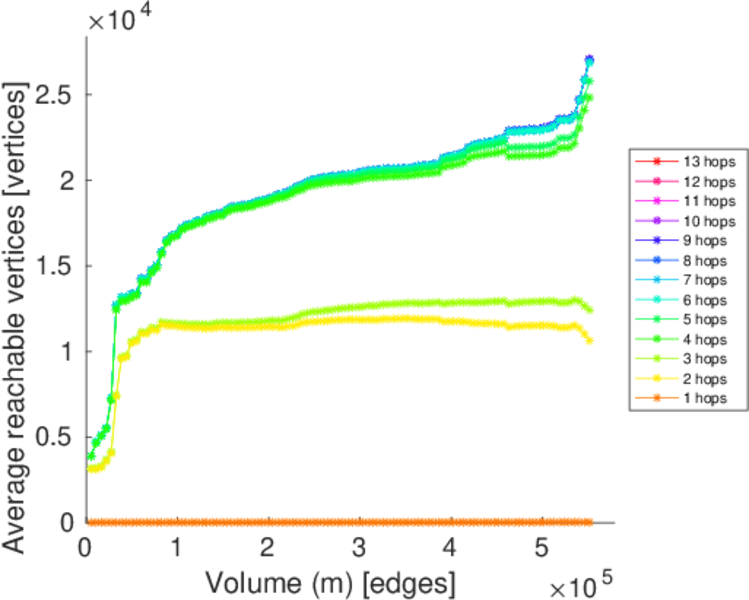
| Diameter | δ = | 13
|
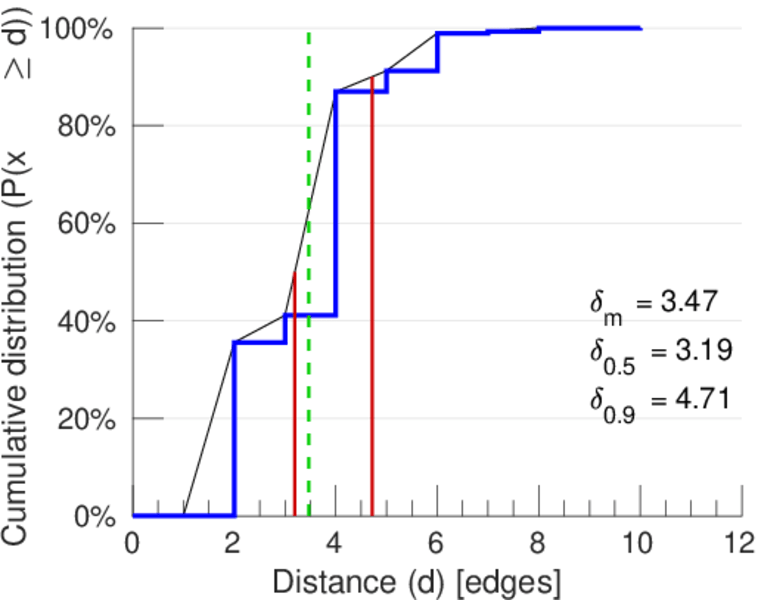
| 50-Percentile effective diameter | δ0.5 = | 3.193 99
|
| 90-Percentile effective diameter | δ0.9 = | 4.714 69
|
| Median distance | δM = | 4
|
| Mean distance | δm = | 3.468 87
|
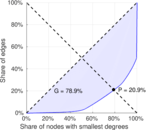
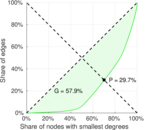
| Gini coefficient | G = | 0.783 209
|
| Balanced inequality ratio | P = | 0.210 056
|
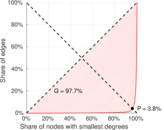
| Left balanced inequality ratio | P1 = | 0.038 438 2
|
| Right balanced inequality ratio | P2 = | 0.297 396
|
| Relative edge distribution entropy | Her = | 0.741 520
|
| Power law exponent | γ = | 1.633 83
|
| Tail power law exponent | γt = | 4.081 00
|
| Tail power law exponent with p | γ3 = | 4.081 00
|
| p-value | p = | 0.000 00
|
| Left tail power law exponent with p | γ3,1 = | 1.671 00
|
| Left p-value | p1 = | 0.000 00
|
| Right tail power law exponent with p | γ3,2 = | 4.631 00
|
| Right p-value | p2 = | 0.000 00
|
| Degree assortativity | ρ = | −0.088 847 4
|
| Degree assortativity p-value | pρ = | 0.000 00
|
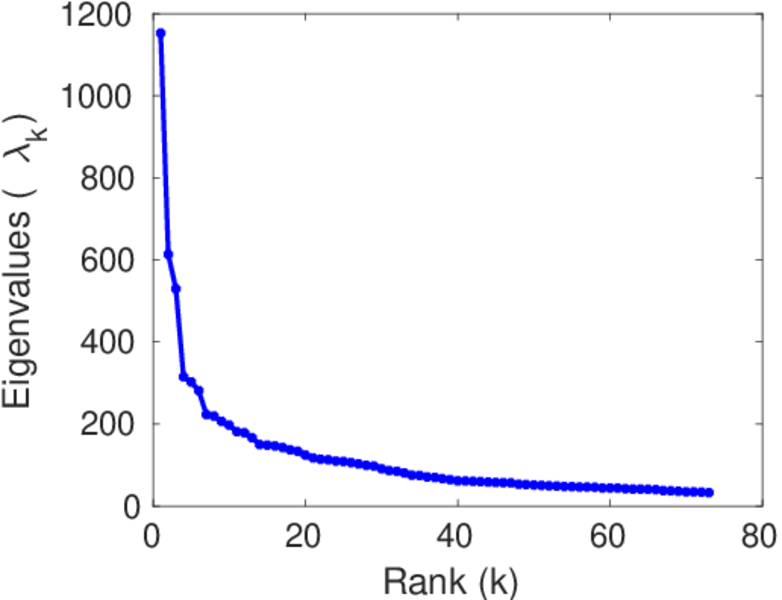
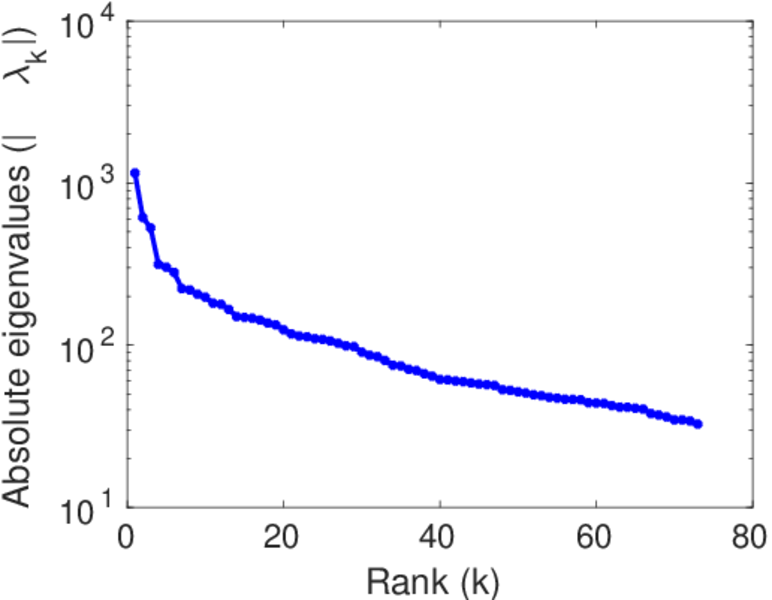
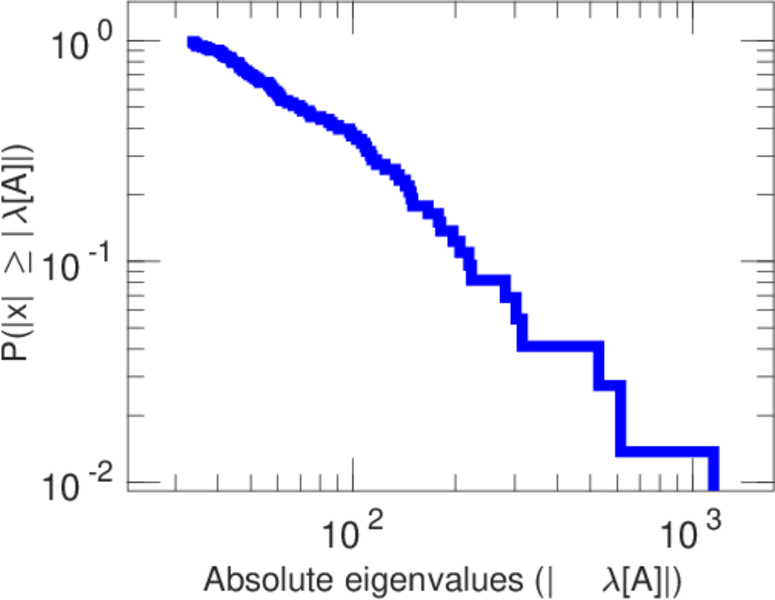
| Spectral norm | α = | 1,152.61
|
| Algebraic connectivity | a = | 0.006 157 61
|
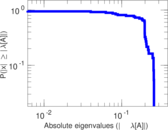
| Spectral separation | |λ1[A] / λ2[A]| = | 1.879 24
|
| Controllability | C = | 24,434
|
| Relative controllability | Cr = | 0.884 201
|
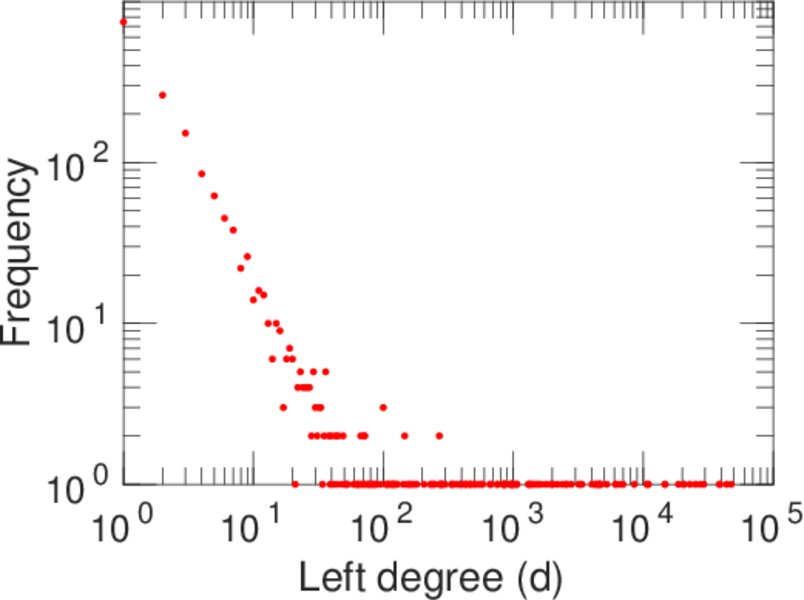
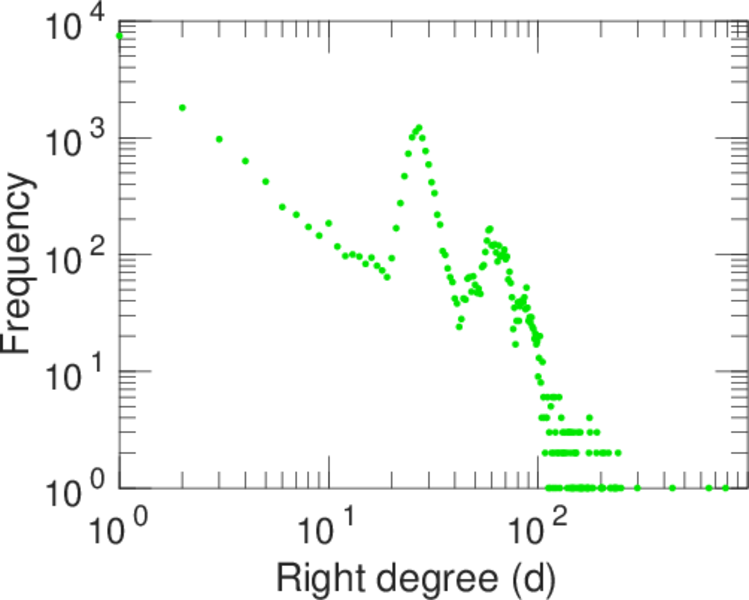
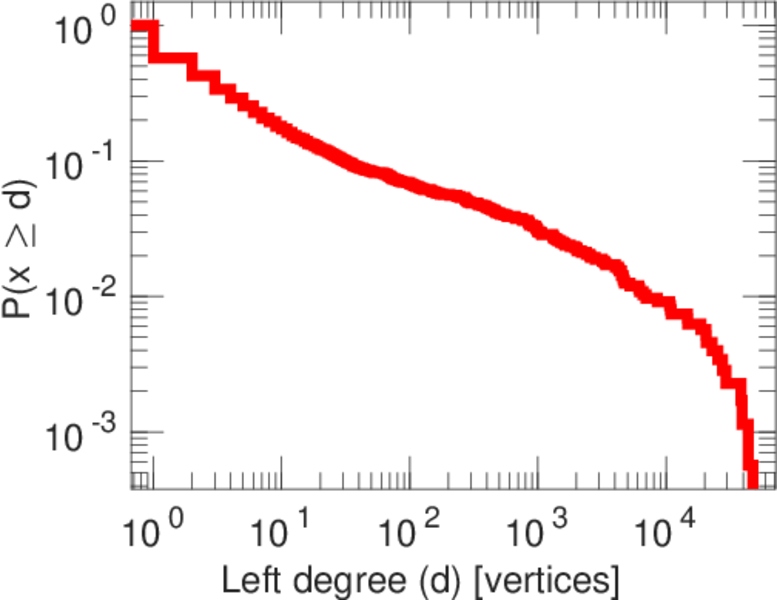
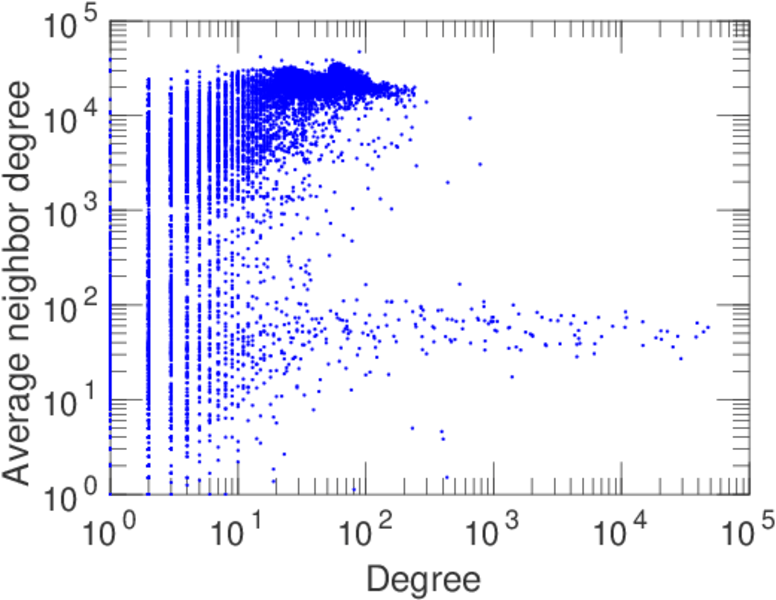
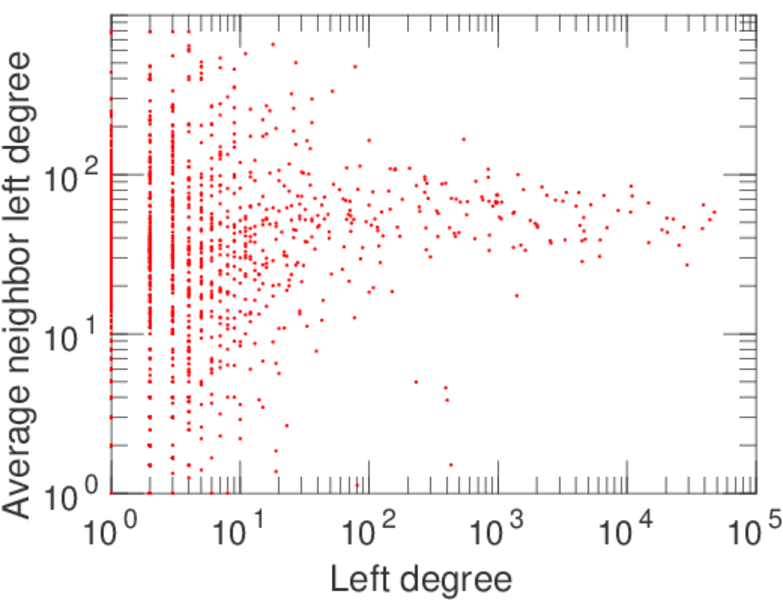
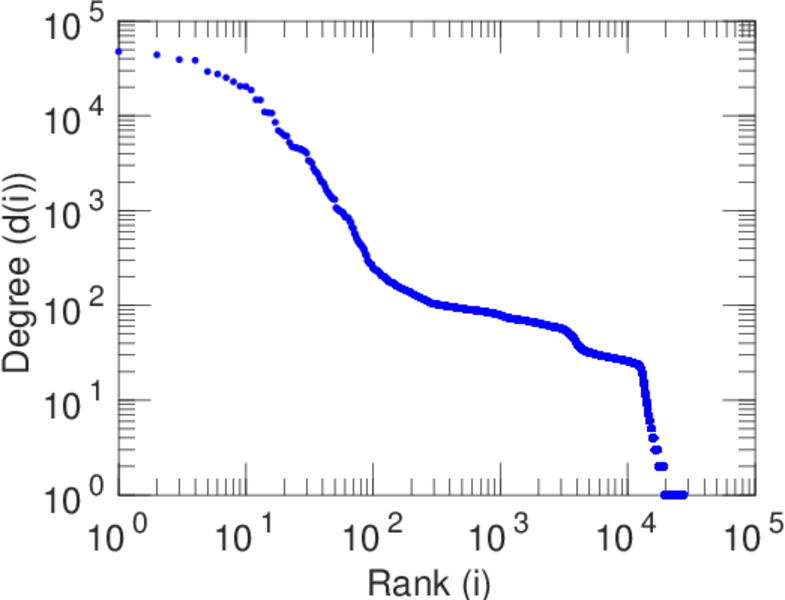
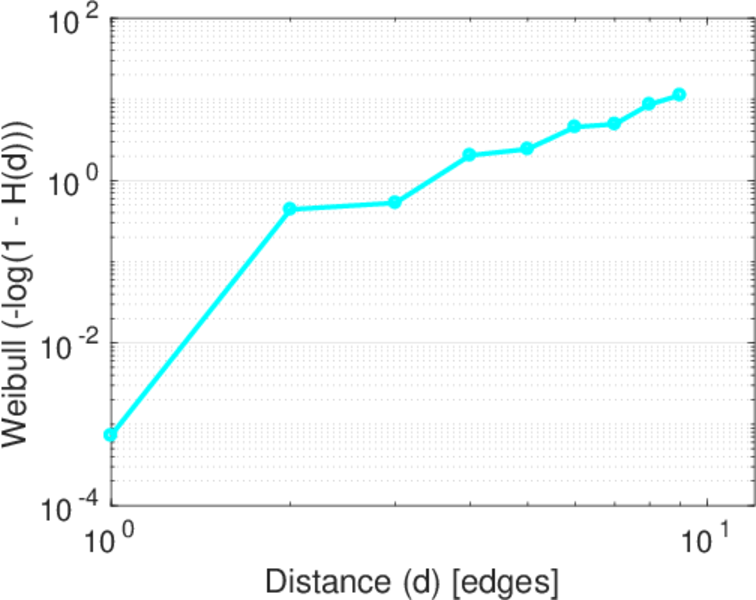
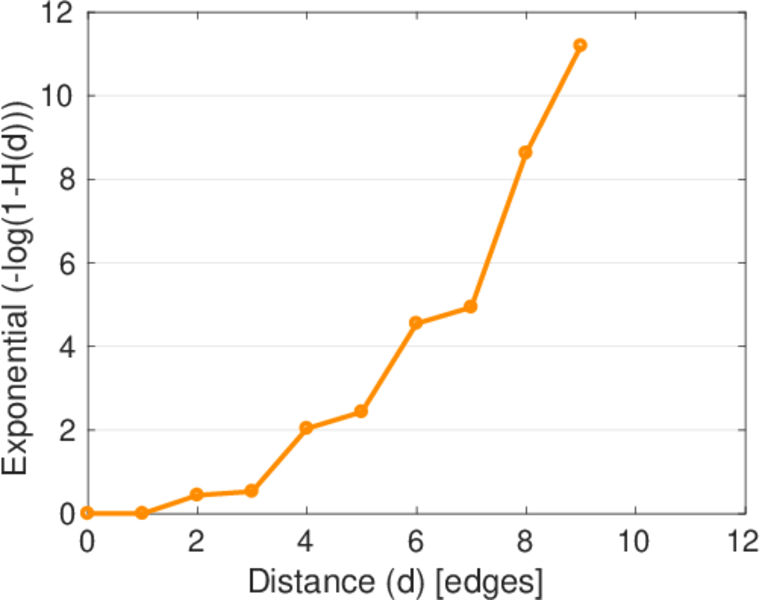
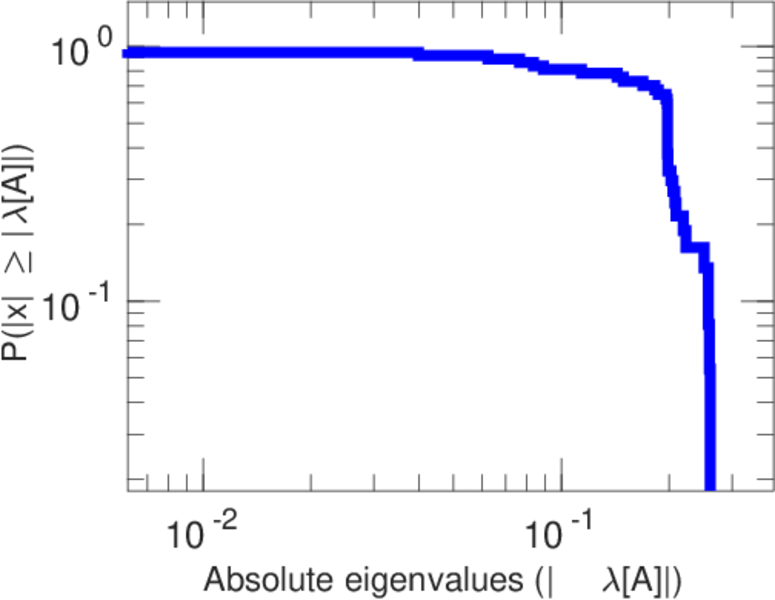
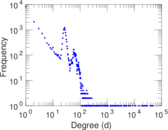
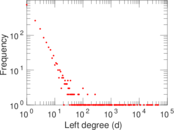
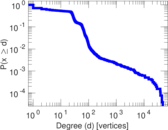
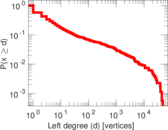
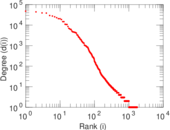
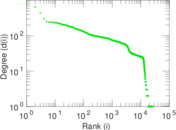
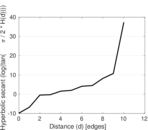
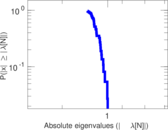
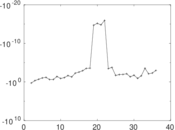
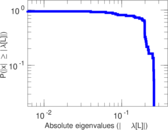
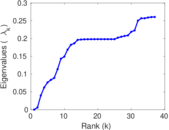
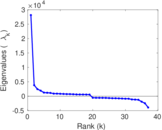
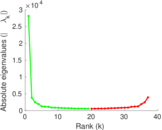
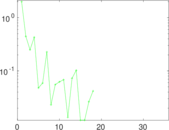
Plots


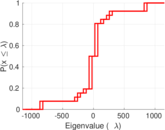
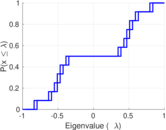
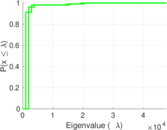


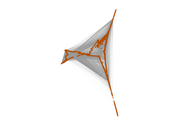


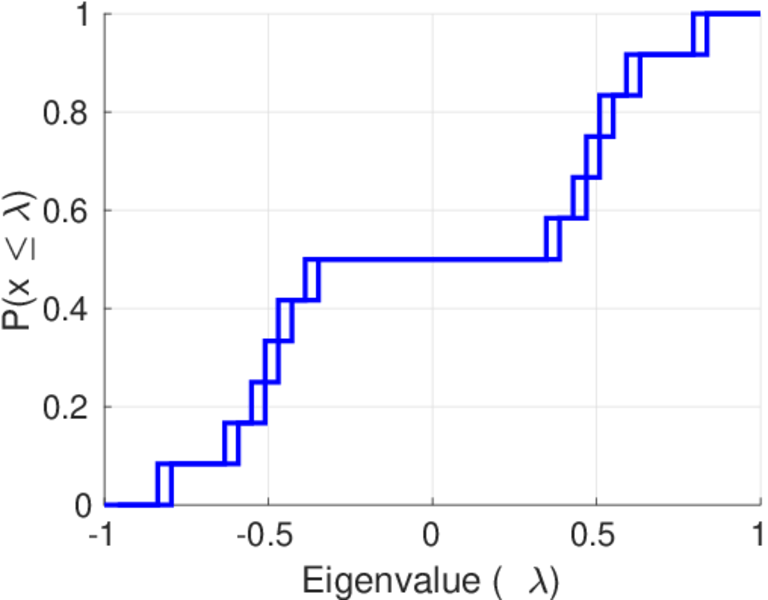
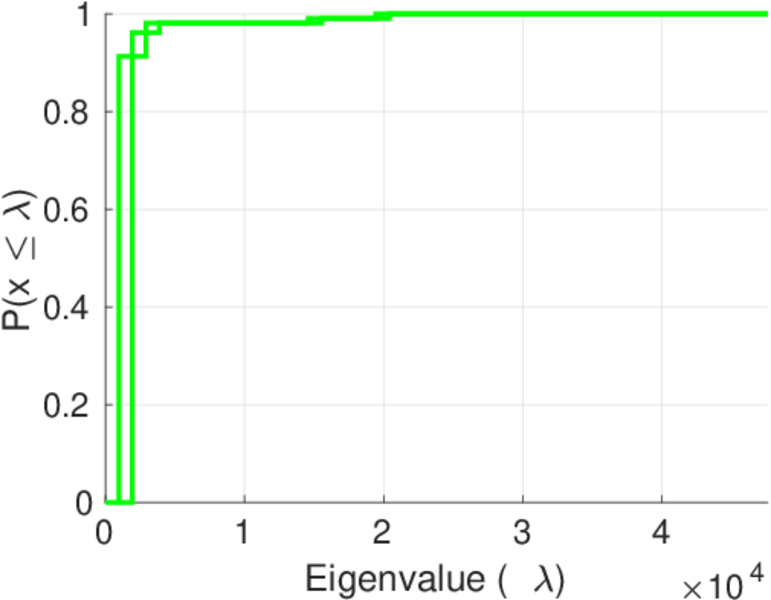
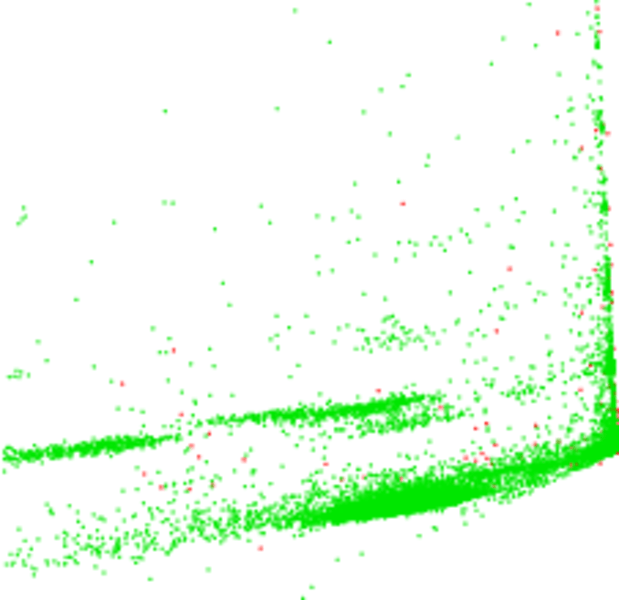
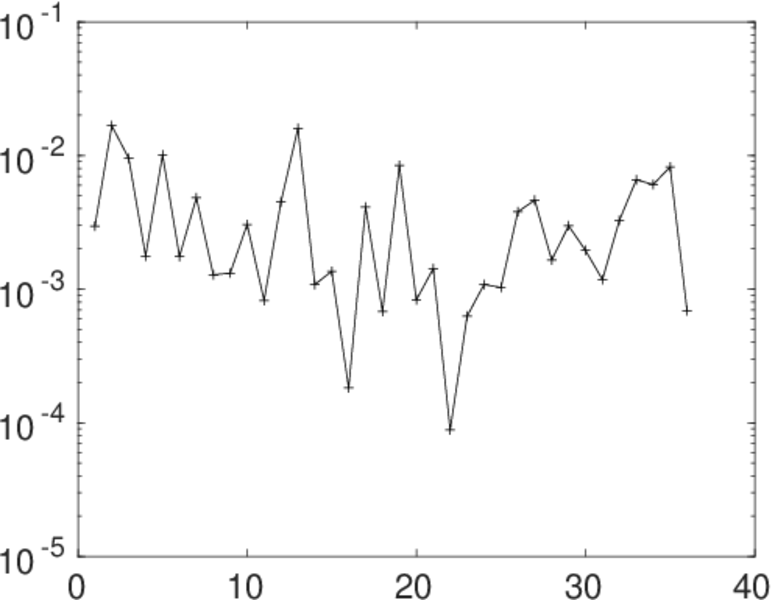
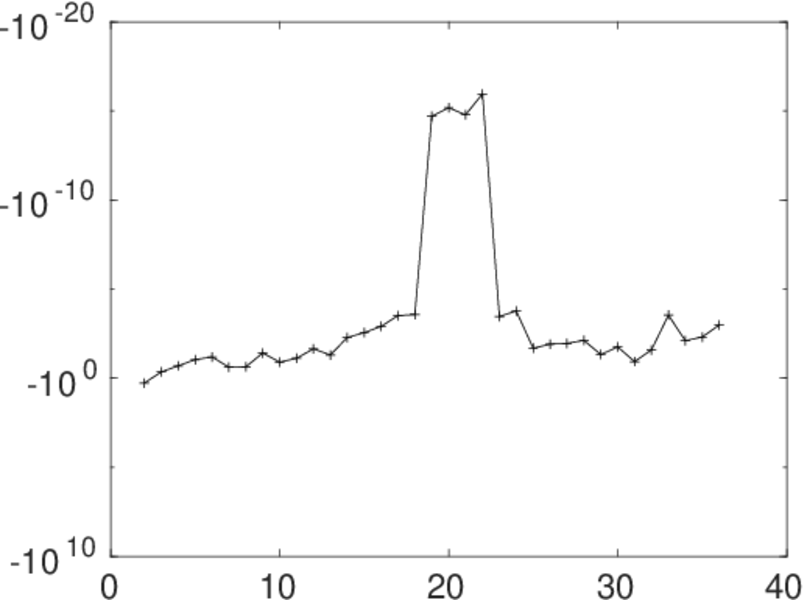
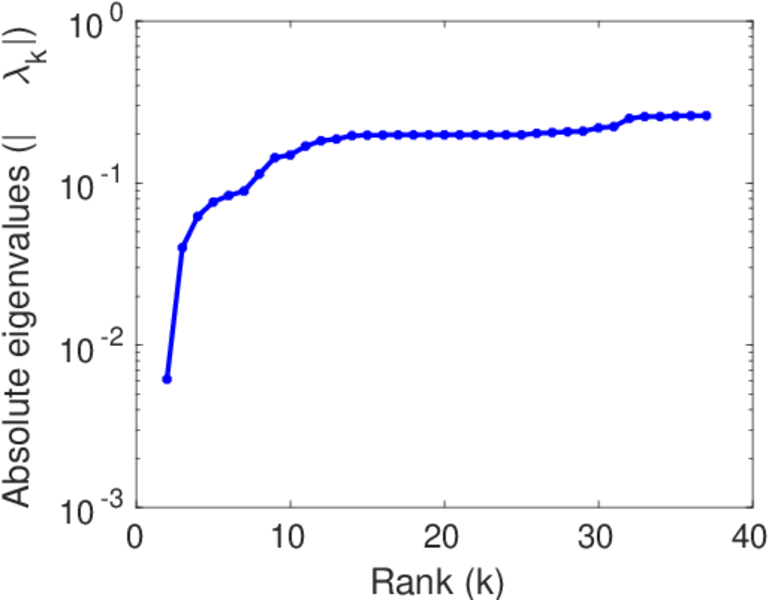
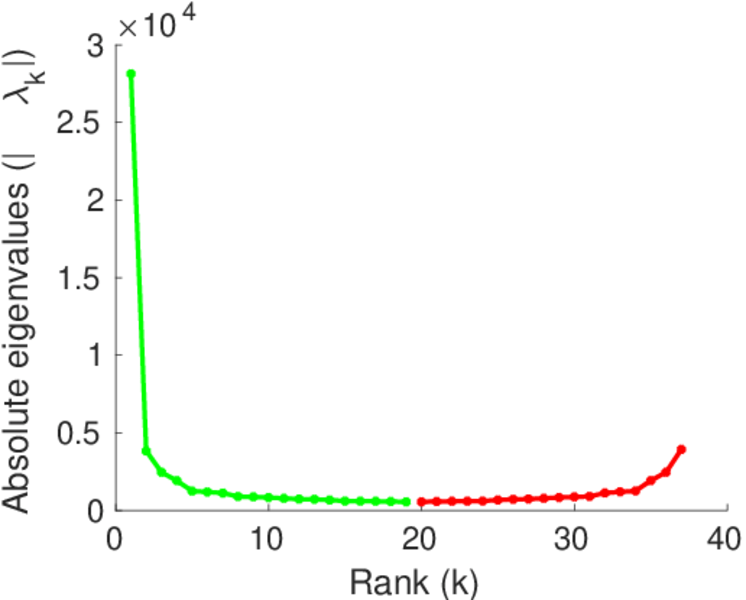
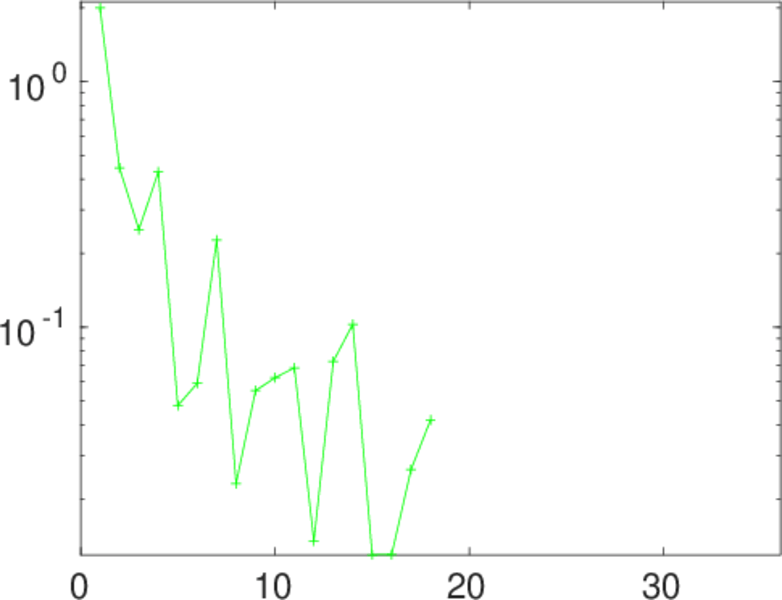
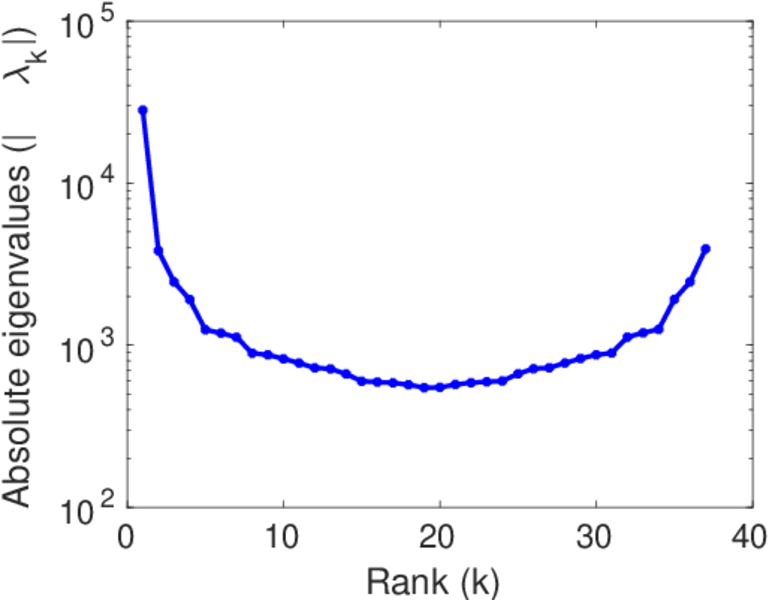
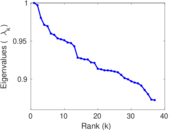
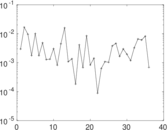
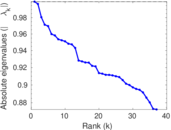
Matrix decompositions plots


Downloads
References
|
[1]
|
Jérôme Kunegis.
KONECT – The Koblenz Network Collection.
In Proc. Int. Conf. on World Wide Web Companion, pages
1343–1350, 2013.
[ http ]
|
|
[2]
|
Wikimedia Foundation.
Wikimedia downloads.
http://dumps.wikimedia.org/, January 2010.
|
 KONECT ‣ Networks ‣
Buy Me a Coffee
KONECT ‣ Networks ‣
Buy Me a Coffee