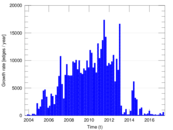
Wikipedia edits (na)
This is the bipartite edit network of the Nauru Wikipedia. It contains users
and pages from the Nauru Wikipedia, connected by edit events. Each edge
represents an edit. The dataset includes the timestamp of each edit.
Metadata
Statistics
| Size | n = | 4,904
|
| Left size | n1 = | 844
|
| Right size | n2 = | 4,060
|
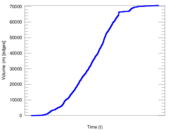
| Volume | m = | 70,695
|
| Unique edge count | m̿ = | 25,917
|
| Wedge count | s = | 6,138,057
|
| Claw count | z = | 1,461,345,694
|
| Cross count | x = | 331,048,619,422
|
| Square count | q = | 22,974,300
|
| 4-Tour count | T4 = | 208,415,678
|
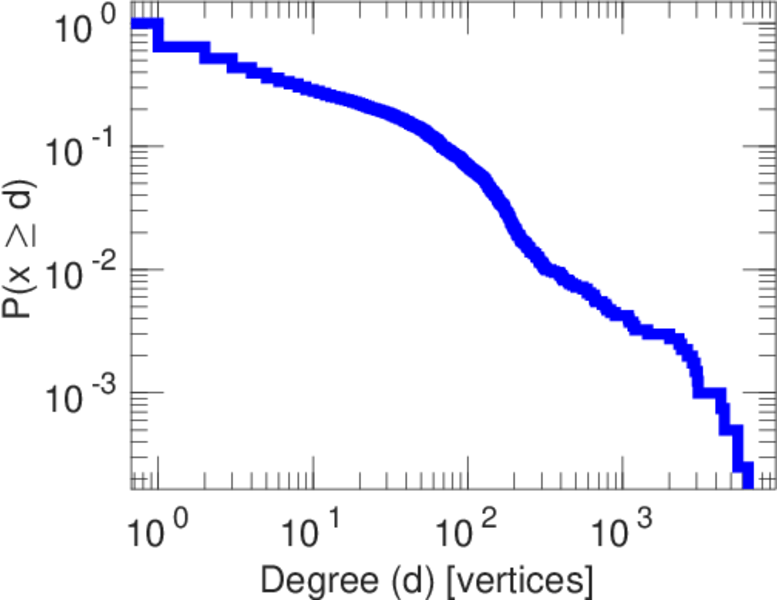
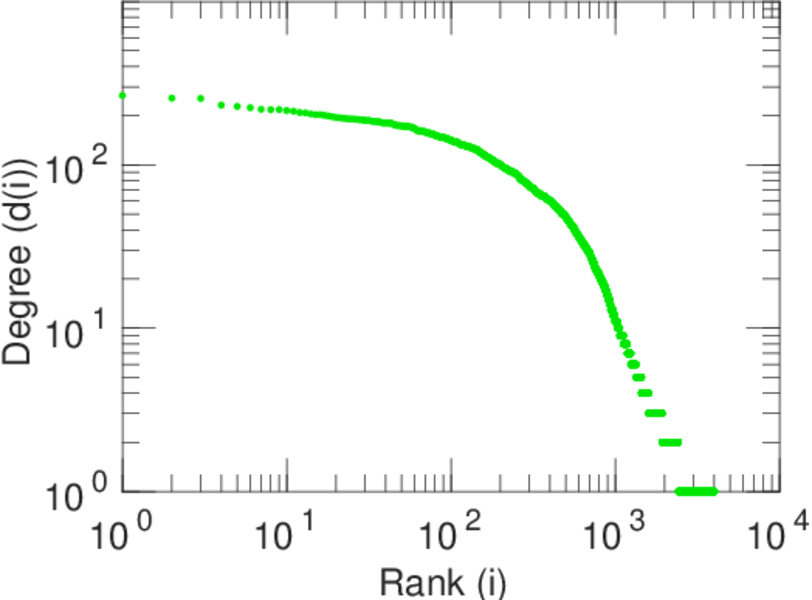
| Maximum degree | dmax = | 6,471
|
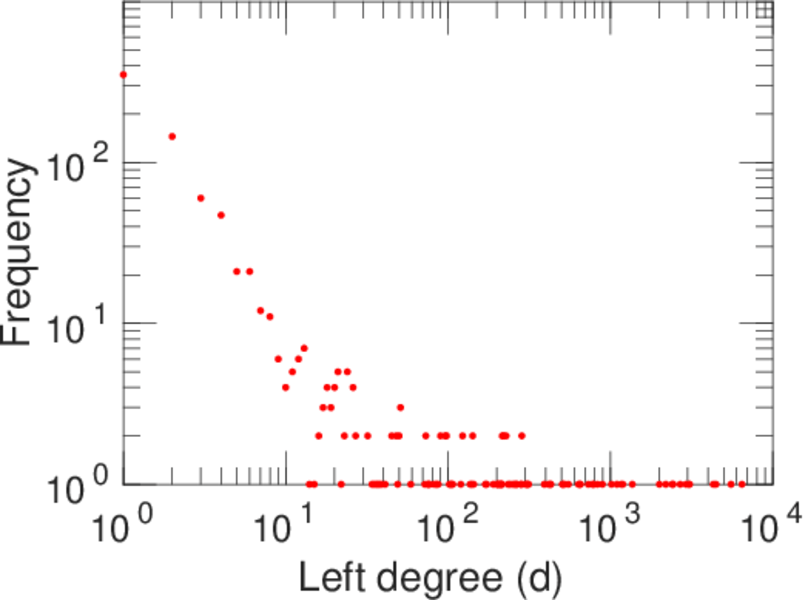
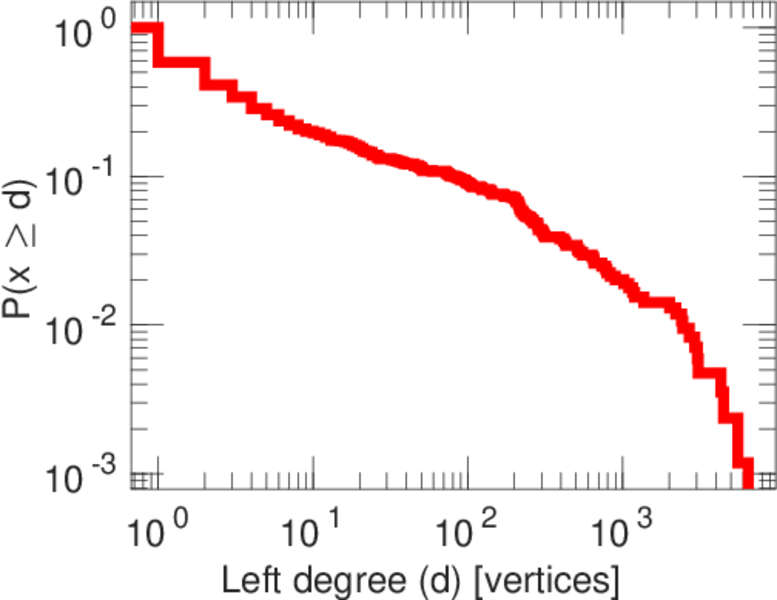
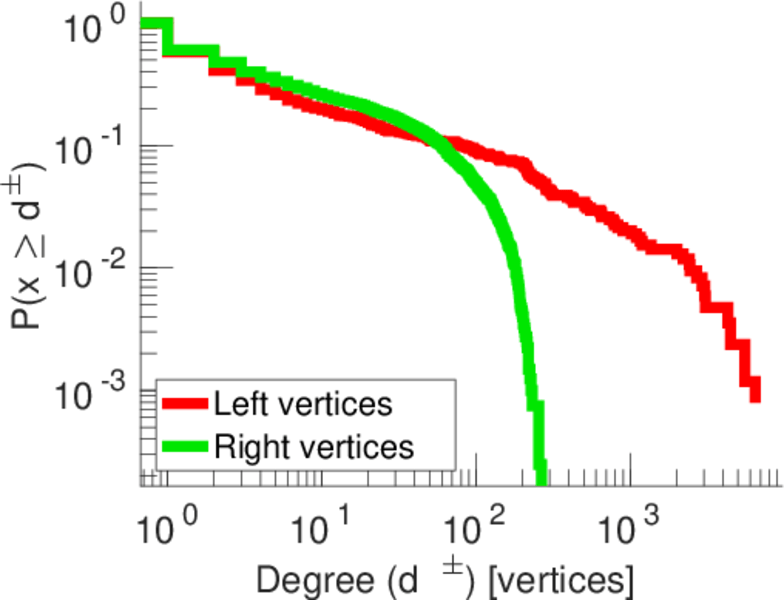
| Maximum left degree | d1max = | 6,471
|
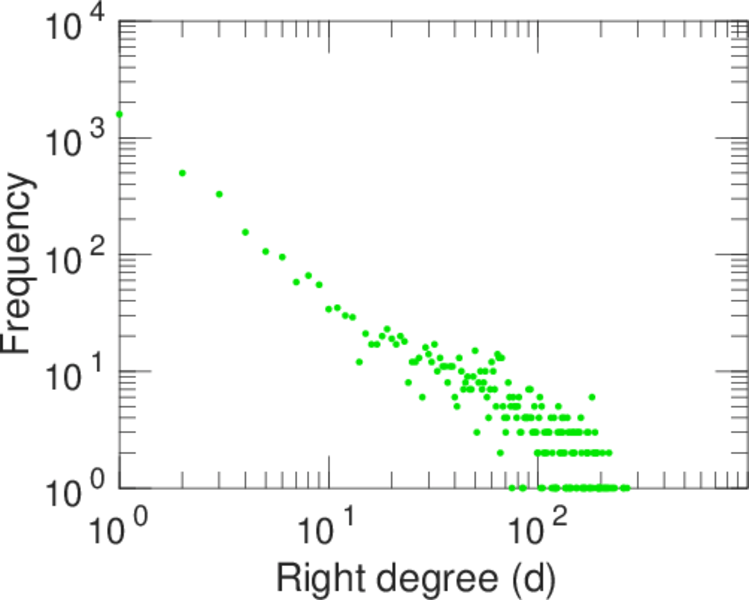
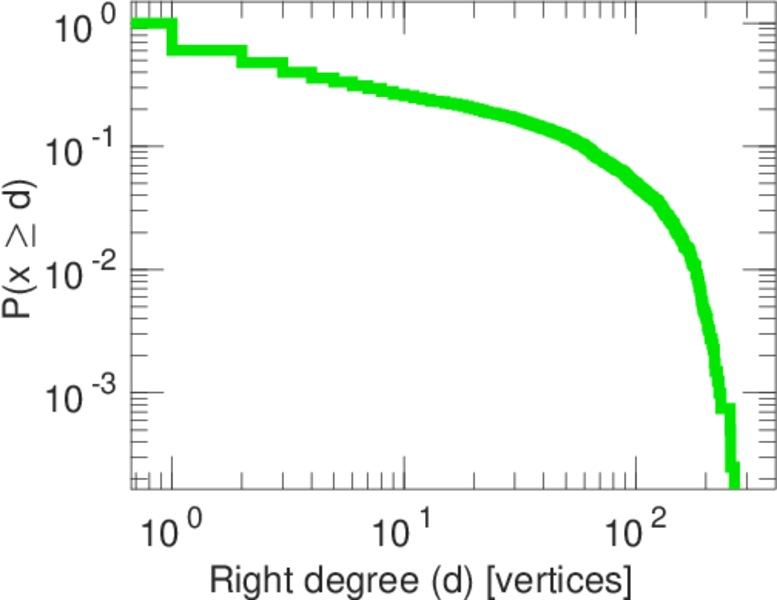
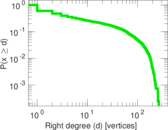
| Maximum right degree | d2max = | 266
|
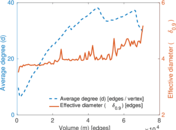
| Average degree | d = | 28.831 6
|
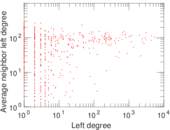
| Average left degree | d1 = | 83.761 8
|
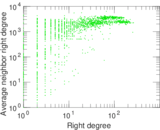
| Average right degree | d2 = | 17.412 6
|
| Fill | p = | 0.007 563 39
|
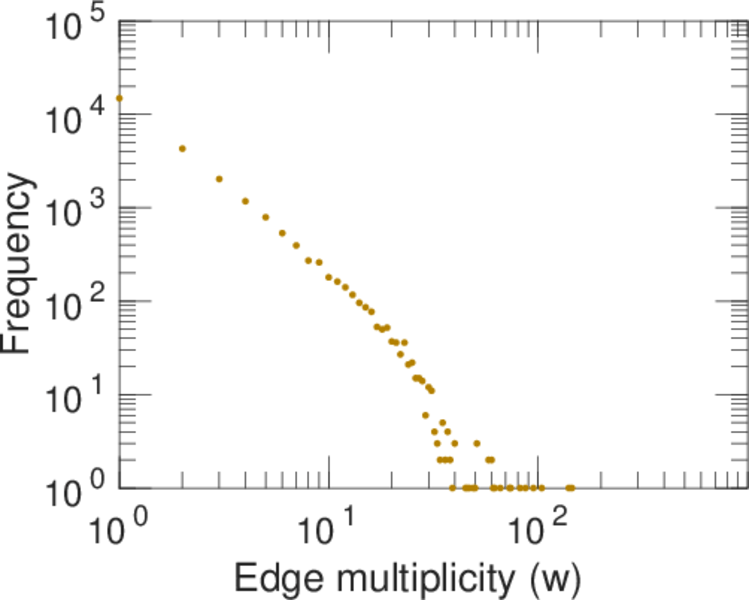
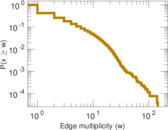
| Average edge multiplicity | m̃ = | 2.727 75
|
| Size of LCC | N = | 4,335
|
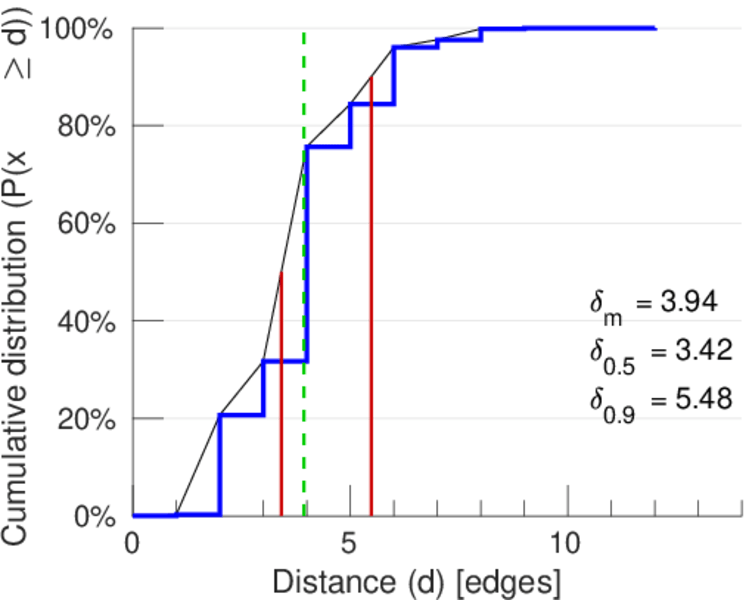
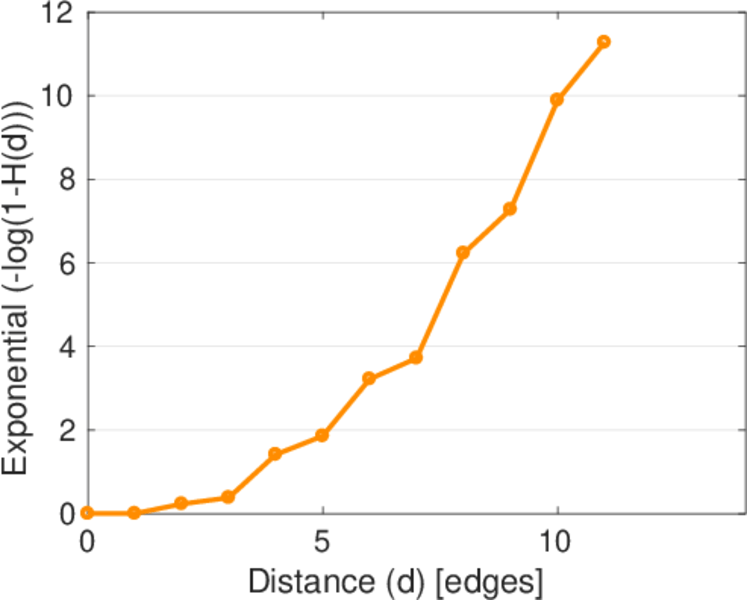
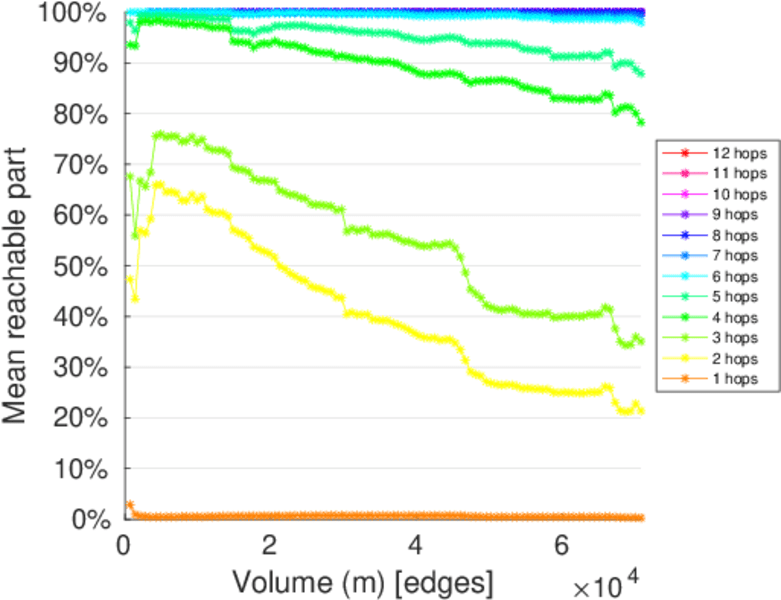
| Diameter | δ = | 12
|
| 50-Percentile effective diameter | δ0.5 = | 3.416 54
|
| 90-Percentile effective diameter | δ0.9 = | 5.483 13
|
| Median distance | δM = | 4
|
| Mean distance | δm = | 3.940 35
|
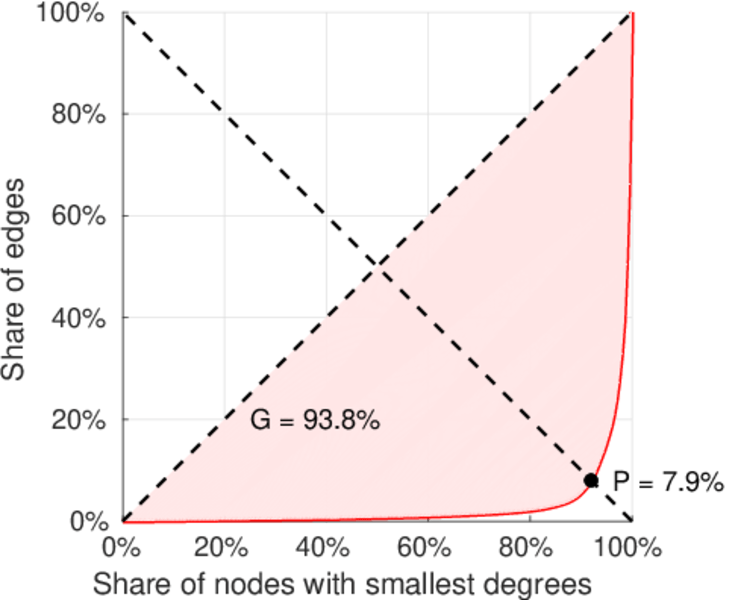
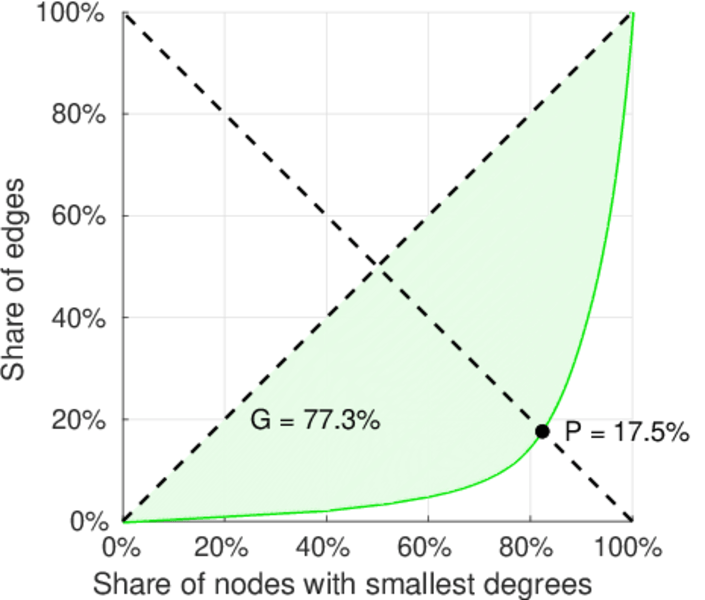
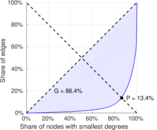
| Gini coefficient | G = | 0.861 778
|
| Balanced inequality ratio | P = | 0.144 515
|
| Left balanced inequality ratio | P1 = | 0.078 591 1
|
| Right balanced inequality ratio | P2 = | 0.174 878
|
| Relative edge distribution entropy | Her = | 0.792 654
|
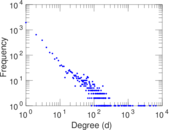
| Power law exponent | γ = | 2.009 16
|
| Tail power law exponent | γt = | 1.681 00
|
| Tail power law exponent with p | γ3 = | 1.681 00
|
| p-value | p = | 0.000 00
|
| Left tail power law exponent with p | γ3,1 = | 1.631 00
|
| Left p-value | p1 = | 0.000 00
|
| Right tail power law exponent with p | γ3,2 = | 3.691 00
|
| Right p-value | p2 = | 0.000 00
|
| Degree assortativity | ρ = | −0.172 567
|
| Degree assortativity p-value | pρ = | 2.151 46 × 10−172
|
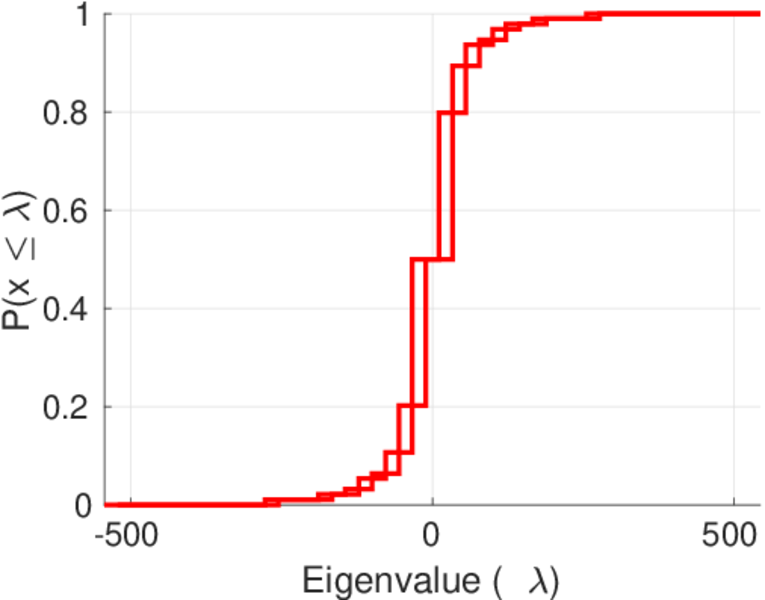
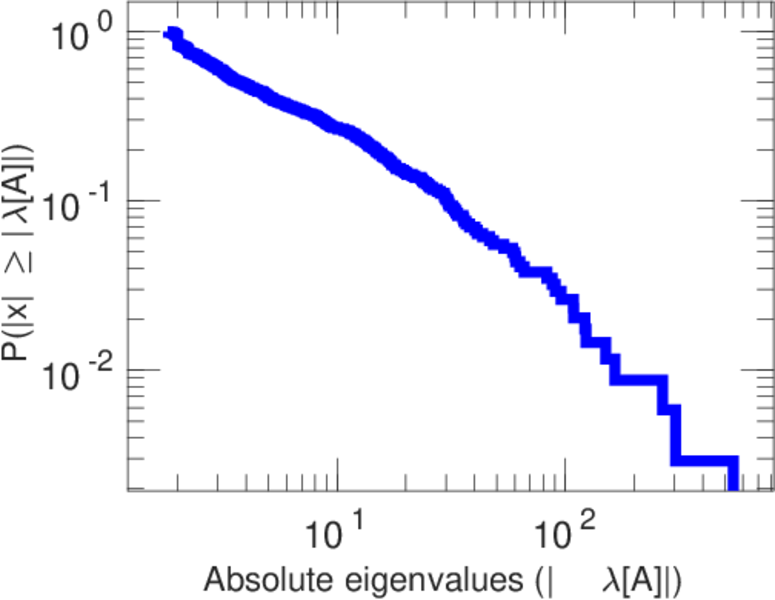
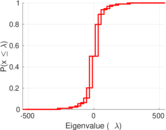
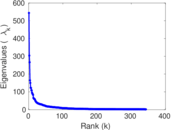
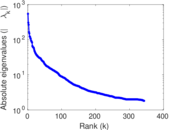
| Spectral norm | α = | 543.923
|
| Algebraic connectivity | a = | 0.025 623 4
|
| Spectral separation | |λ1[A] / λ2[A]| = | 1.787 39
|
| Controllability | C = | 3,300
|
| Relative controllability | Cr = | 0.679 292
|
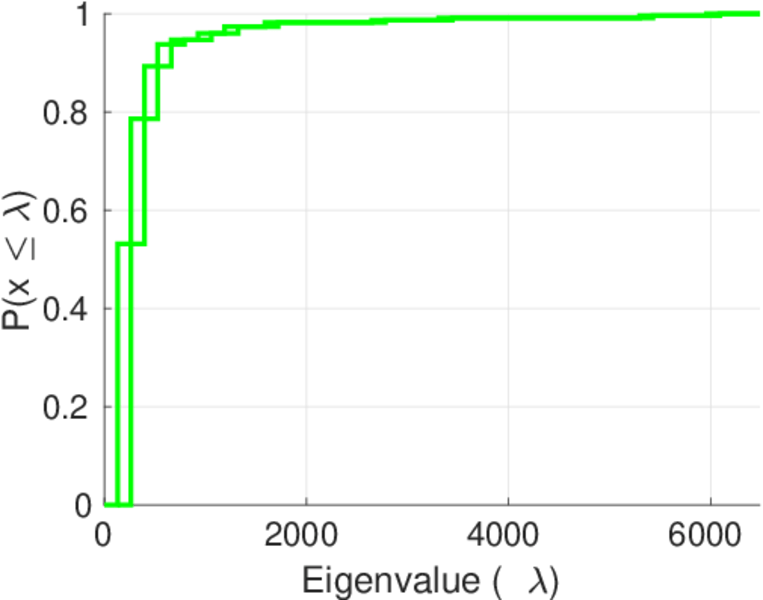
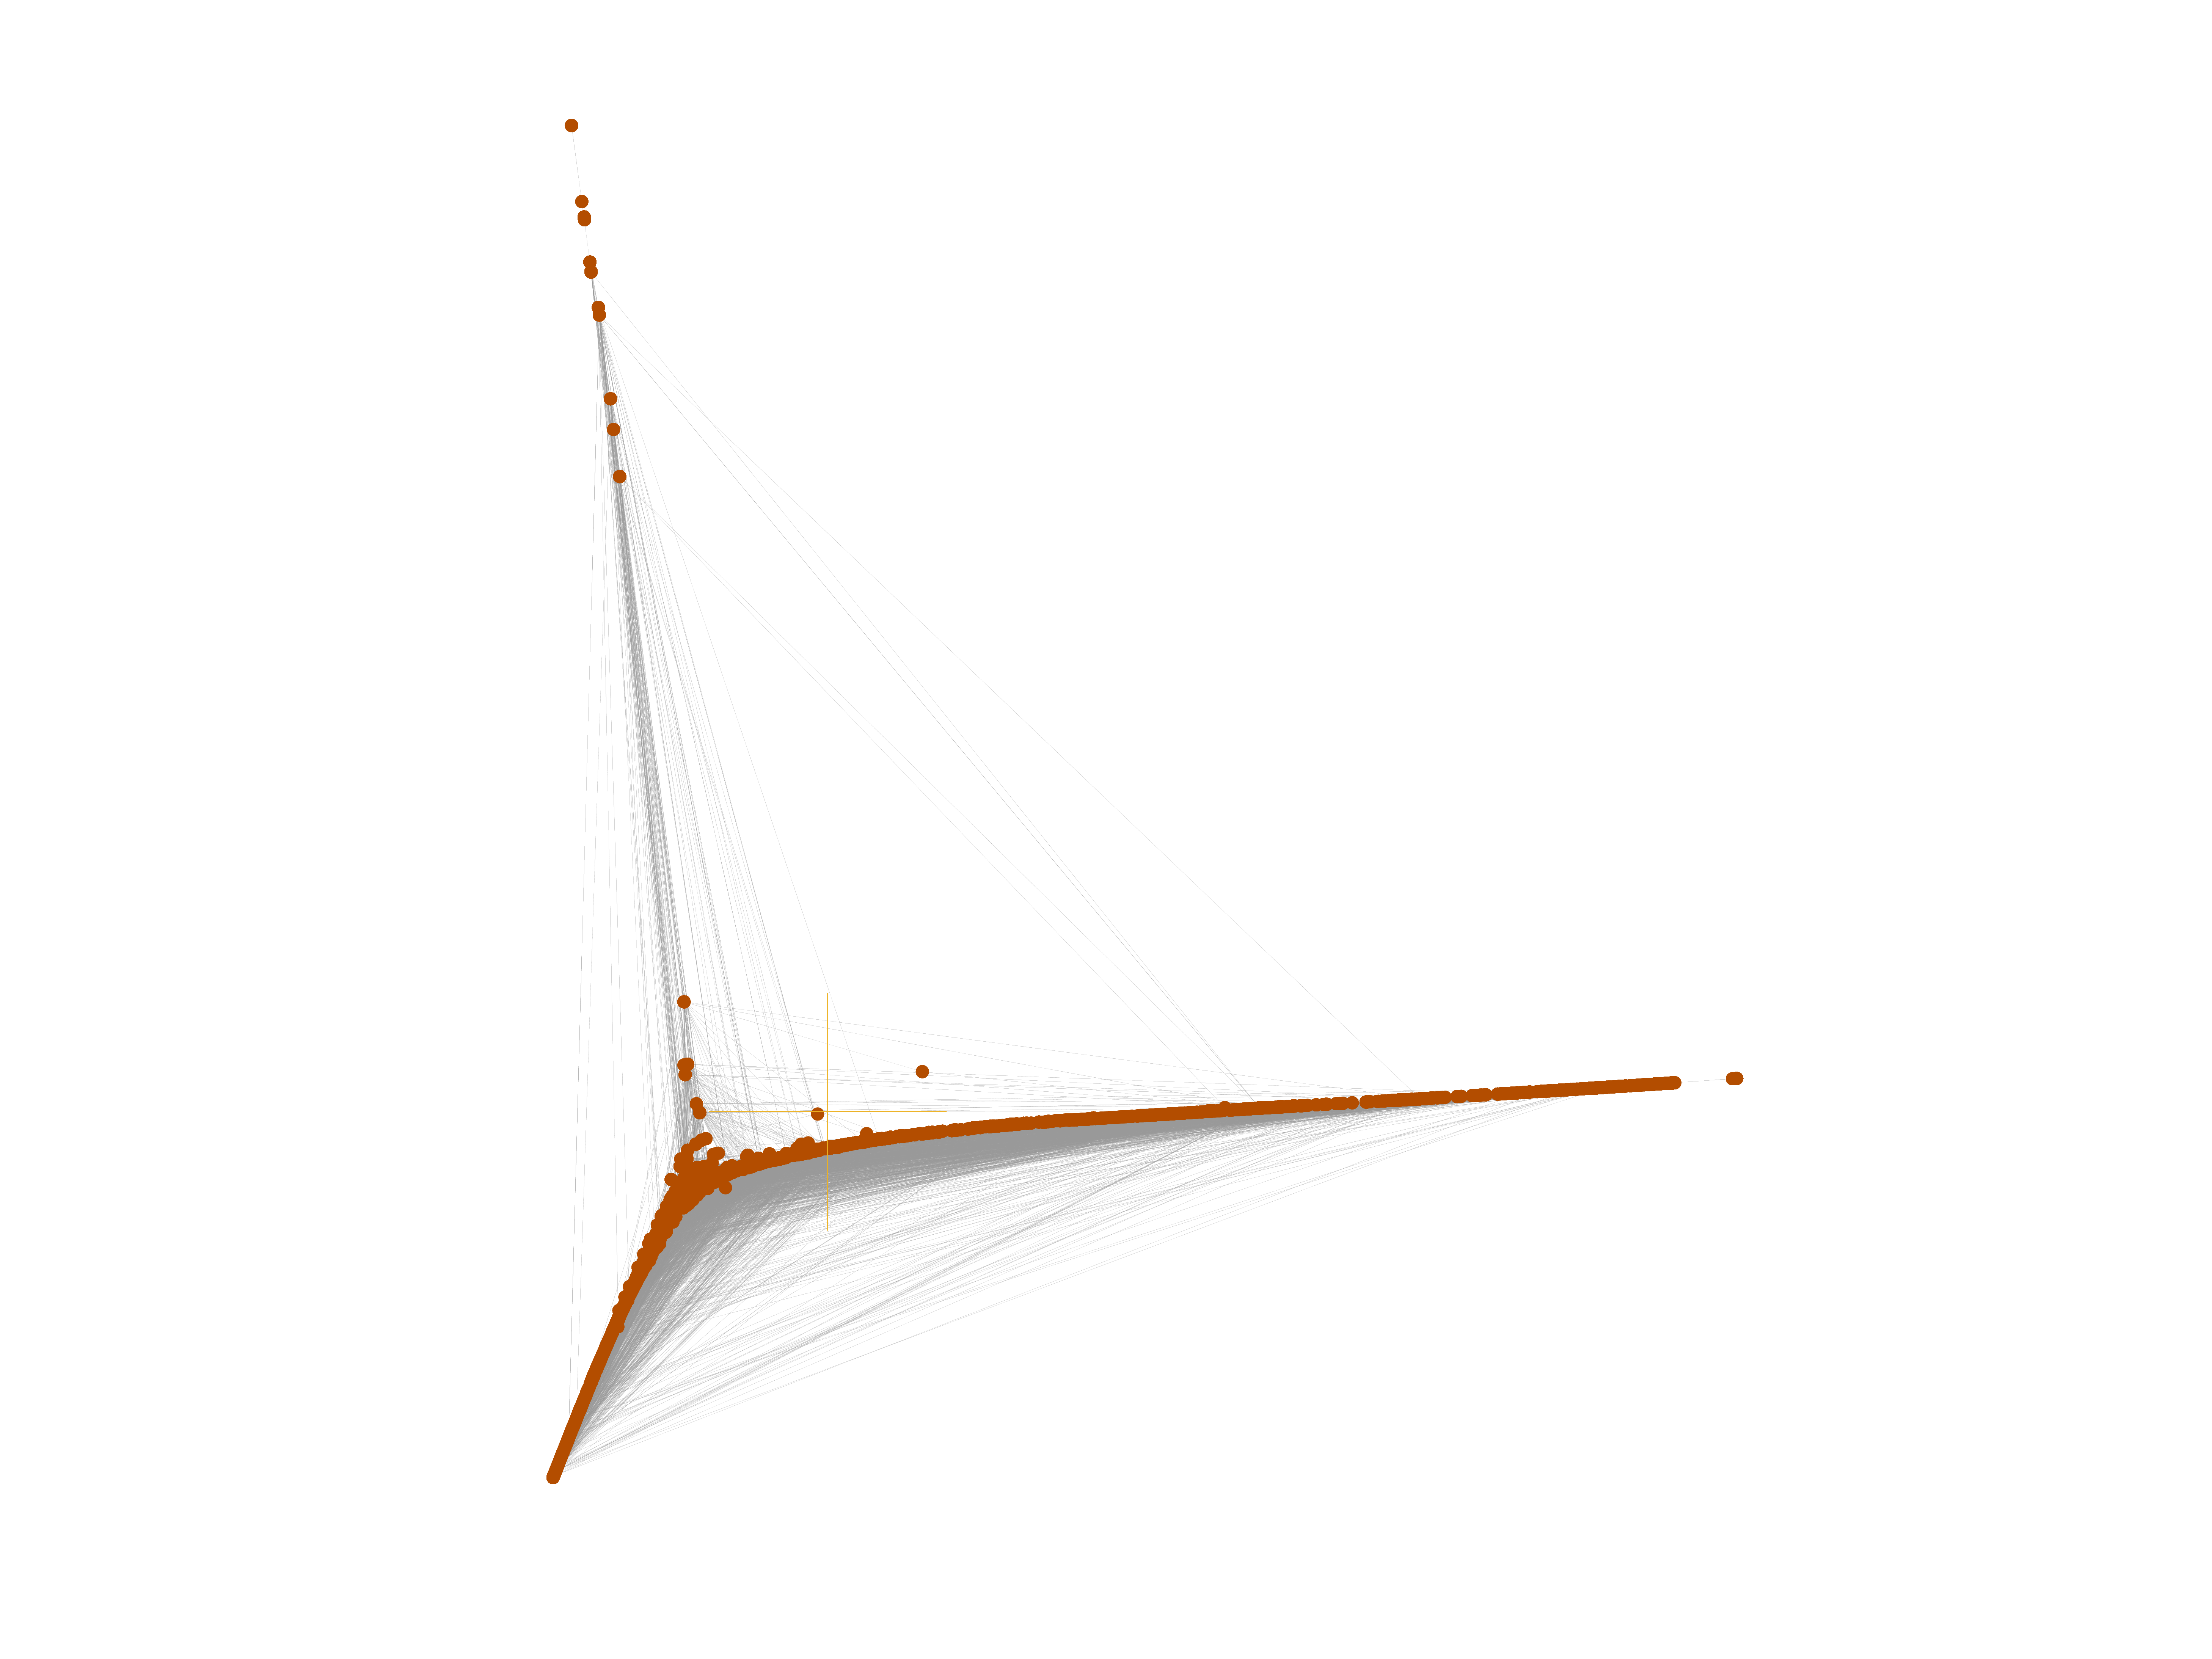
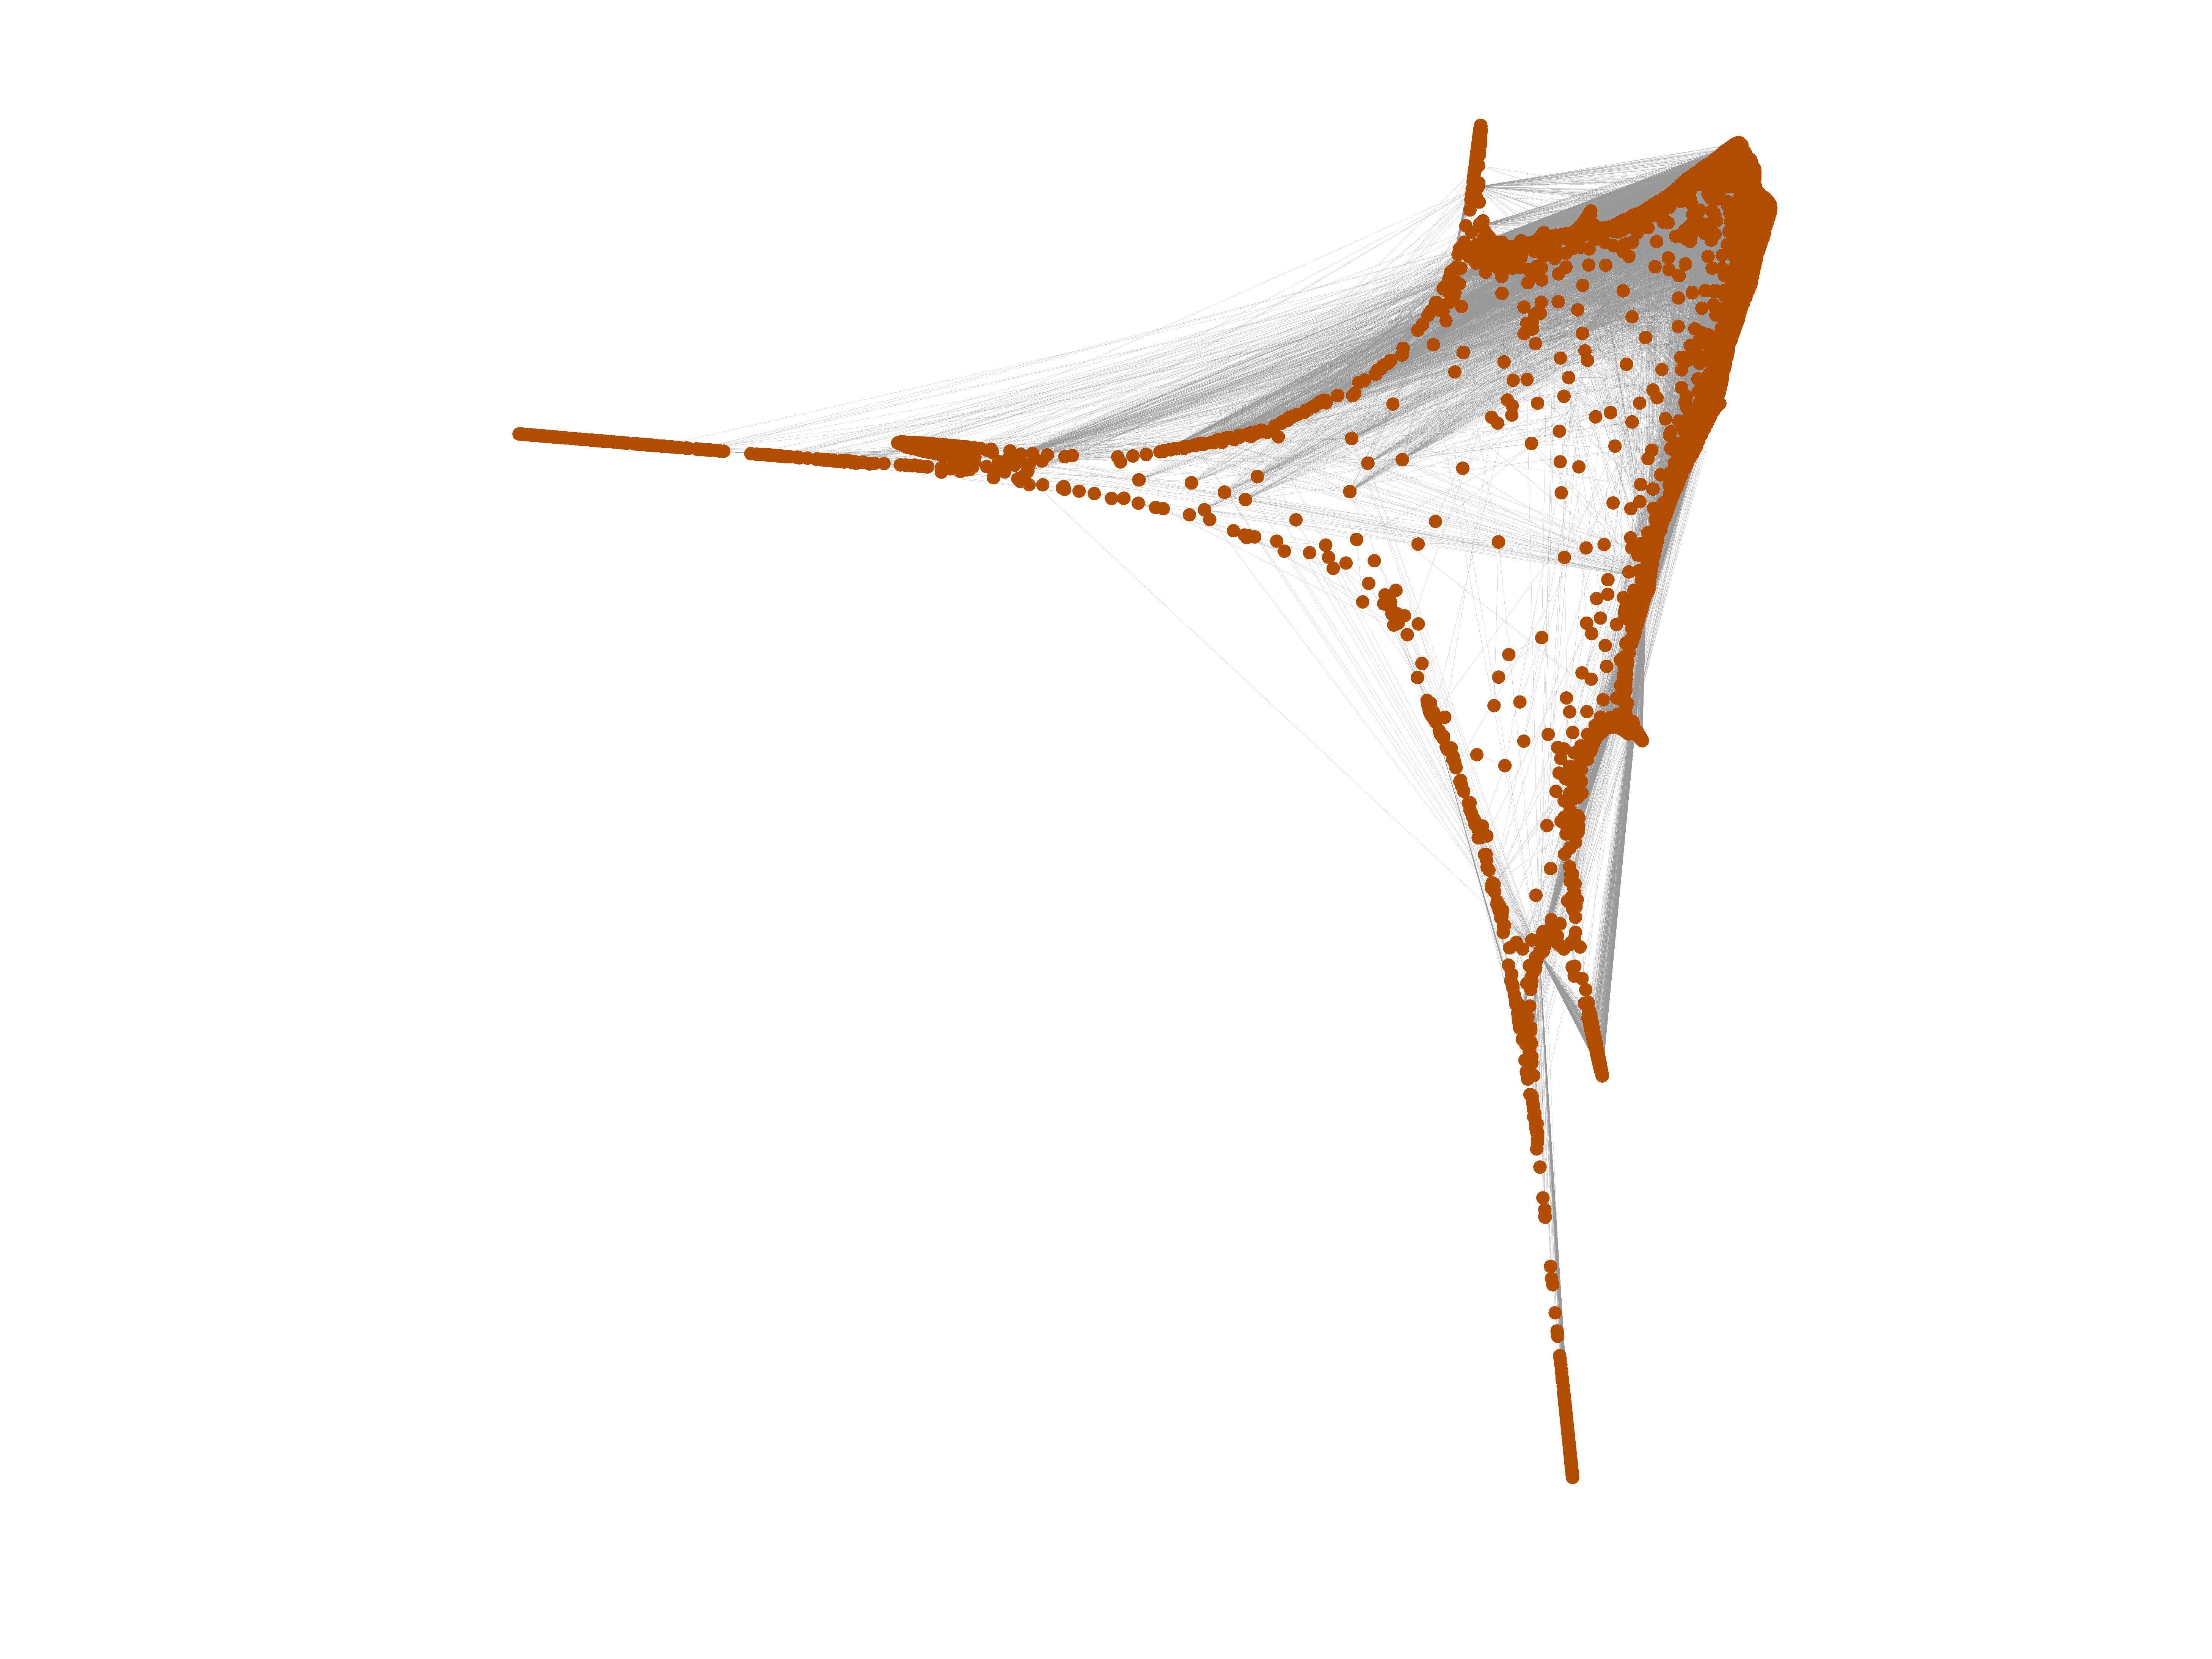
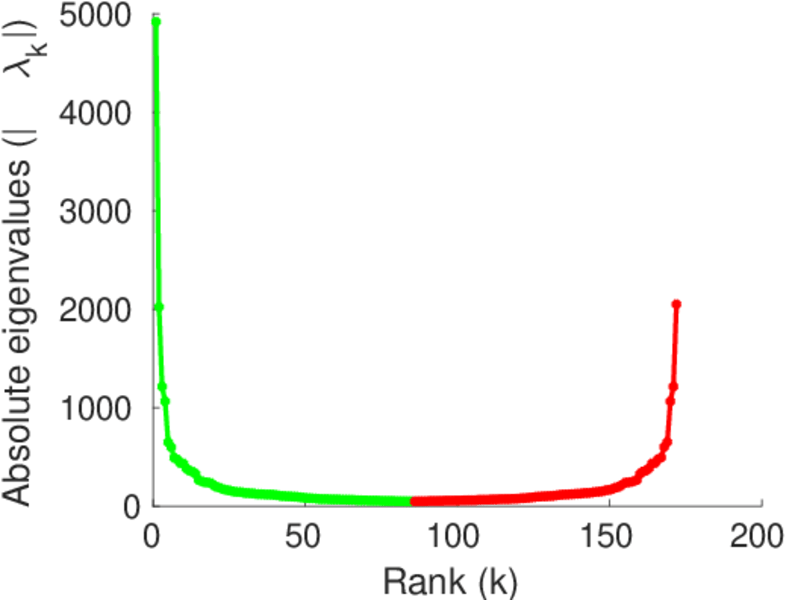
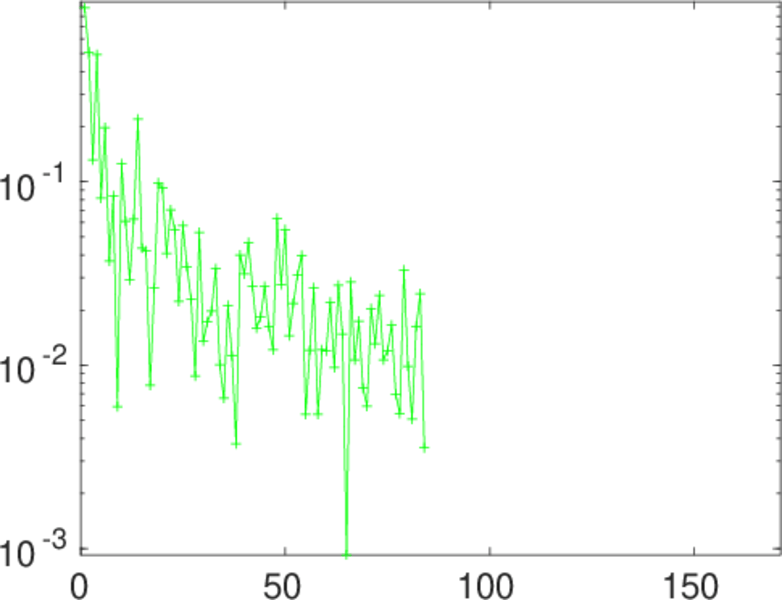
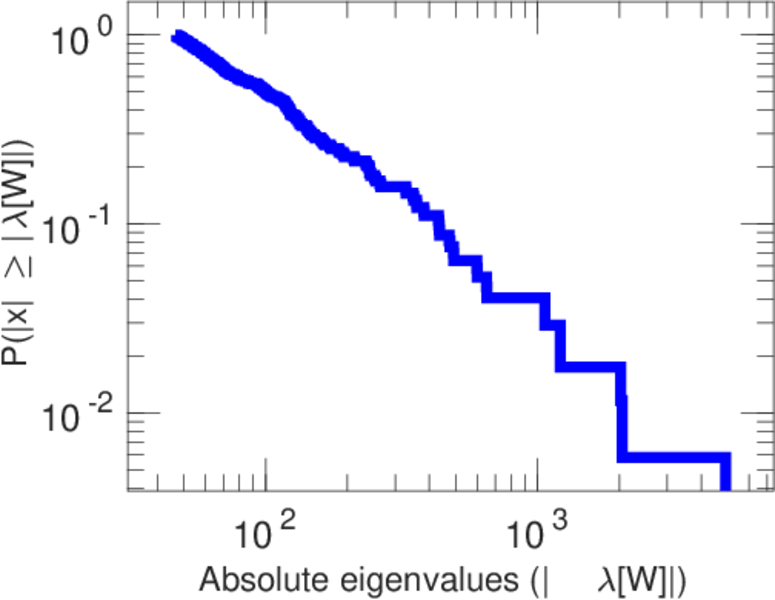
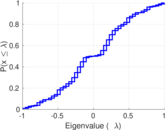
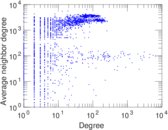
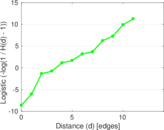
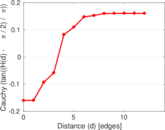
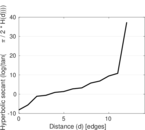
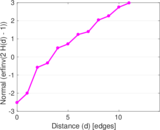
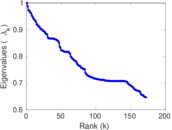
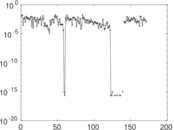
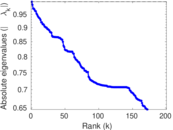
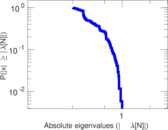
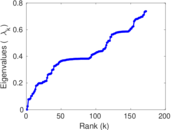
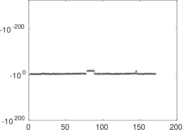
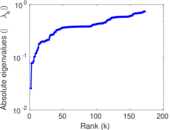
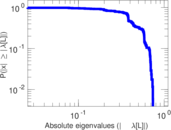
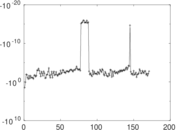
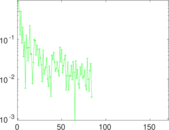
Plots
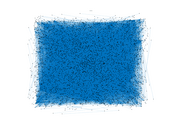


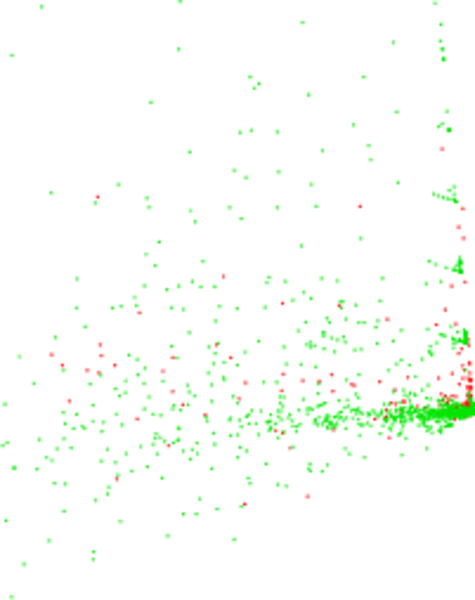
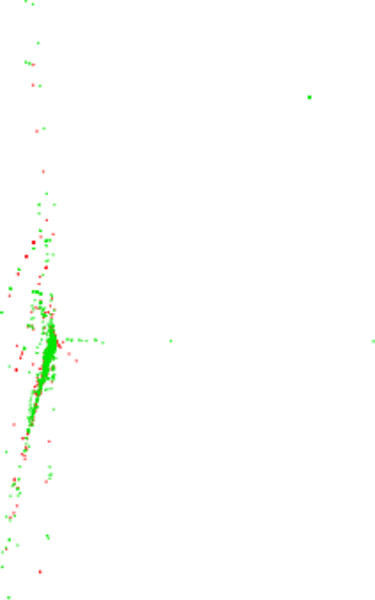
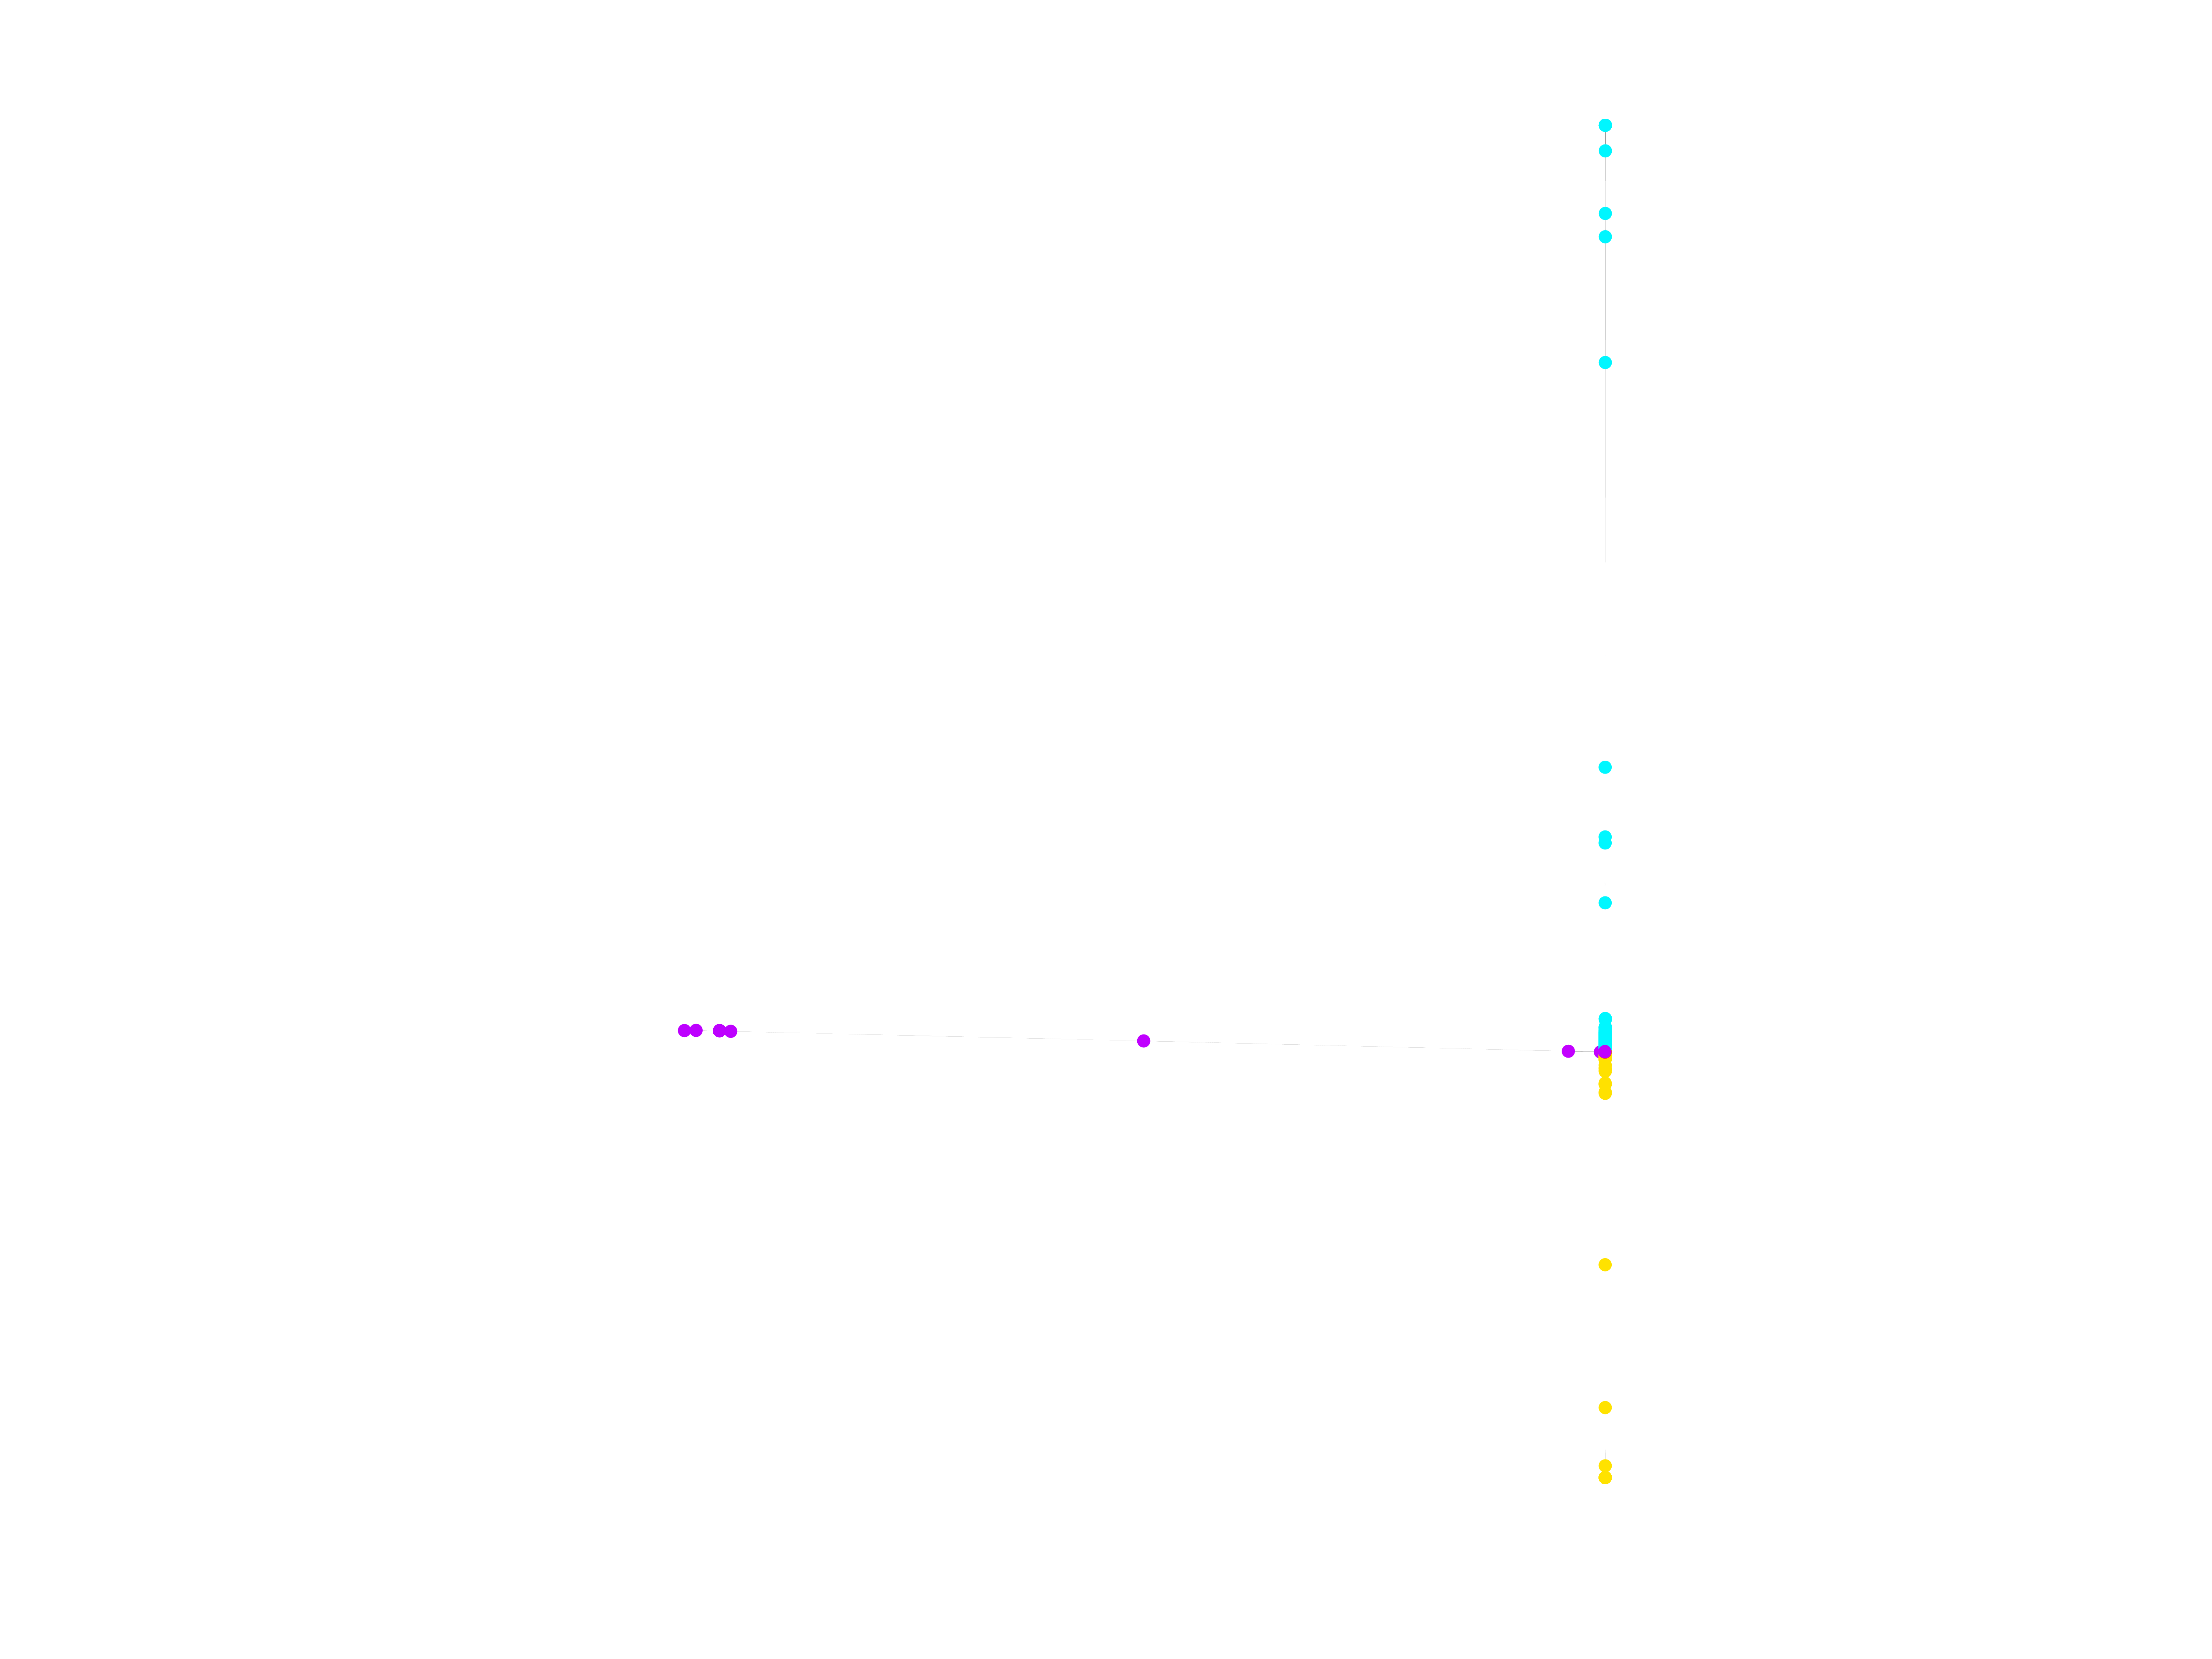
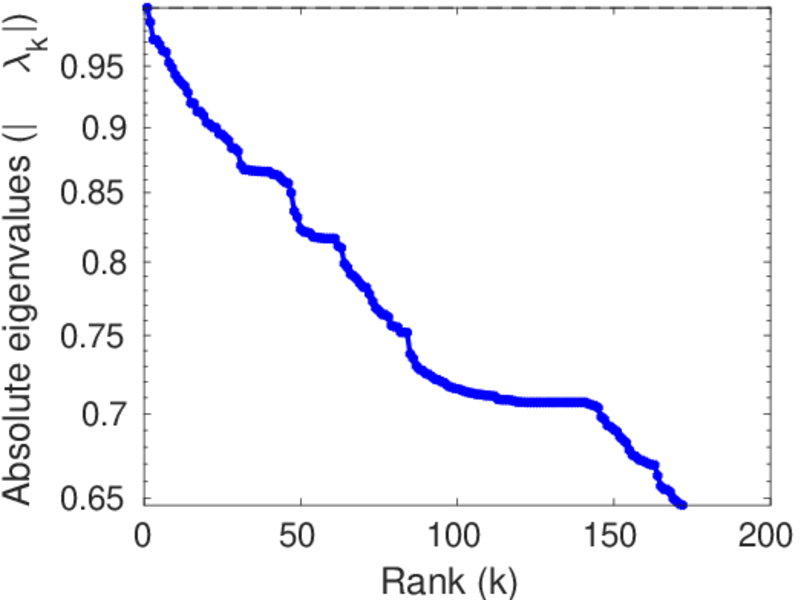
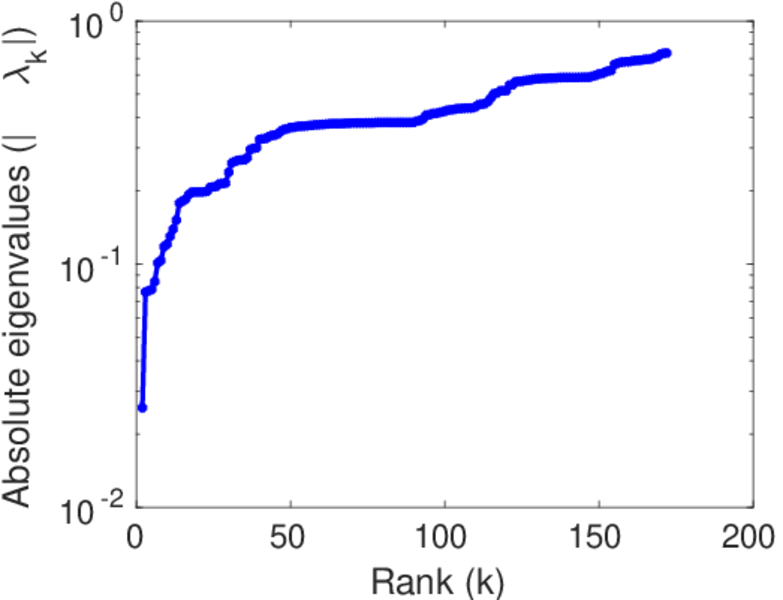
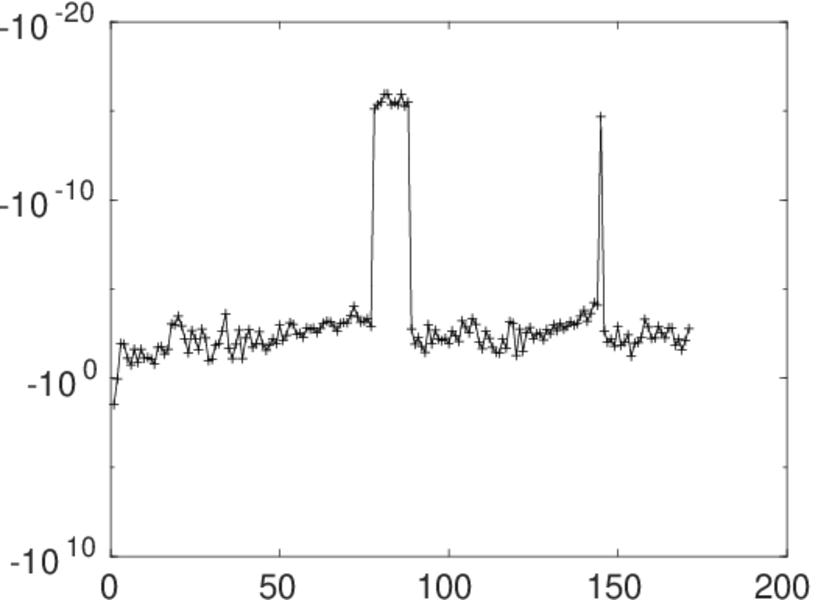
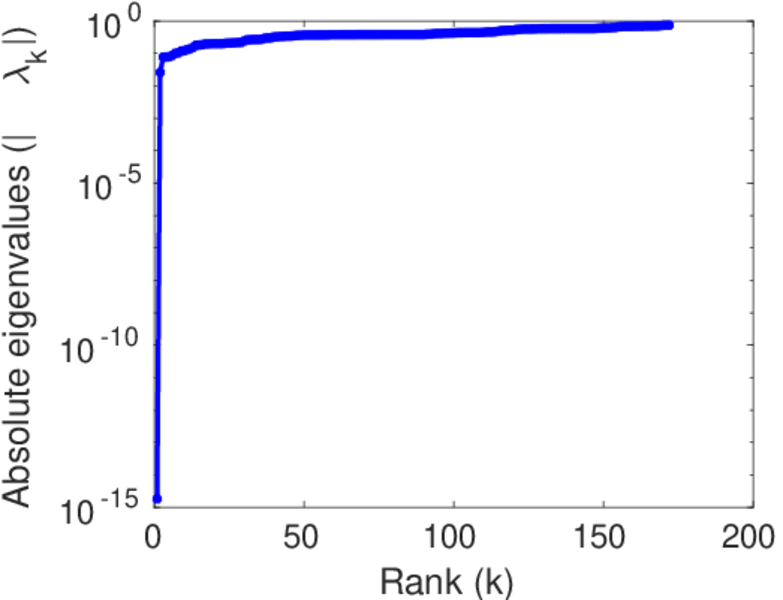
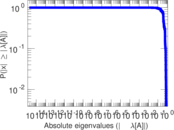
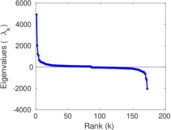
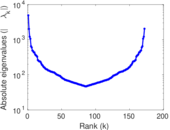
Matrix decompositions plots


Downloads
References
|
[1]
|
Jérôme Kunegis.
KONECT – The Koblenz Network Collection.
In Proc. Int. Conf. on World Wide Web Companion, pages
1343–1350, 2013.
[ http ]
|
|
[2]
|
Wikimedia Foundation.
Wikimedia downloads.
http://dumps.wikimedia.org/, January 2010.
|
 KONECT ‣ Networks ‣
Buy Me a Coffee
KONECT ‣ Networks ‣
Buy Me a Coffee