Wiktionary edits (na)
This is the bipartite edit network of the Nauru Wiktionary. It contains users
and pages from the Nauru Wiktionary, connected by edit events. Each edge
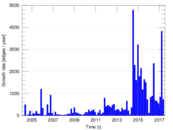
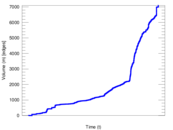
represents an edit. The dataset includes the timestamp of each edit.
Metadata
Statistics
| Size | n = | 1,717
|
| Left size | n1 = | 185
|
| Right size | n2 = | 1,532
|
| Volume | m = | 7,094
|
| Unique edge count | m̿ = | 3,300
|
| Wedge count | s = | 483,061
|
| Claw count | z = | 74,498,276
|
| Cross count | x = | 9,814,188,497
|
| Square count | q = | 245,993
|
| 4-Tour count | T4 = | 3,907,176
|
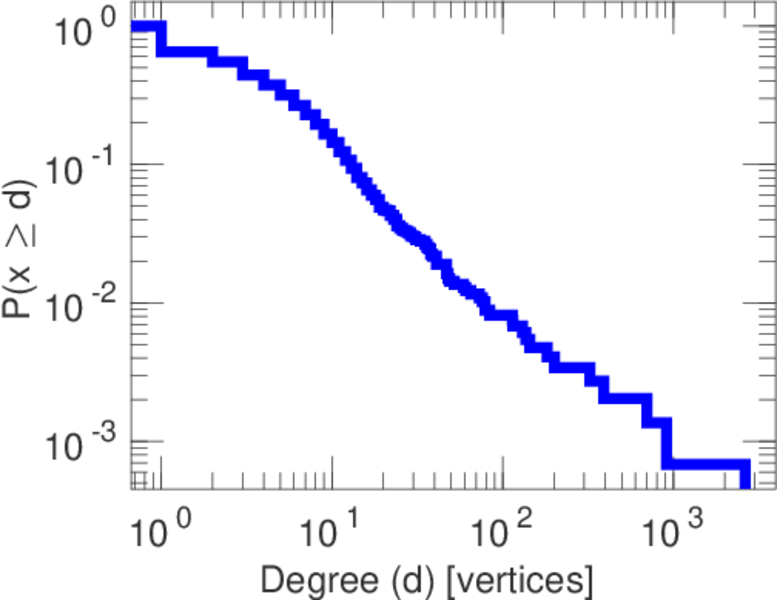
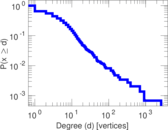
| Maximum degree | dmax = | 2,642
|
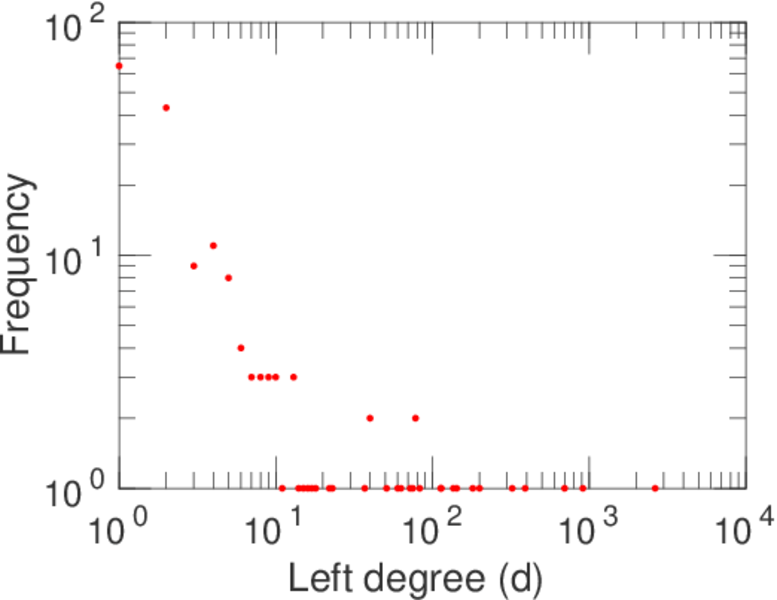
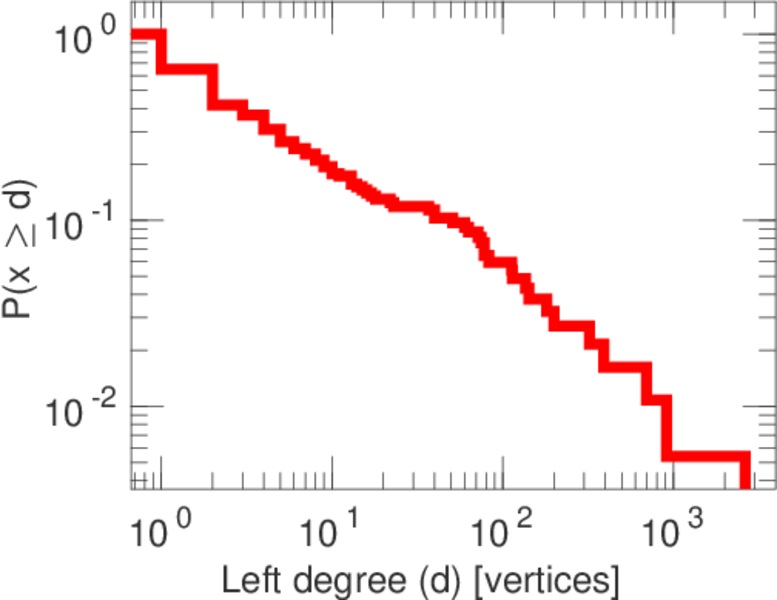
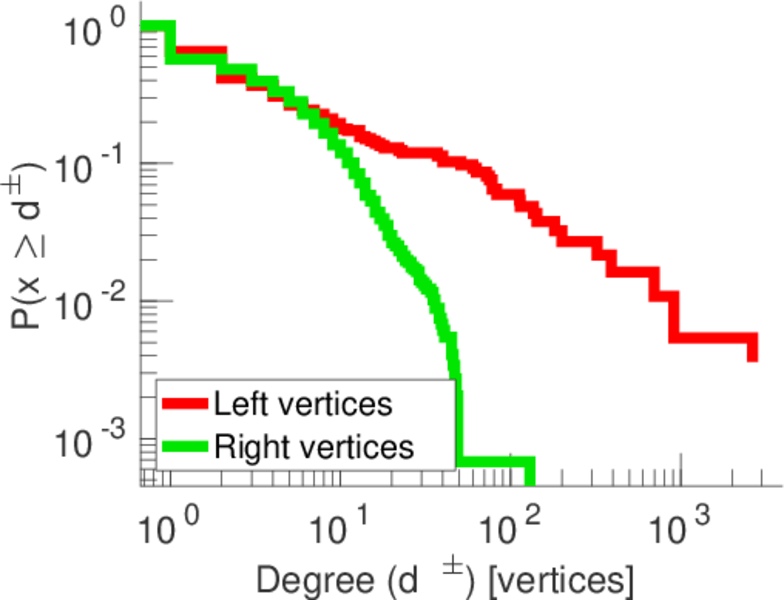
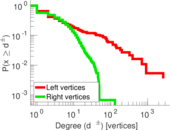
| Maximum left degree | d1max = | 2,642
|
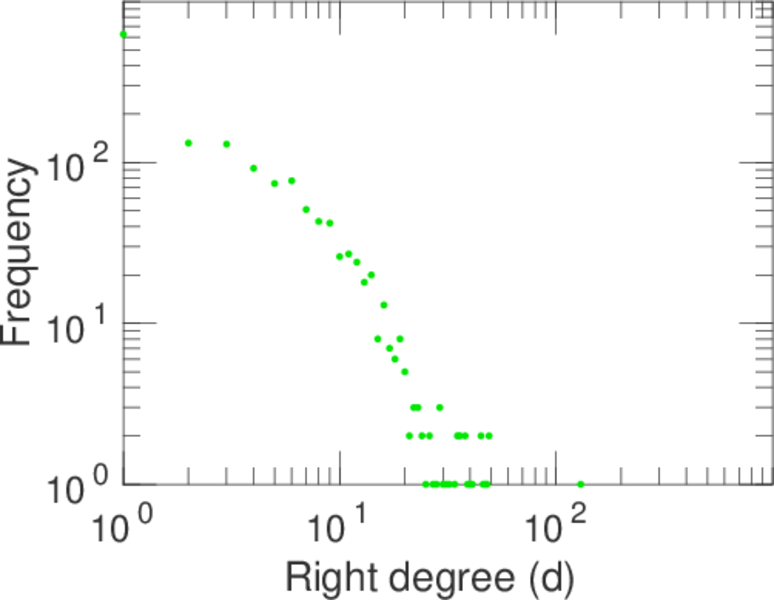
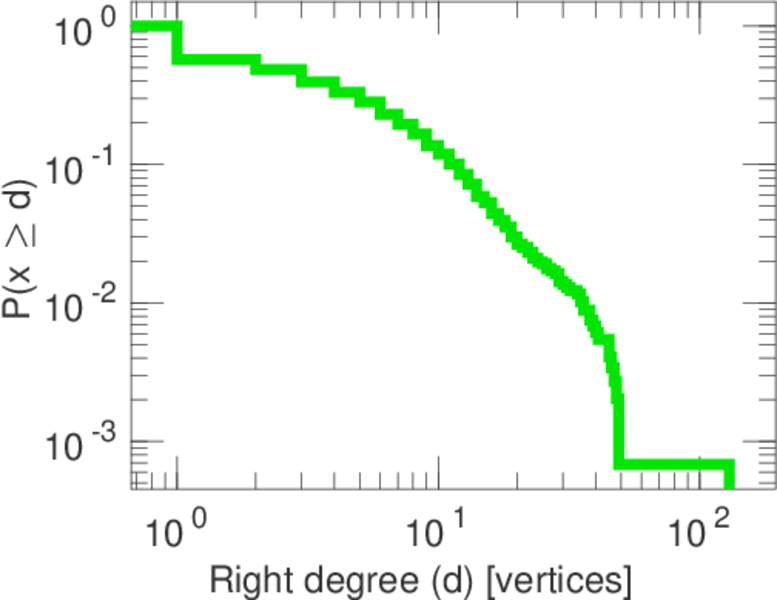
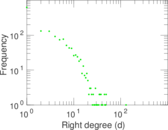
| Maximum right degree | d2max = | 130
|
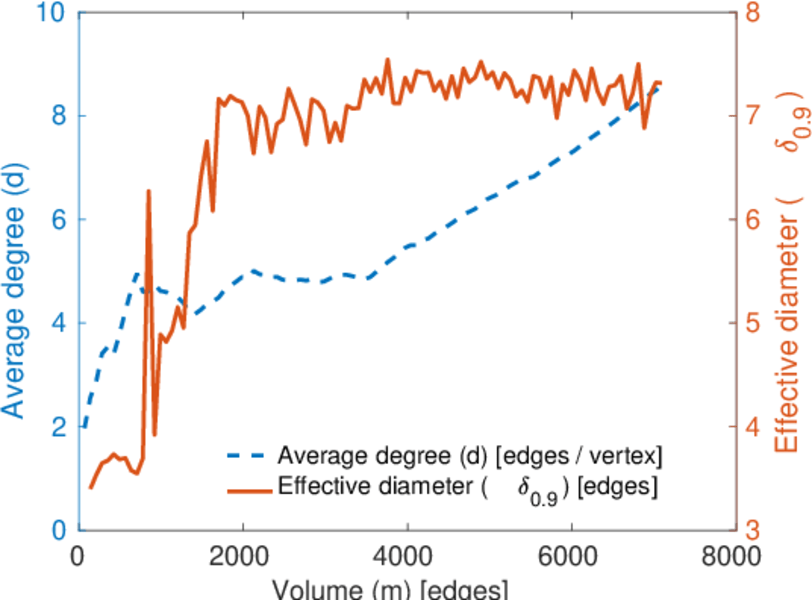
| Average degree | d = | 8.263 25
|
| Average left degree | d1 = | 38.345 9
|
| Average right degree | d2 = | 4.630 55
|
| Fill | p = | 0.011 643 5
|
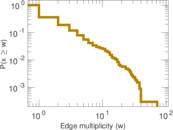
| Average edge multiplicity | m̃ = | 2.149 70
|
| Size of LCC | N = | 1,353
|
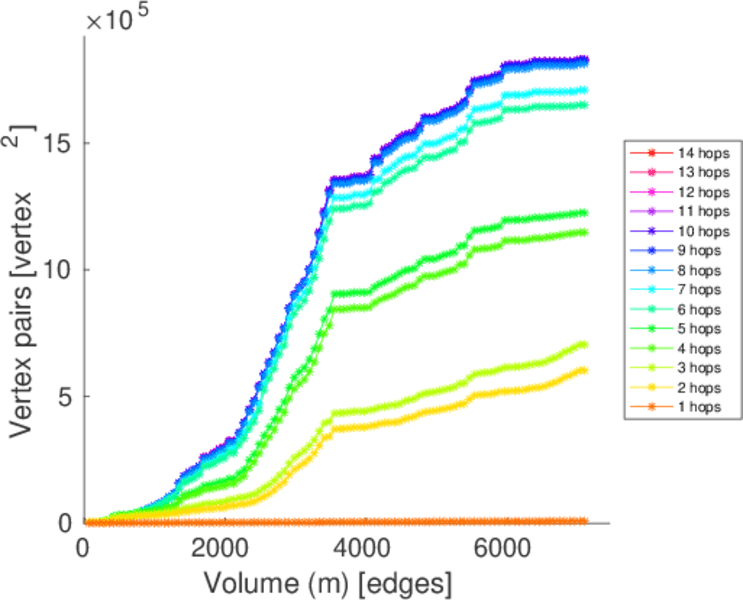
| Diameter | δ = | 13
|
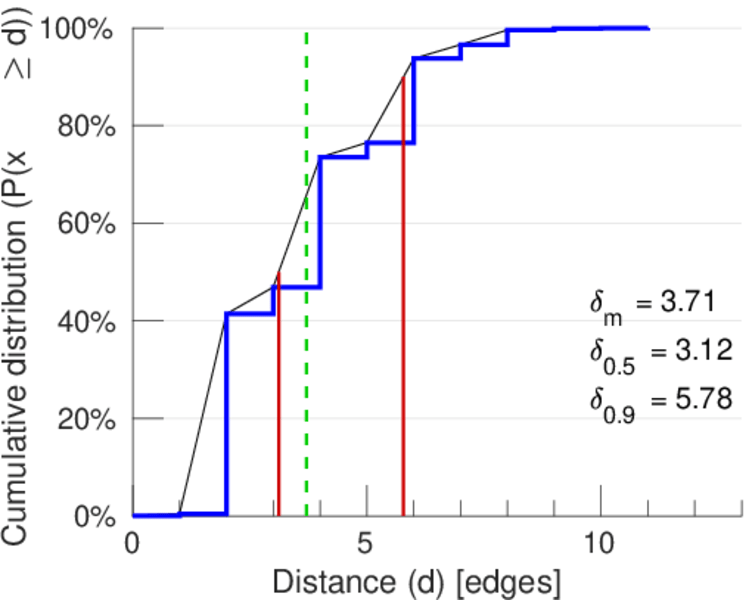
| 50-Percentile effective diameter | δ0.5 = | 3.117 19
|
| 90-Percentile effective diameter | δ0.9 = | 5.783 08
|
| Median distance | δM = | 4
|
| Mean distance | δm = | 3.714 05
|
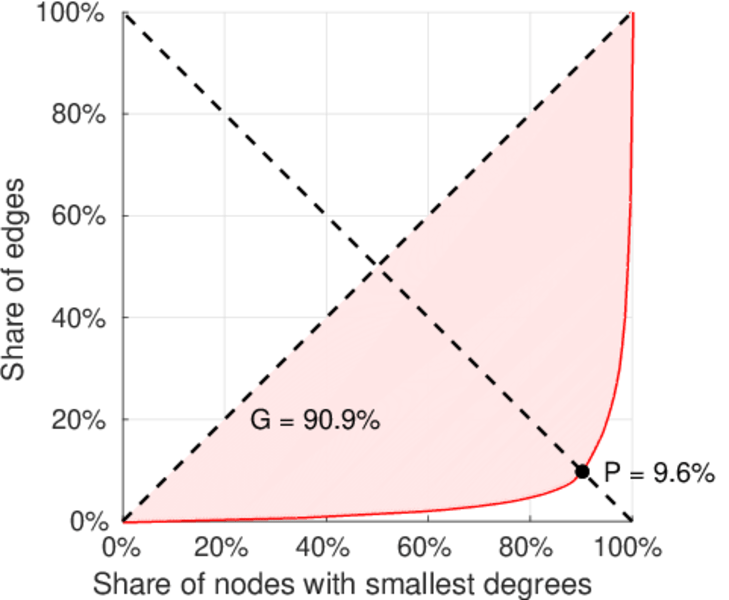
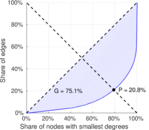
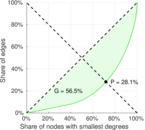
| Gini coefficient | G = | 0.744 391
|
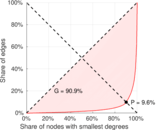
| Balanced inequality ratio | P = | 0.213 772
|
| Left balanced inequality ratio | P1 = | 0.095 855 7
|
| Right balanced inequality ratio | P2 = | 0.281 083
|
| Relative edge distribution entropy | Her = | 0.783 066
|
| Power law exponent | γ = | 2.571 93
|
| Tail power law exponent | γt = | 2.871 00
|
| Tail power law exponent with p | γ3 = | 2.871 00
|
| p-value | p = | 0.000 00
|
| Left tail power law exponent with p | γ3,1 = | 1.661 00
|
| Left p-value | p1 = | 0.394 000
|
| Right tail power law exponent with p | γ3,2 = | 4.571 00
|
| Right p-value | p2 = | 0.630 000
|
| Degree assortativity | ρ = | −0.039 118 3
|
| Degree assortativity p-value | pρ = | 0.024 628 5
|
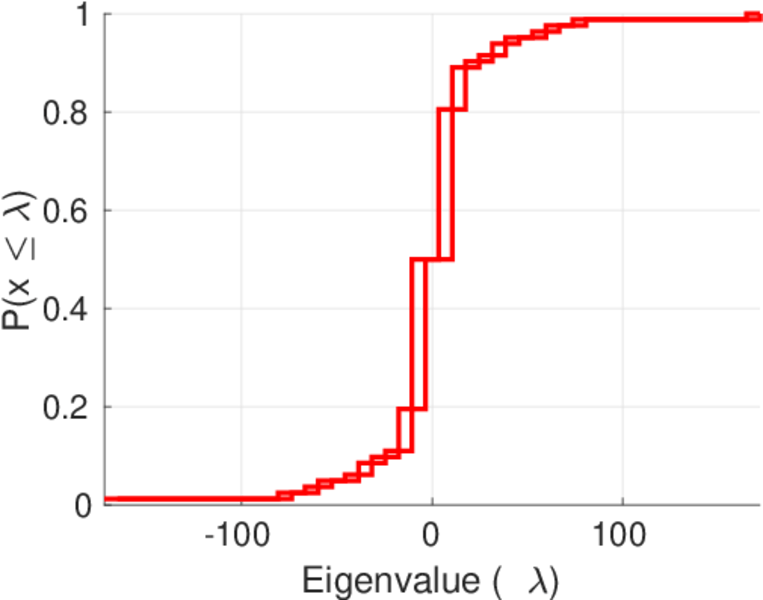
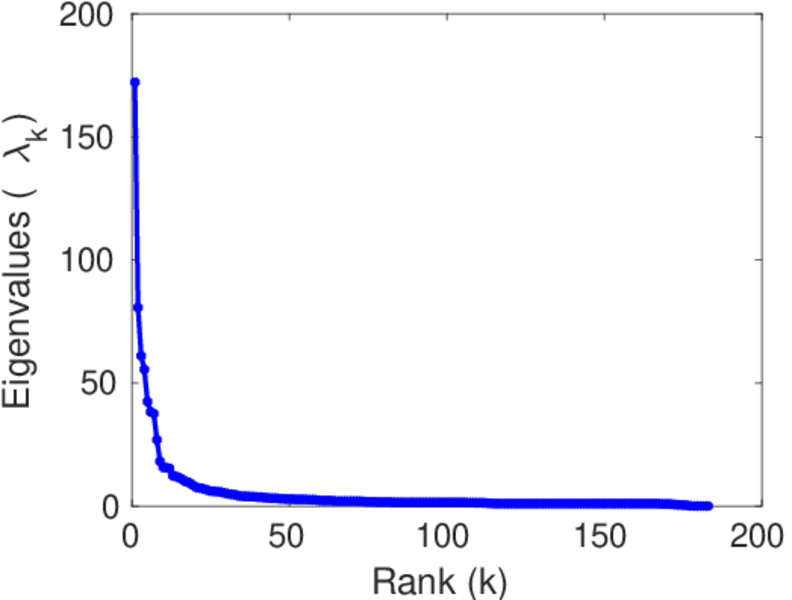
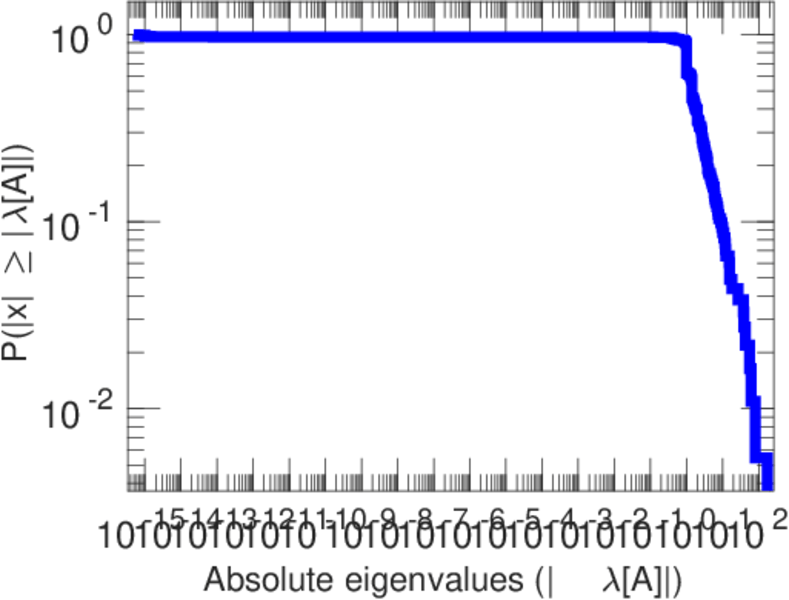
| Spectral norm | α = | 172.125
|
| Algebraic connectivity | a = | 0.014 100 6
|
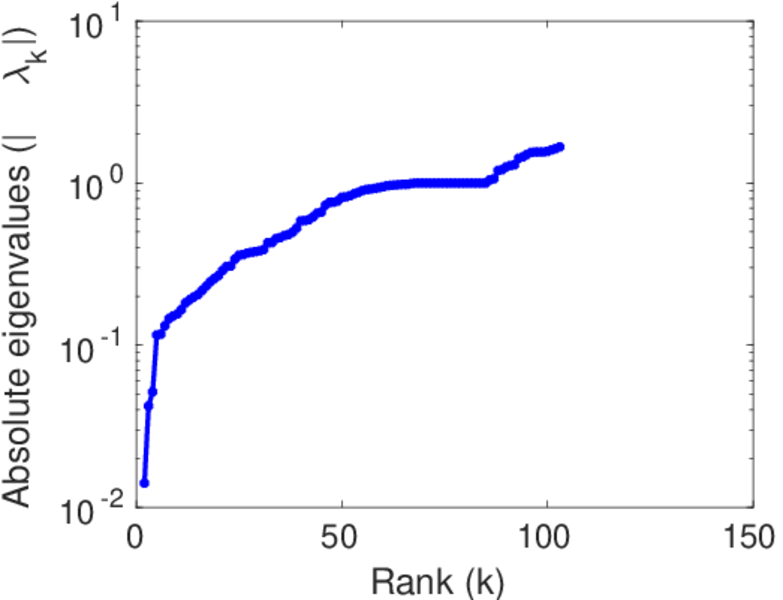
| Spectral separation | |λ1[A] / λ2[A]| = | 2.134 72
|
| Controllability | C = | 1,300
|
| Relative controllability | Cr = | 0.785 973
|
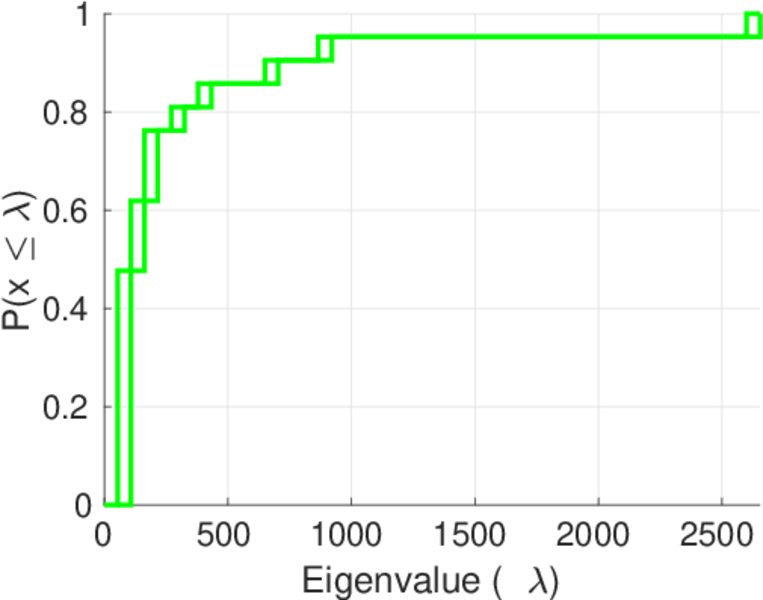
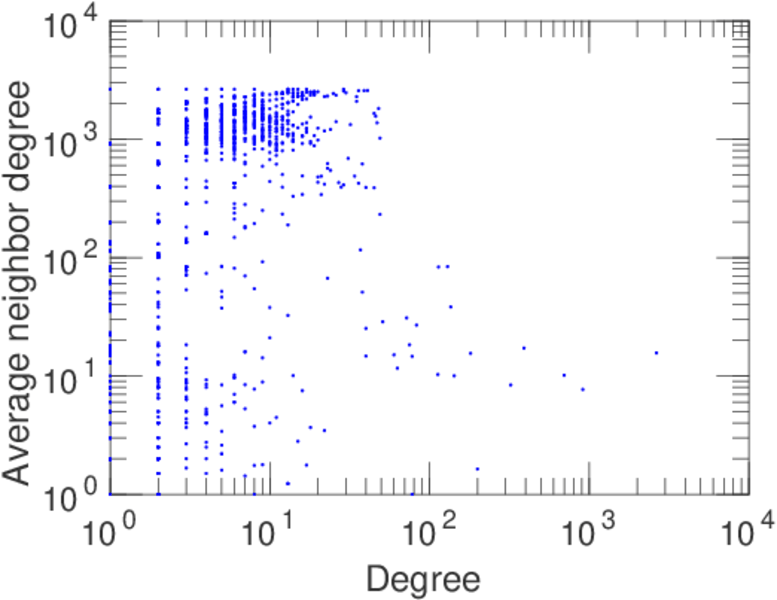
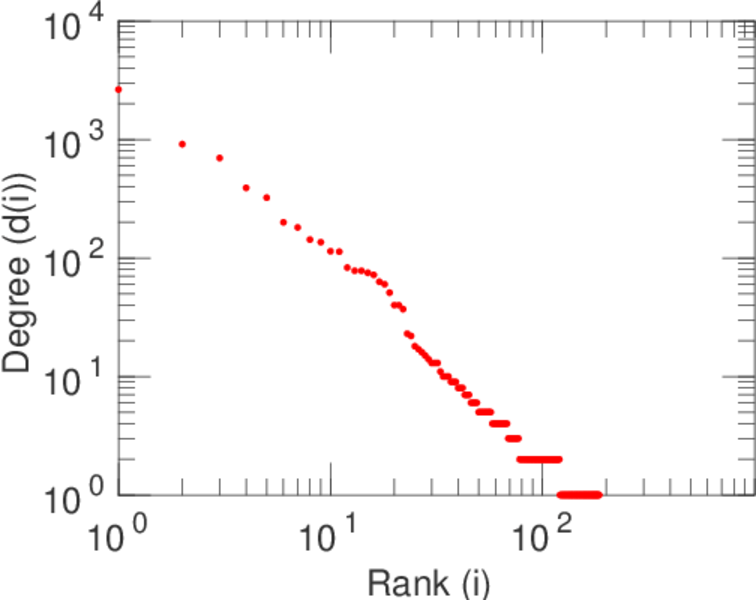
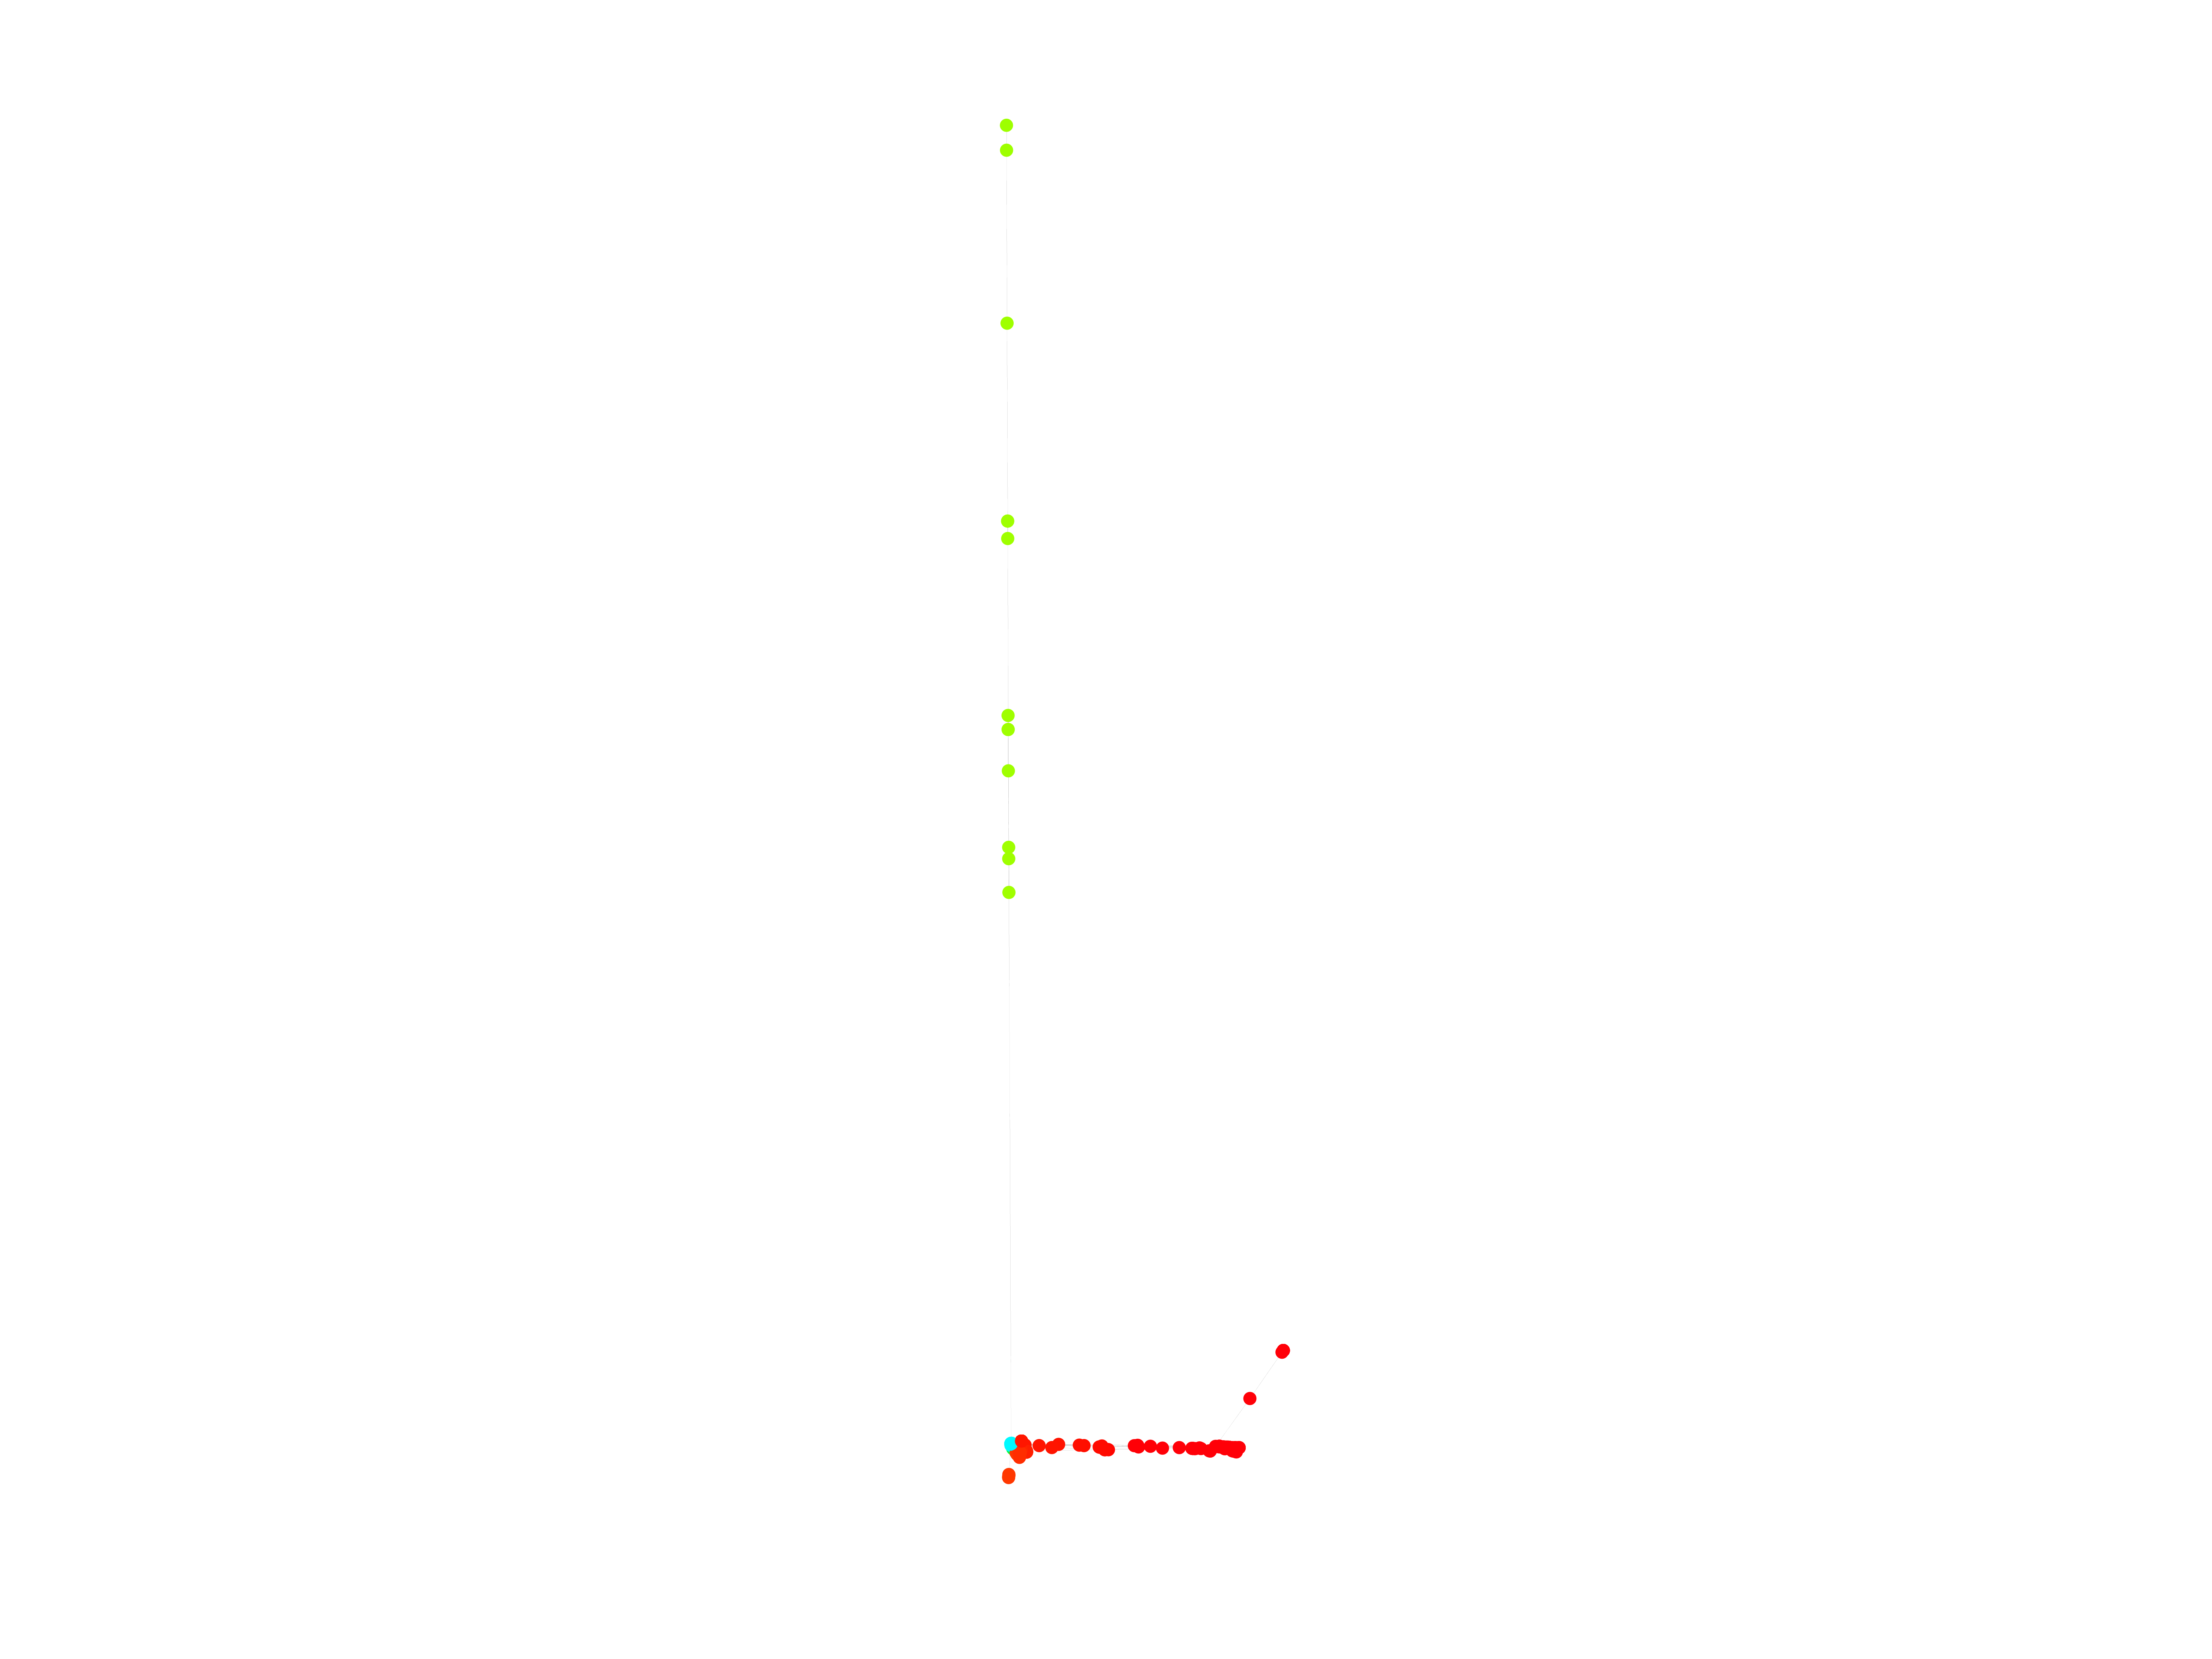
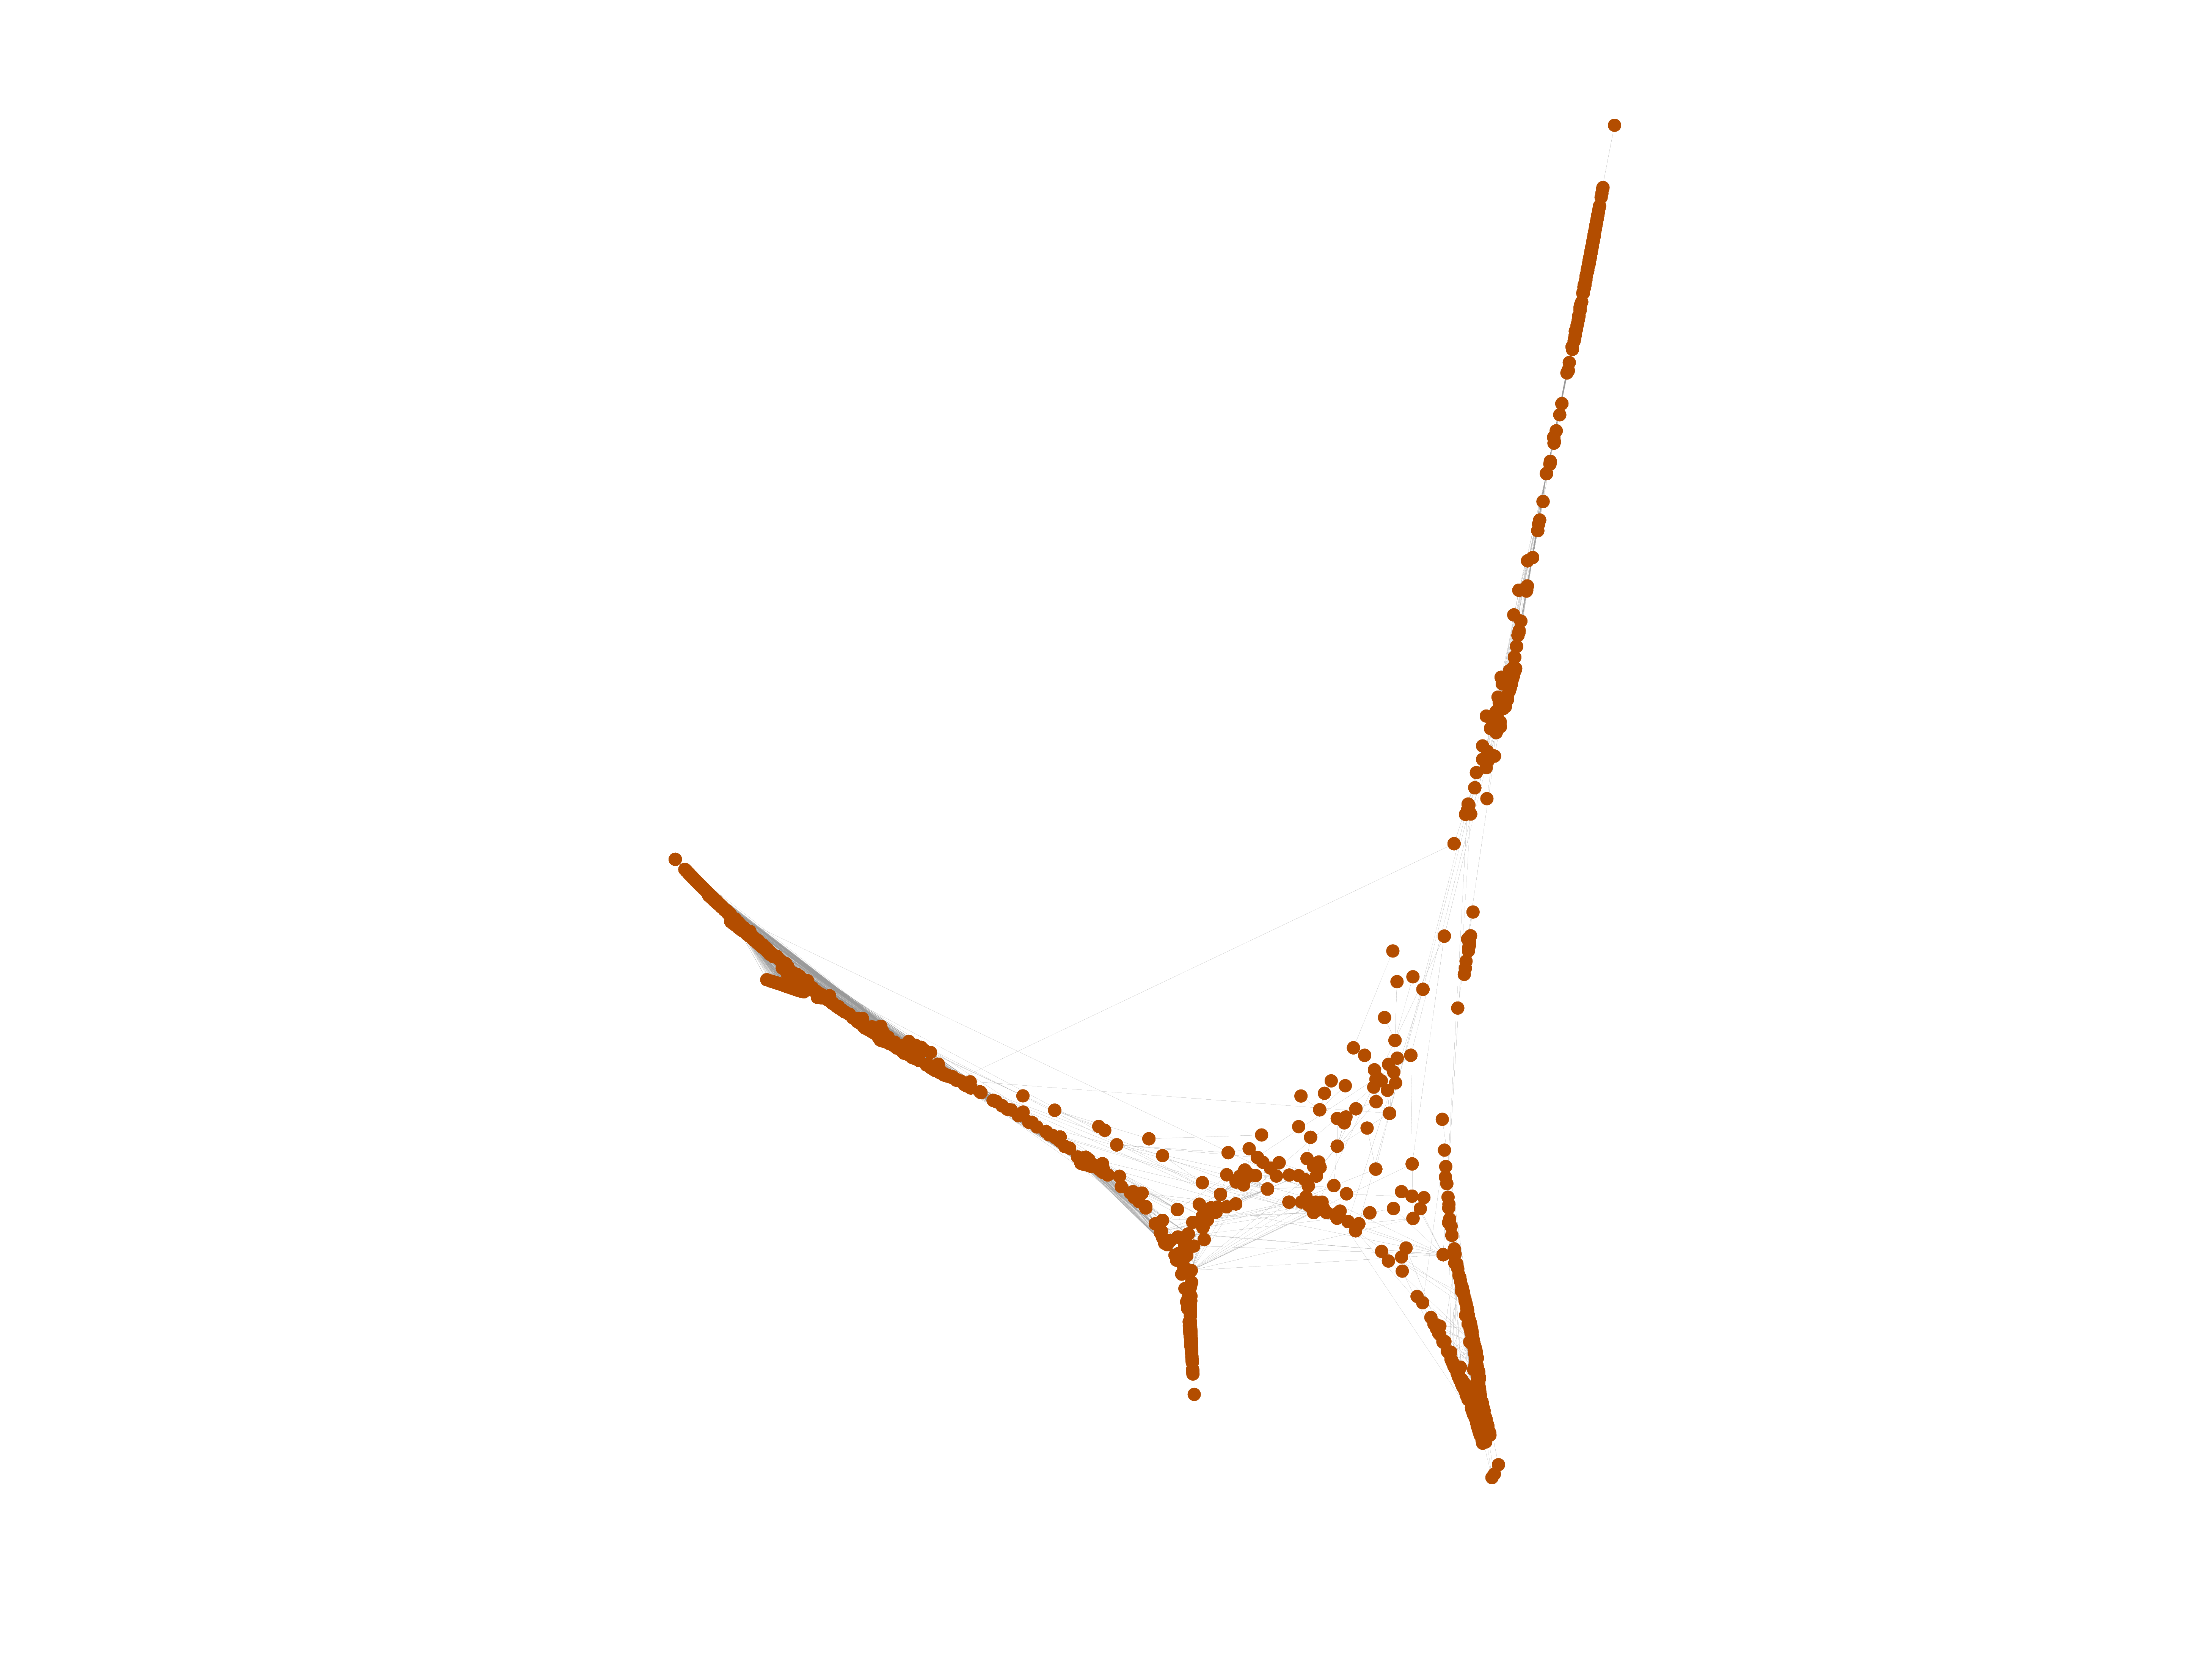
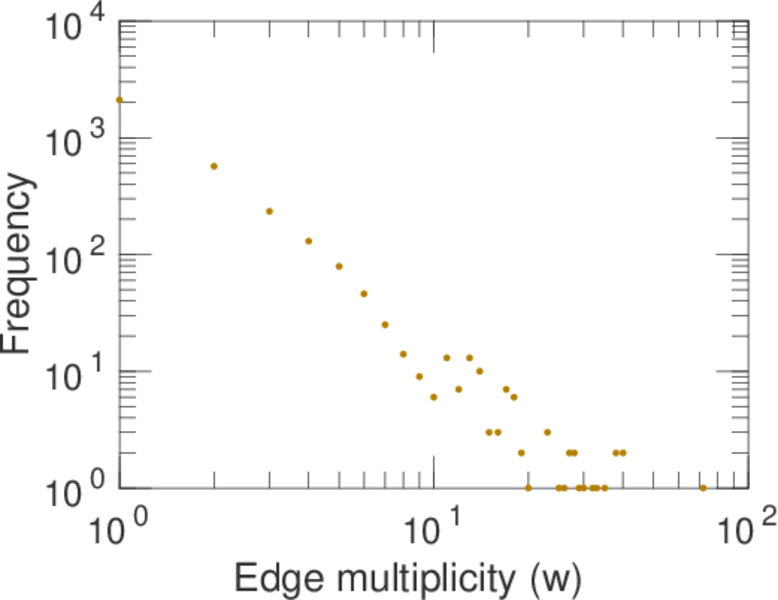
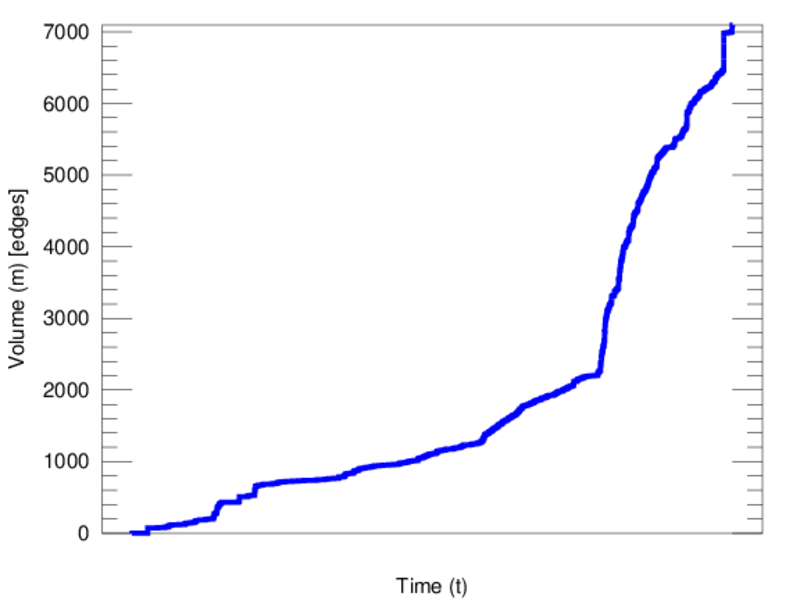
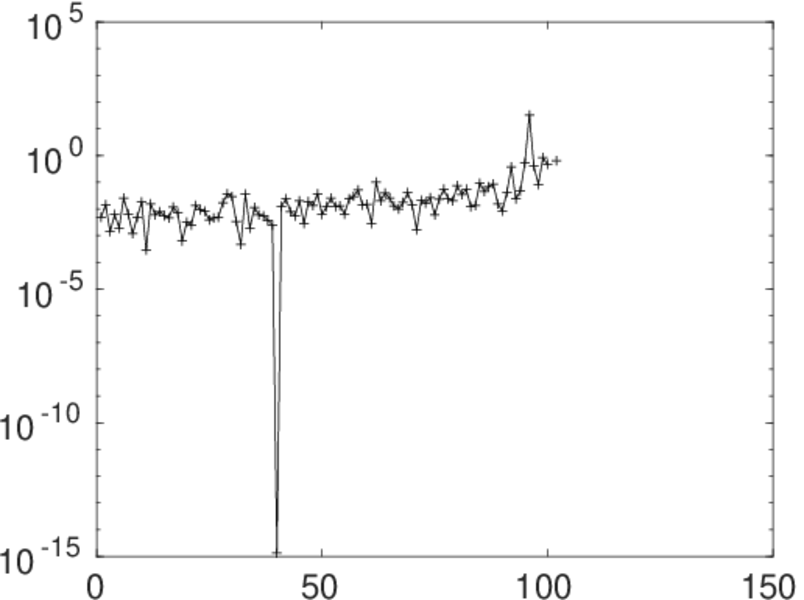
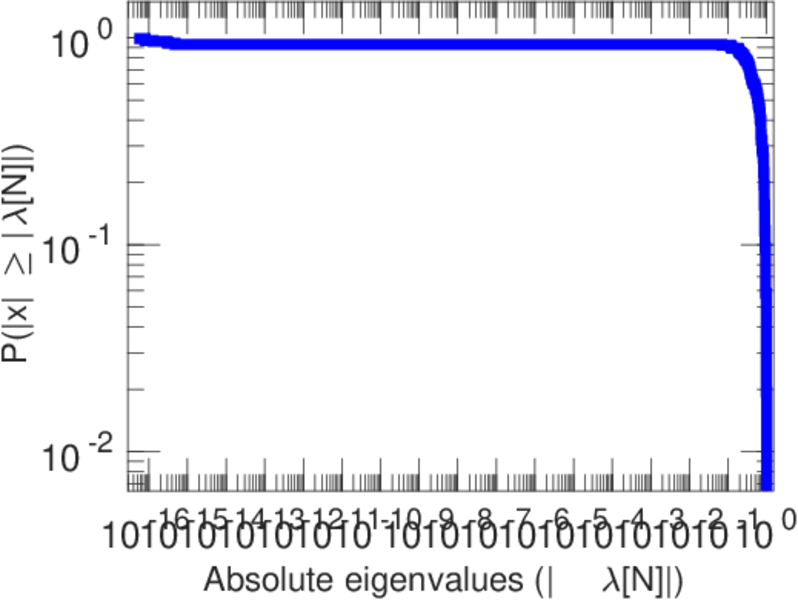
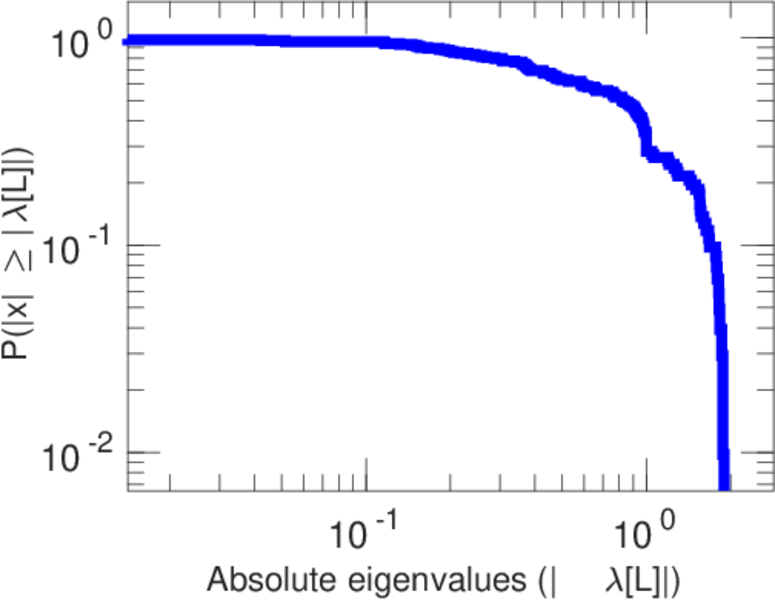
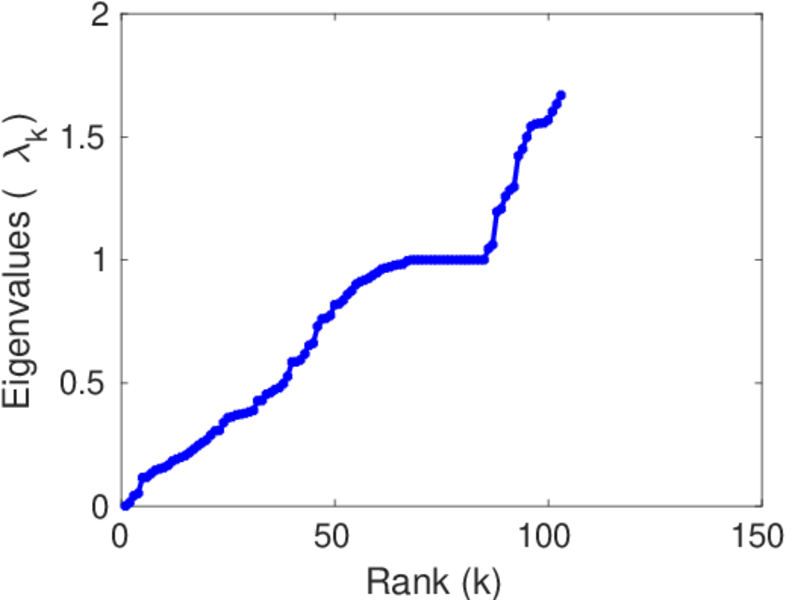
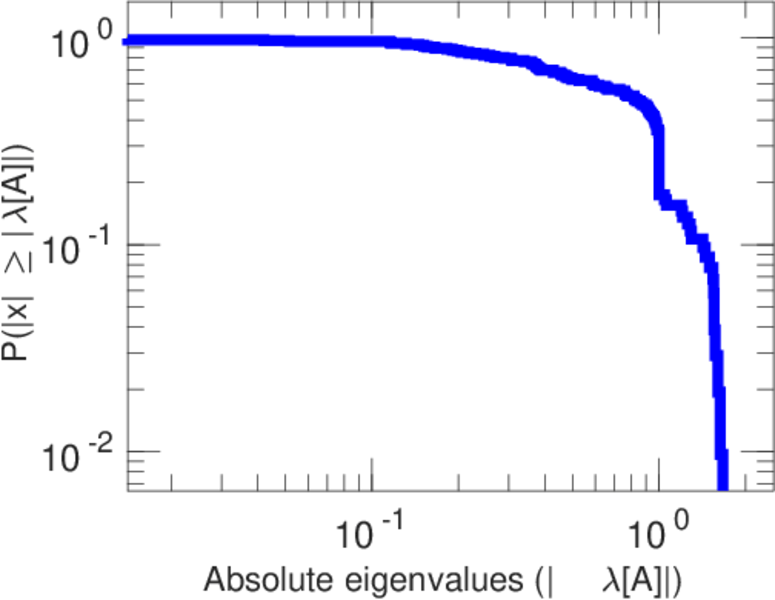
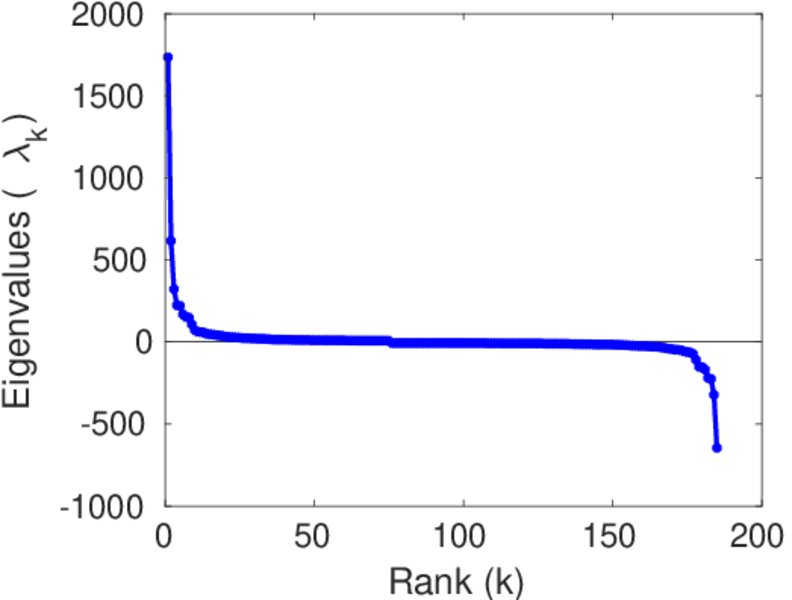
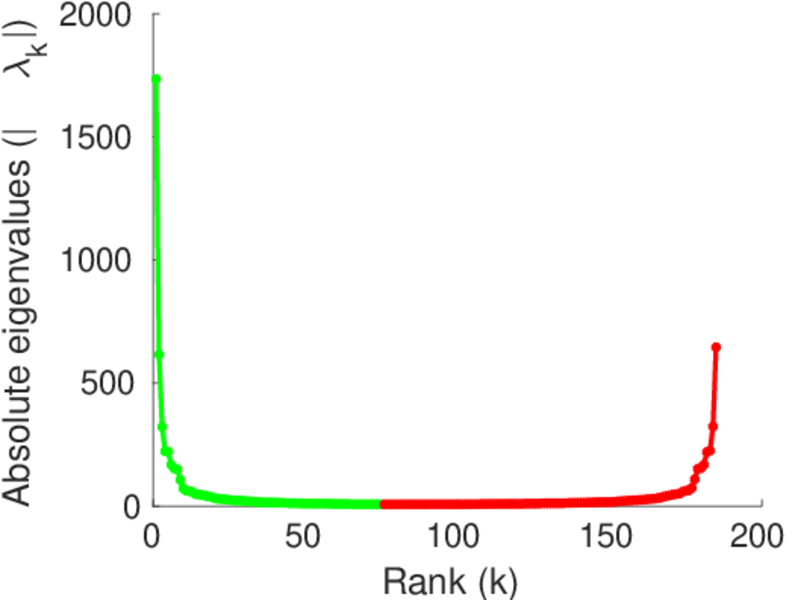
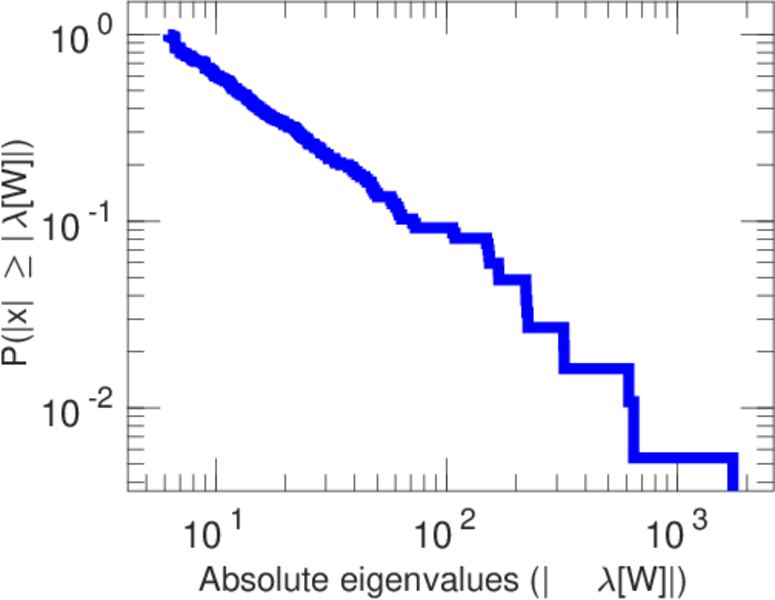
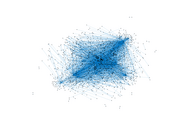
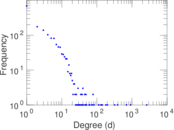
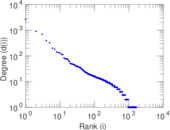
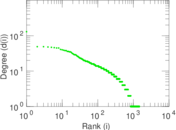
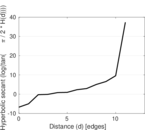
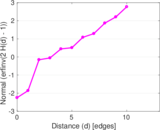
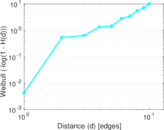
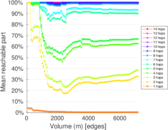
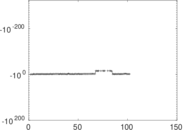
Plots


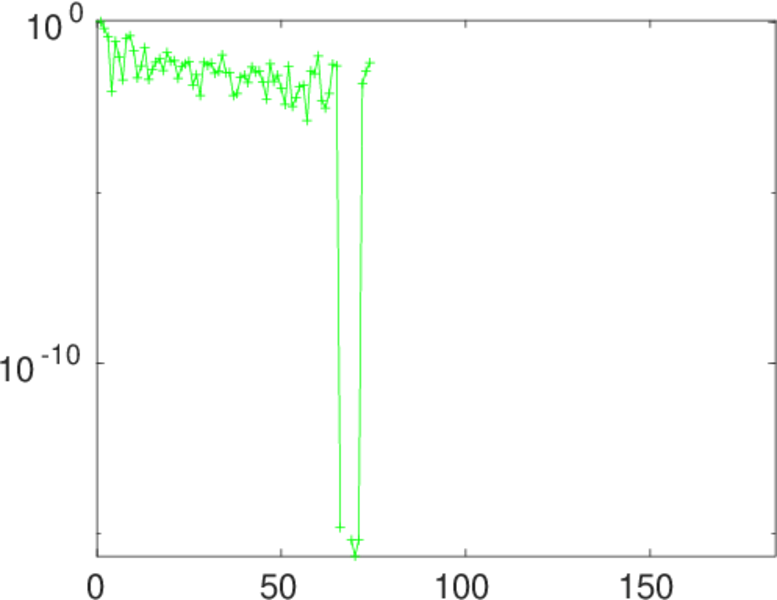
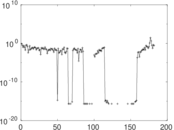
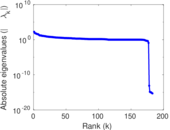
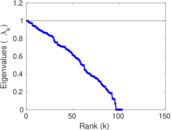
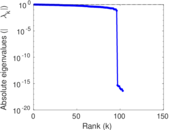
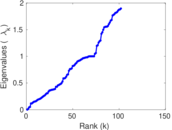
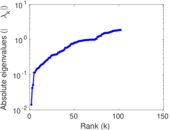
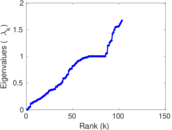
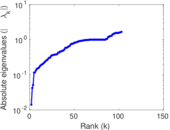
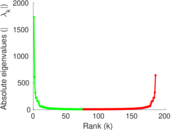
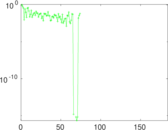
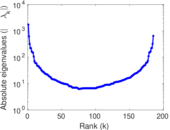
Matrix decompositions plots


Downloads
References
|
[1]
|
Jérôme Kunegis.
KONECT – The Koblenz Network Collection.
In Proc. Int. Conf. on World Wide Web Companion, pages
1343–1350, 2013.
[ http ]
|
|
[2]
|
Wikimedia Foundation.
Wikimedia downloads.
http://dumps.wikimedia.org/, January 2010.
|
 KONECT ‣ Networks ‣
Buy Me a Coffee
KONECT ‣ Networks ‣
Buy Me a Coffee