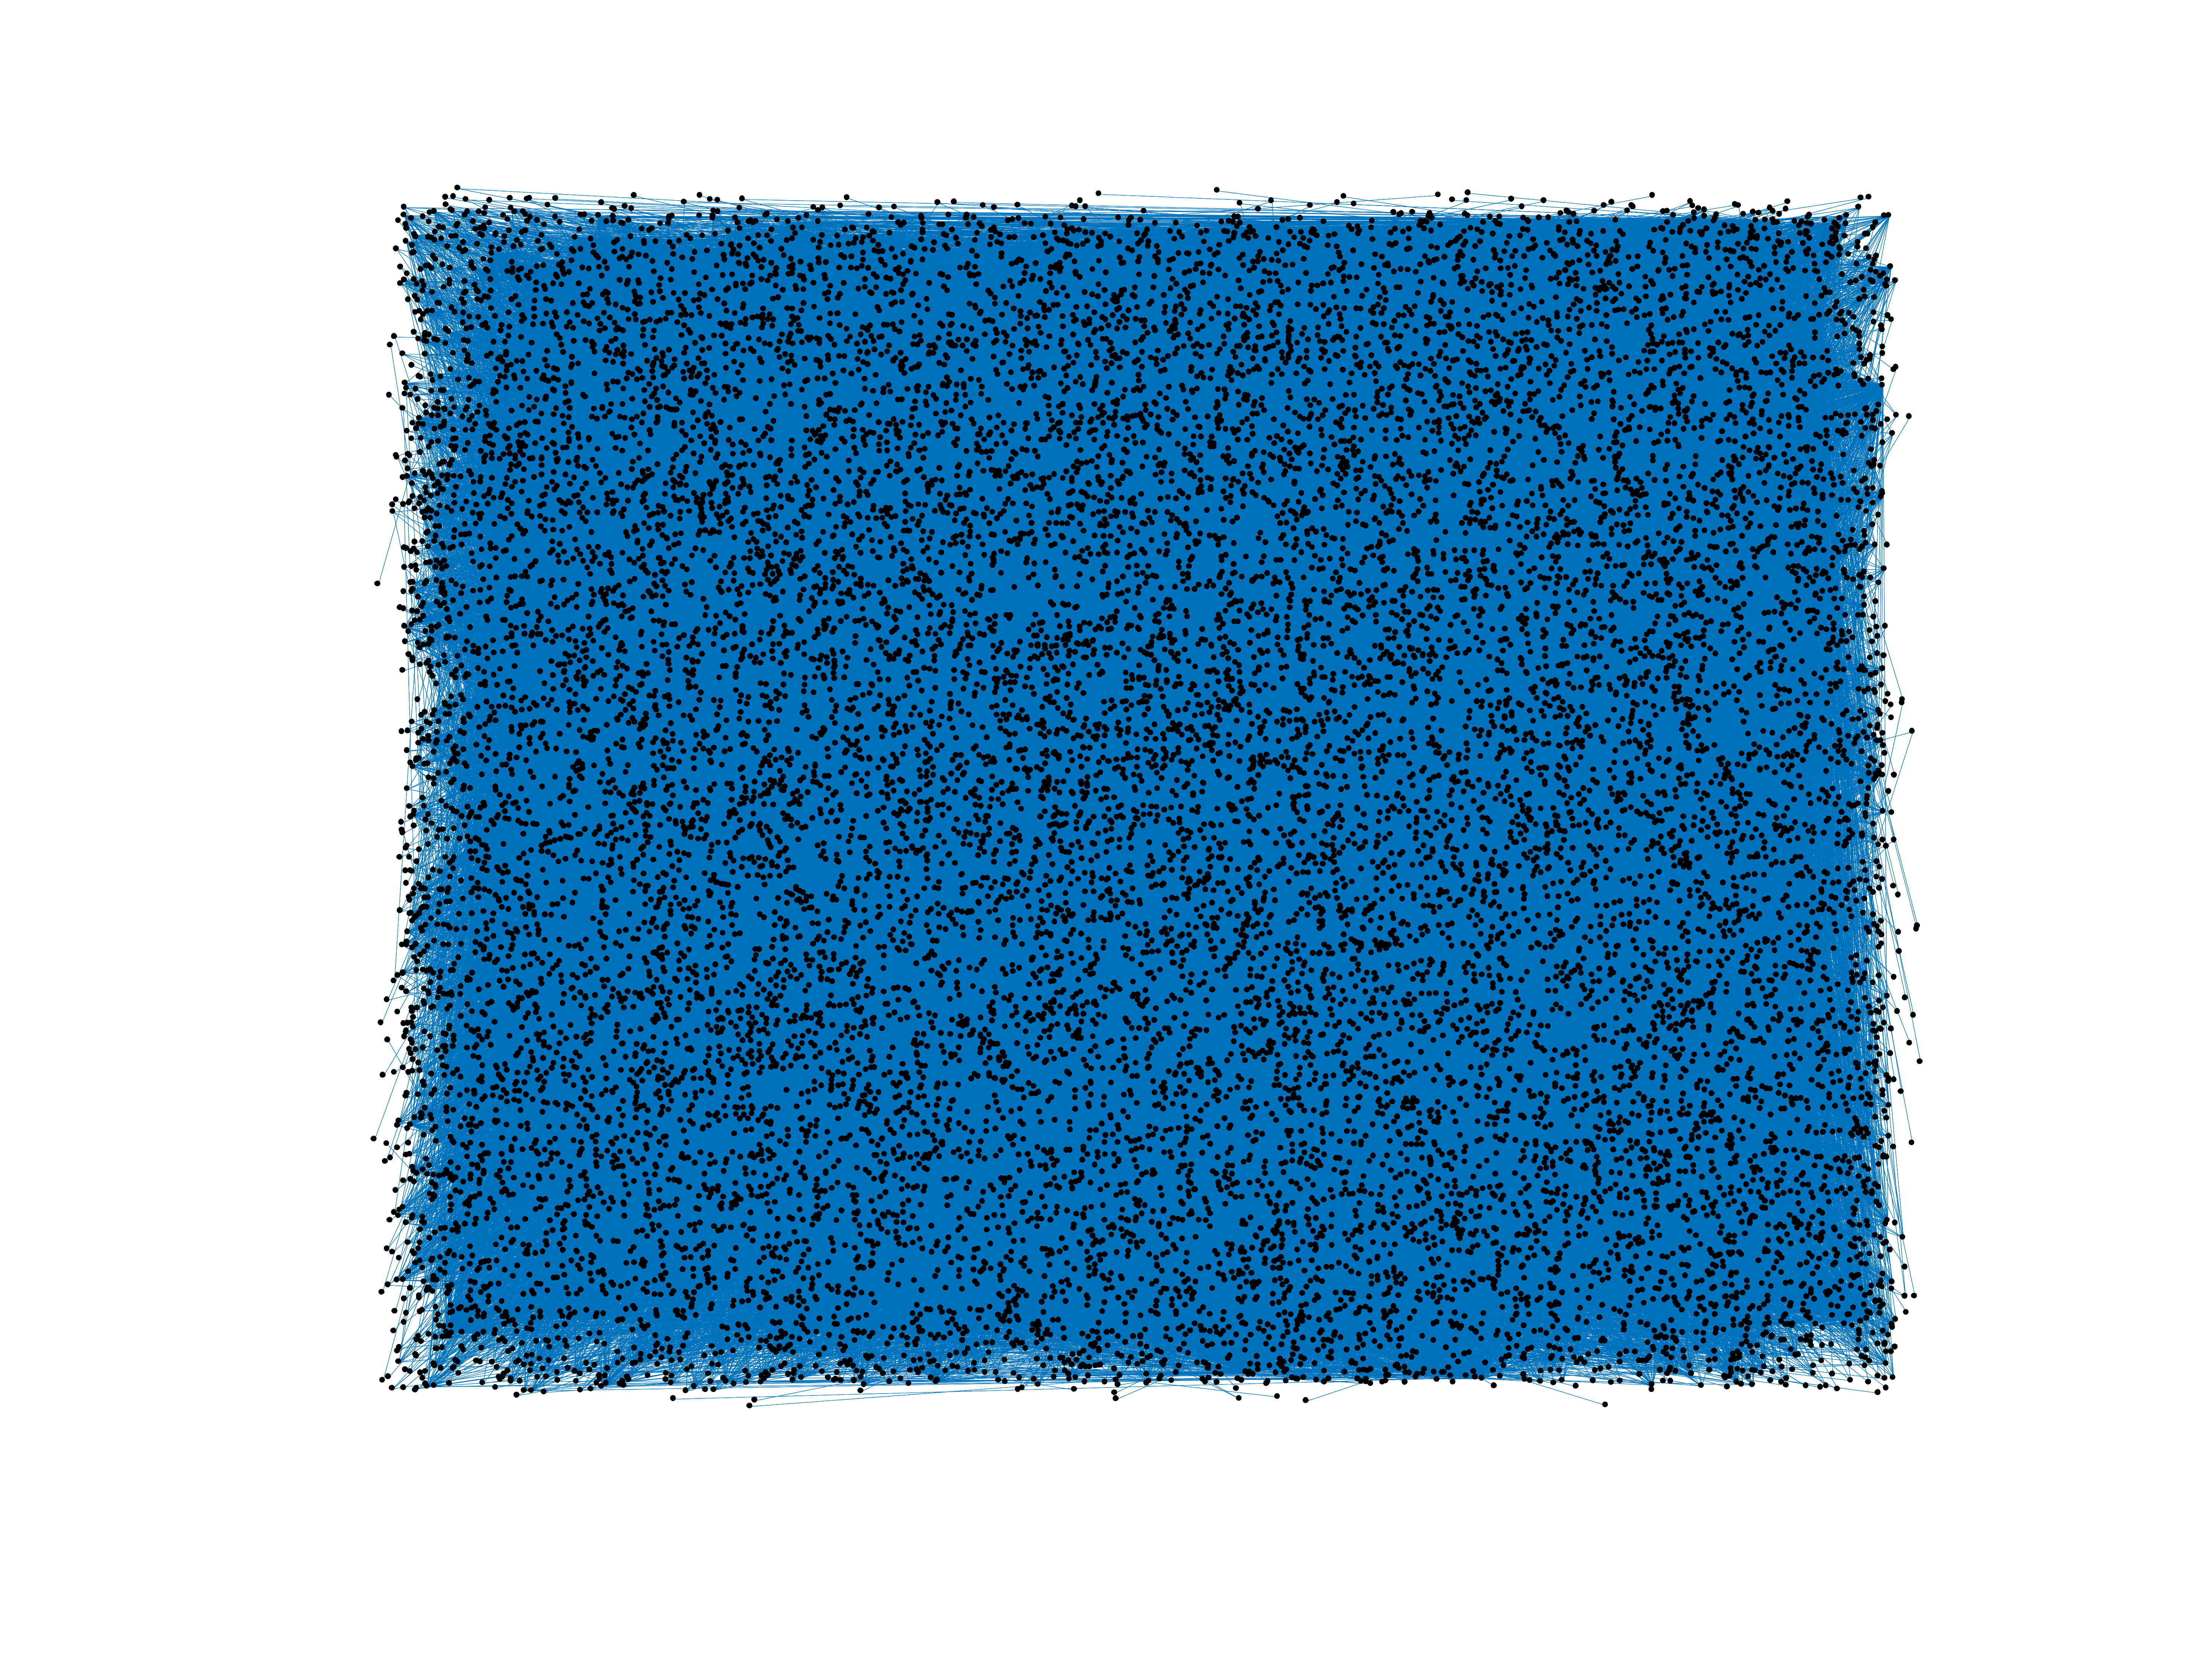
Wikipedia edits (nds-nl)
This is the bipartite edit network of the Low Saxon Wikipedia. It contains
users and pages from the Low Saxon Wikipedia, connected by edit events. Each
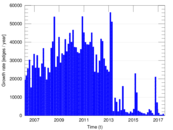
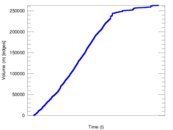
edge represents an edit. The dataset includes the timestamp of each edit.
Metadata
Statistics
| Size | n = | 18,232
|
| Left size | n1 = | 1,542
|
| Right size | n2 = | 16,690
|
| Volume | m = | 262,921
|
| Unique edge count | m̿ = | 108,538
|
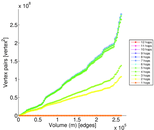
| Wedge count | s = | 137,831,089
|
| Claw count | z = | 186,960,881,253
|
| Cross count | x = | 239,453,637,612,066
|
| Square count | q = | 395,663,481
|
| 4-Tour count | T4 = | 3,716,930,824
|
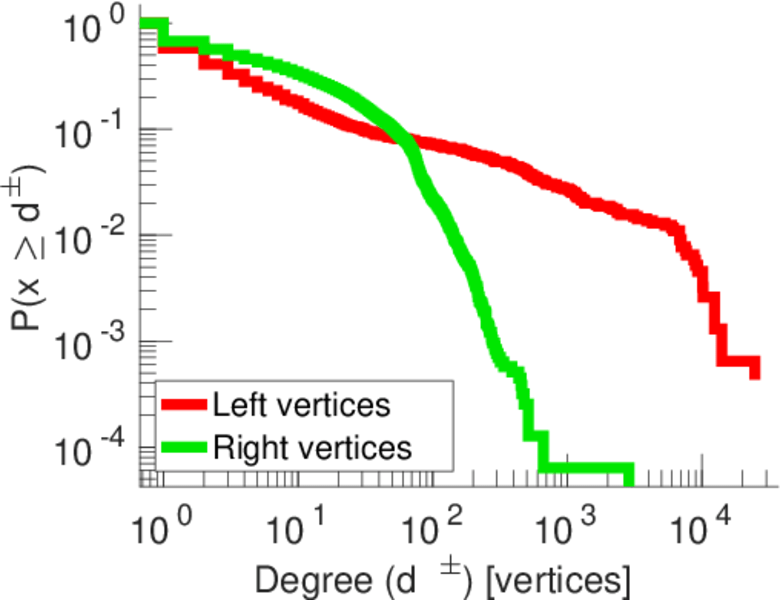
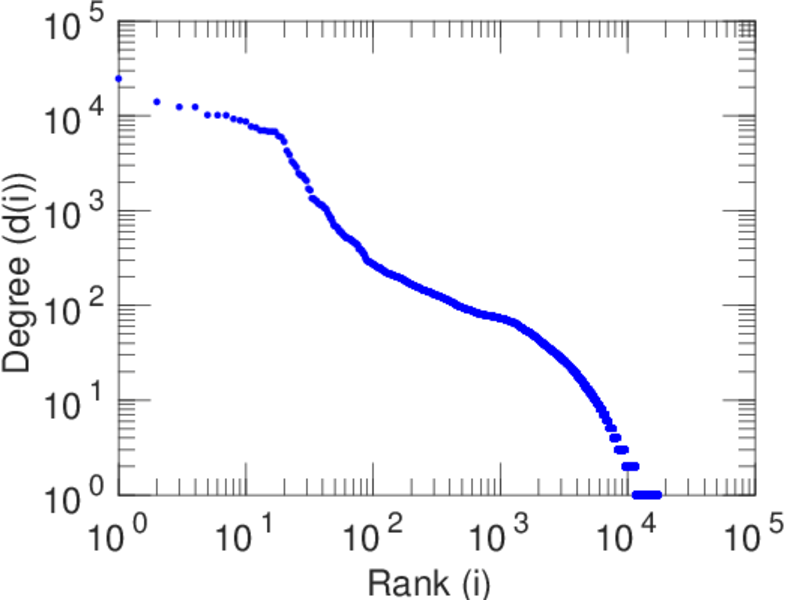
| Maximum degree | dmax = | 24,661
|
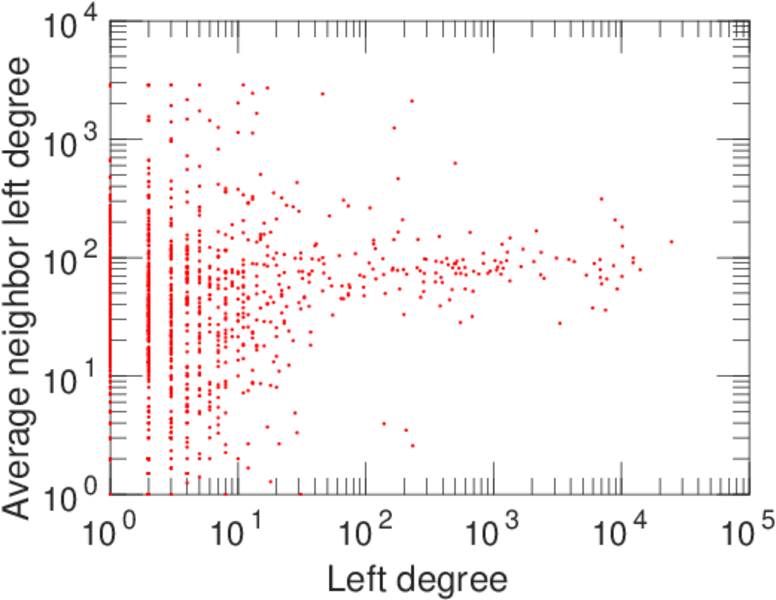
| Maximum left degree | d1max = | 24,661
|
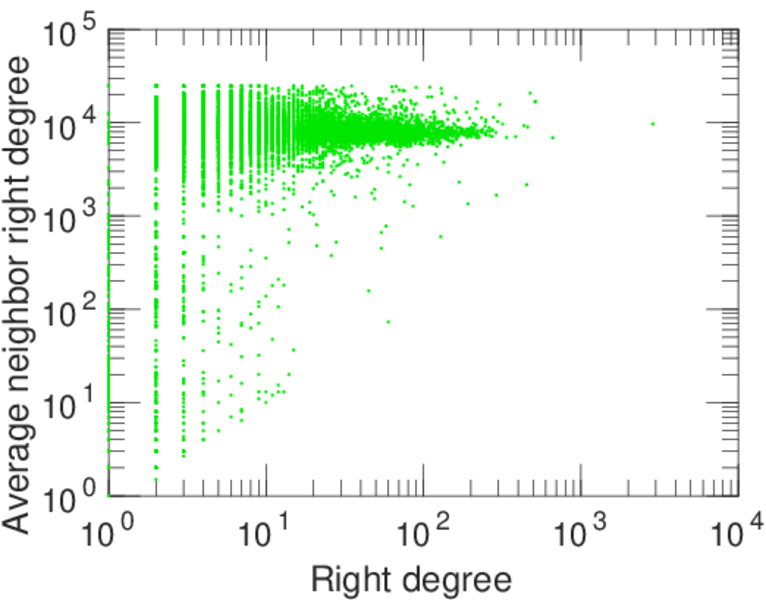
| Maximum right degree | d2max = | 2,875
|
| Average degree | d = | 28.841 7
|
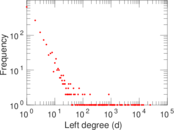
| Average left degree | d1 = | 170.506
|
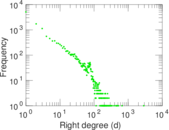
| Average right degree | d2 = | 15.753 2
|
| Fill | p = | 0.004 217 36
|
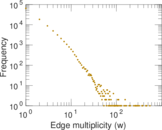
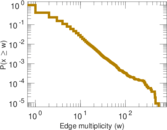
| Average edge multiplicity | m̃ = | 2.422 39
|
| Size of LCC | N = | 16,700
|
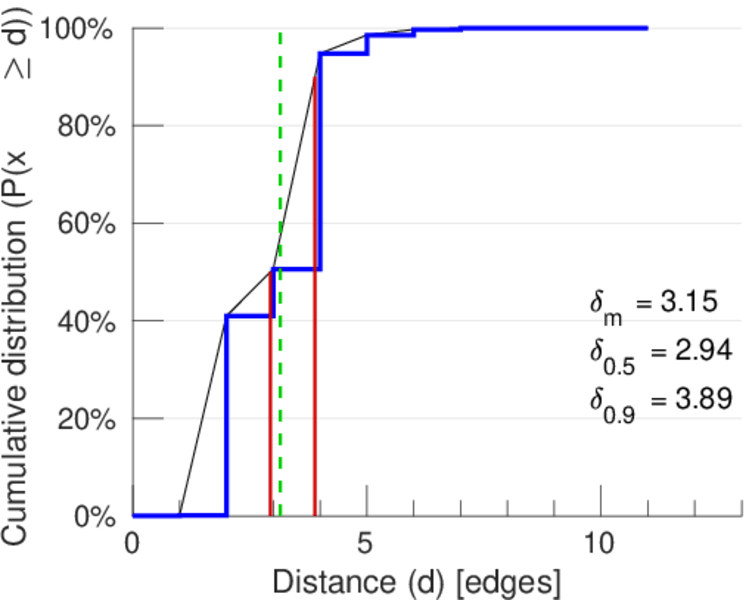
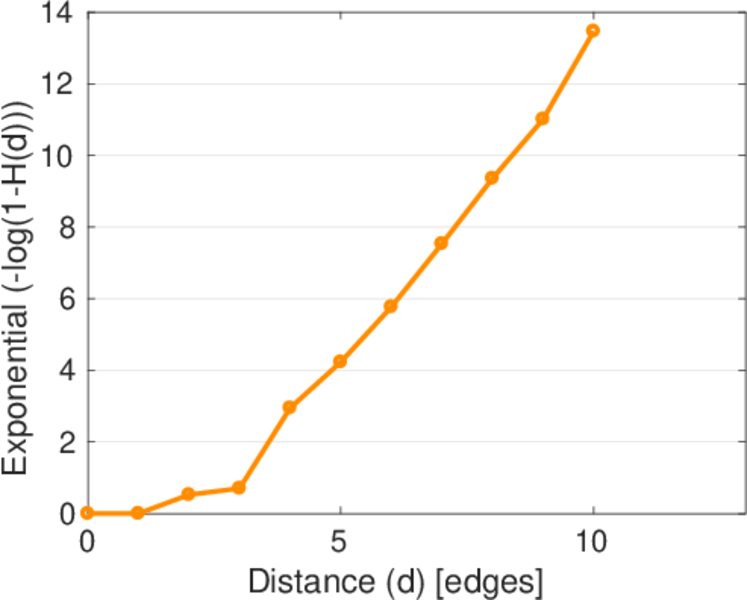
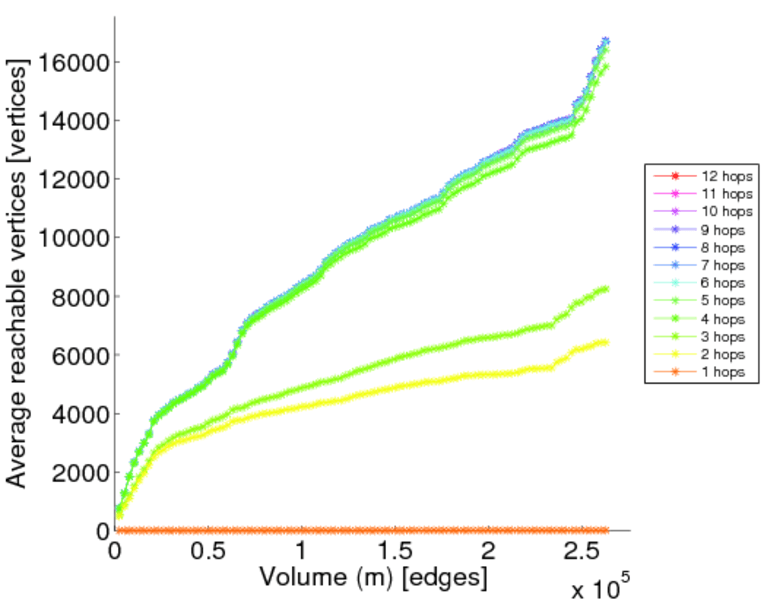
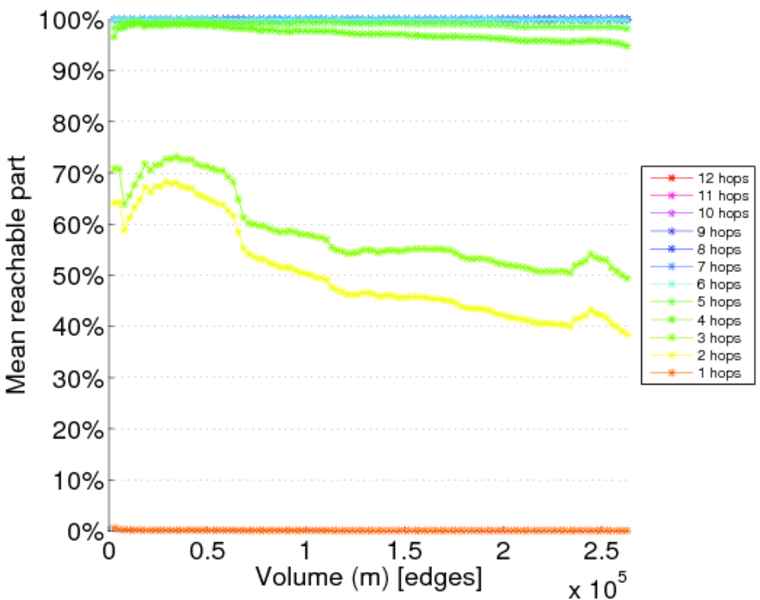
| Diameter | δ = | 12
|
| 50-Percentile effective diameter | δ0.5 = | 2.939 37
|
| 90-Percentile effective diameter | δ0.9 = | 3.892 11
|
| Median distance | δM = | 3
|
| Mean distance | δm = | 3.154 47
|
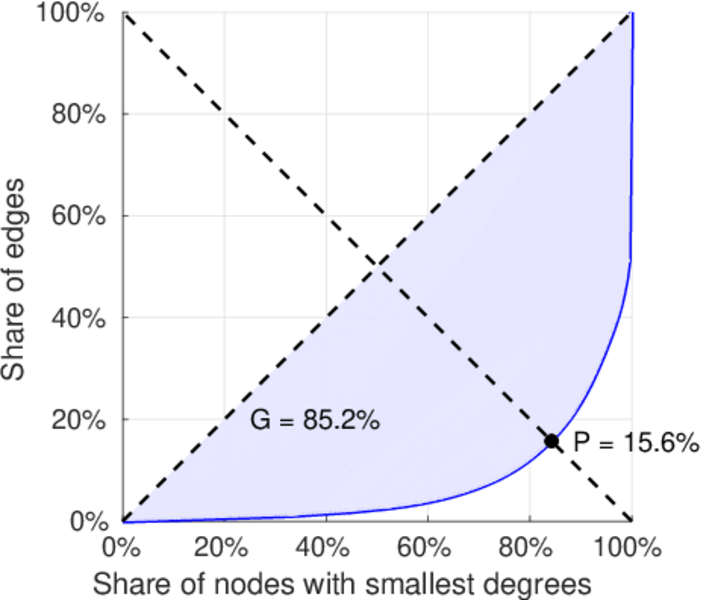
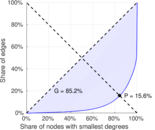
| Gini coefficient | G = | 0.847 471
|
| Balanced inequality ratio | P = | 0.159 274
|
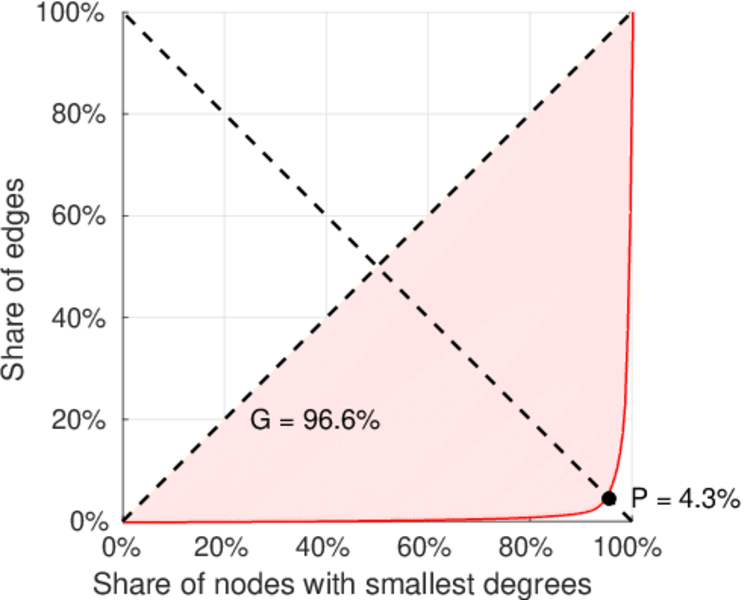
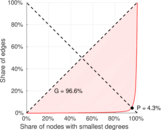
| Left balanced inequality ratio | P1 = | 0.043 184 1
|
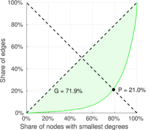
| Right balanced inequality ratio | P2 = | 0.209 671
|
| Relative edge distribution entropy | Her = | 0.753 120
|
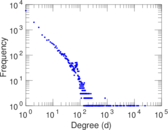
| Power law exponent | γ = | 1.874 60
|
| Tail power law exponent | γt = | 1.621 00
|
| Tail power law exponent with p | γ3 = | 1.621 00
|
| p-value | p = | 0.000 00
|
| Left tail power law exponent with p | γ3,1 = | 1.671 00
|
| Left p-value | p1 = | 0.000 00
|
| Right tail power law exponent with p | γ3,2 = | 8.911 00
|
| Right p-value | p2 = | 0.249 000
|
| Degree assortativity | ρ = | −0.304 526
|
| Degree assortativity p-value | pρ = | 0.000 00
|
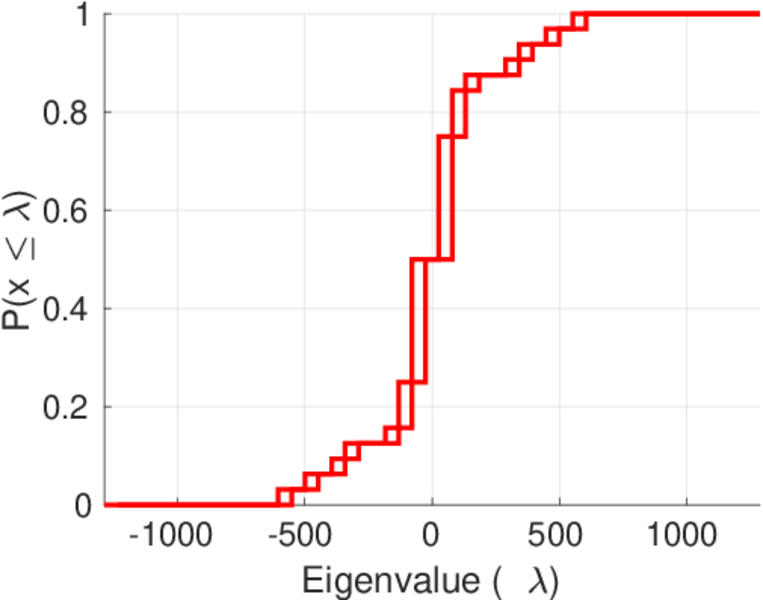
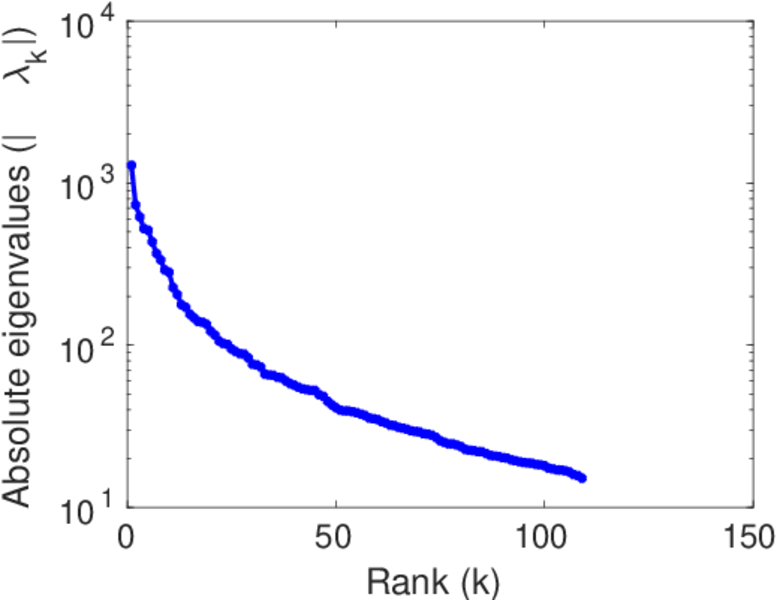
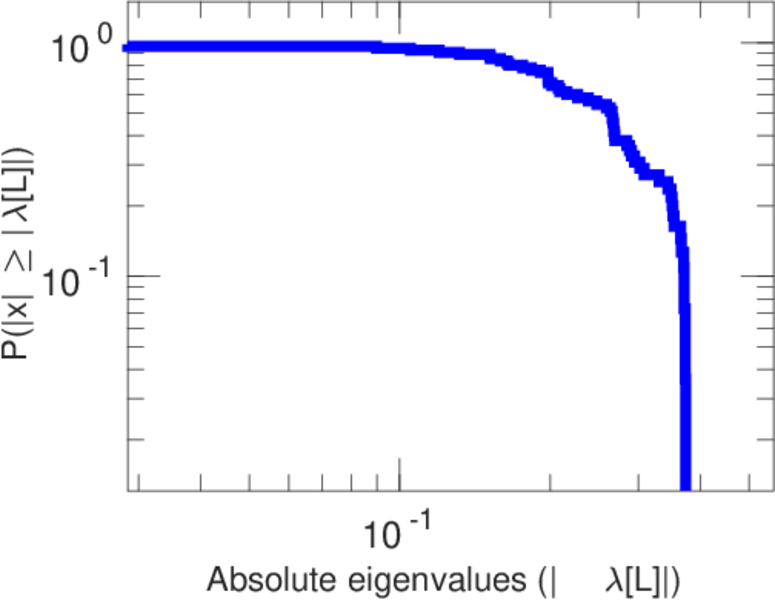
| Spectral norm | α = | 1,286.43
|
| Algebraic connectivity | a = | 0.028 537 1
|
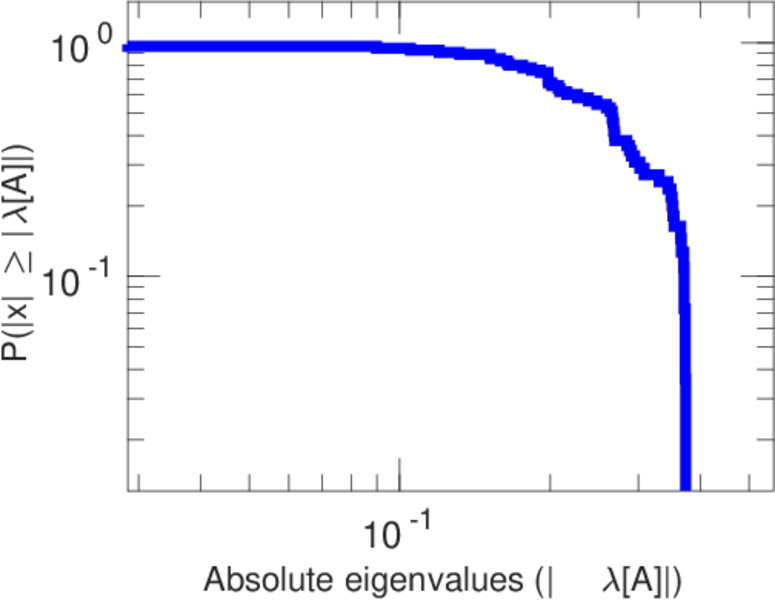
| Spectral separation | |λ1[A] / λ2[A]| = | 1.751 14
|
| Controllability | C = | 14,396
|
| Relative controllability | Cr = | 0.834 841
|
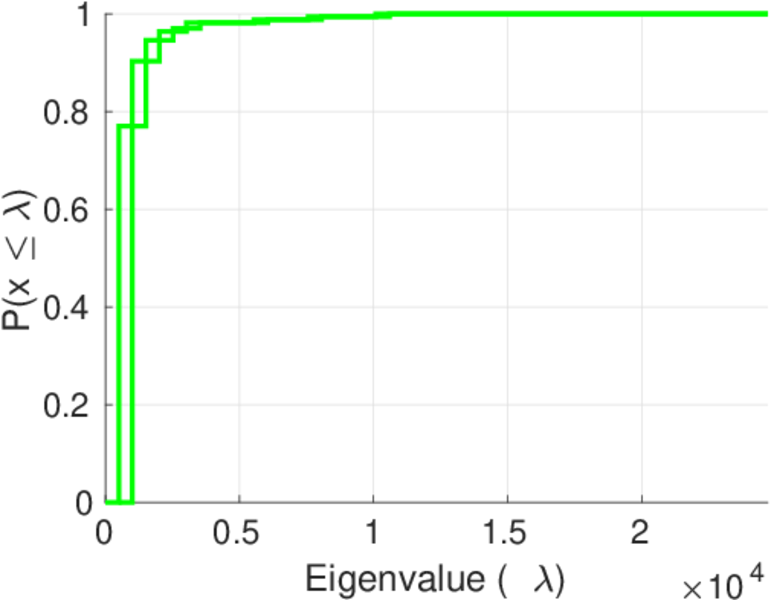
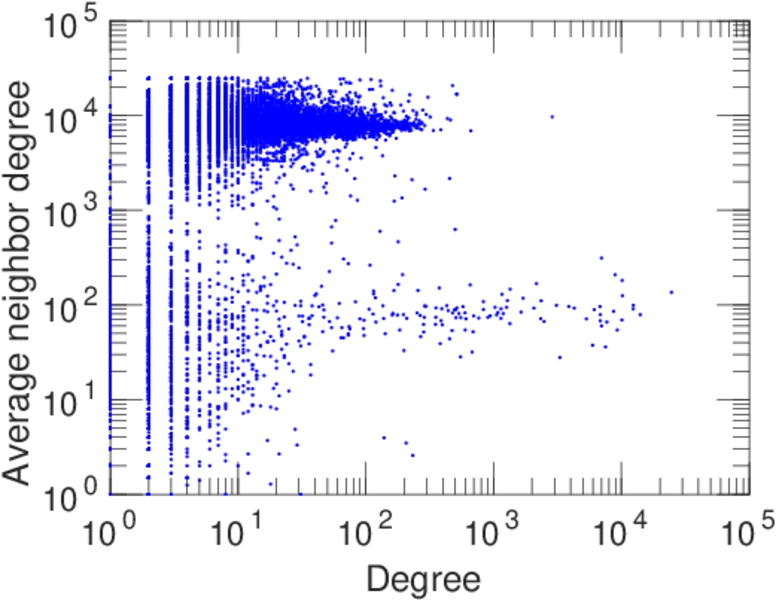
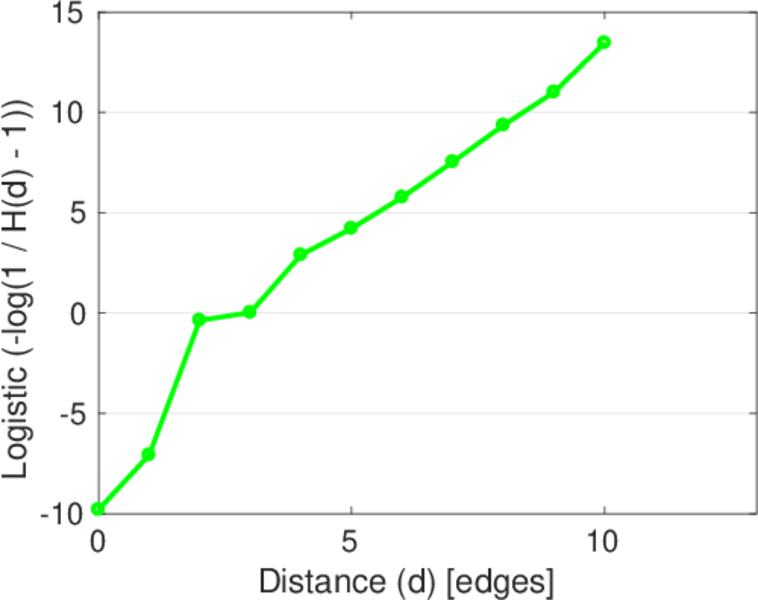
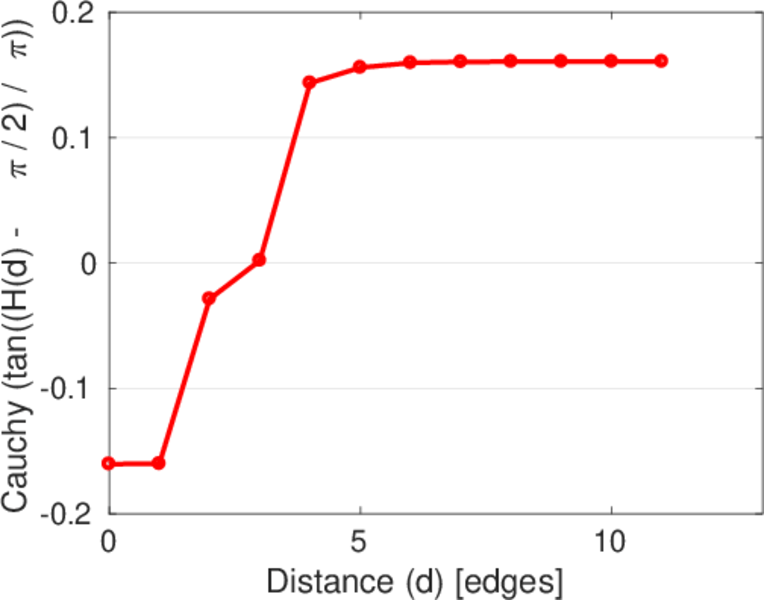
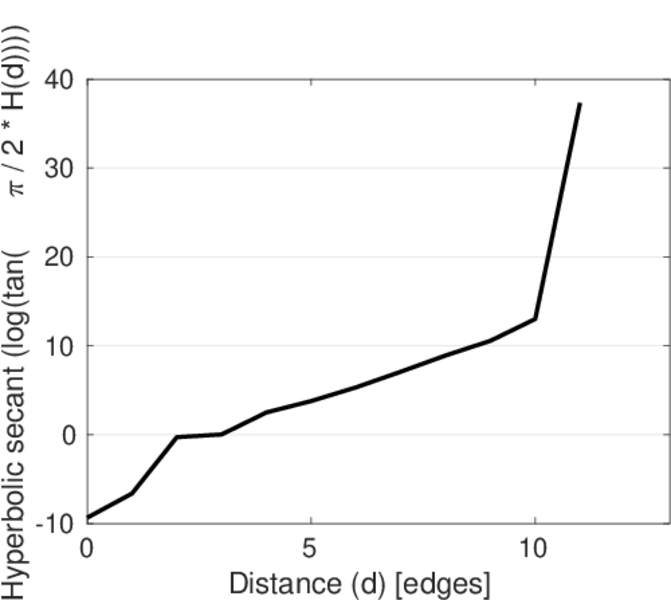
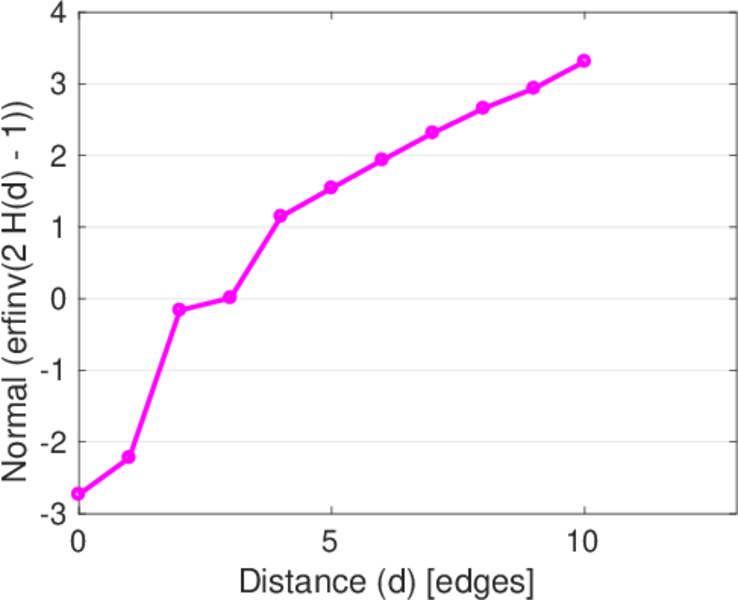
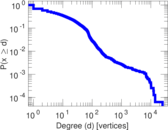
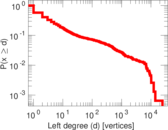
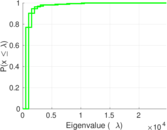
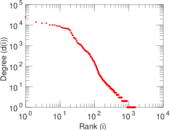
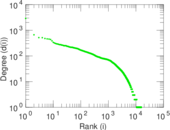
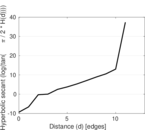
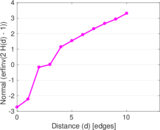
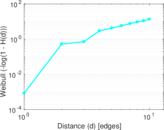
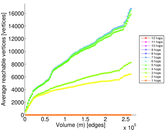
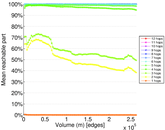
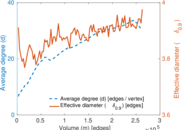
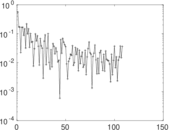
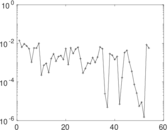
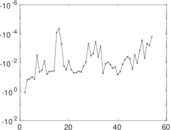
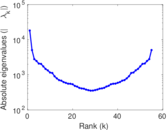
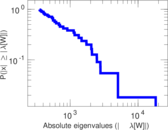
Plots


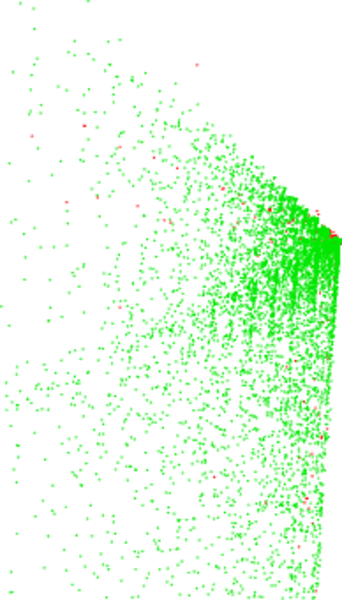
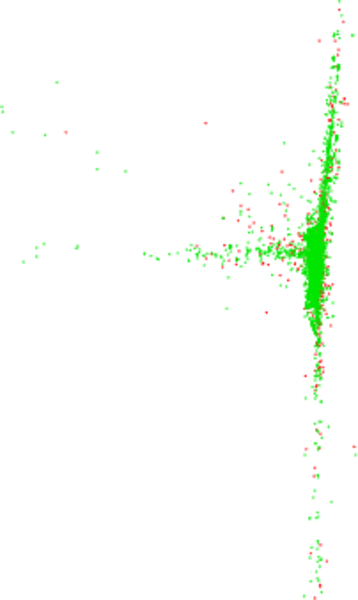
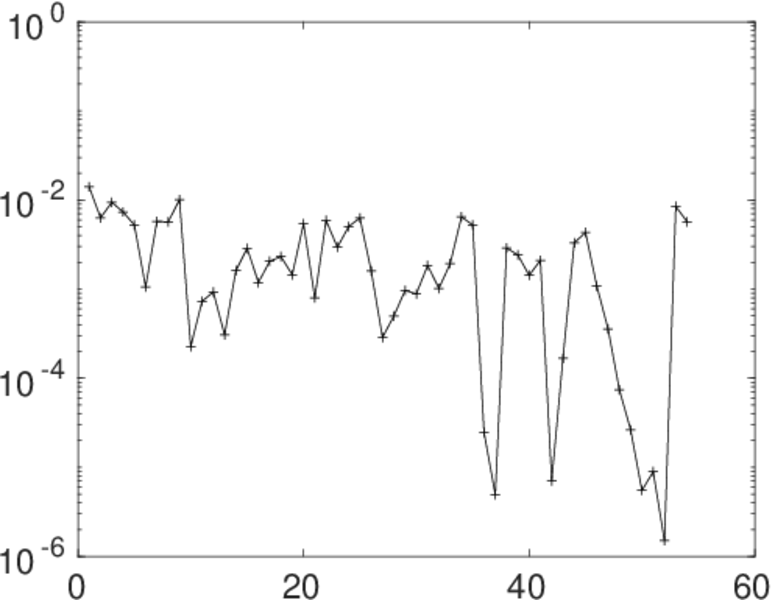
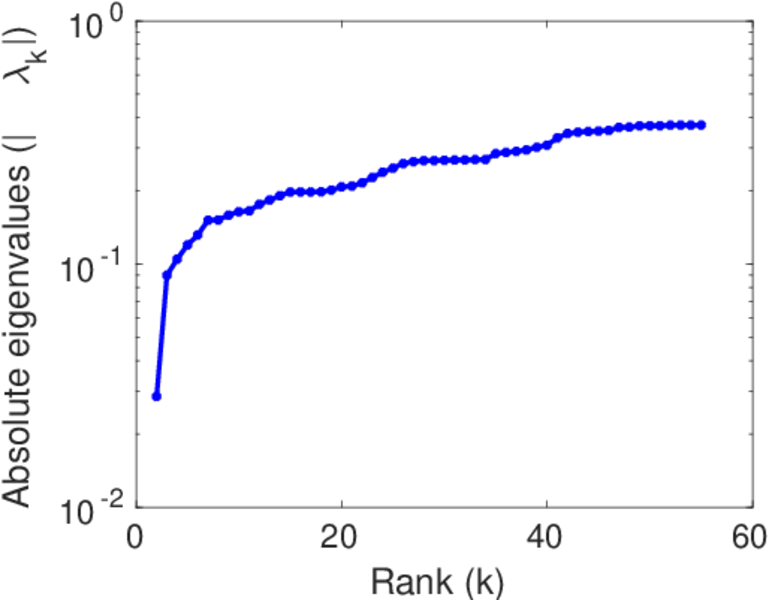
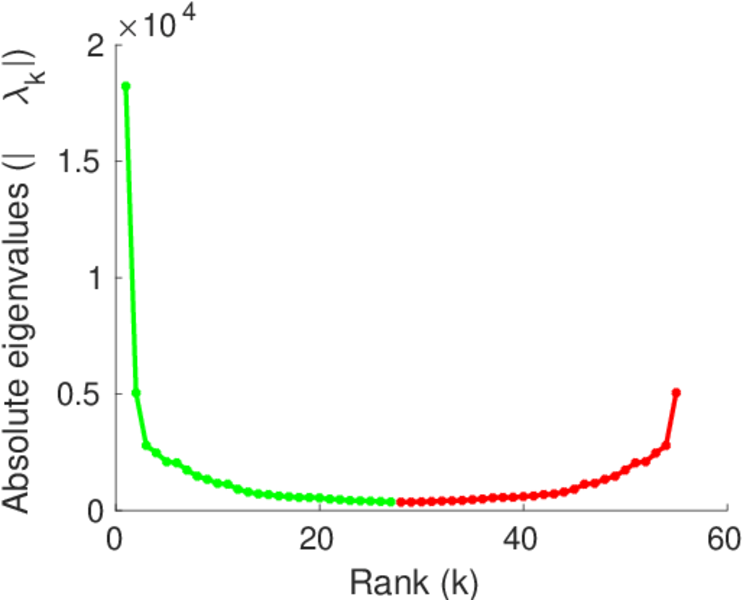
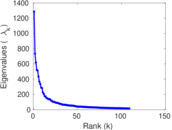
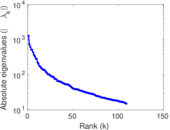
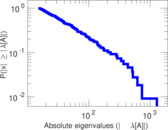
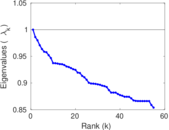
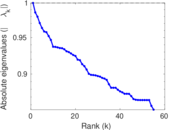
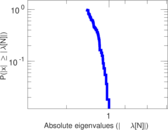
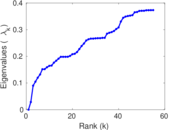
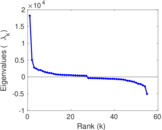
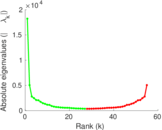
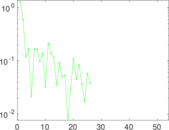
Matrix decompositions plots


Downloads
References
|
[1]
|
Jérôme Kunegis.
KONECT – The Koblenz Network Collection.
In Proc. Int. Conf. on World Wide Web Companion, pages
1343–1350, 2013.
[ http ]
|
|
[2]
|
Wikimedia Foundation.
Wikimedia downloads.
http://dumps.wikimedia.org/, January 2010.
|
 KONECT ‣ Networks ‣
Buy Me a Coffee
KONECT ‣ Networks ‣
Buy Me a Coffee