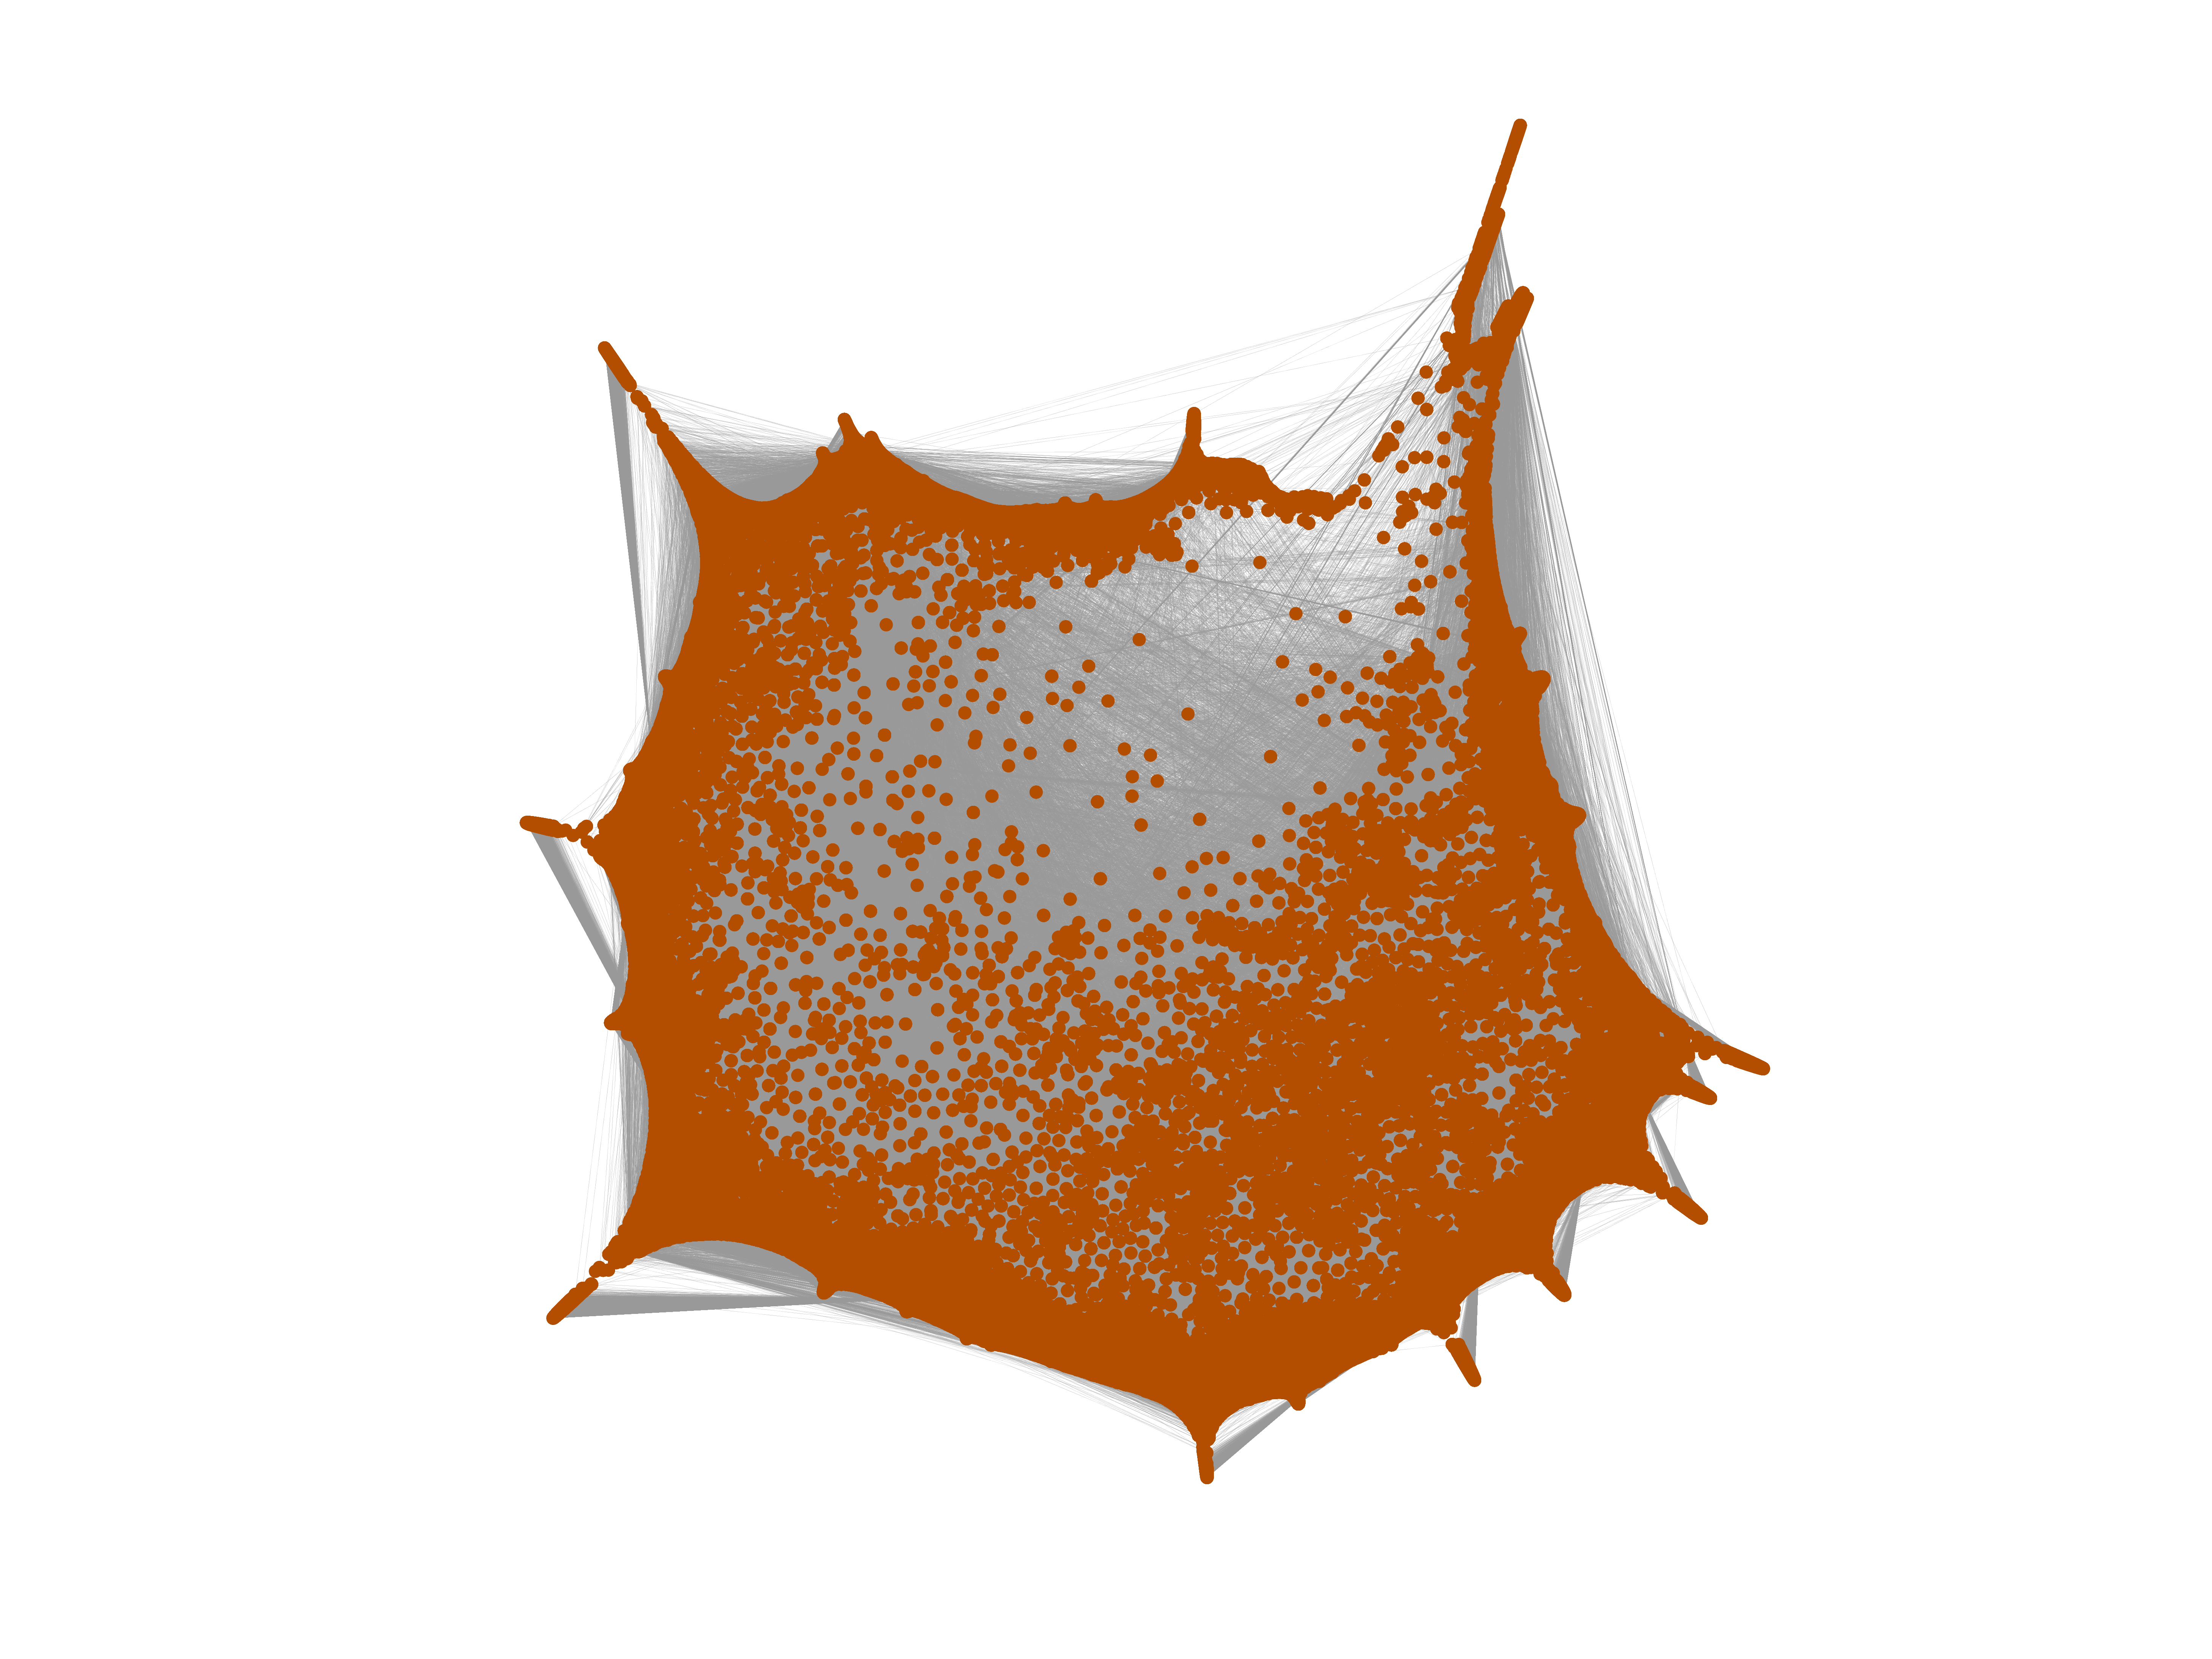
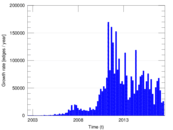
Wikipedia edits (ne)
This is the bipartite edit network of the Nepali Wikipedia. It contains users
and pages from the Nepali Wikipedia, connected by edit events. Each edge
represents an edit. The dataset includes the timestamp of each edit.
Metadata
Statistics
| Size | n = | 90,238
|
| Left size | n1 = | 7,557
|
| Right size | n2 = | 82,681
|
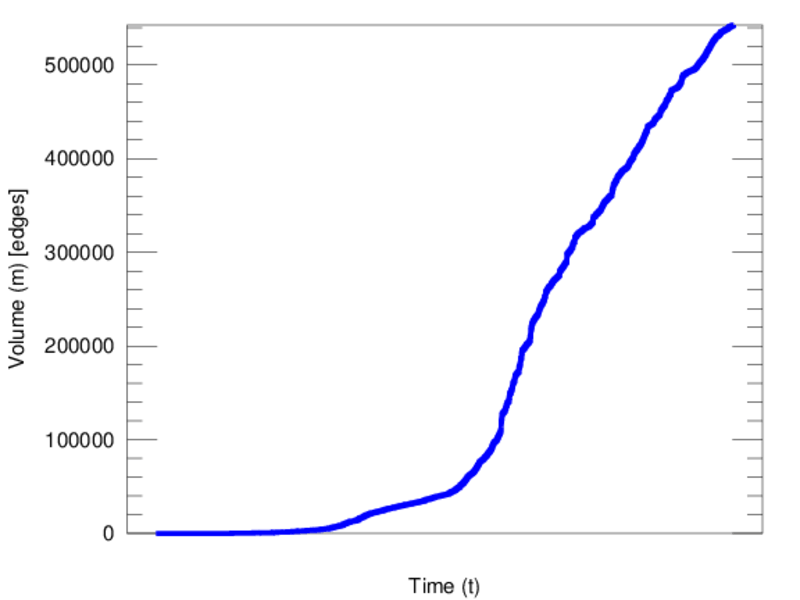
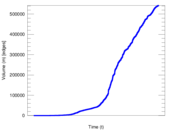
| Volume | m = | 542,716
|
| Unique edge count | m̿ = | 266,793
|
| Wedge count | s = | 984,353,034
|
| Claw count | z = | 4,773,412,200,784
|
| Cross count | x = | 20,769,376,204,395,392
|
| Square count | q = | 611,990,057
|
| 4-Tour count | T4 = | 8,834,063,530
|
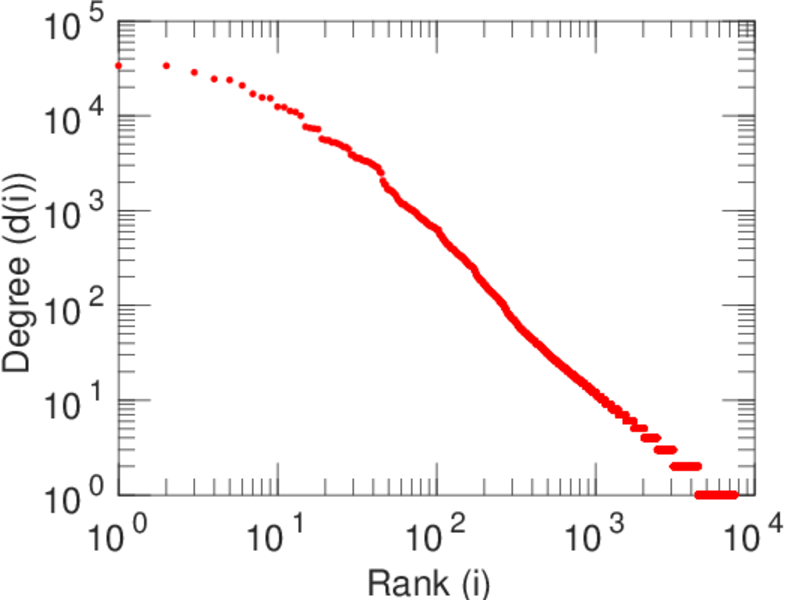
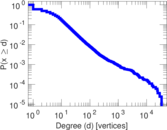
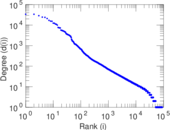
| Maximum degree | dmax = | 33,737
|
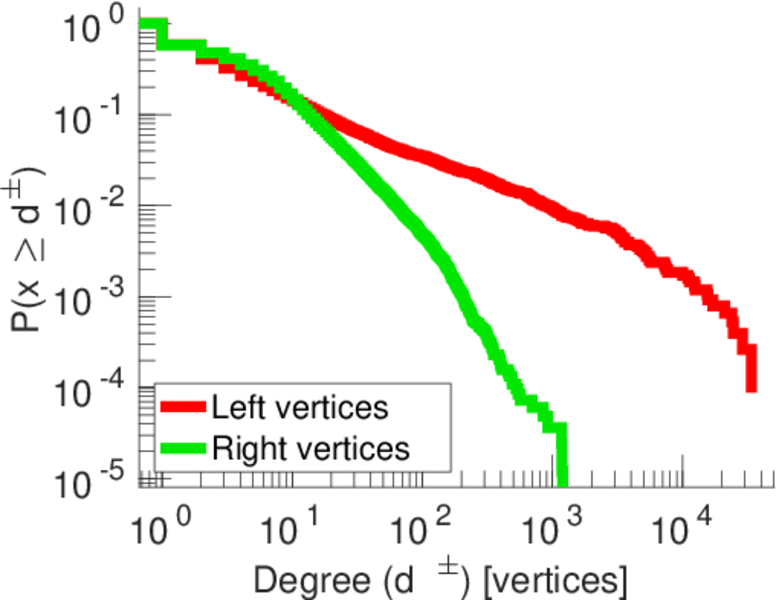
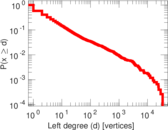
| Maximum left degree | d1max = | 33,737
|
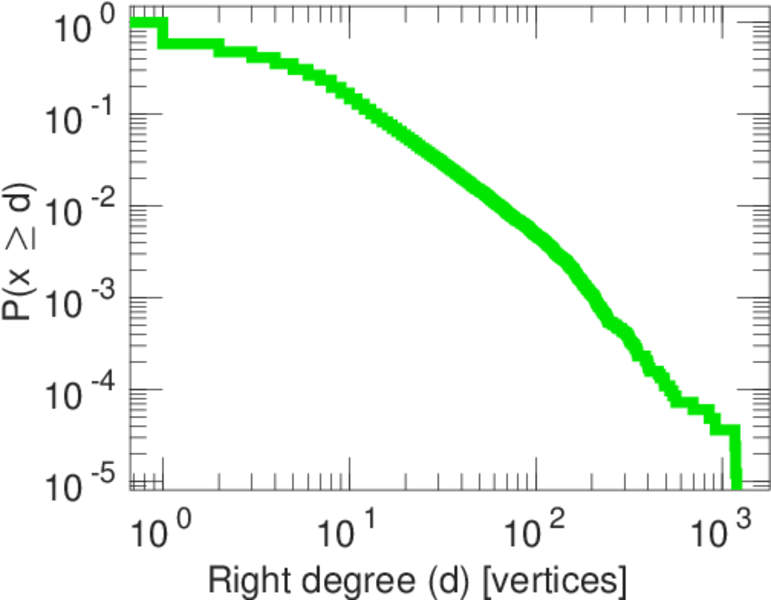
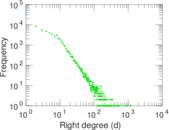
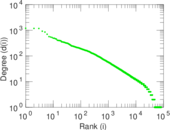
| Maximum right degree | d2max = | 1,193
|
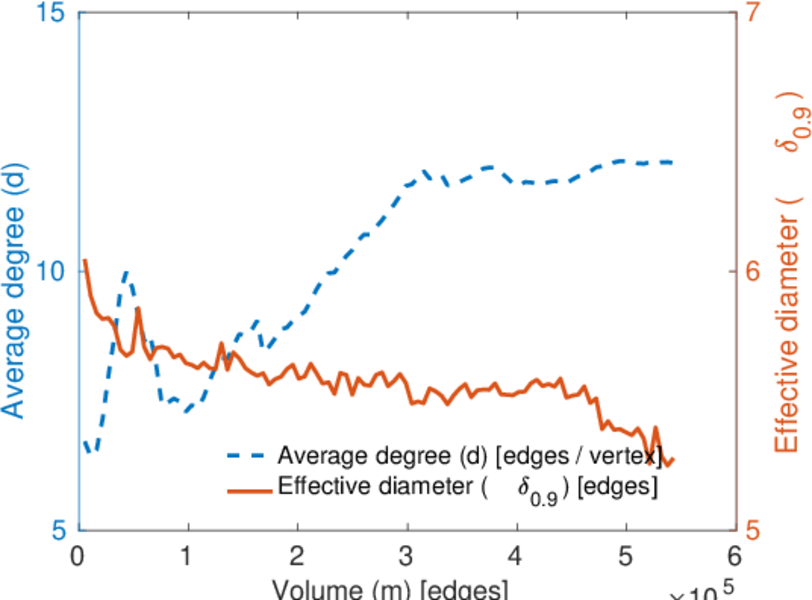
| Average degree | d = | 12.028 5
|
| Average left degree | d1 = | 71.816 3
|
| Average right degree | d2 = | 6.563 97
|
| Fill | p = | 0.000 426 992
|
| Average edge multiplicity | m̃ = | 2.034 22
|
| Size of LCC | N = | 88,125
|
| Diameter | δ = | 11
|
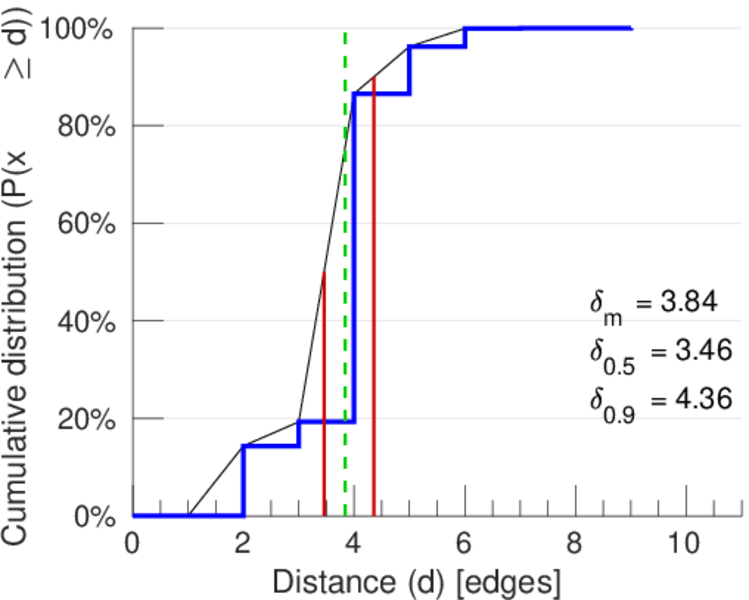
| 50-Percentile effective diameter | δ0.5 = | 3.456 84
|
| 90-Percentile effective diameter | δ0.9 = | 4.359 10
|
| Median distance | δM = | 4
|
| Mean distance | δm = | 3.837 73
|
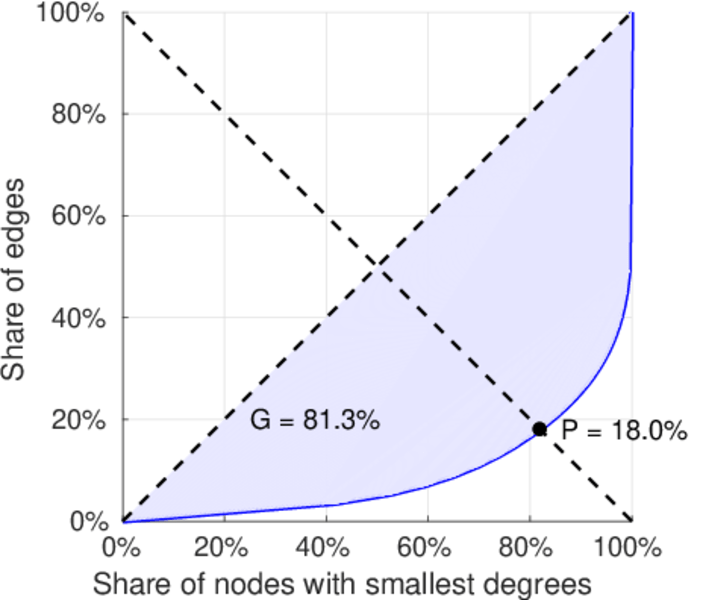
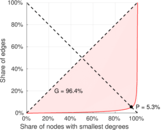
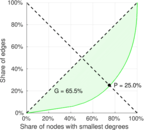
| Gini coefficient | G = | 0.815 235
|
| Balanced inequality ratio | P = | 0.178 694
|
| Left balanced inequality ratio | P1 = | 0.053 492 1
|
| Right balanced inequality ratio | P2 = | 0.249 936
|
| Relative edge distribution entropy | Her = | 0.739 524
|
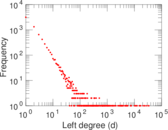
| Power law exponent | γ = | 2.397 91
|
| Tail power law exponent | γt = | 2.611 00
|
| Tail power law exponent with p | γ3 = | 2.611 00
|
| p-value | p = | 0.000 00
|
| Left tail power law exponent with p | γ3,1 = | 1.881 00
|
| Left p-value | p1 = | 0.000 00
|
| Right tail power law exponent with p | γ3,2 = | 3.481 00
|
| Right p-value | p2 = | 0.004 000 00
|
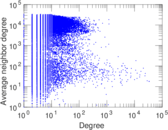
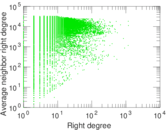
| Degree assortativity | ρ = | −0.228 477
|
| Degree assortativity p-value | pρ = | 0.000 00
|
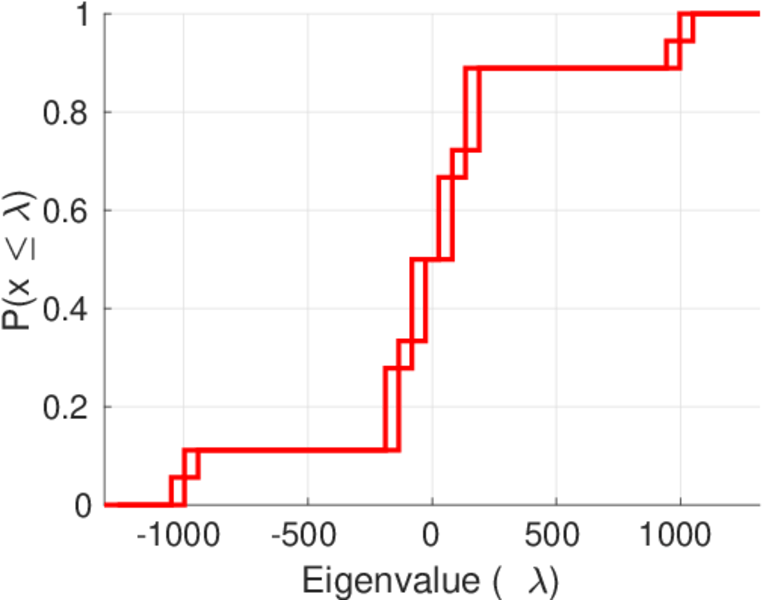
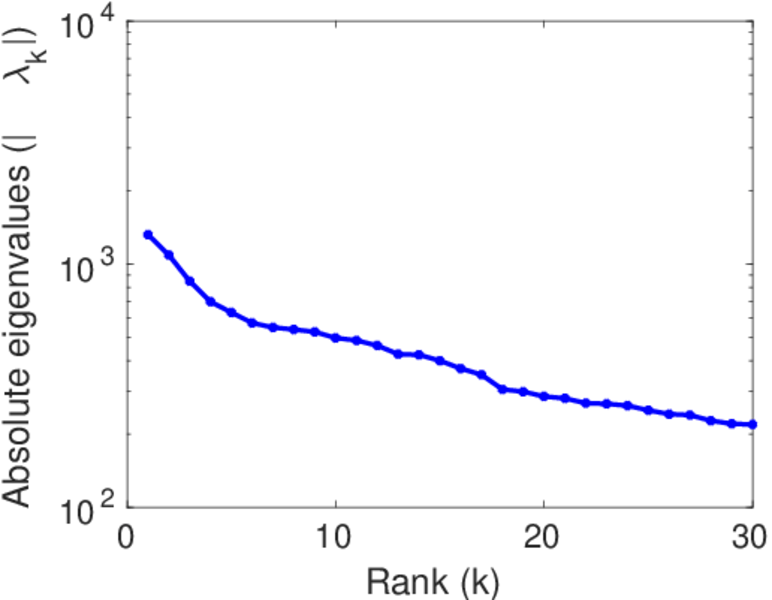
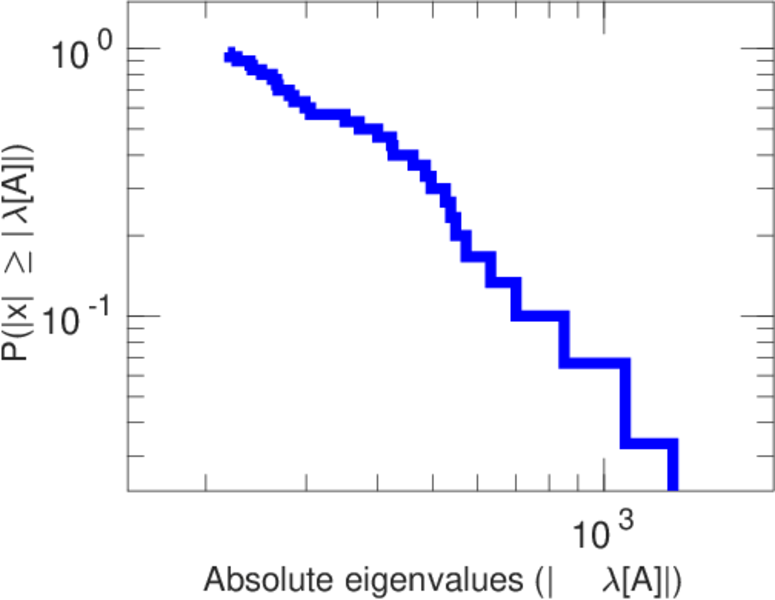
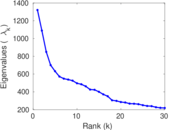
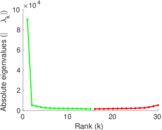
| Spectral norm | α = | 1,320.73
|
| Algebraic connectivity | a = | 0.014 025 8
|
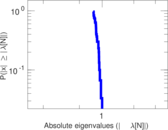
| Spectral separation | |λ1[A] / λ2[A]| = | 1.212 23
|
| Controllability | C = | 80,295
|
| Relative controllability | Cr = | 0.894 124
|
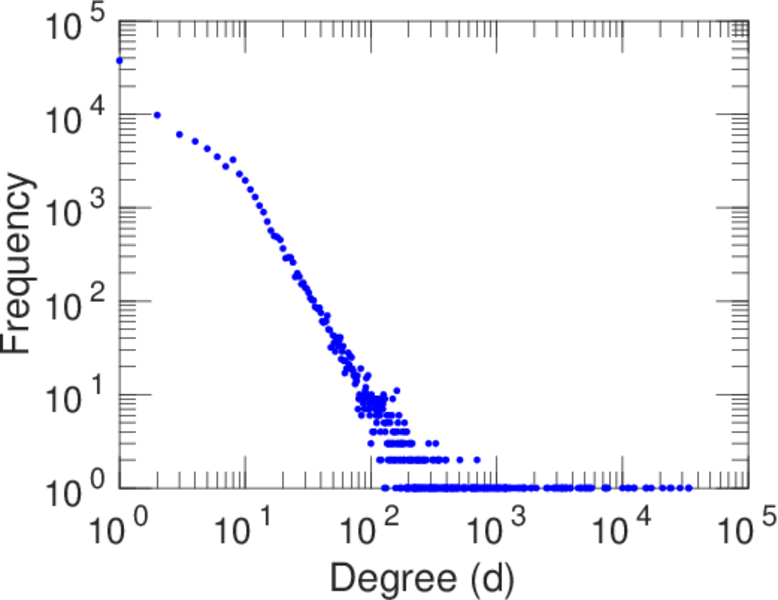
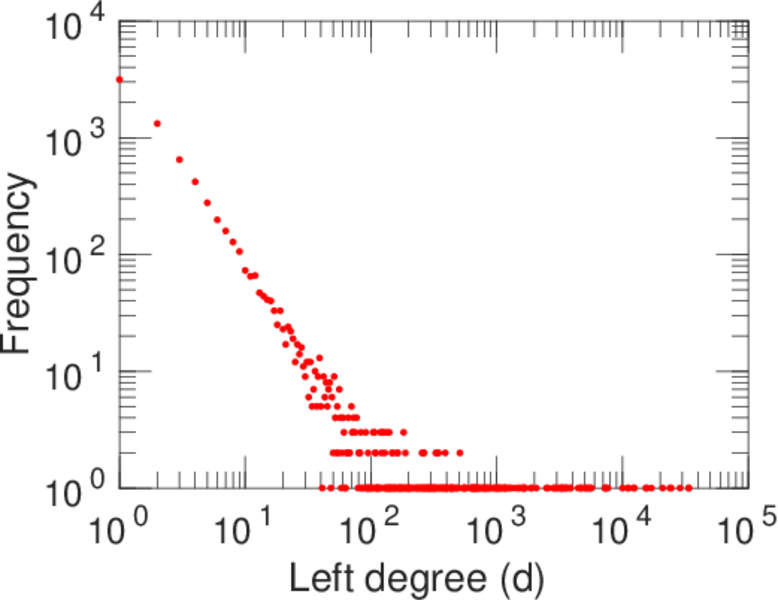
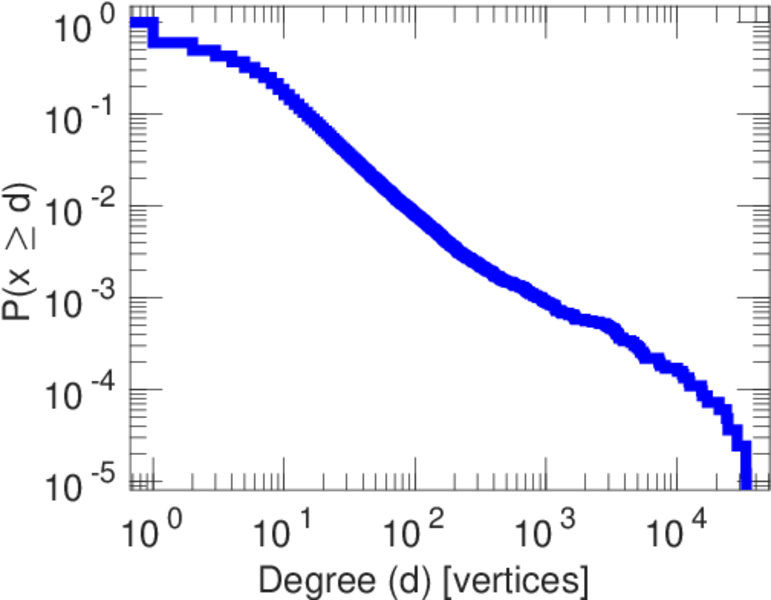
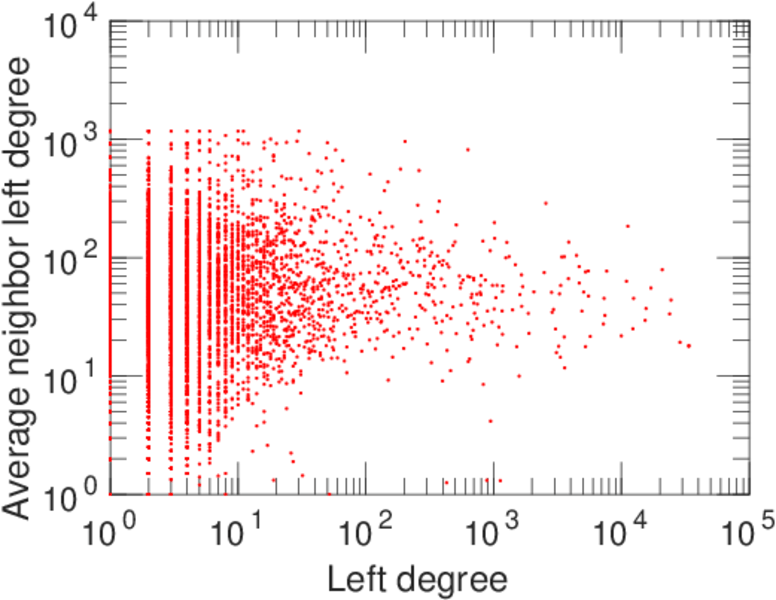
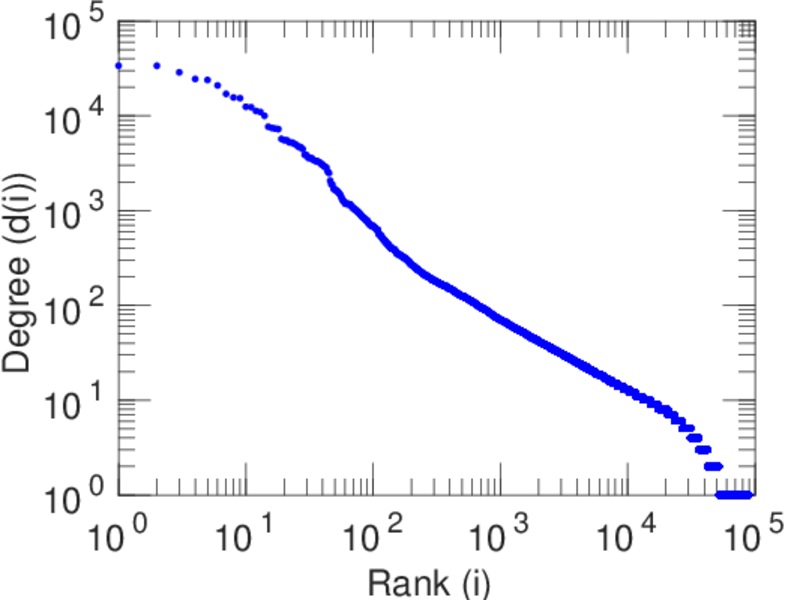
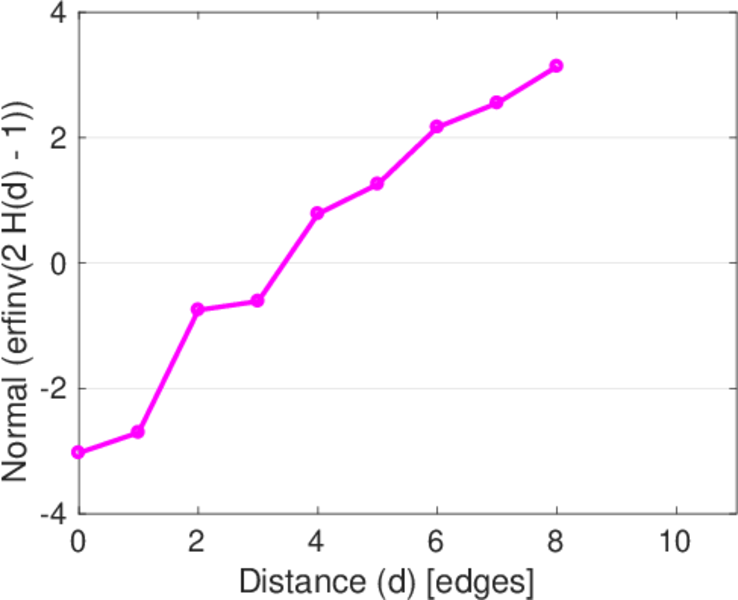
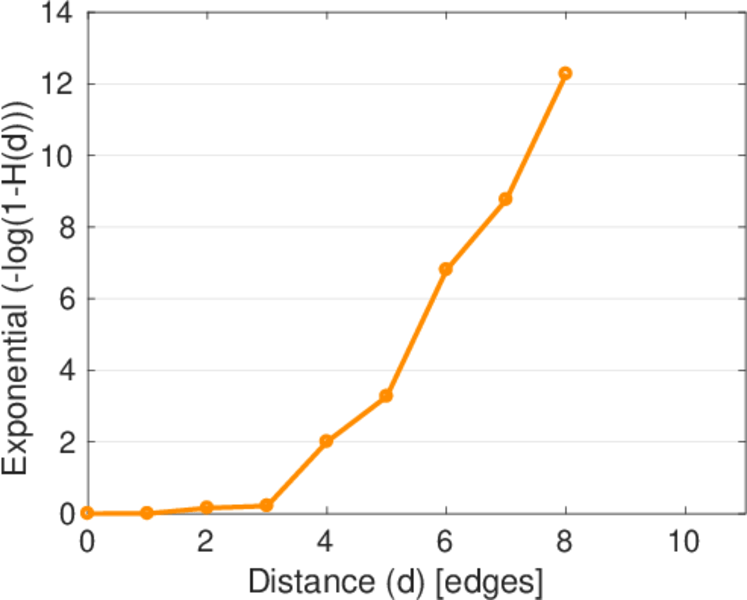
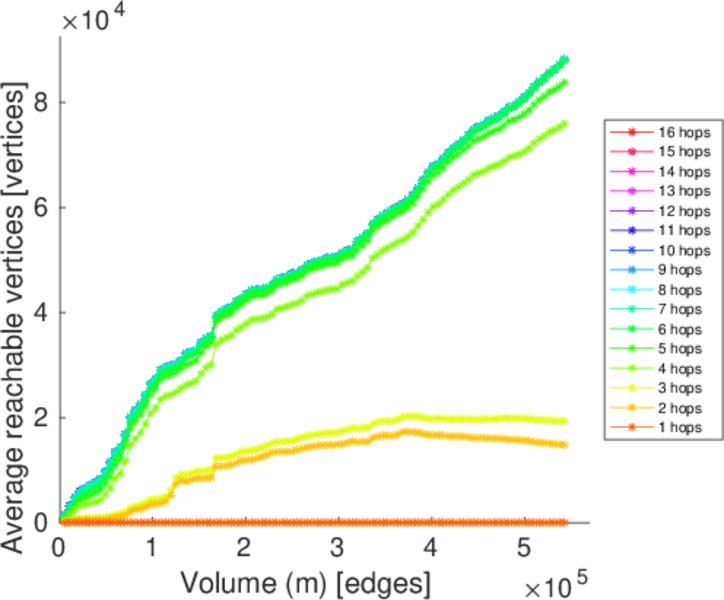
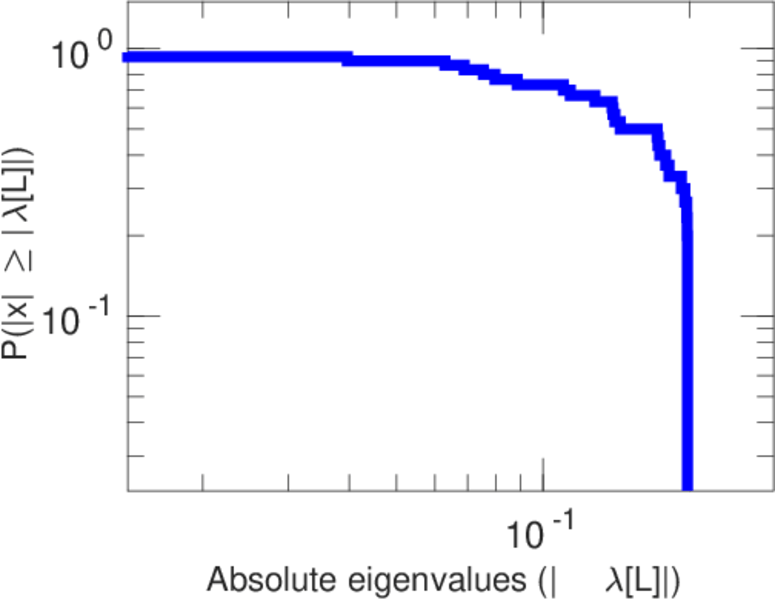
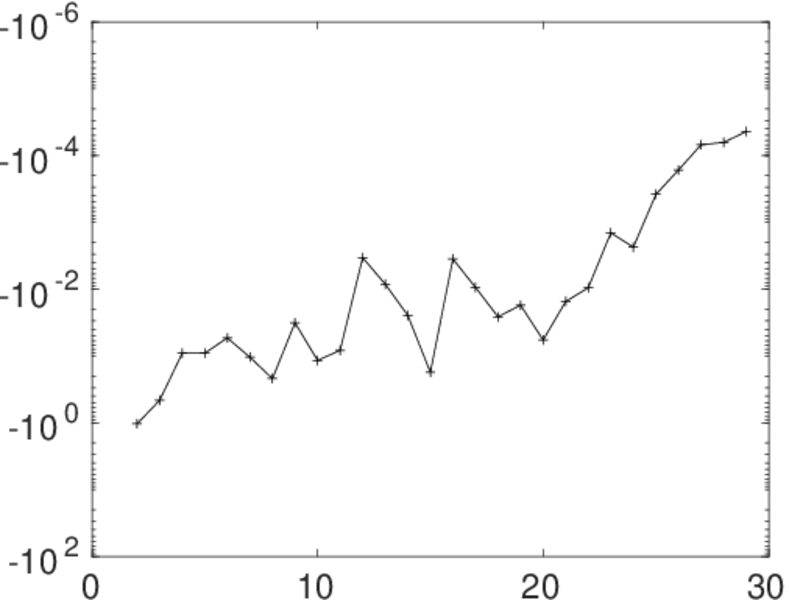
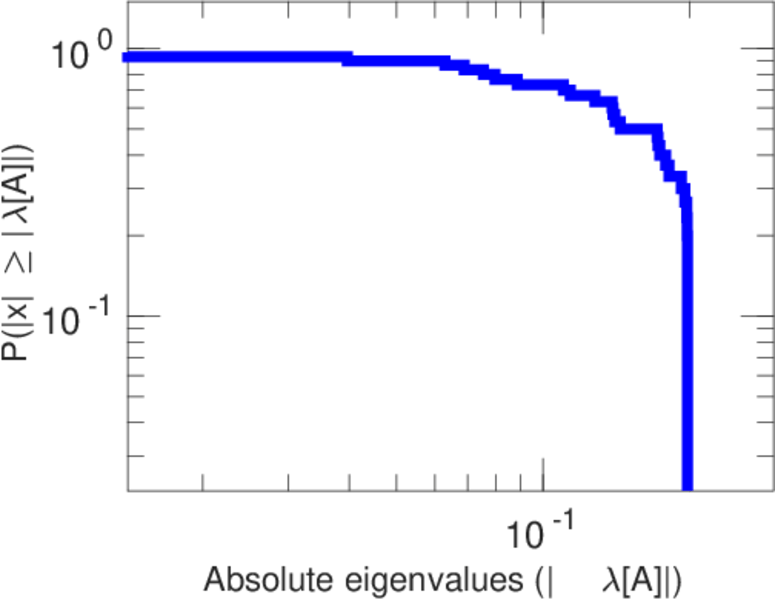
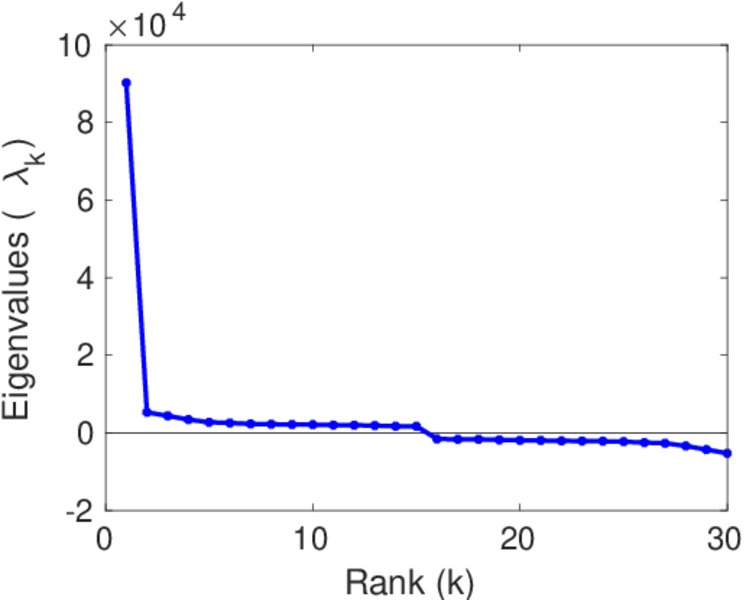
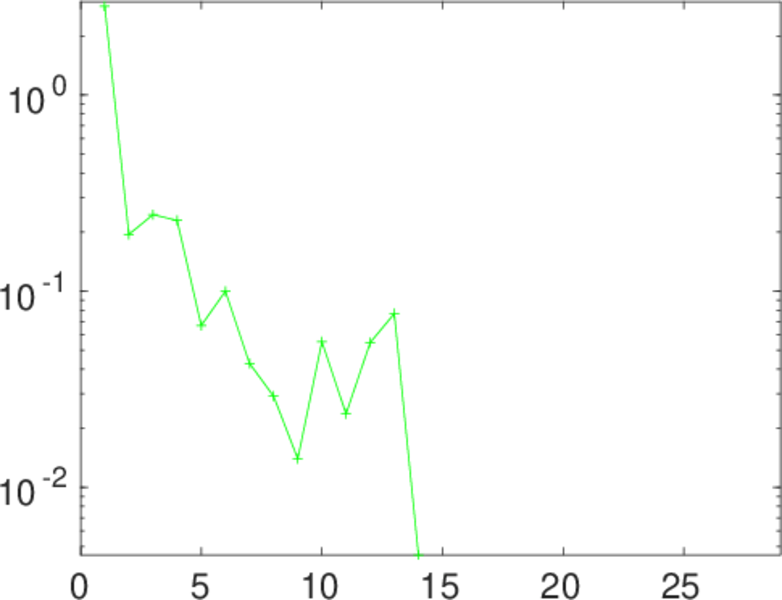
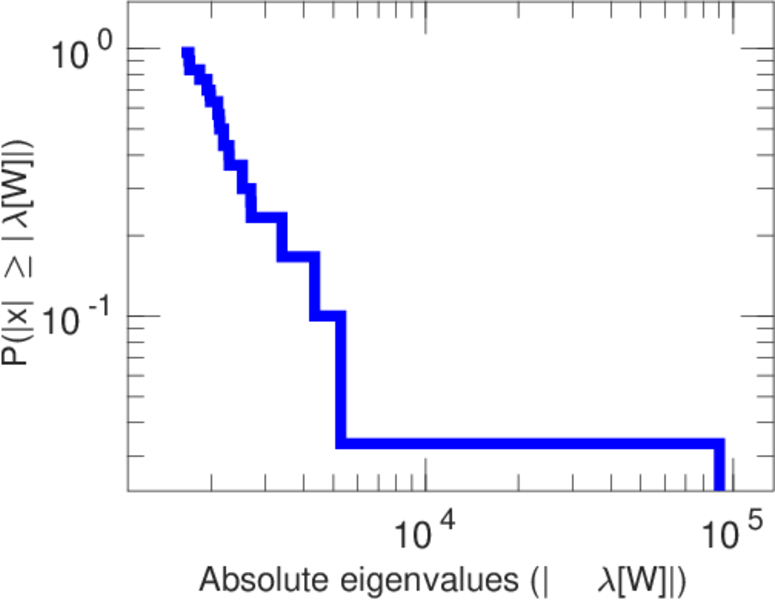
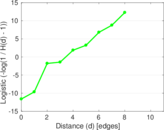
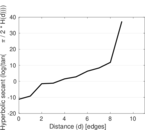
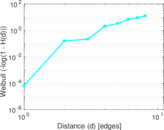
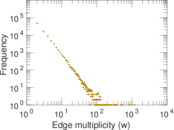
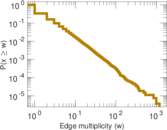
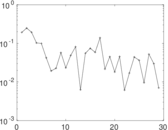
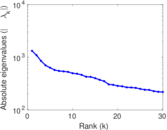
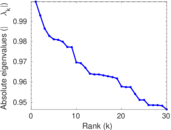
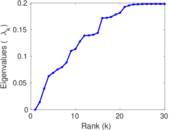
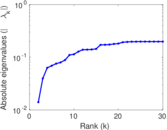
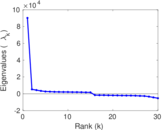
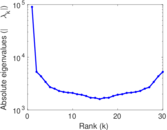
Plots


Matrix decompositions plots


Downloads
References
|
[1]
|
Jérôme Kunegis.
KONECT – The Koblenz Network Collection.
In Proc. Int. Conf. on World Wide Web Companion, pages
1343–1350, 2013.
[ http ]
|
|
[2]
|
Wikimedia Foundation.
Wikimedia downloads.
http://dumps.wikimedia.org/, January 2010.
|
 KONECT ‣ Networks ‣
Buy Me a Coffee
KONECT ‣ Networks ‣
Buy Me a Coffee