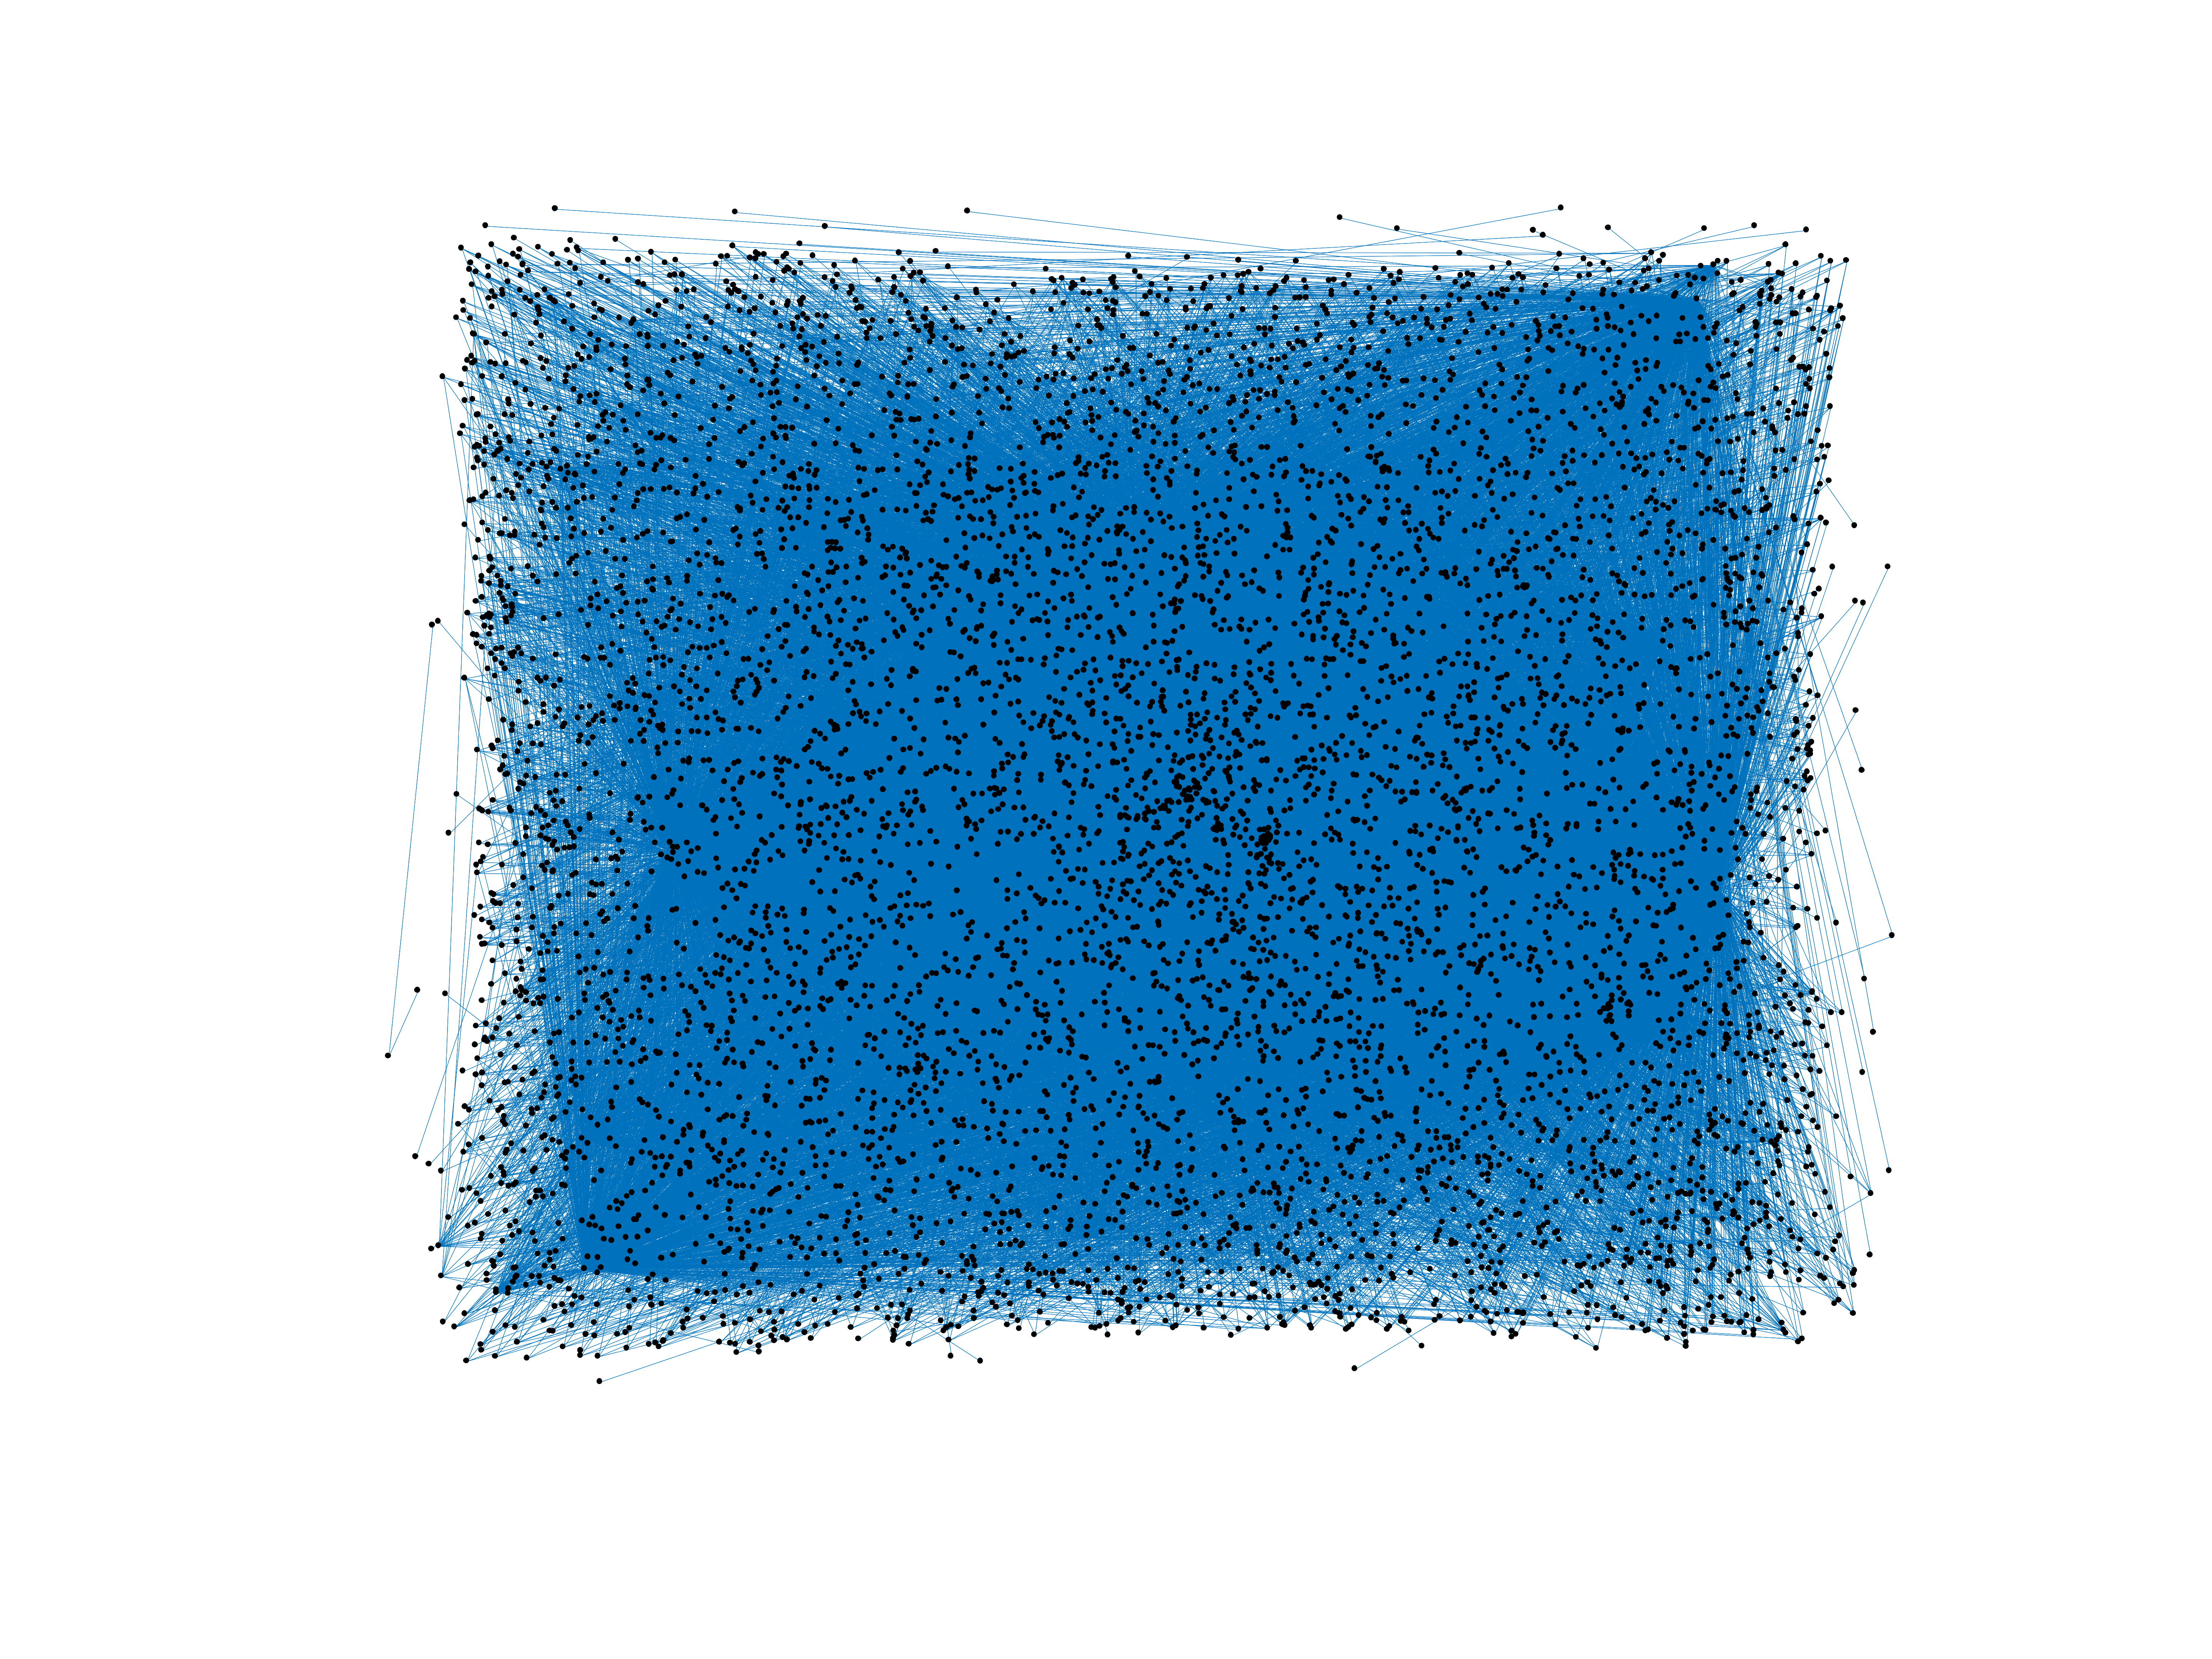
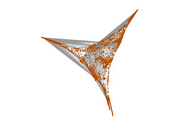
Wiktionary edits (ne)
This is the bipartite edit network of the Nepali Wiktionary. It contains users
and pages from the Nepali Wiktionary, connected by edit events. Each edge
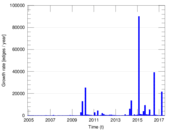
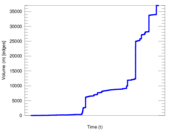
represents an edit. The dataset includes the timestamp of each edit.
Metadata
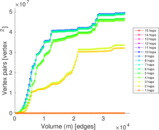
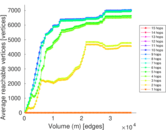
Statistics
| Size | n = | 7,253
|
| Left size | n1 = | 274
|
| Right size | n2 = | 6,979
|
| Volume | m = | 37,048
|
| Unique edge count | m̿ = | 24,278
|
| Wedge count | s = | 39,275,267
|
| Claw count | z = | 61,594,025,104
|
| Cross count | x = | 78,536,551,451,922
|
| Square count | q = | 34,195,136
|
| 4-Tour count | T4 = | 430,737,952
|
| Maximum degree | dmax = | 12,422
|
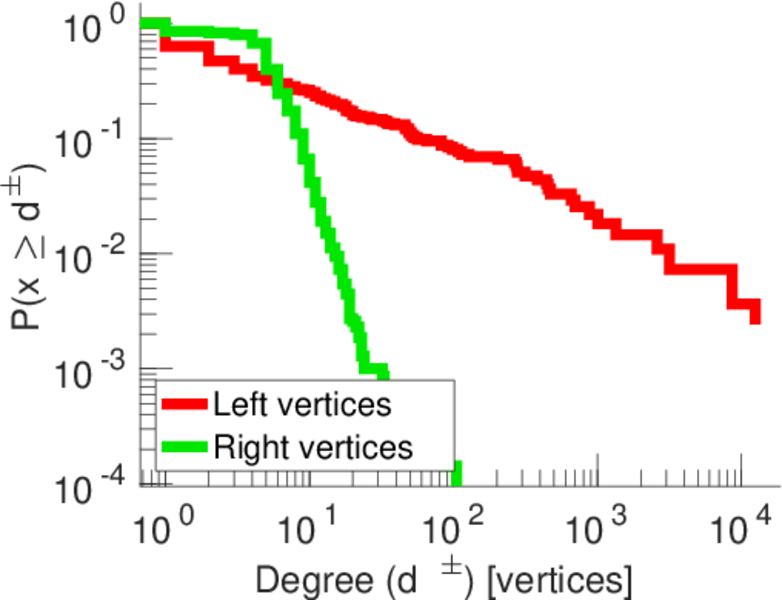
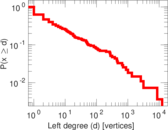
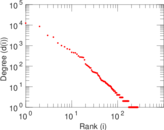
| Maximum left degree | d1max = | 12,422
|
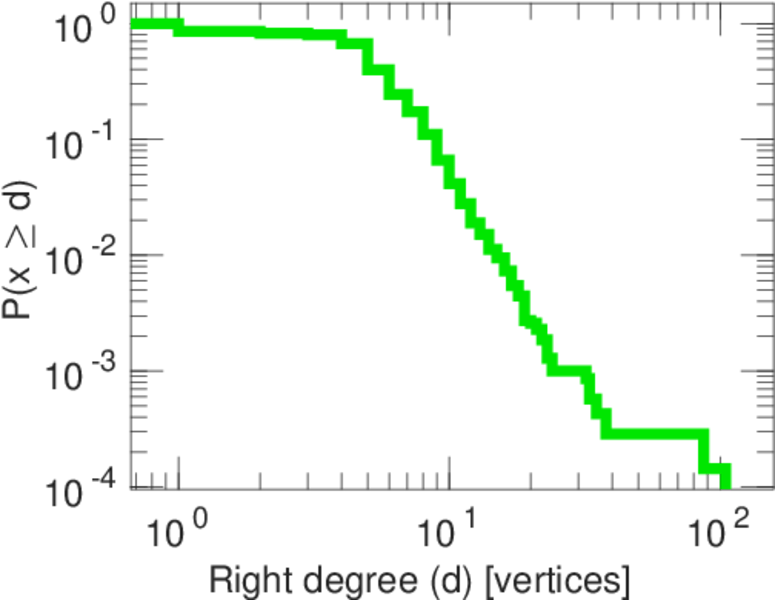
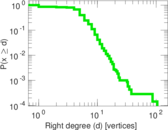
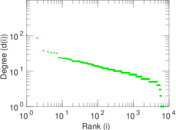
| Maximum right degree | d2max = | 105
|
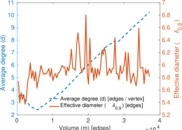
| Average degree | d = | 10.215 9
|
| Average left degree | d1 = | 135.212
|
| Average right degree | d2 = | 5.308 50
|
| Fill | p = | 0.012 696 1
|
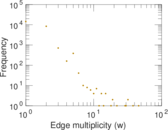
| Average edge multiplicity | m̃ = | 1.525 99
|
| Size of LCC | N = | 7,031
|
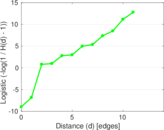
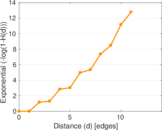
| Diameter | δ = | 15
|
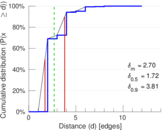
| 50-Percentile effective diameter | δ0.5 = | 1.723 44
|
| 90-Percentile effective diameter | δ0.9 = | 3.807 02
|
| Median distance | δM = | 2
|
| Mean distance | δm = | 2.702 31
|
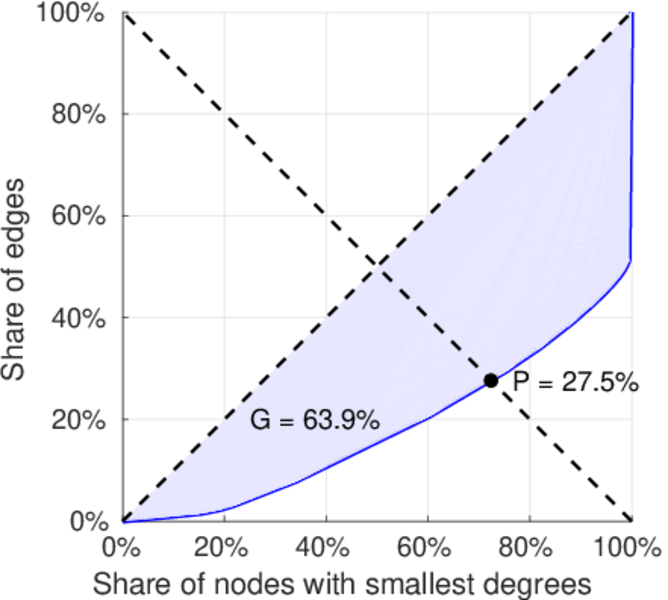
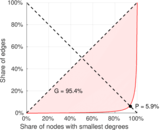
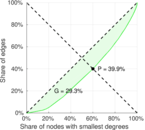
| Gini coefficient | G = | 0.635 912
|
| Balanced inequality ratio | P = | 0.274 914
|
| Left balanced inequality ratio | P1 = | 0.058 950 6
|
| Right balanced inequality ratio | P2 = | 0.398 510
|
| Relative edge distribution entropy | Her = | 0.718 271
|
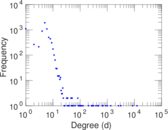
| Power law exponent | γ = | 1.896 91
|
| Tail power law exponent | γt = | 4.551 00
|
| Tail power law exponent with p | γ3 = | 4.551 00
|
| p-value | p = | 0.000 00
|
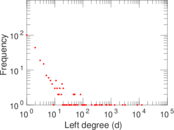
| Left tail power law exponent with p | γ3,1 = | 1.561 00
|
| Left p-value | p1 = | 0.324 000
|
| Right tail power law exponent with p | γ3,2 = | 5.281 00
|
| Right p-value | p2 = | 0.000 00
|
| Degree assortativity | ρ = | −0.155 992
|
| Degree assortativity p-value | pρ = | 4.535 43 × 10−132
|
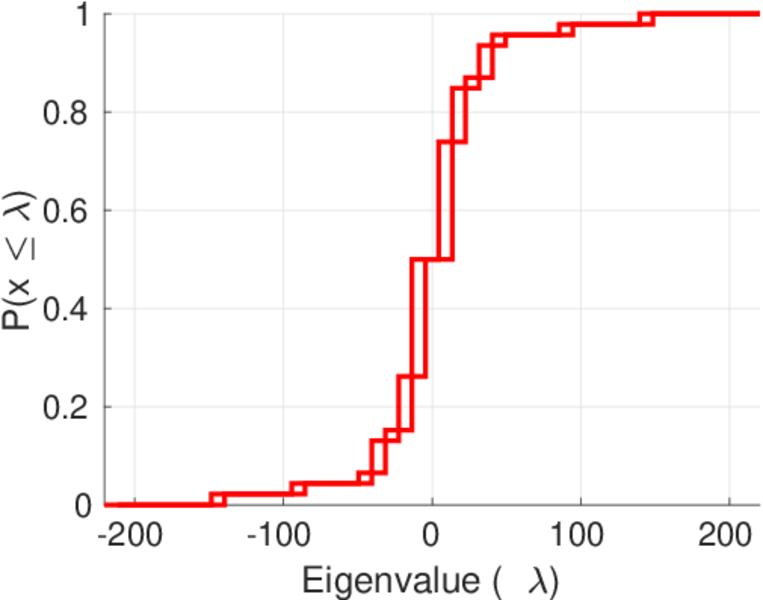
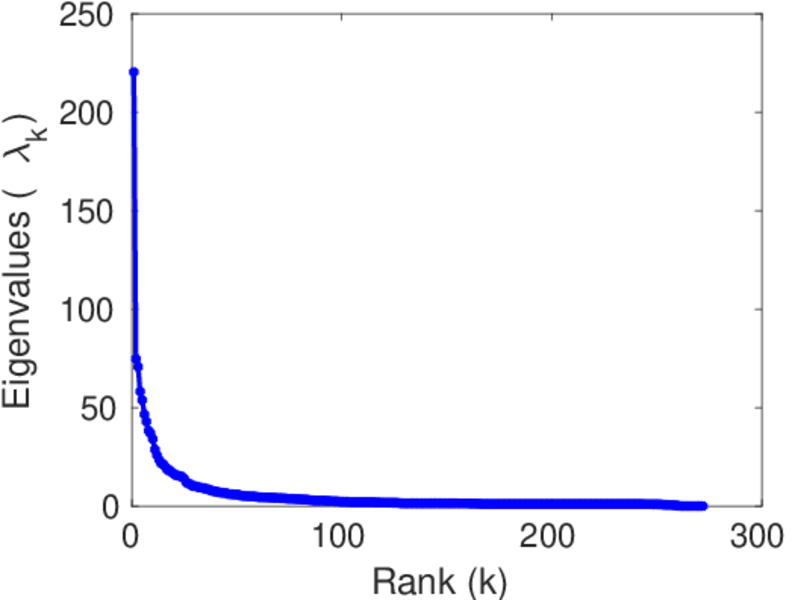
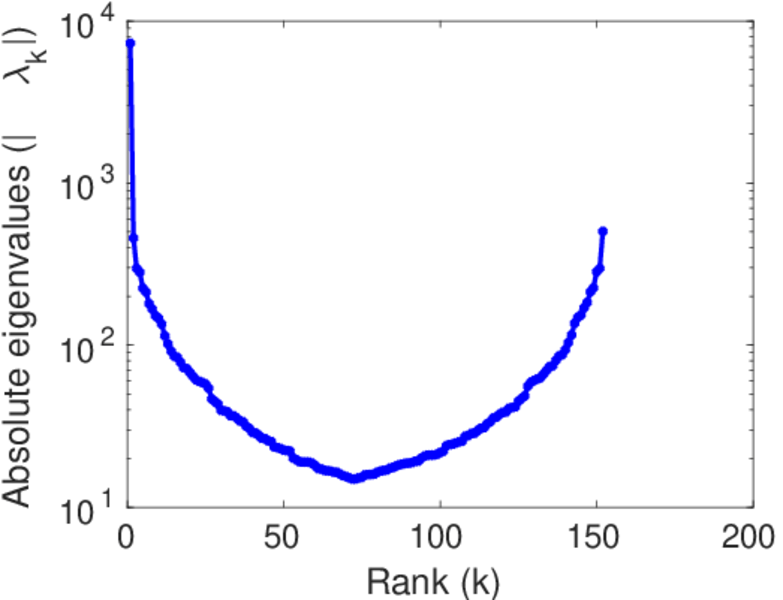
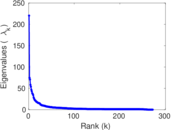
| Spectral norm | α = | 220.316
|
| Algebraic connectivity | a = | 0.023 485 8
|
| Spectral separation | |λ1[A] / λ2[A]| = | 2.947 10
|
| Controllability | C = | 6,718
|
| Relative controllability | Cr = | 0.927 901
|
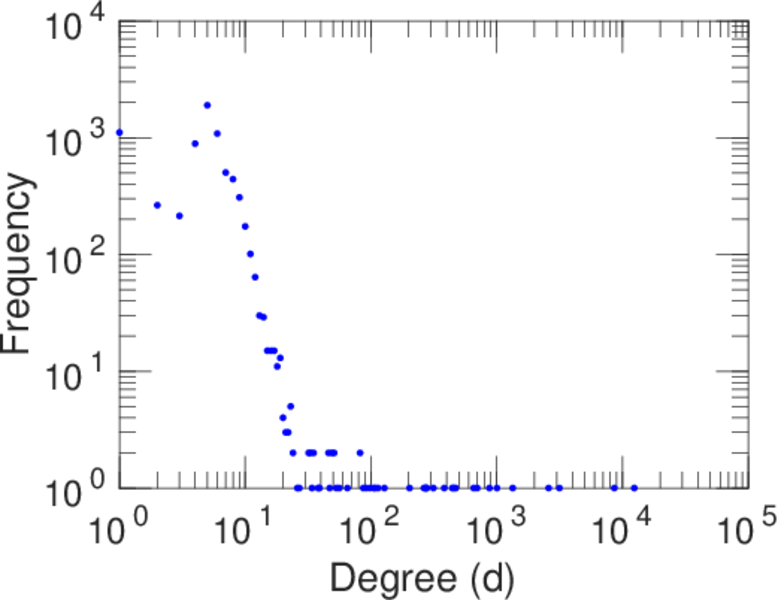
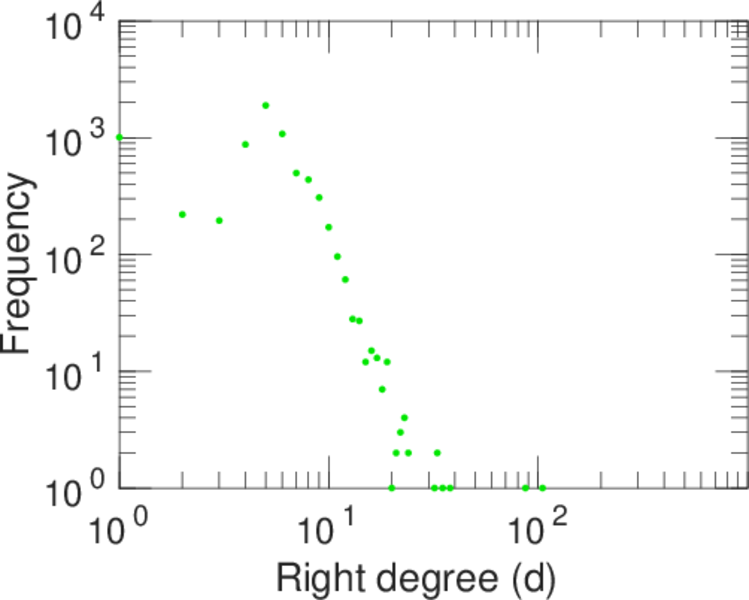
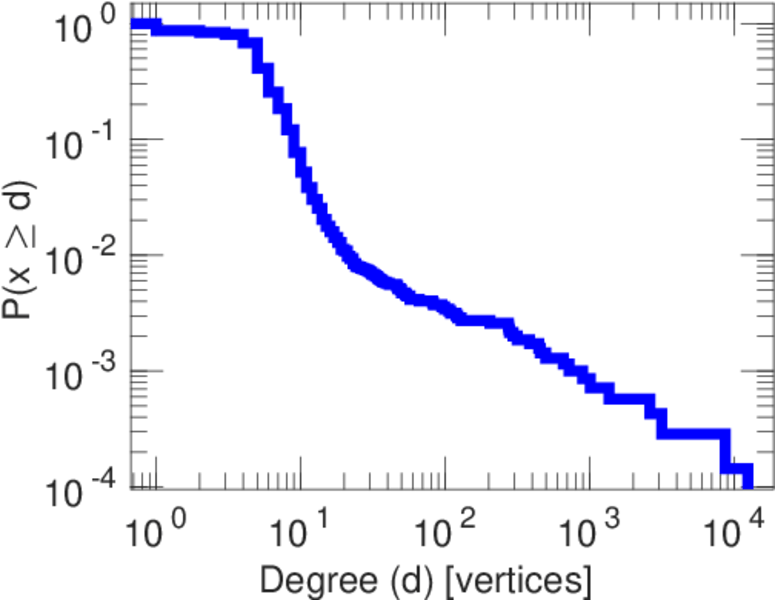
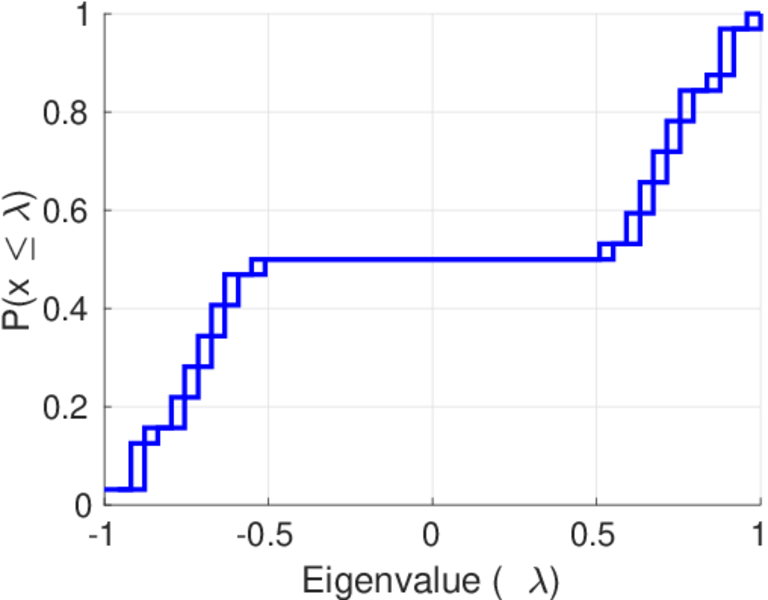
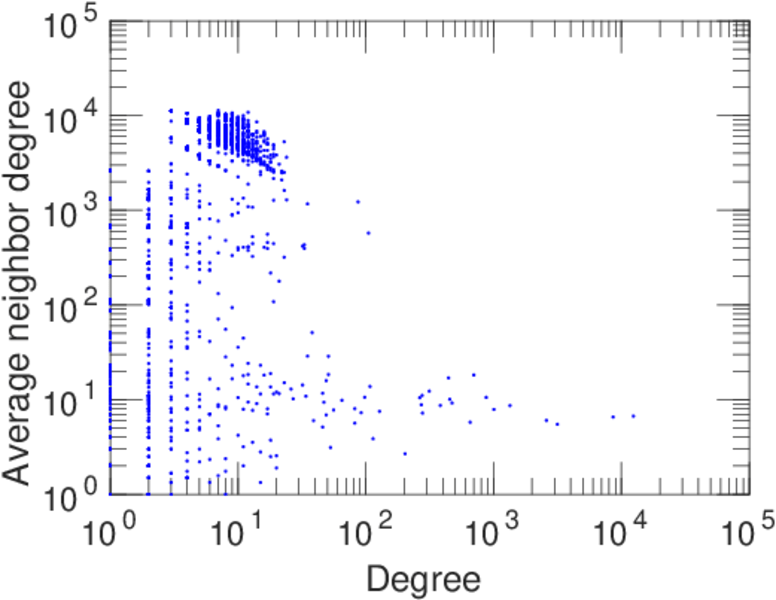
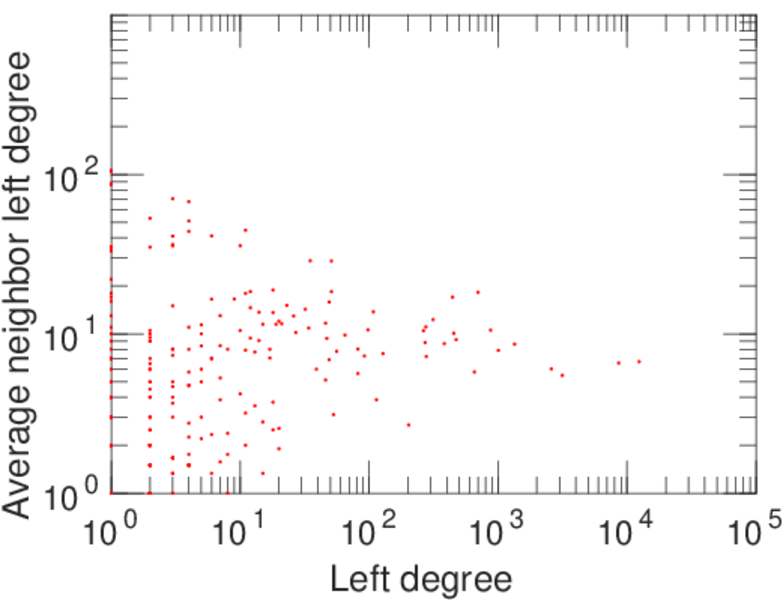
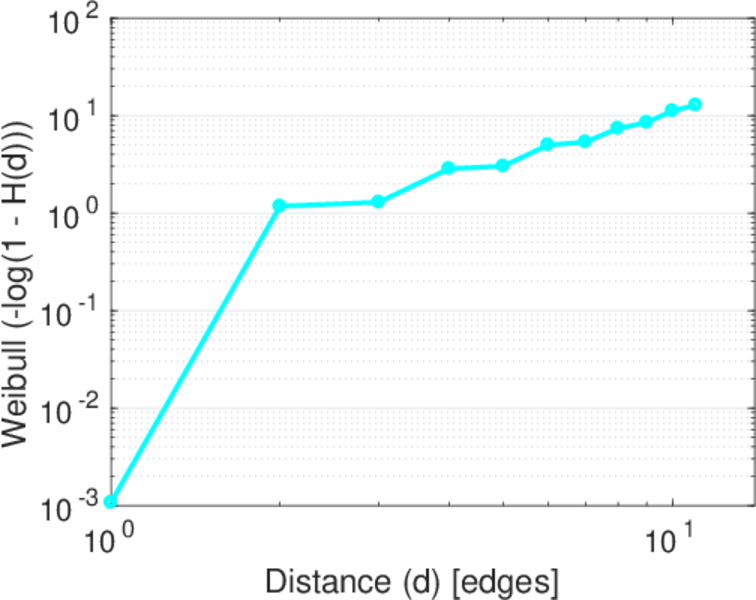
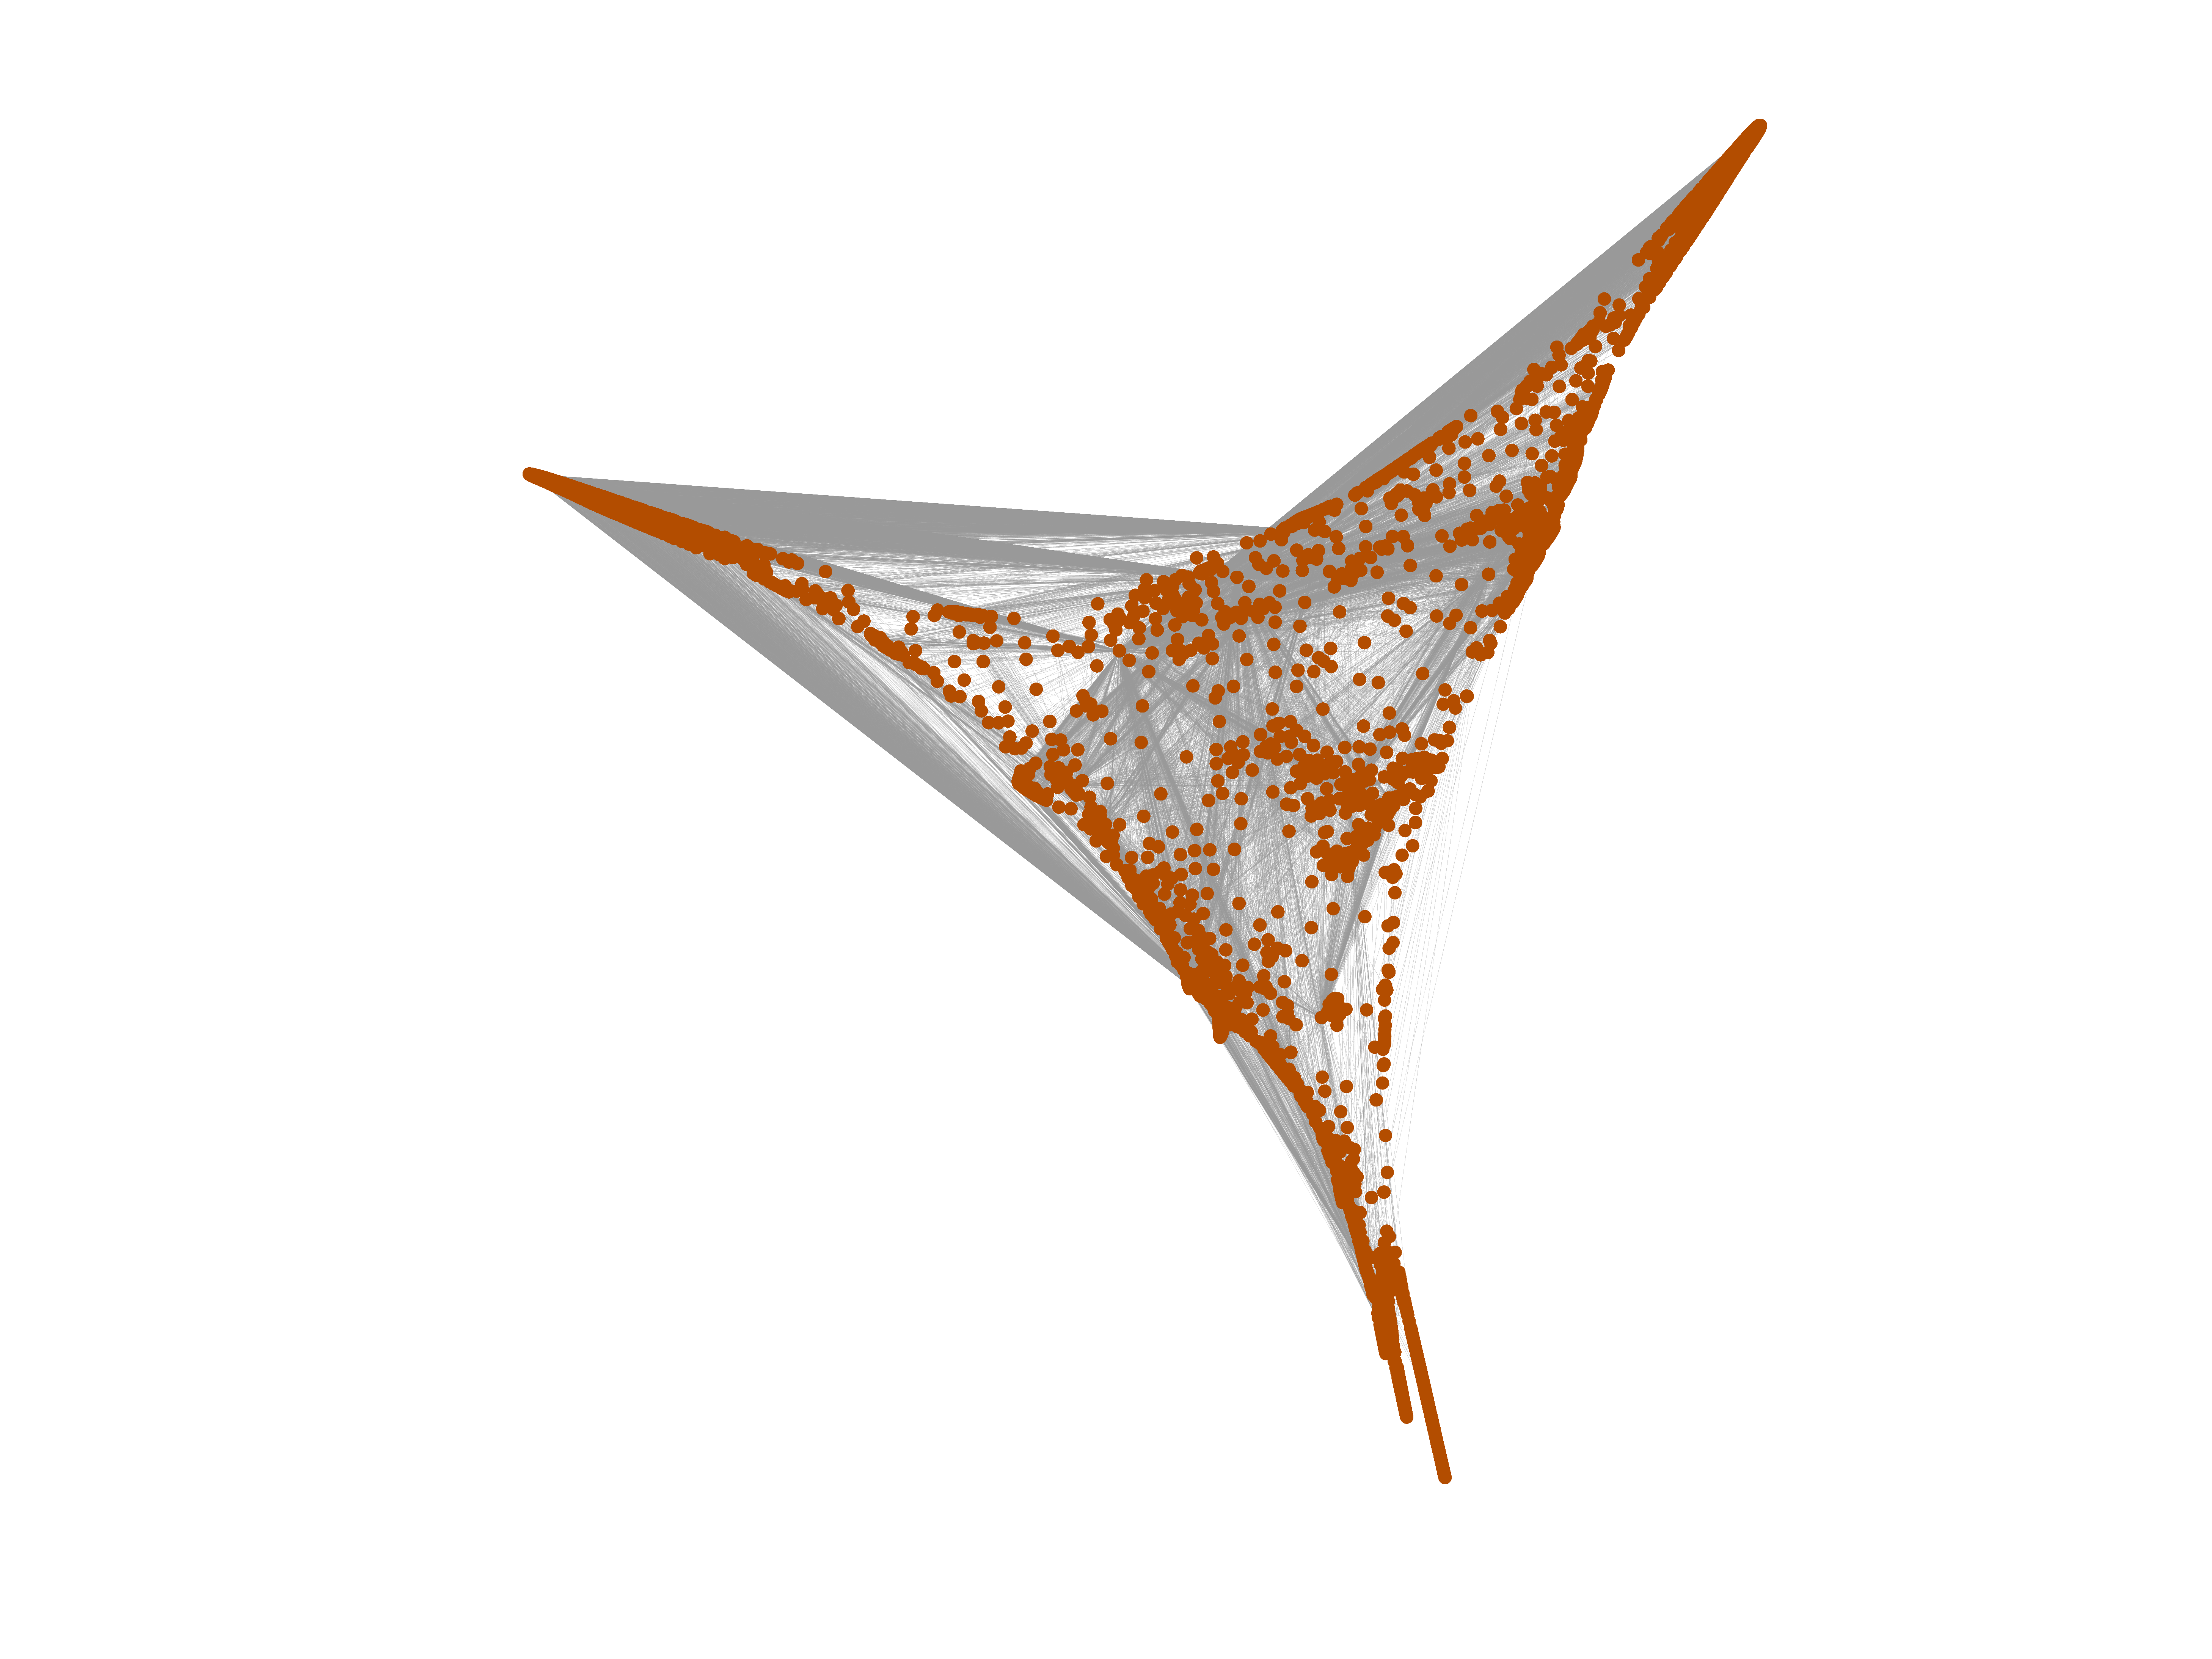
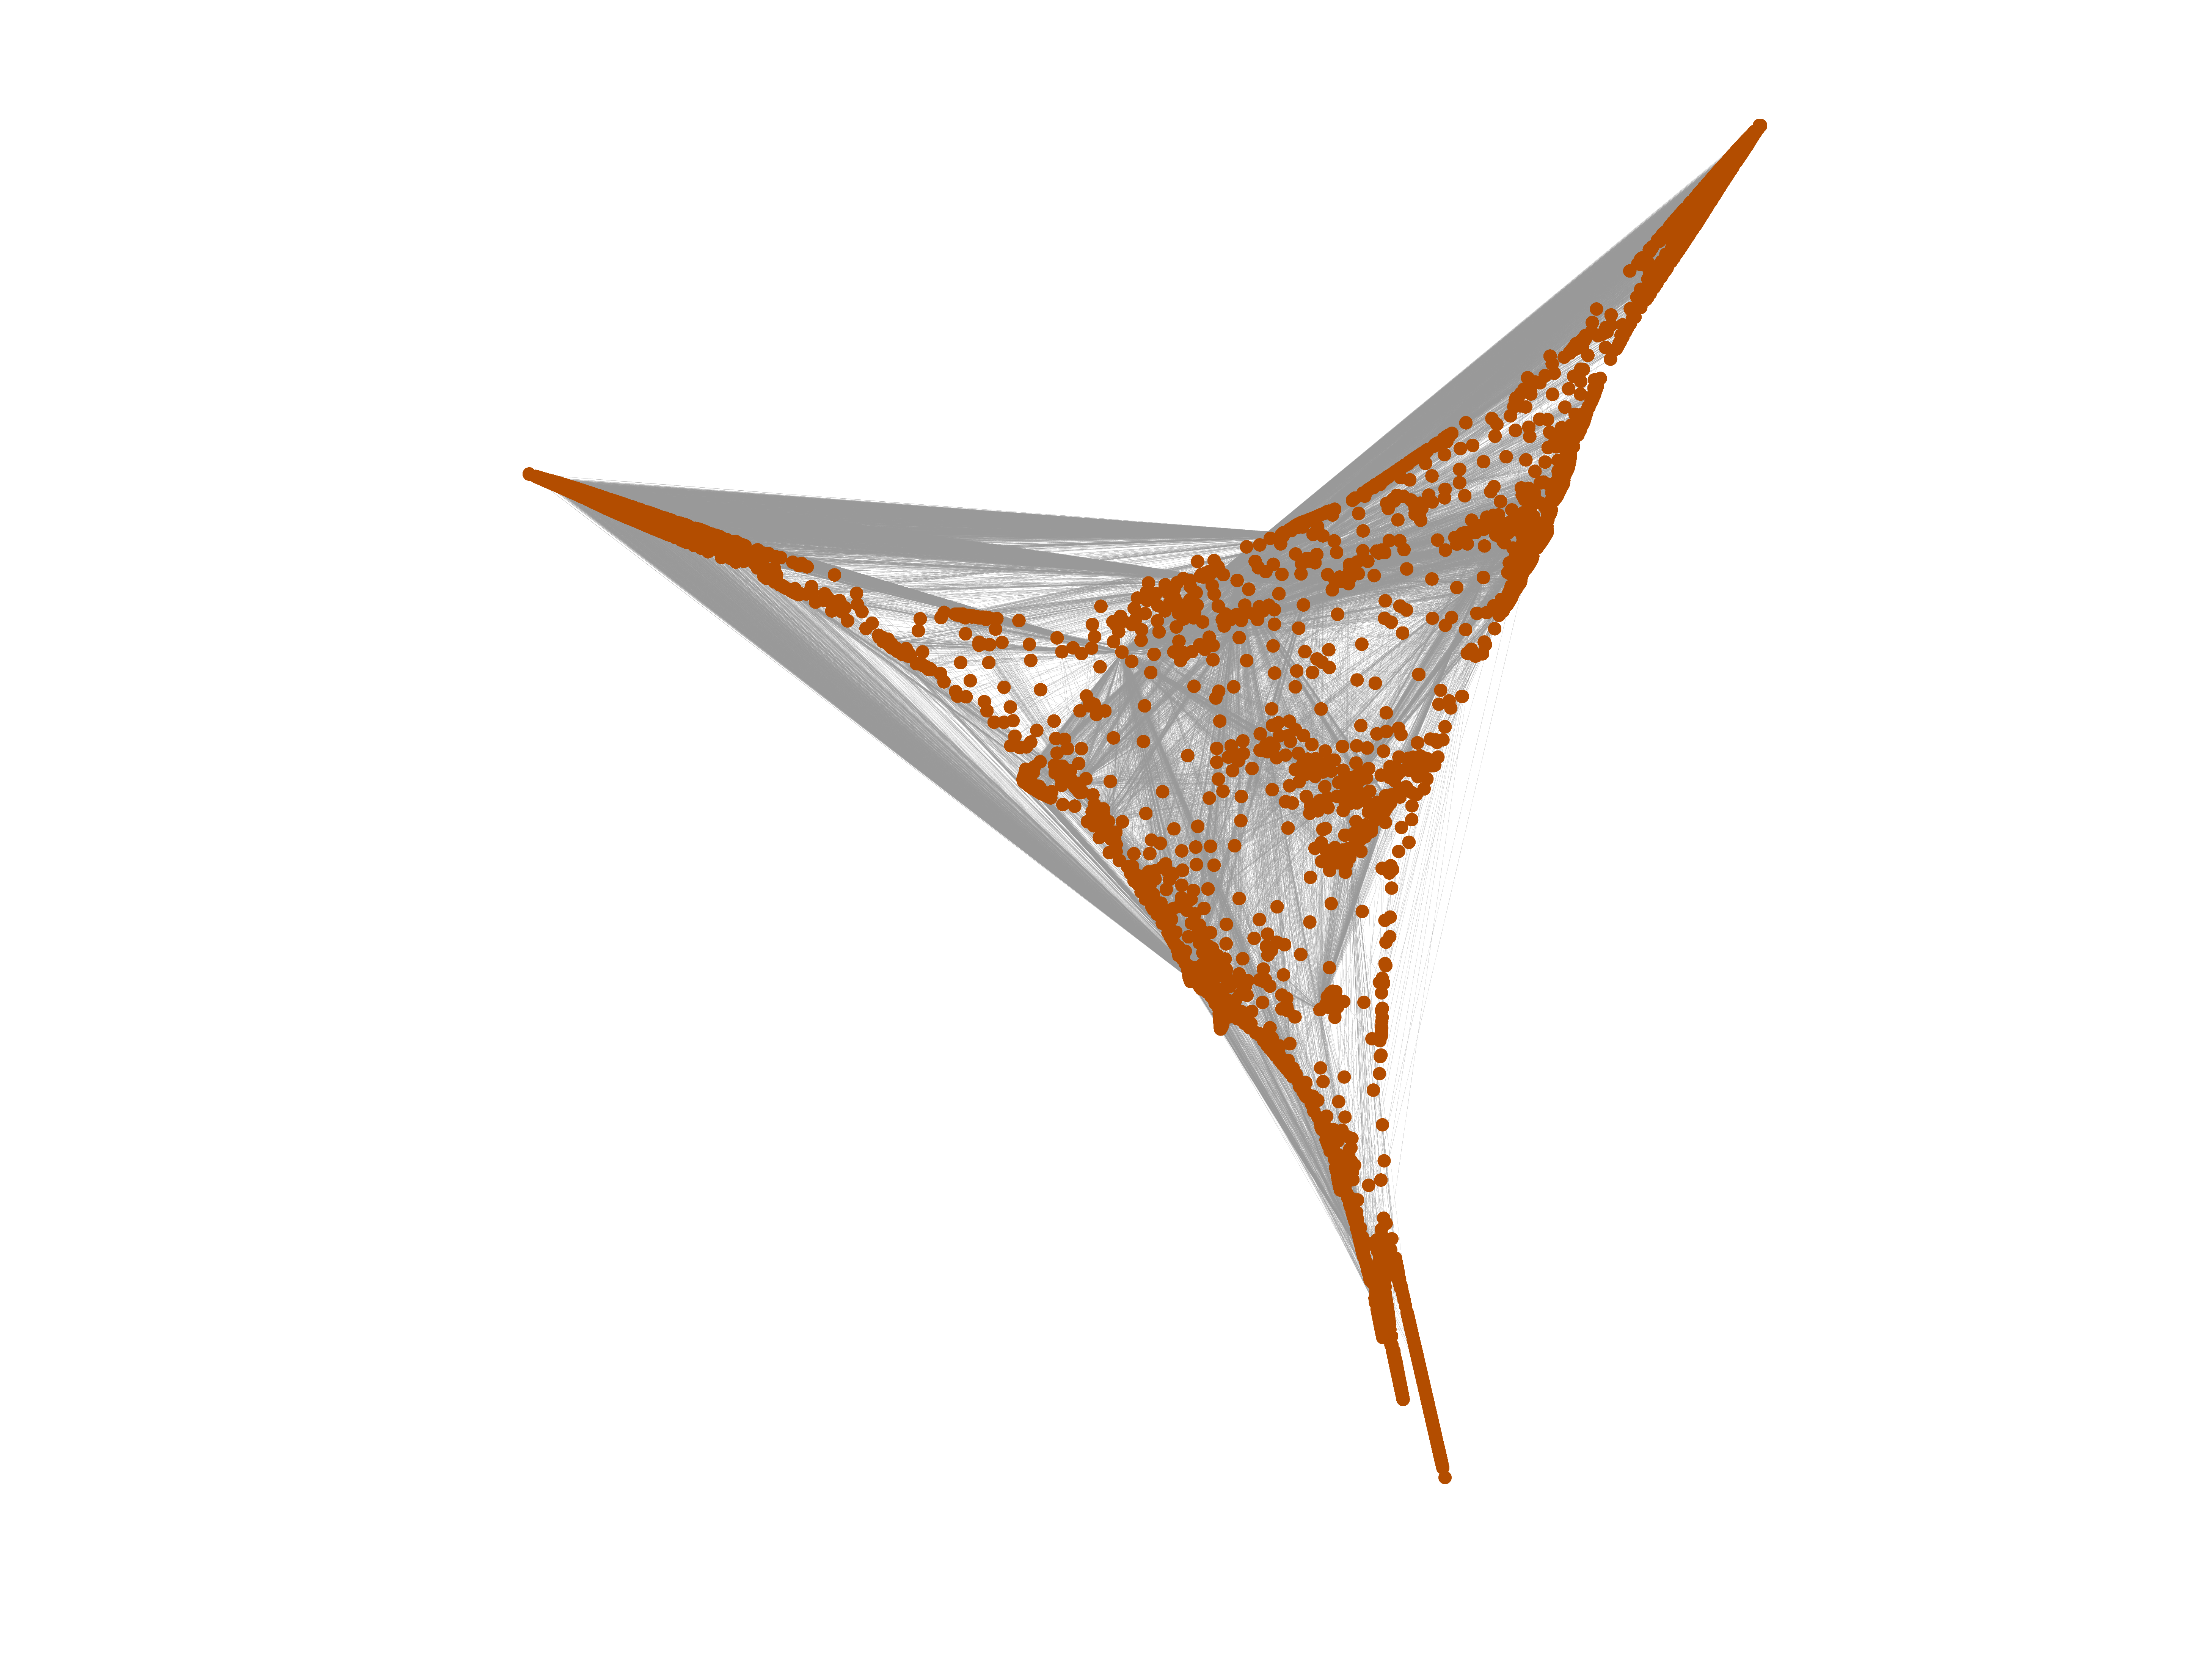
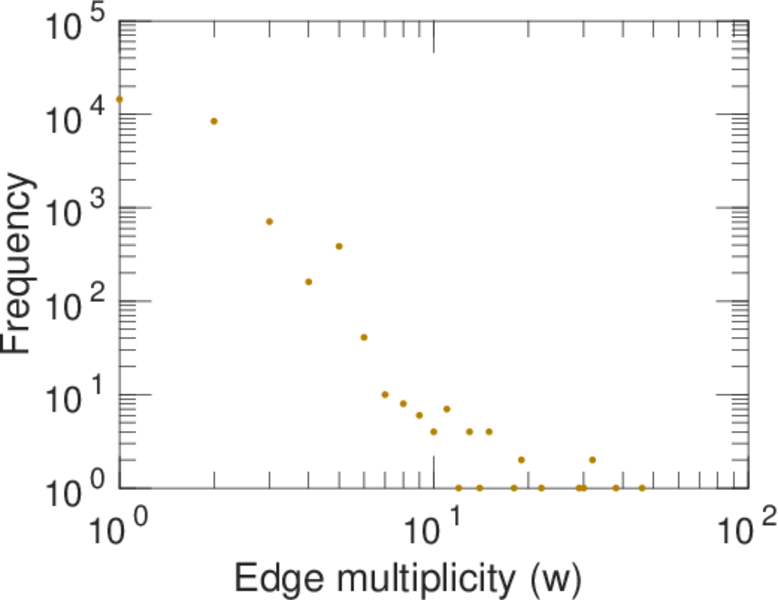
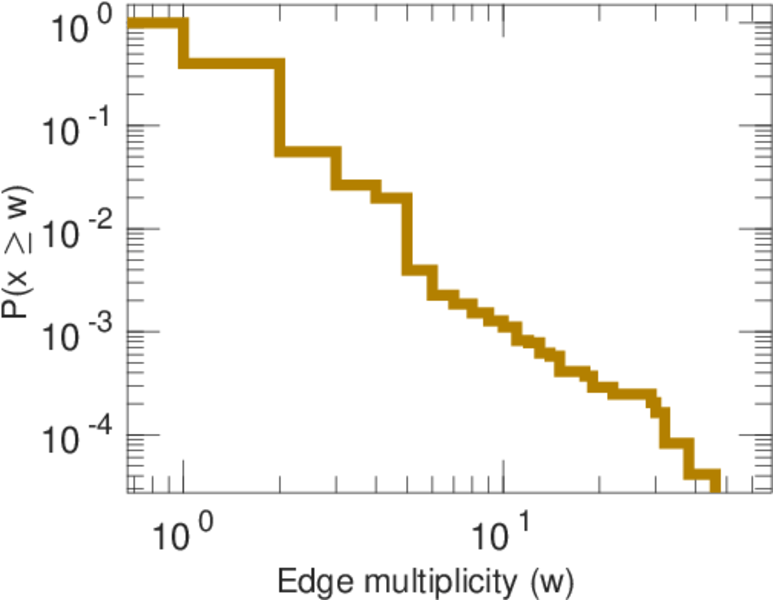
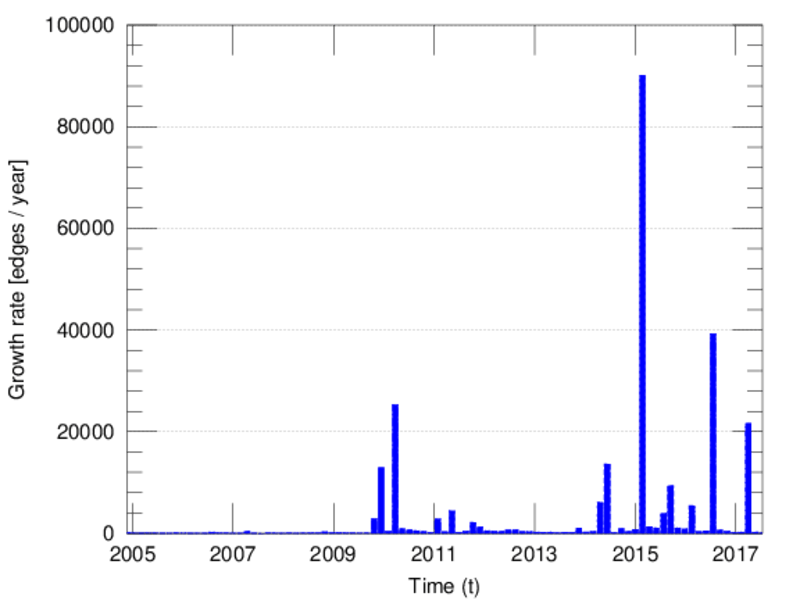
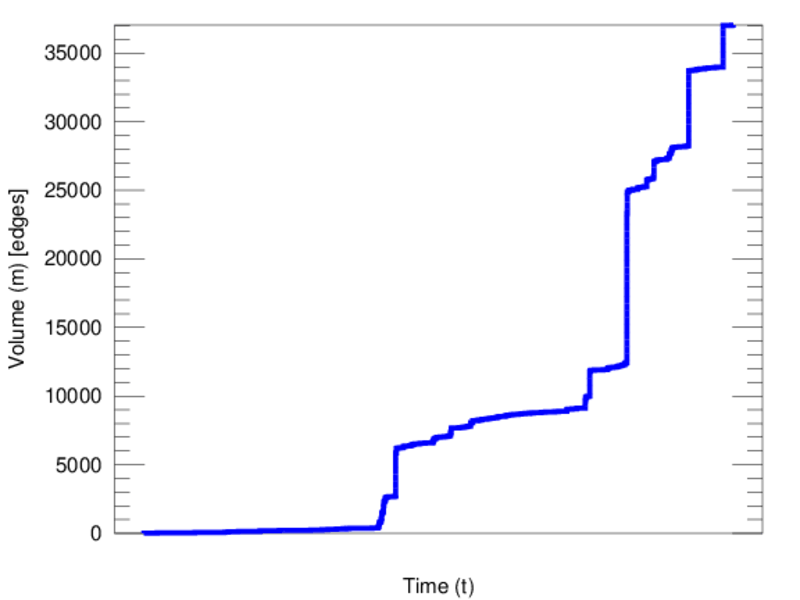
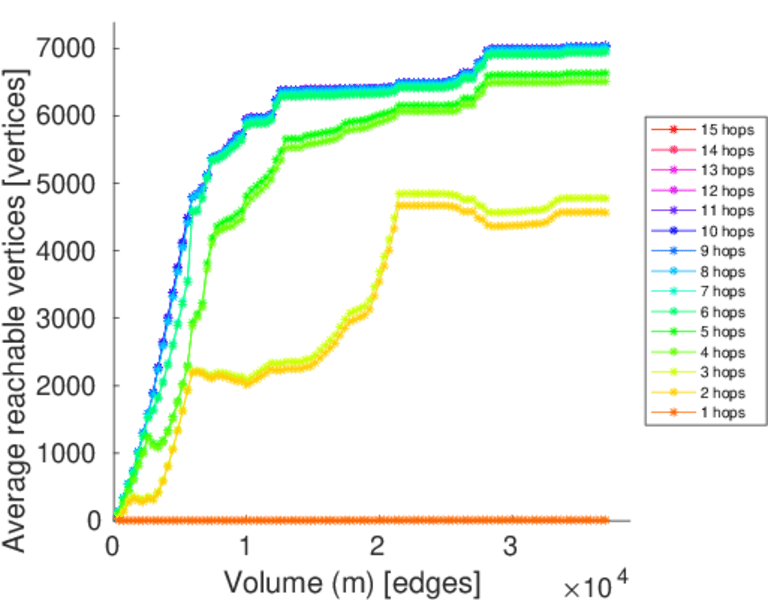
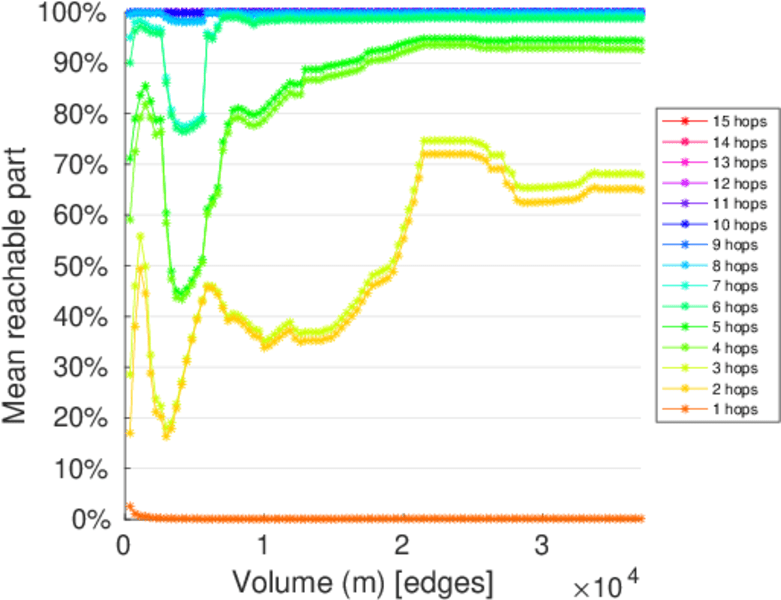
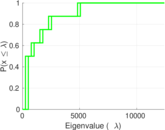
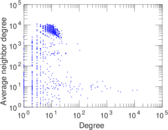
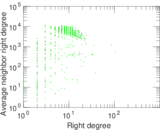
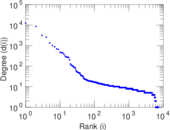
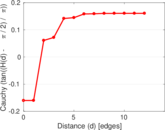
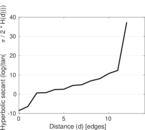
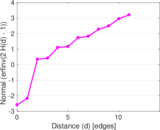
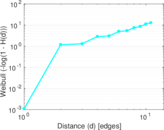
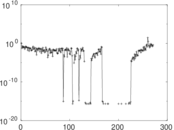
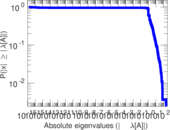
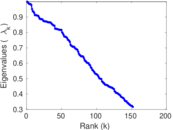
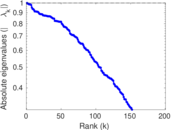
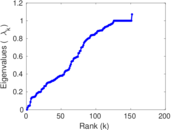
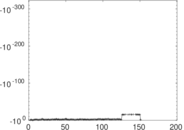
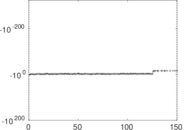
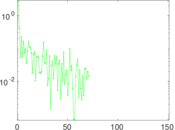
Plots


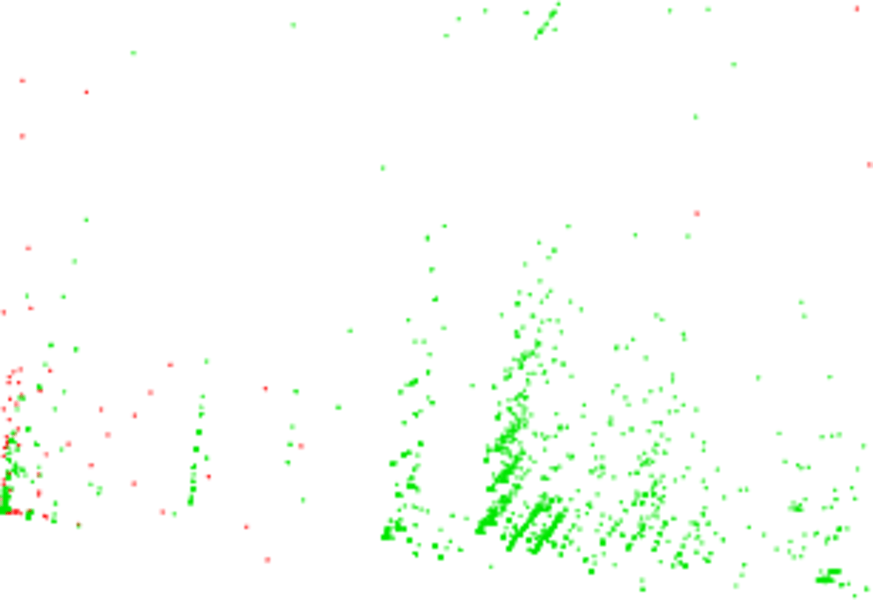
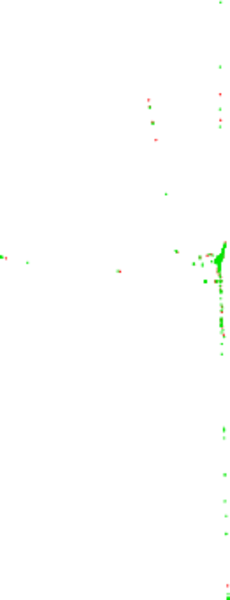
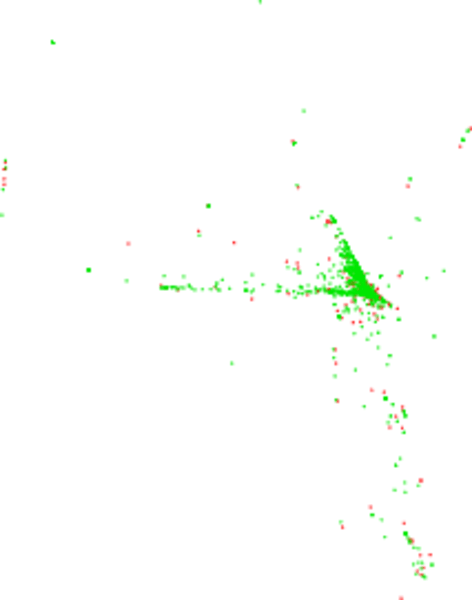
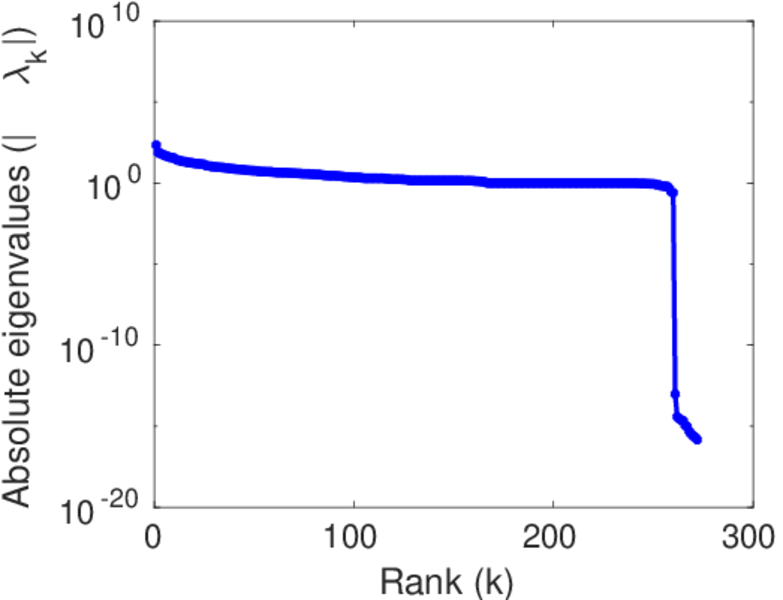
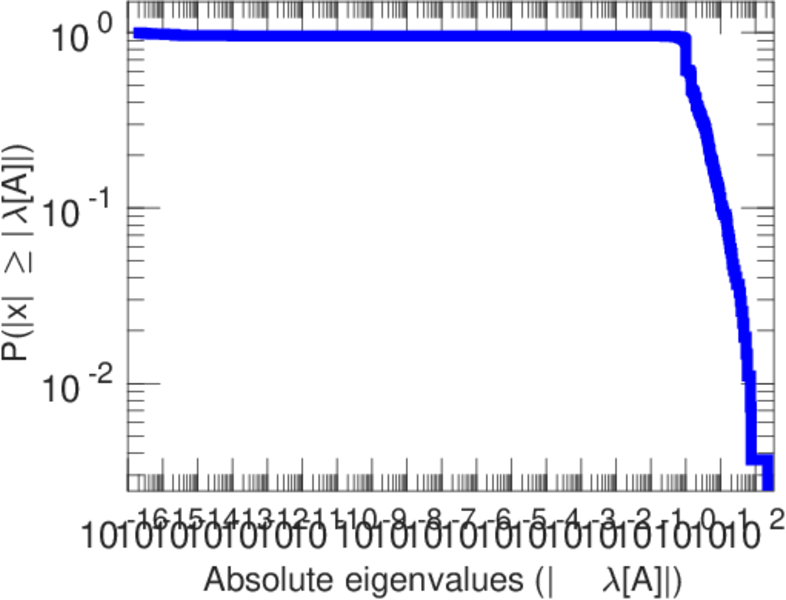
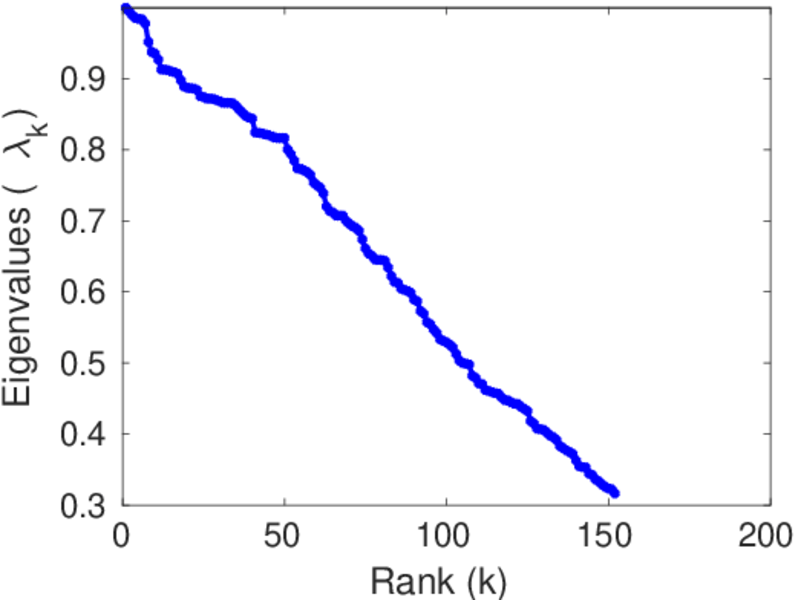
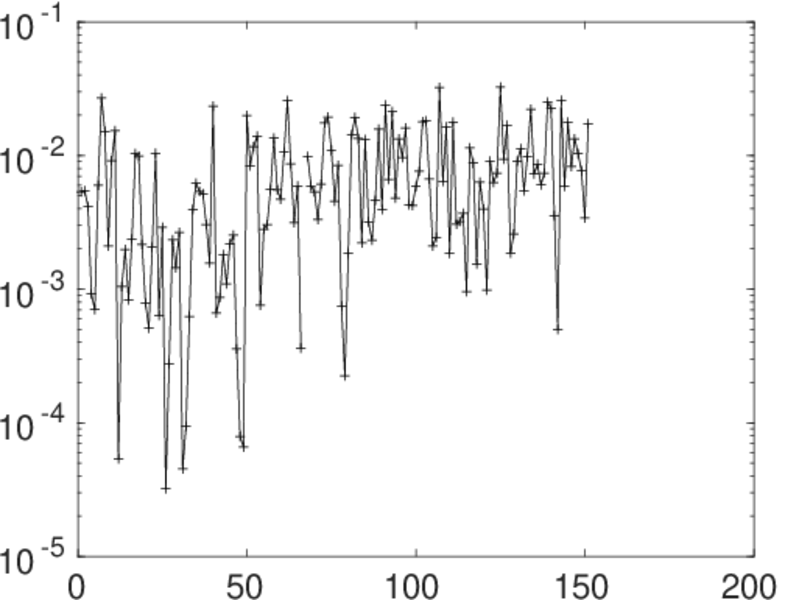
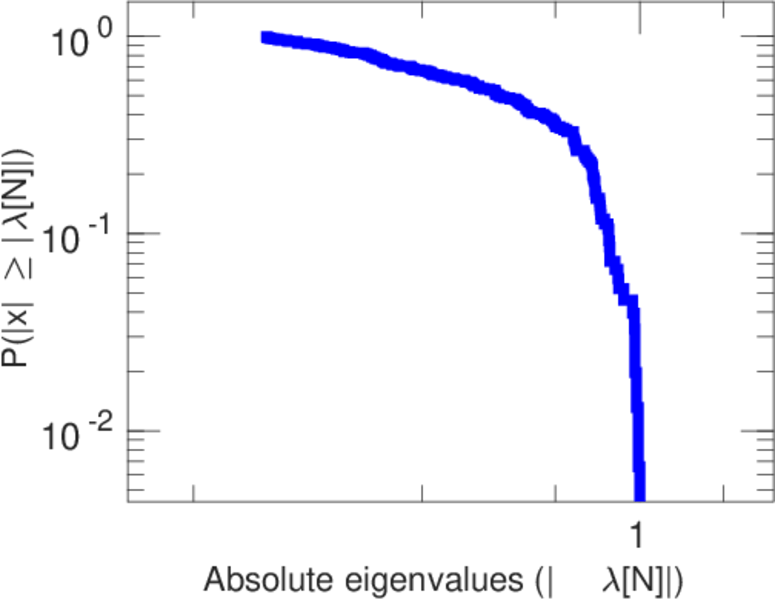
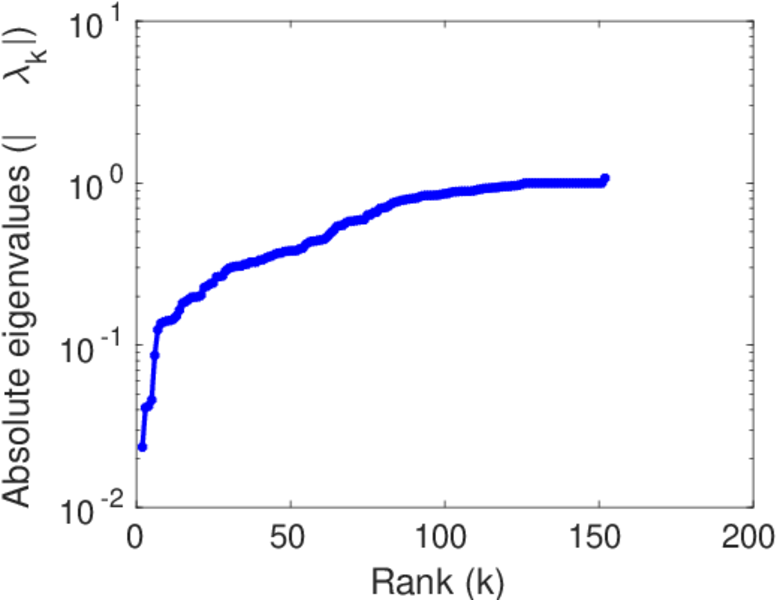
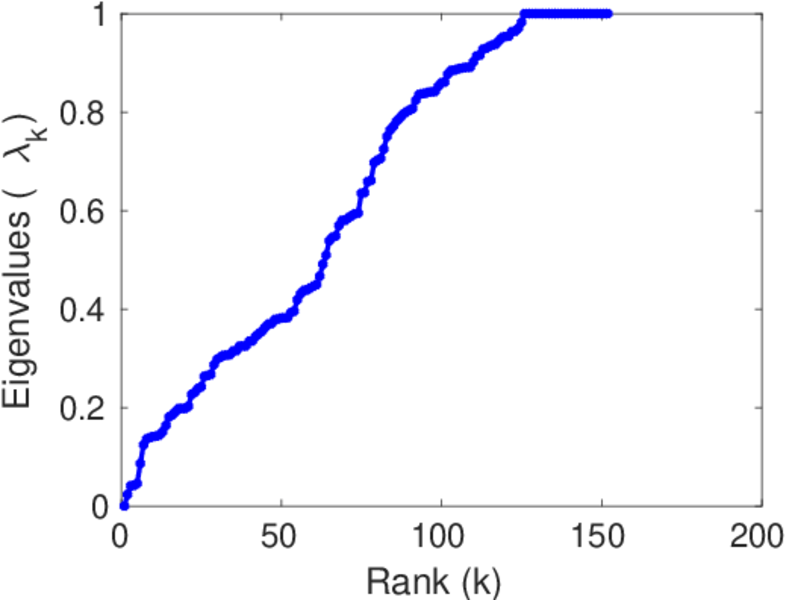
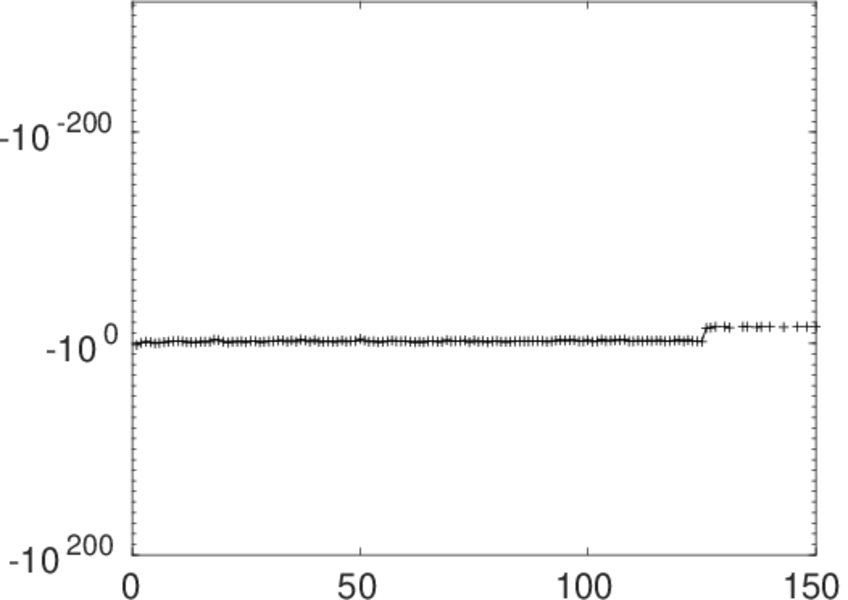
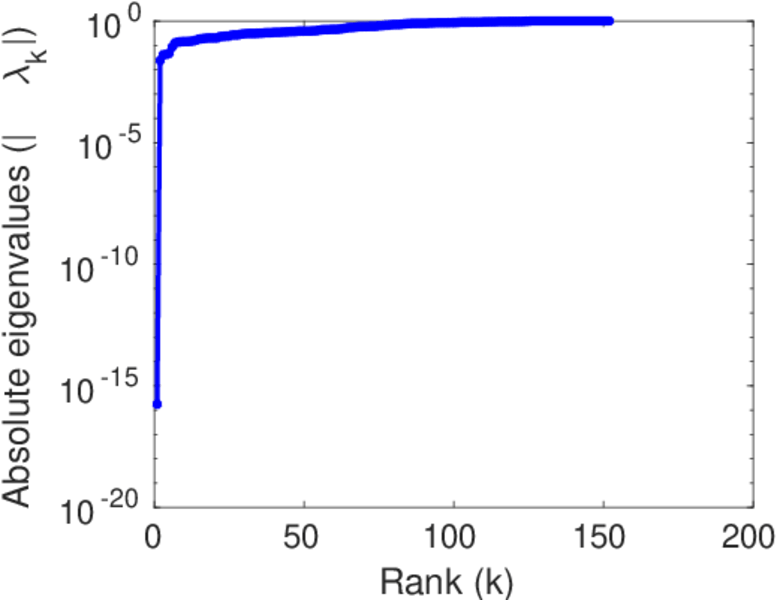
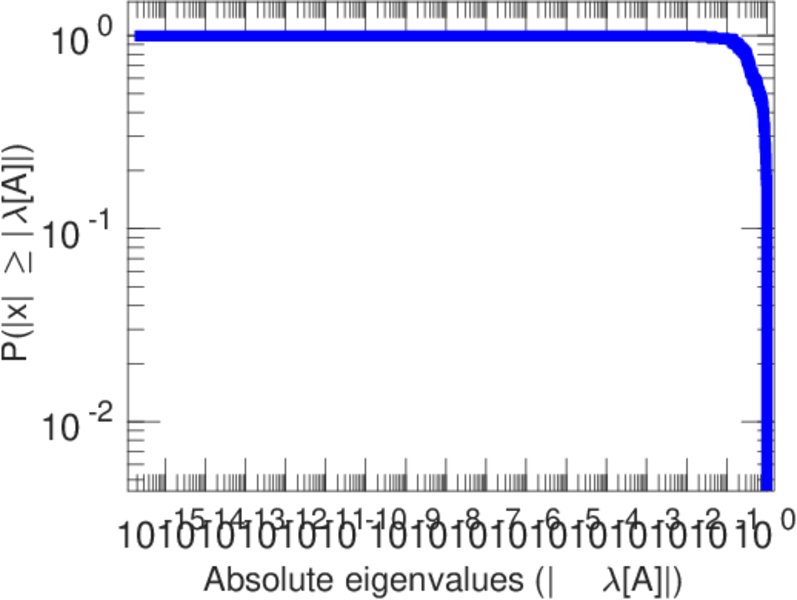
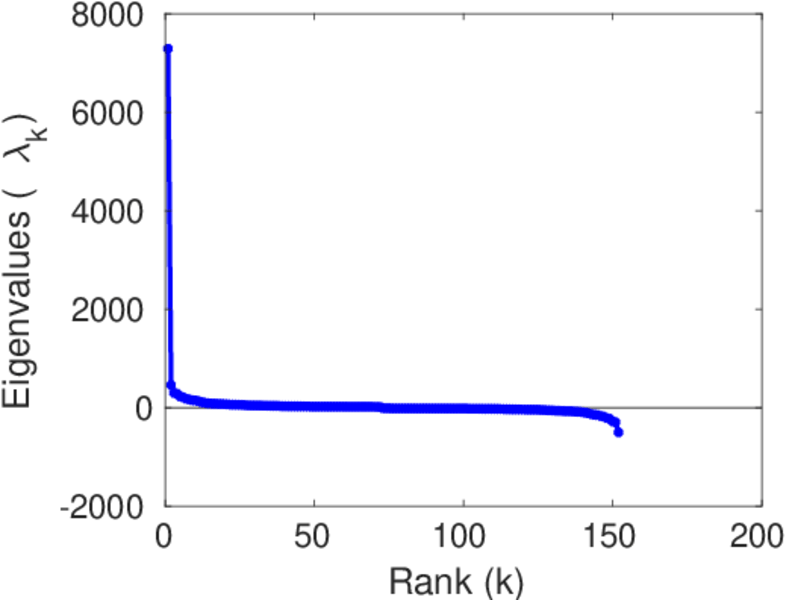
Matrix decompositions plots


Downloads
References
|
[1]
|
Jérôme Kunegis.
KONECT – The Koblenz Network Collection.
In Proc. Int. Conf. on World Wide Web Companion, pages
1343–1350, 2013.
[ http ]
|
|
[2]
|
Wikimedia Foundation.
Wikimedia downloads.
http://dumps.wikimedia.org/, January 2010.
|
 KONECT ‣ Networks ‣
Buy Me a Coffee
KONECT ‣ Networks ‣
Buy Me a Coffee