Wikipedia edits (new)
This is the bipartite edit network of the Newari Wikipedia. It contains users
and pages from the Newari Wikipedia, connected by edit events. Each edge
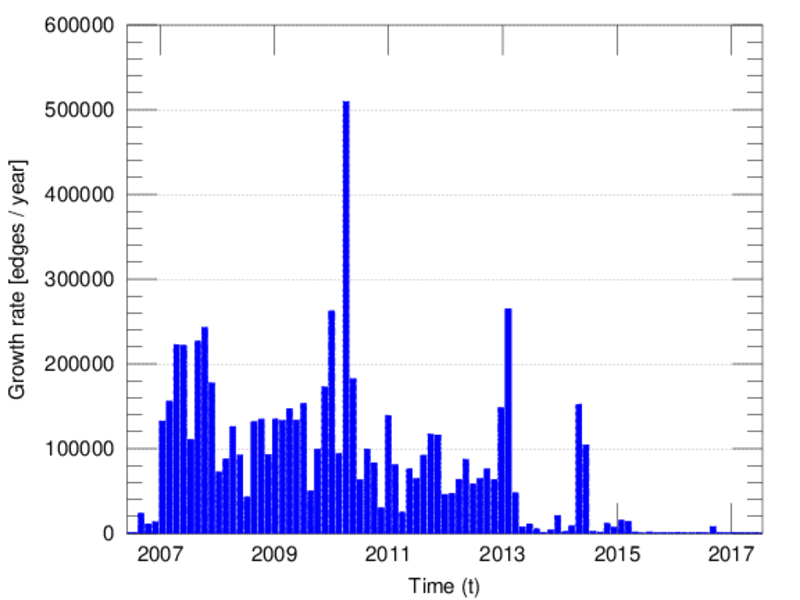
represents an edit. The dataset includes the timestamp of each edit.
Metadata
Statistics
| Size | n = | 197,437
|
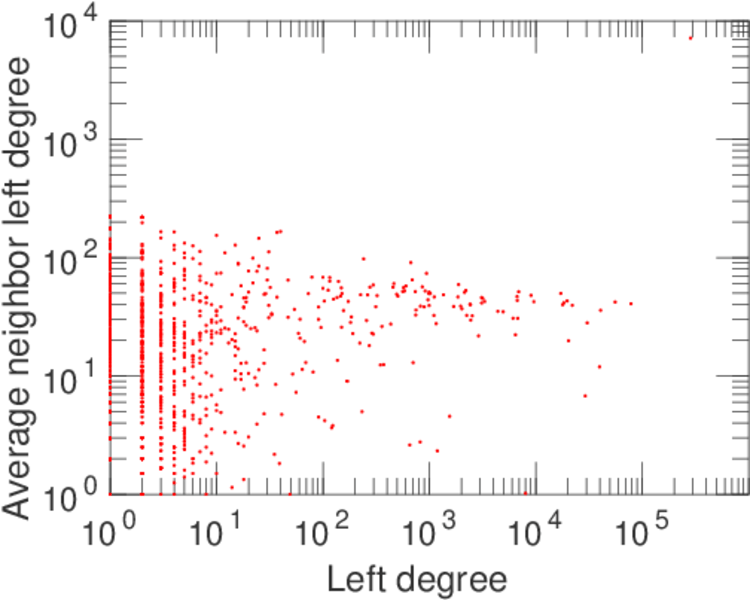
| Left size | n1 = | 1,319
|
| Right size | n2 = | 196,118
|
| Volume | m = | 833,293
|
| Unique edge count | m̿ = | 465,172
|
| Wedge count | s = | 15,036,219,561
|
| Claw count | z = | 736,074,663,612,693
|
| Cross count | x = | 2.969 44 × 1019
|
| Square count | q = | 3,499,549,836
|
| 4-Tour count | T4 = | 88,142,358,692
|
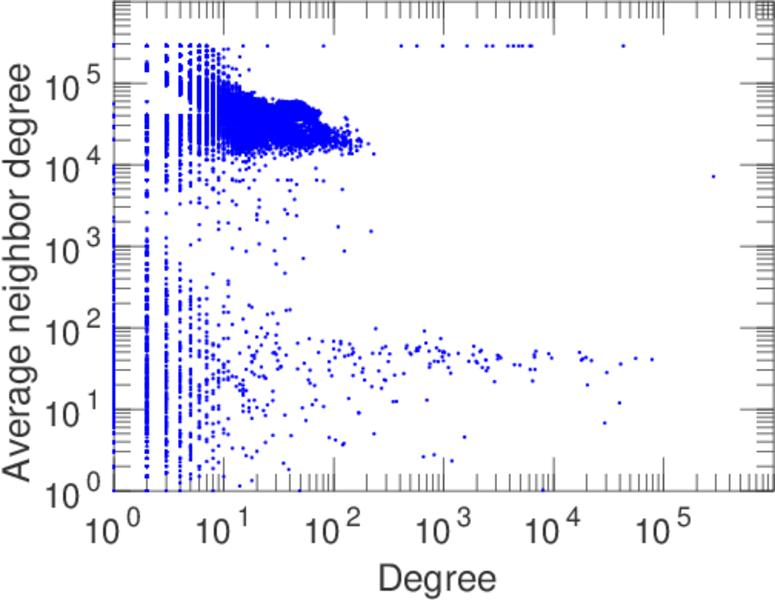
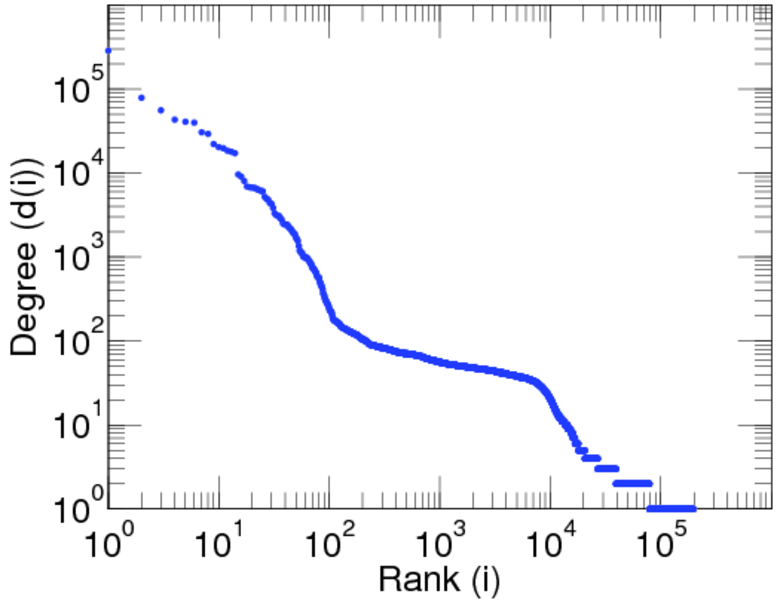
| Maximum degree | dmax = | 285,124
|
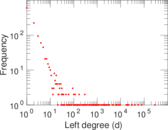
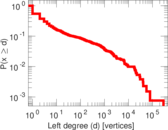
| Maximum left degree | d1max = | 285,124
|
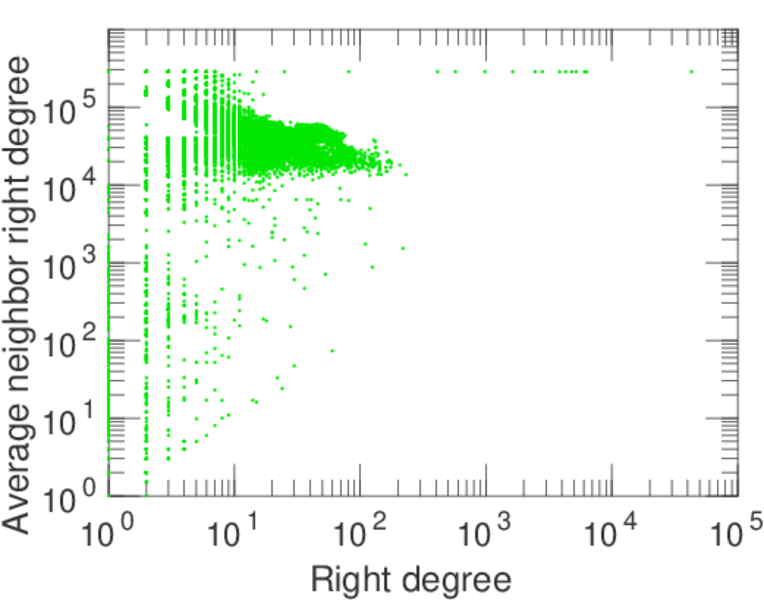
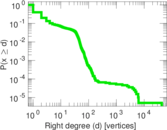
| Maximum right degree | d2max = | 43,096
|
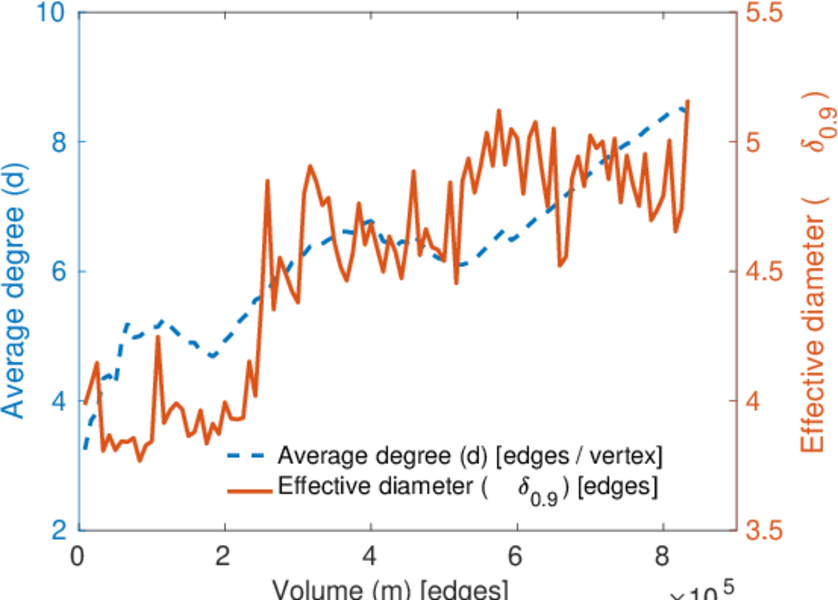
| Average degree | d = | 8.441 10
|
| Average left degree | d1 = | 631.761
|
| Average right degree | d2 = | 4.248 94
|
| Fill | p = | 0.001 798 26
|
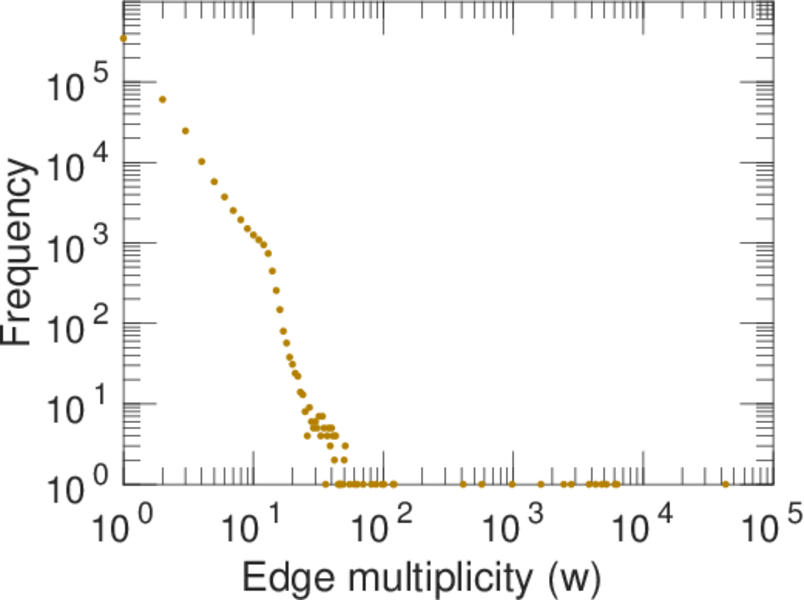
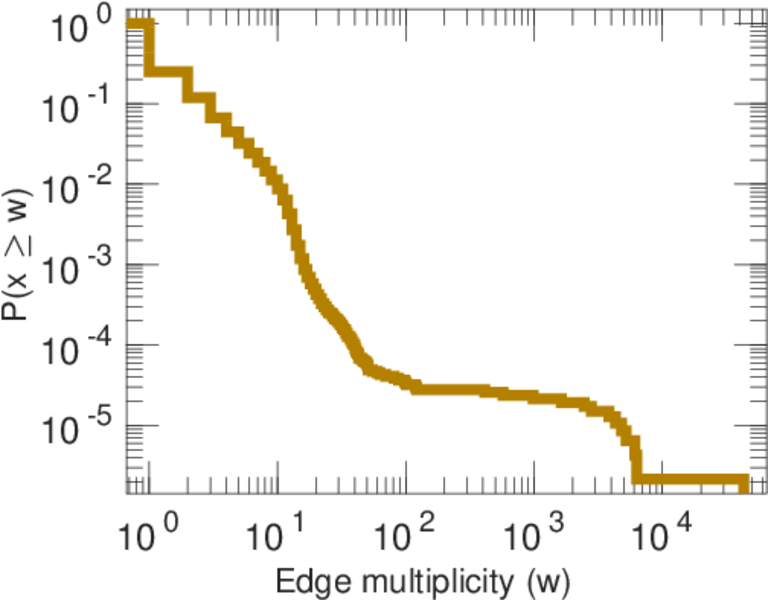
| Average edge multiplicity | m̃ = | 1.791 37
|
| Size of LCC | N = | 196,579
|
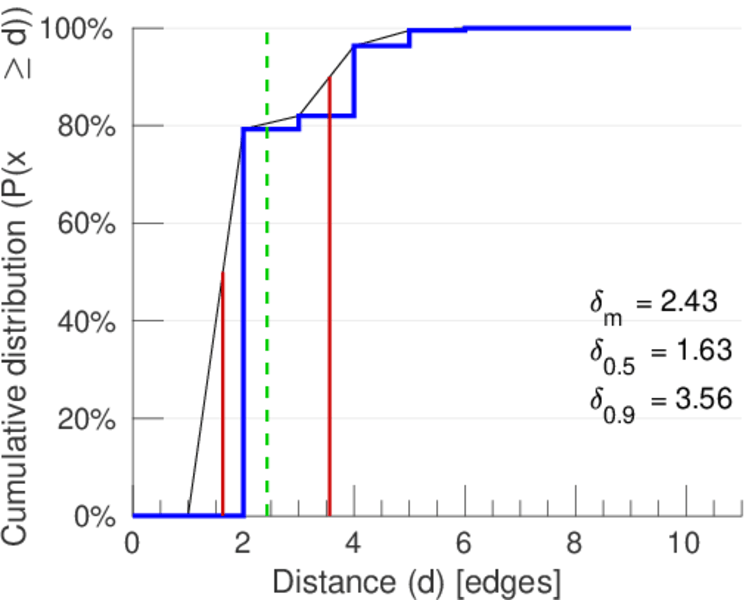
| Diameter | δ = | 11
|
| 50-Percentile effective diameter | δ0.5 = | 1.630 60
|
| 90-Percentile effective diameter | δ0.9 = | 3.559 98
|
| Median distance | δM = | 2
|
| Mean distance | δm = | 2.429 49
|
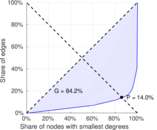
| Gini coefficient | G = | 0.843 371
|
| Balanced inequality ratio | P = | 0.138 621
|
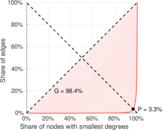
| Left balanced inequality ratio | P1 = | 0.032 704 0
|
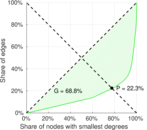
| Right balanced inequality ratio | P2 = | 0.223 272
|
| Relative edge distribution entropy | Her = | 0.657 054
|
| Power law exponent | γ = | 3.578 81
|
| Tail power law exponent | γt = | 2.271 00
|
| Degree assortativity | ρ = | −0.587 209
|
| Degree assortativity p-value | pρ = | 0.000 00
|
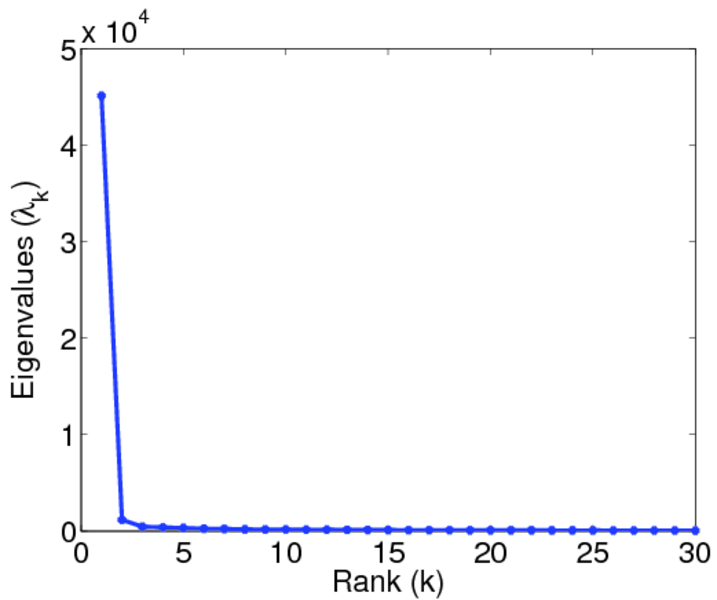
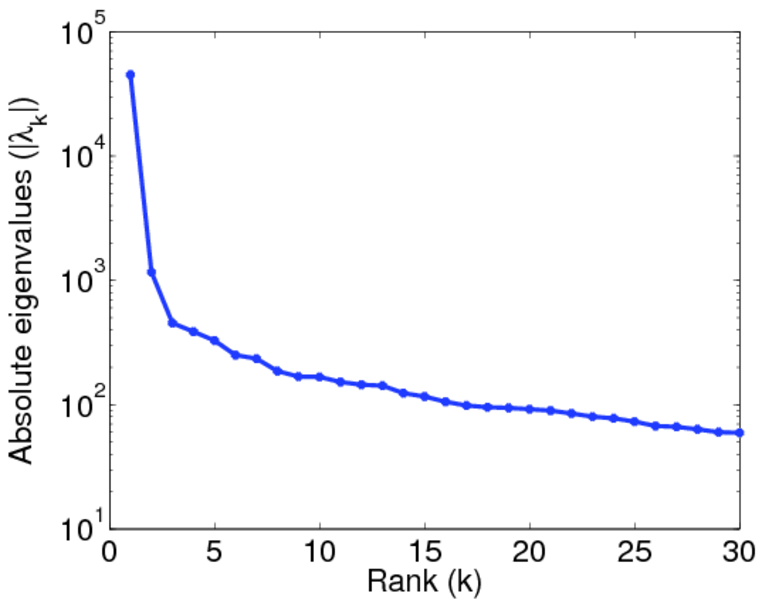
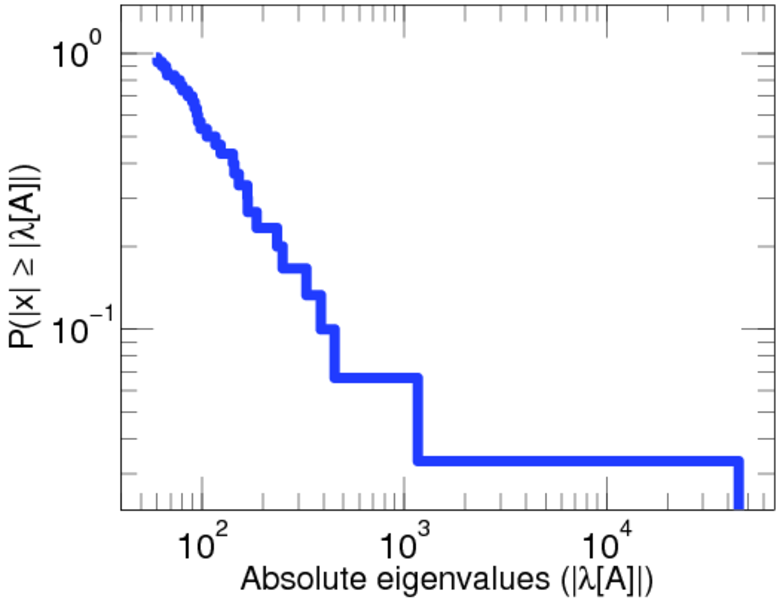
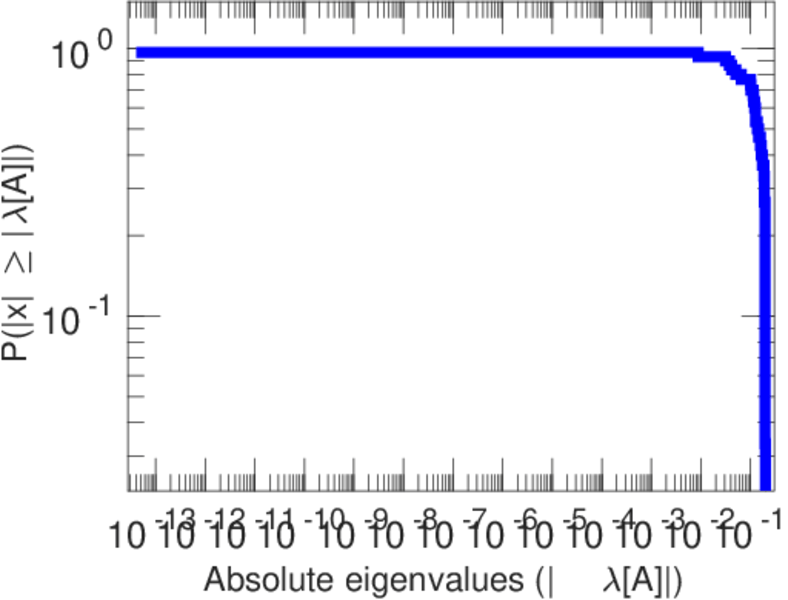
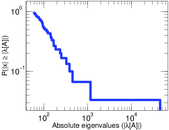
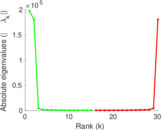
| Spectral norm | α = | 45,119.0
|
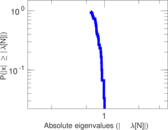
| Algebraic connectivity | a = | 0.008 780 80
|
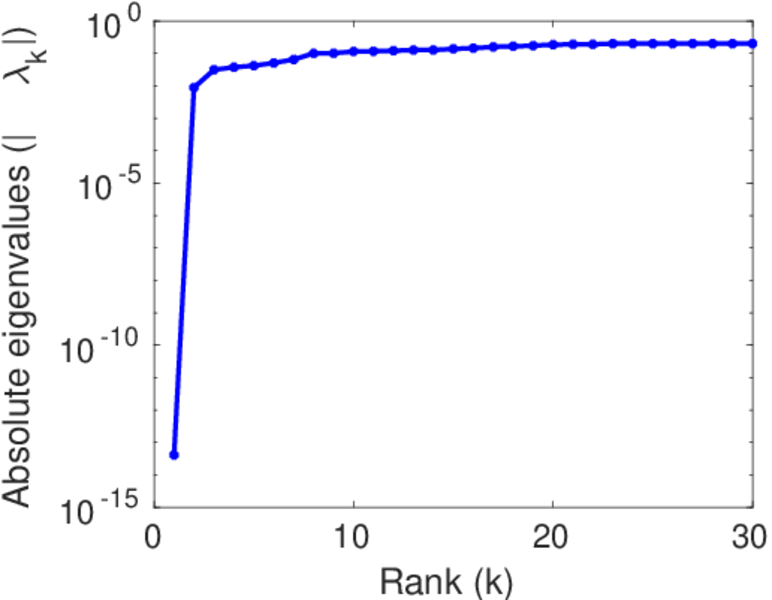
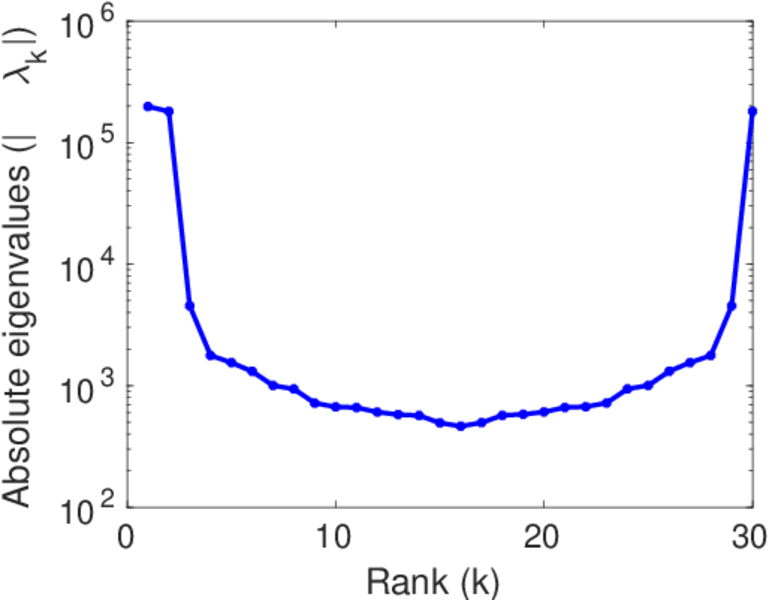
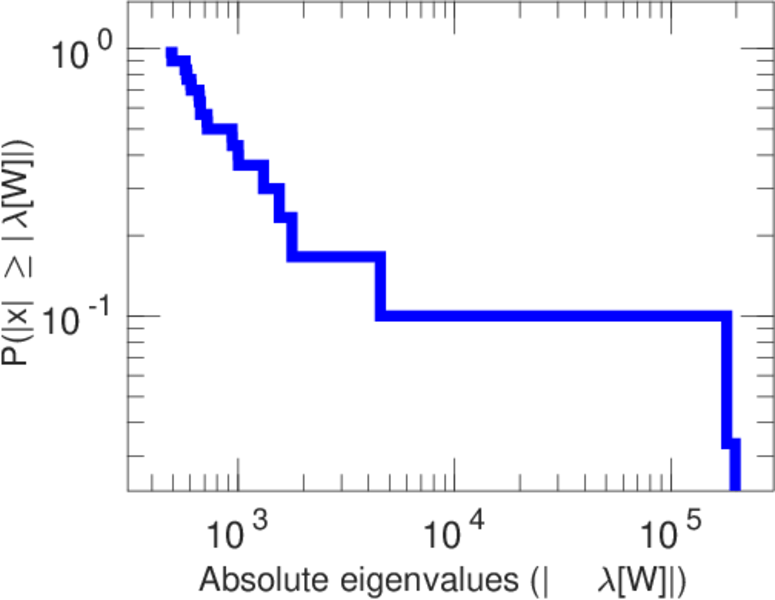
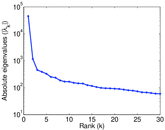
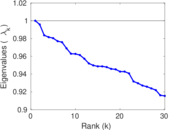
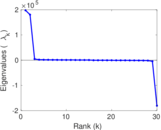
| Spectral separation | |λ1[A] / λ2[A]| = | 38.688 1
|
| Controllability | C = | 194,839
|
| Relative controllability | Cr = | 0.987 447
|
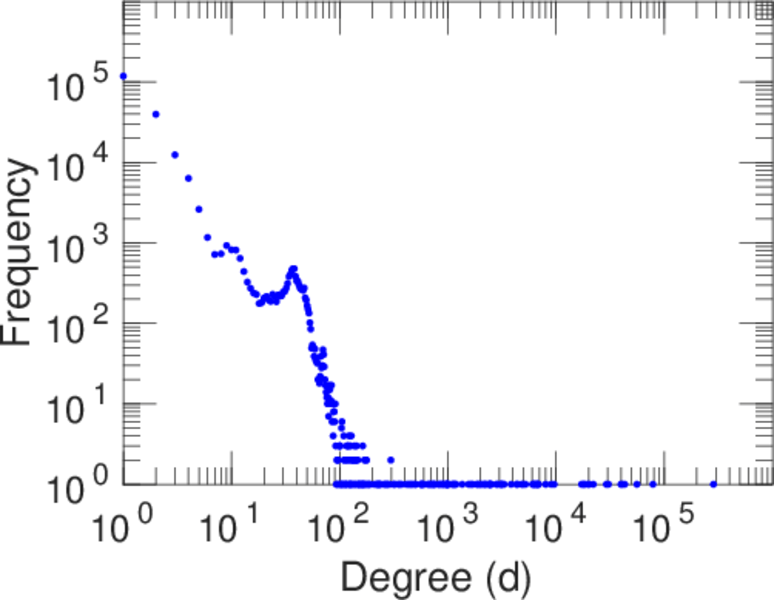
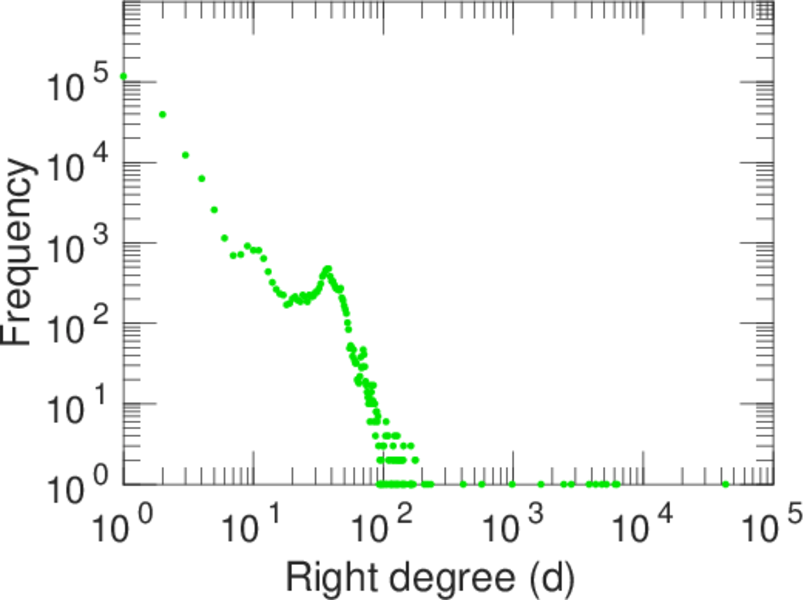
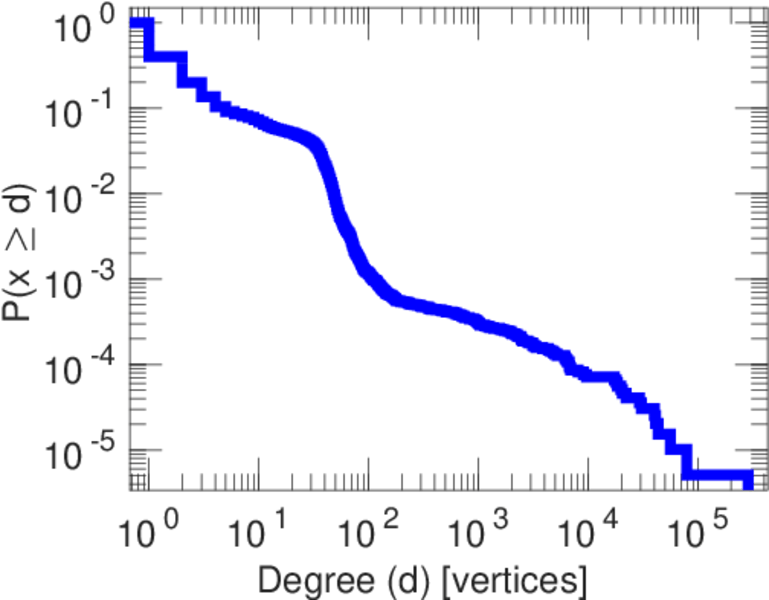
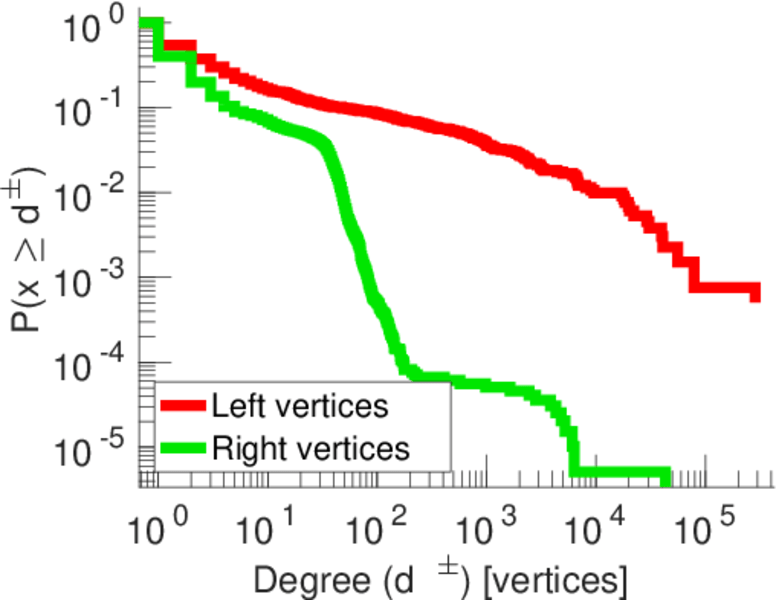
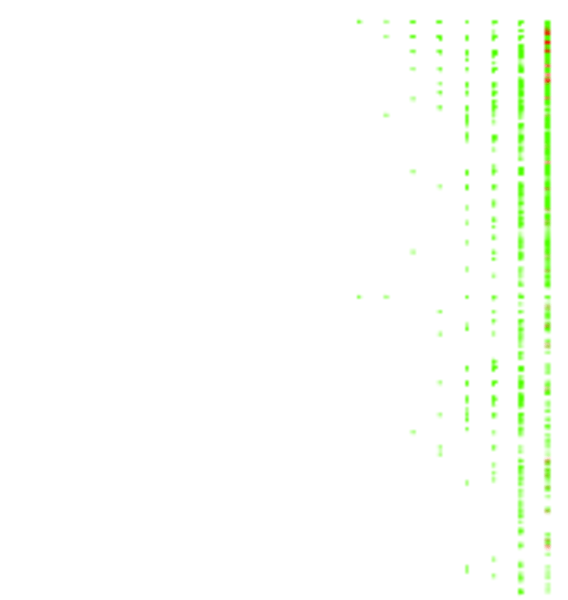
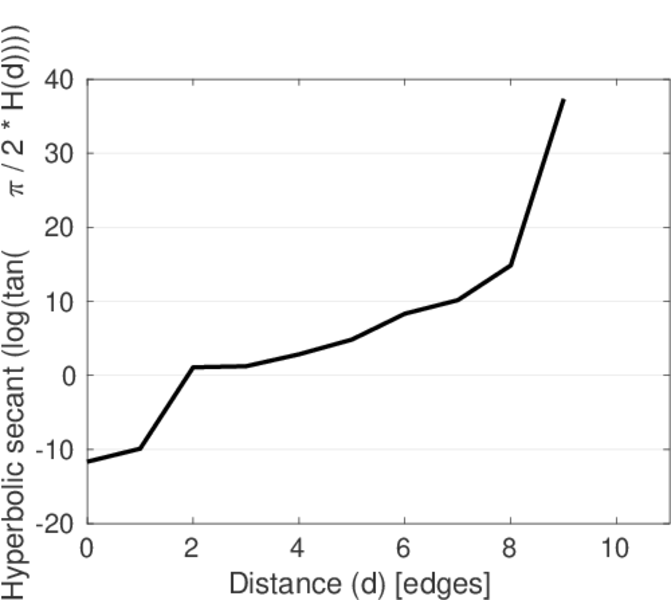
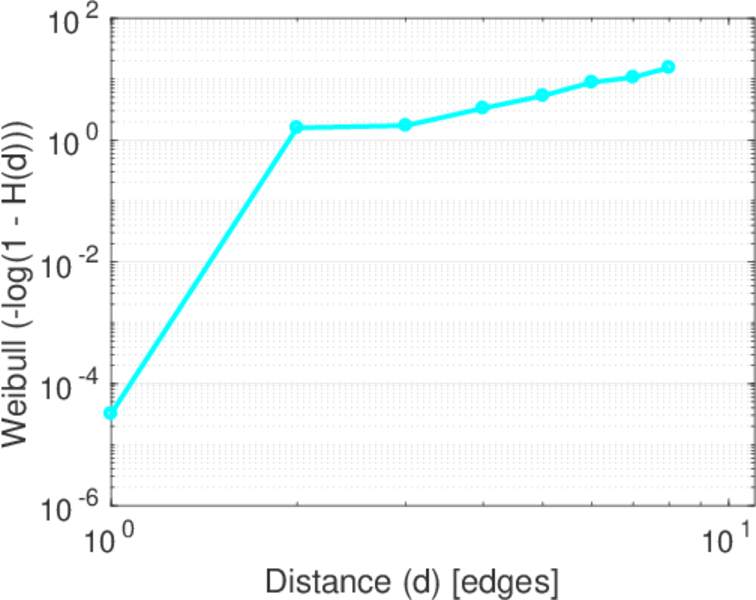
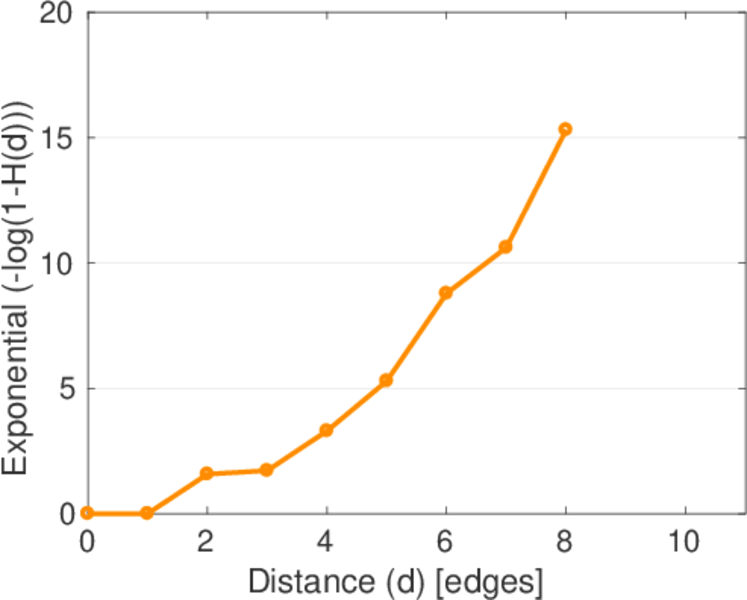
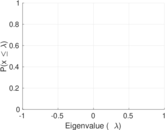
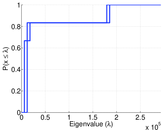
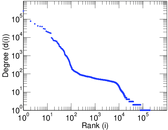
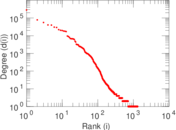
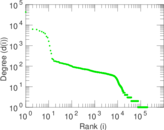
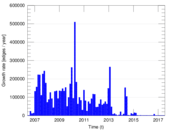
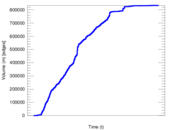
Plots


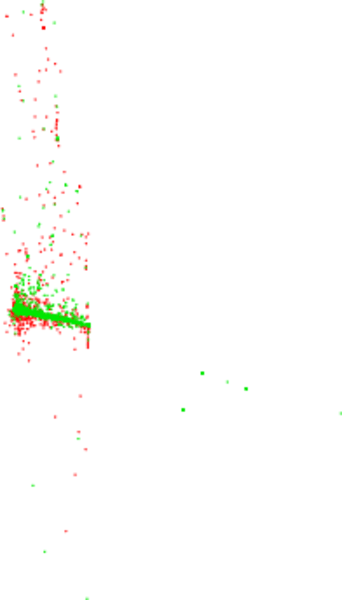
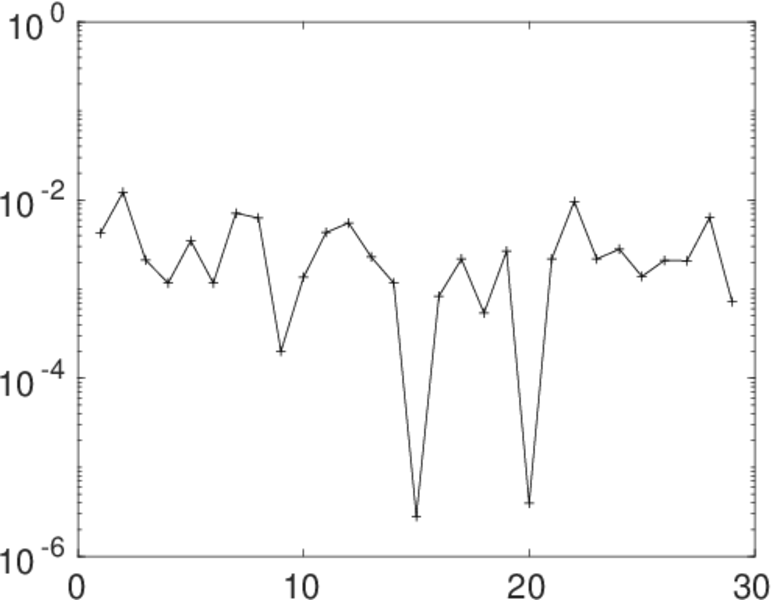
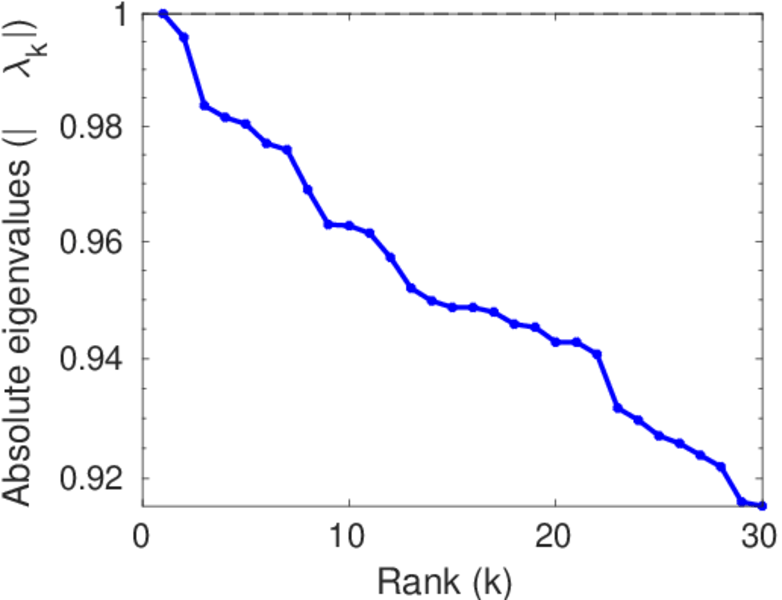
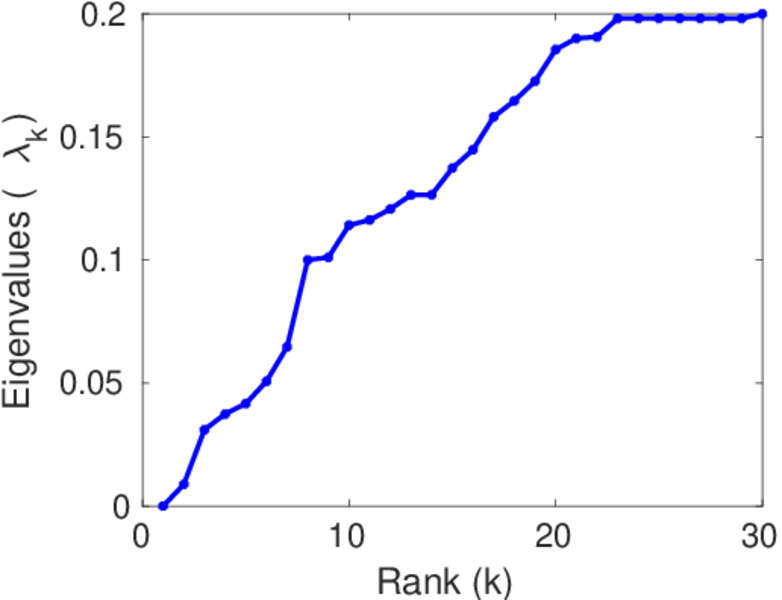
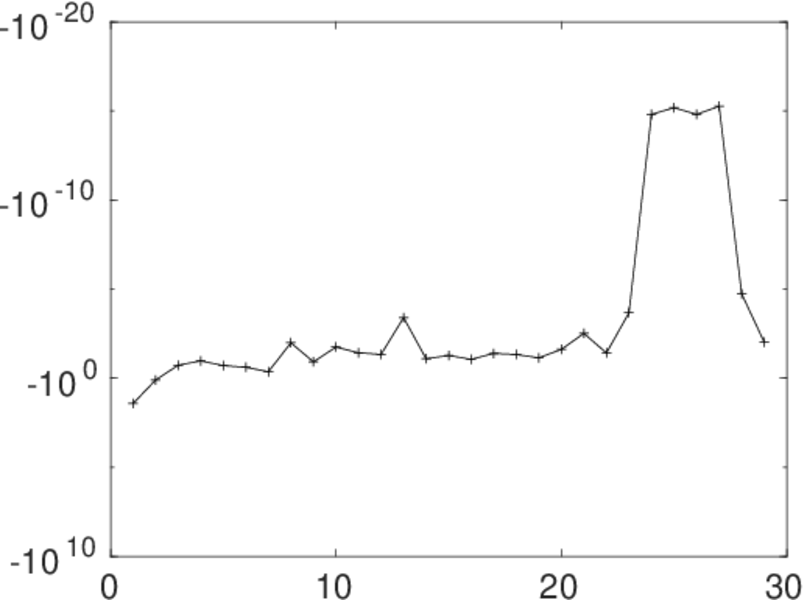
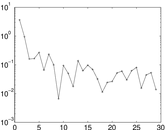
Matrix decompositions plots


Downloads
References
|
[1]
|
Jérôme Kunegis.
KONECT – The Koblenz Network Collection.
In Proc. Int. Conf. on World Wide Web Companion, pages
1343–1350, 2013.
[ http ]
|
|
[2]
|
Wikimedia Foundation.
Wikimedia downloads.
http://dumps.wikimedia.org/, January 2010.
|
 KONECT ‣ Networks ‣
Buy Me a Coffee
KONECT ‣ Networks ‣
Buy Me a Coffee