Wikinews edits (nl)
This is the bipartite edit network of the Dutch Wikinews. It contains users and
pages from the Dutch Wikinews, connected by edit events. Each edge represents
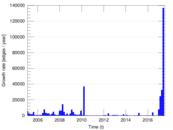
an edit. The dataset includes the timestamp of each edit.
Metadata
Statistics
| Size | n = | 8,000
|
| Left size | n1 = | 433
|
| Right size | n2 = | 7,567
|
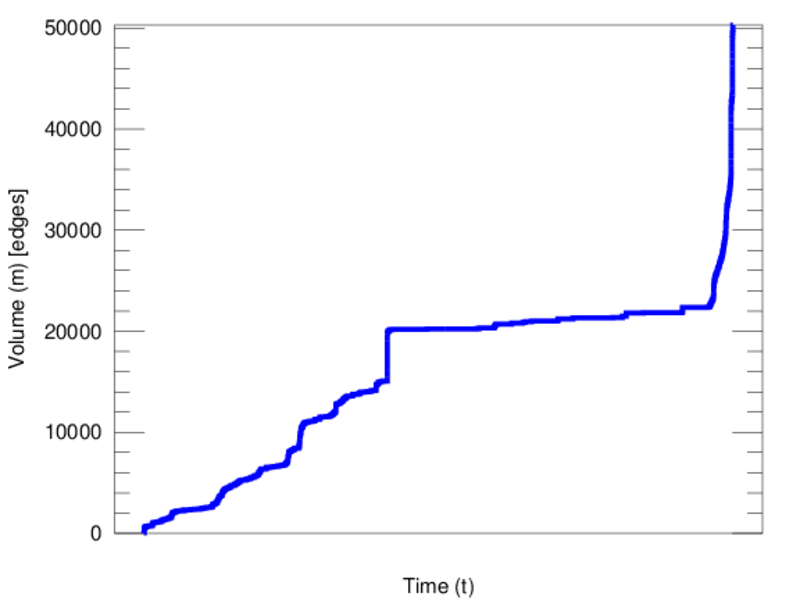
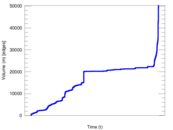
| Volume | m = | 50,296
|
| Unique edge count | m̿ = | 31,291
|
| Wedge count | s = | 49,017,338
|
| Claw count | z = | 79,077,696,879
|
| Cross count | x = | 108,152,935,591,547
|
| Square count | q = | 44,943,939
|
| 4-Tour count | T4 = | 555,683,790
|
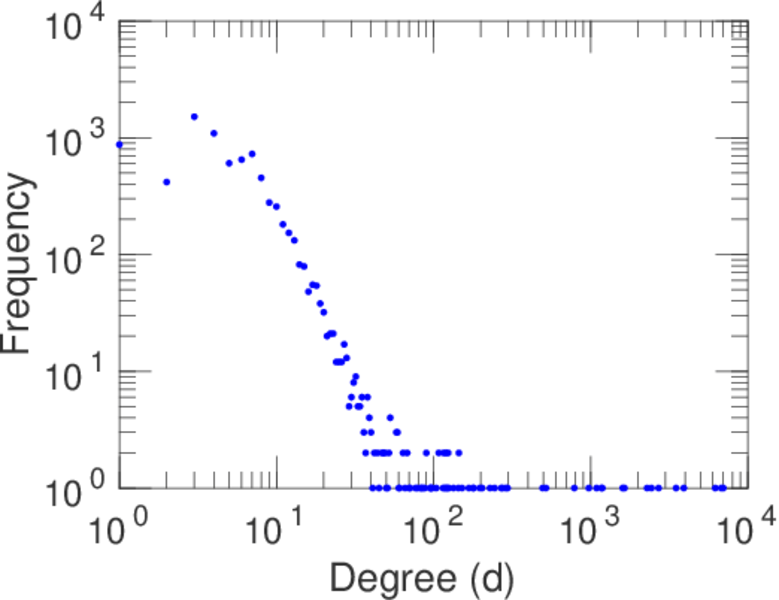
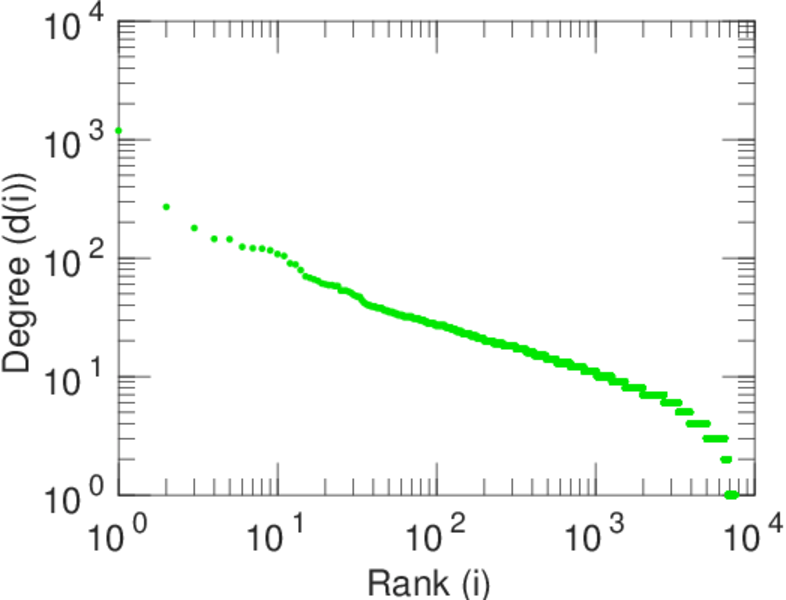
| Maximum degree | dmax = | 6,999
|
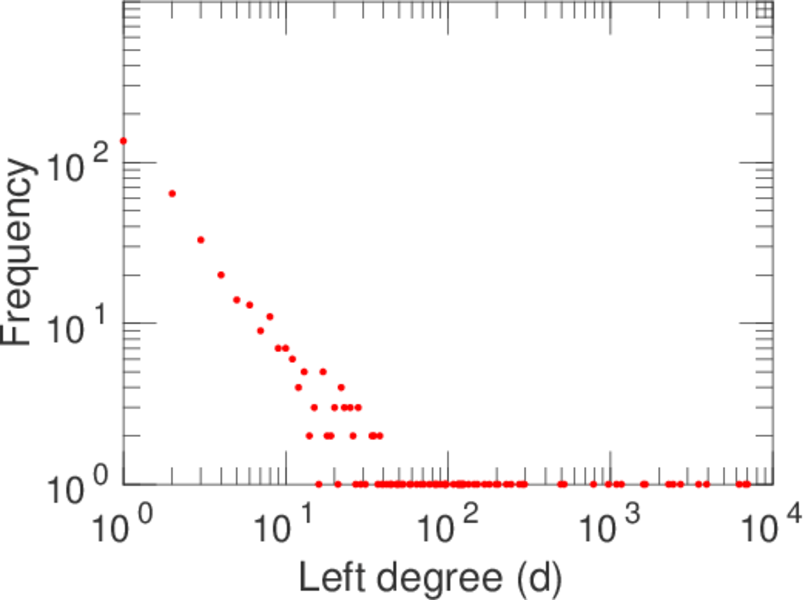
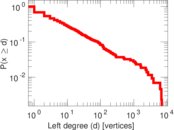
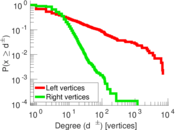
| Maximum left degree | d1max = | 6,999
|
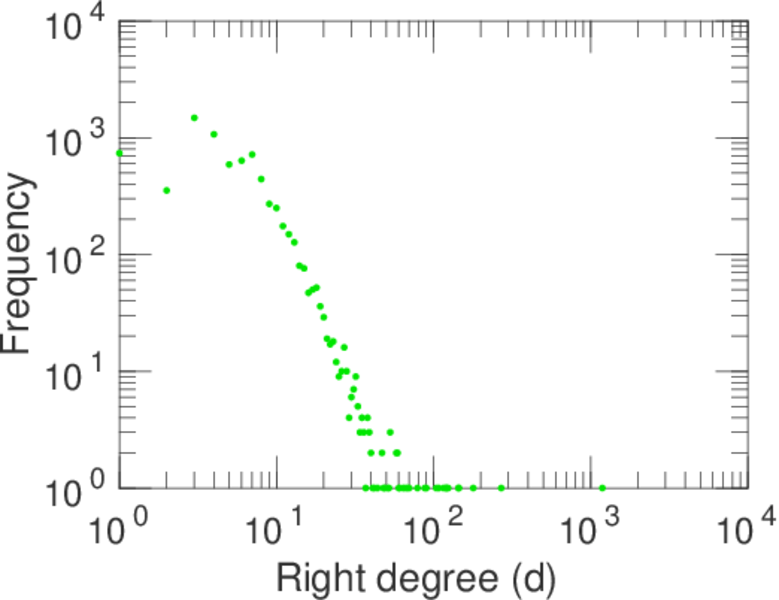
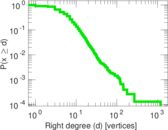
| Maximum right degree | d2max = | 1,189
|
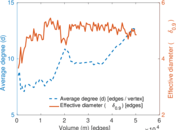
| Average degree | d = | 12.574 0
|
| Average left degree | d1 = | 116.157
|
| Average right degree | d2 = | 6.646 76
|
| Fill | p = | 0.009 550 10
|
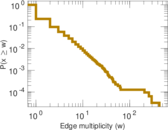
| Average edge multiplicity | m̃ = | 1.607 36
|
| Size of LCC | N = | 7,867
|
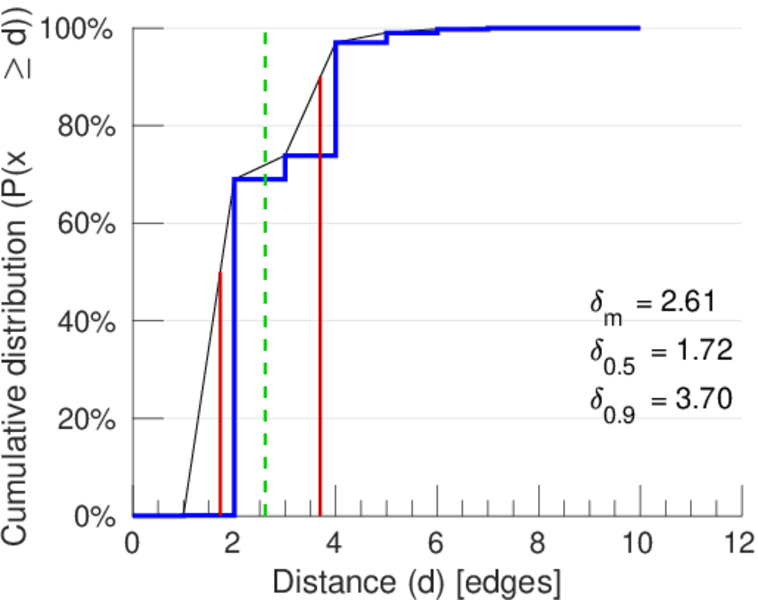
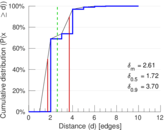
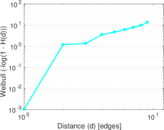
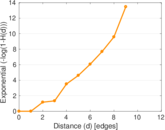
| Diameter | δ = | 12
|
| 50-Percentile effective diameter | δ0.5 = | 1.724 59
|
| 90-Percentile effective diameter | δ0.9 = | 3.696 74
|
| Median distance | δM = | 2
|
| Mean distance | δm = | 2.613 10
|
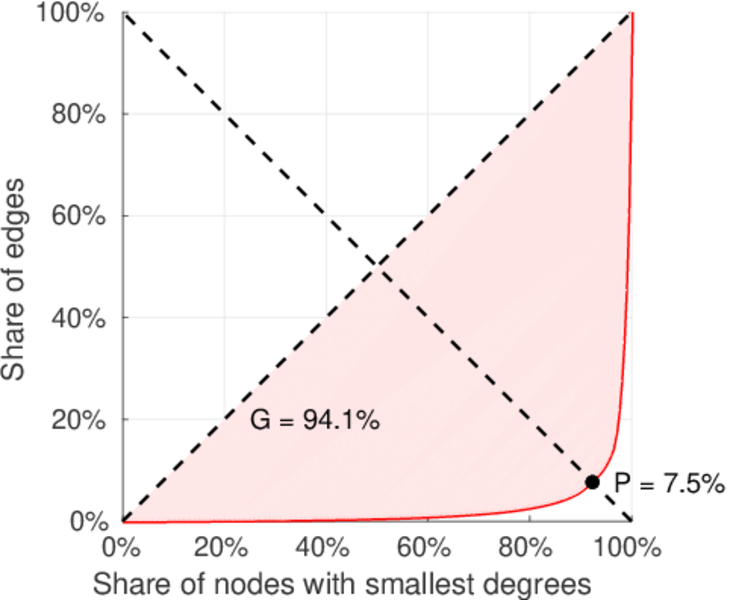
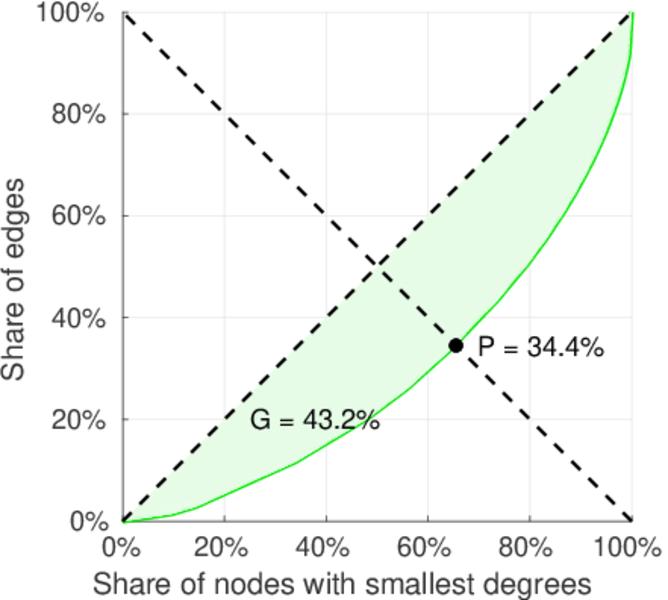
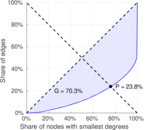
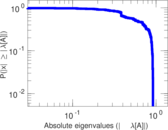
| Gini coefficient | G = | 0.696 691
|
| Balanced inequality ratio | P = | 0.241 093
|
| Left balanced inequality ratio | P1 = | 0.075 254 5
|
| Right balanced inequality ratio | P2 = | 0.343 546
|
| Relative edge distribution entropy | Her = | 0.732 416
|
| Power law exponent | γ = | 1.802 79
|
| Tail power law exponent | γt = | 1.631 00
|
| Tail power law exponent with p | γ3 = | 1.631 00
|
| p-value | p = | 0.896 000
|
| Left tail power law exponent with p | γ3,1 = | 1.571 00
|
| Left p-value | p1 = | 0.430 000
|
| Right tail power law exponent with p | γ3,2 = | 5.841 00
|
| Right p-value | p2 = | 0.047 000 0
|
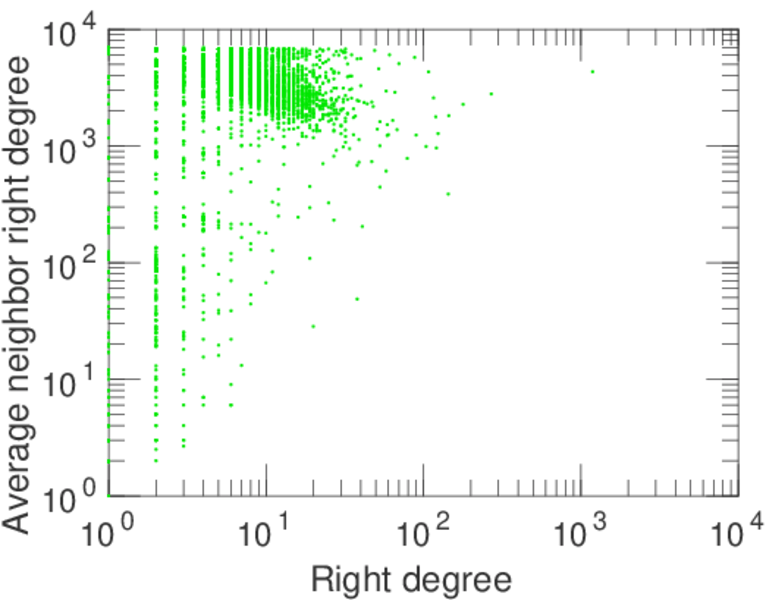
| Degree assortativity | ρ = | −0.248 186
|
| Degree assortativity p-value | pρ = | 0.000 00
|
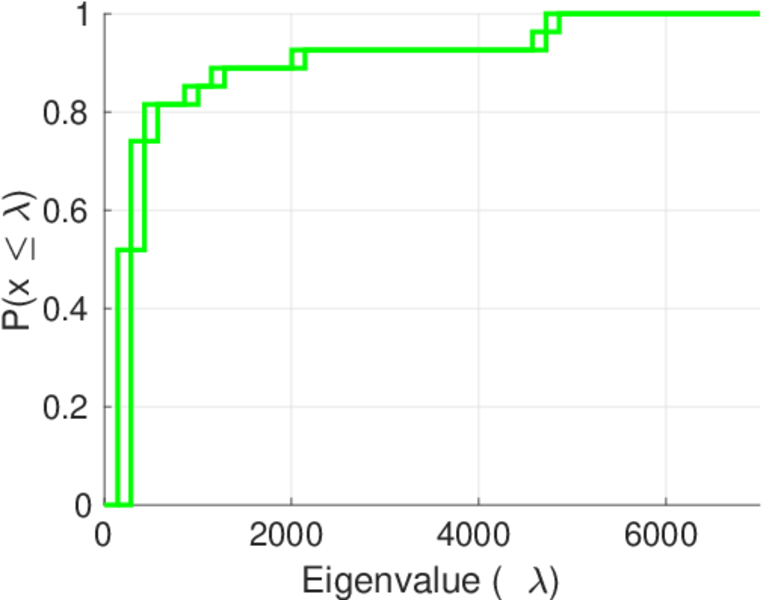
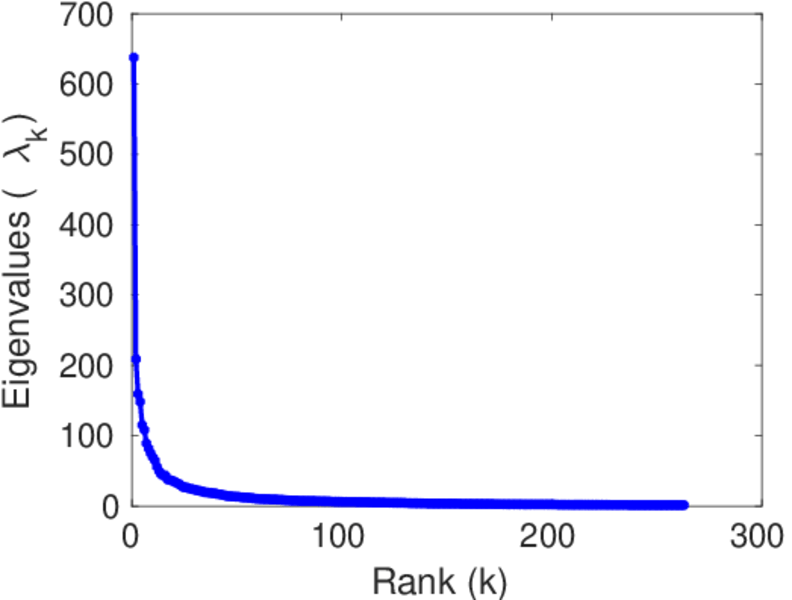
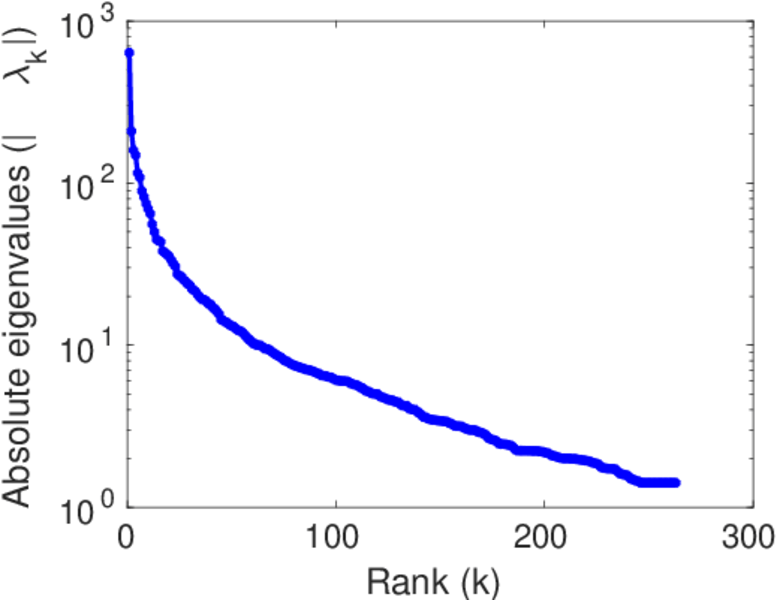
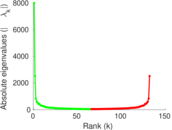
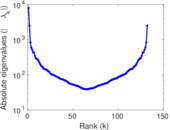
| Spectral norm | α = | 637.651
|
| Algebraic connectivity | a = | 0.028 943 9
|
| Spectral separation | |λ1[A] / λ2[A]| = | 3.052 27
|
| Controllability | C = | 7,152
|
| Relative controllability | Cr = | 0.894 447
|
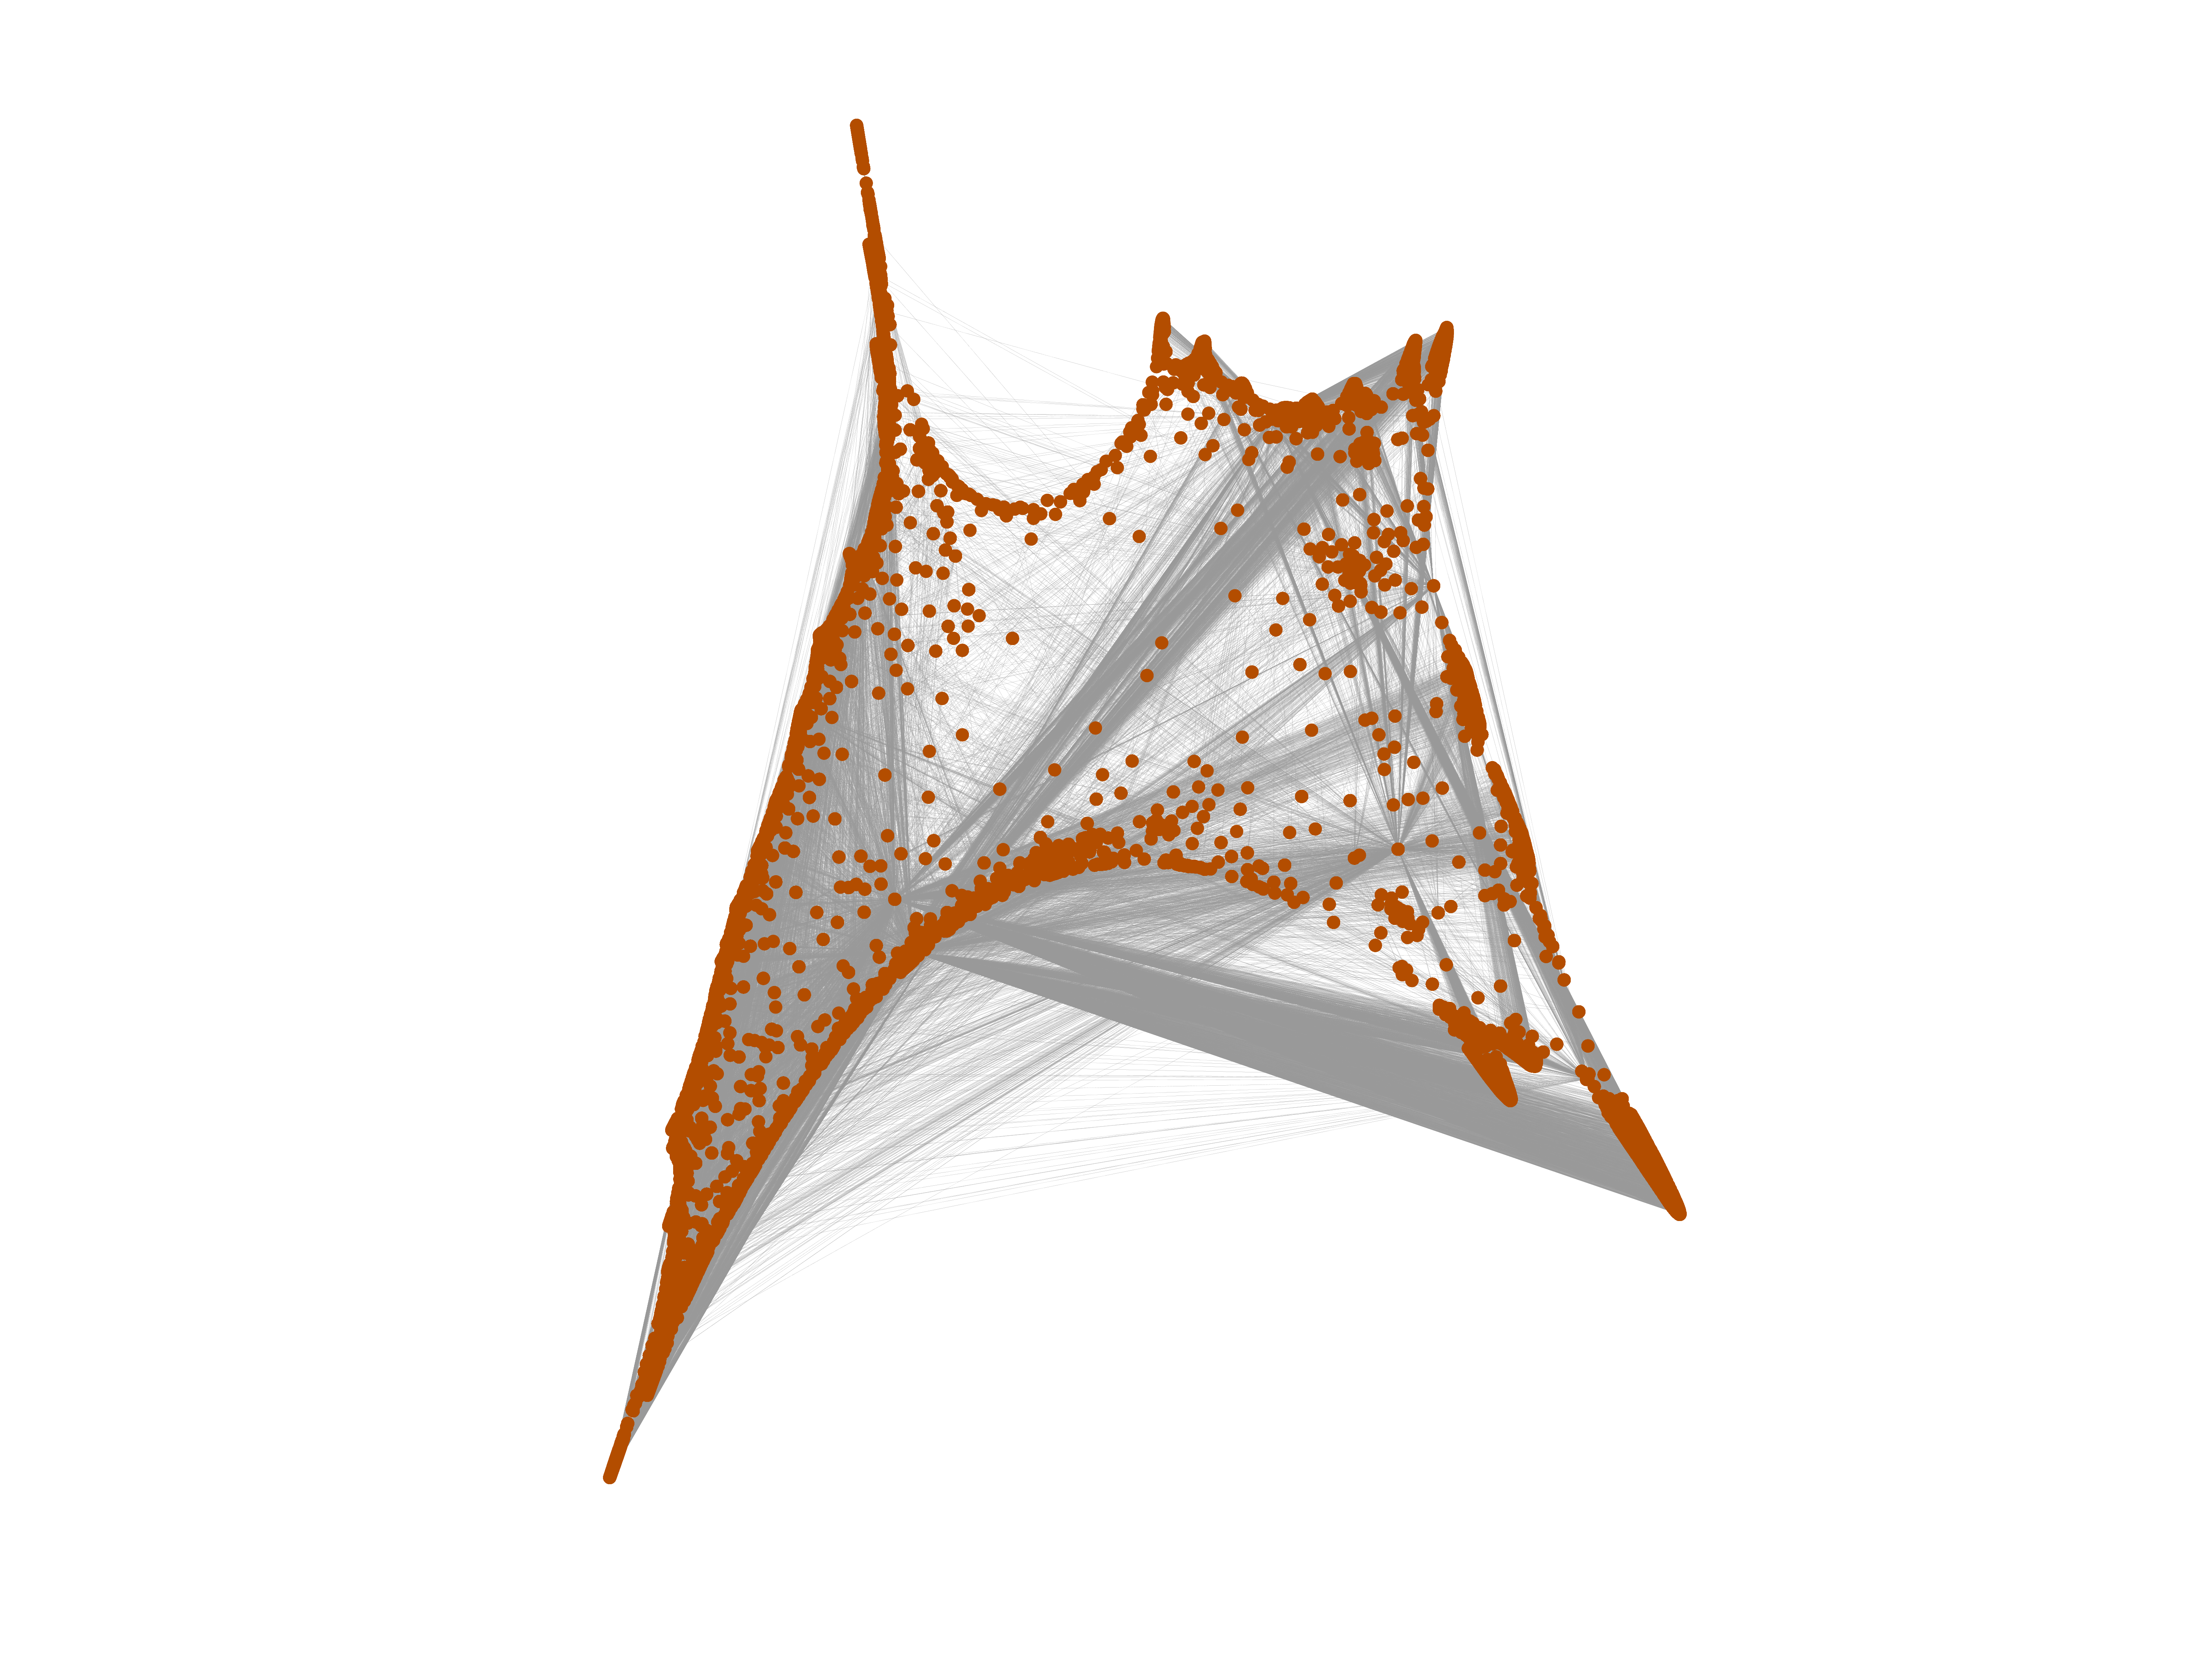
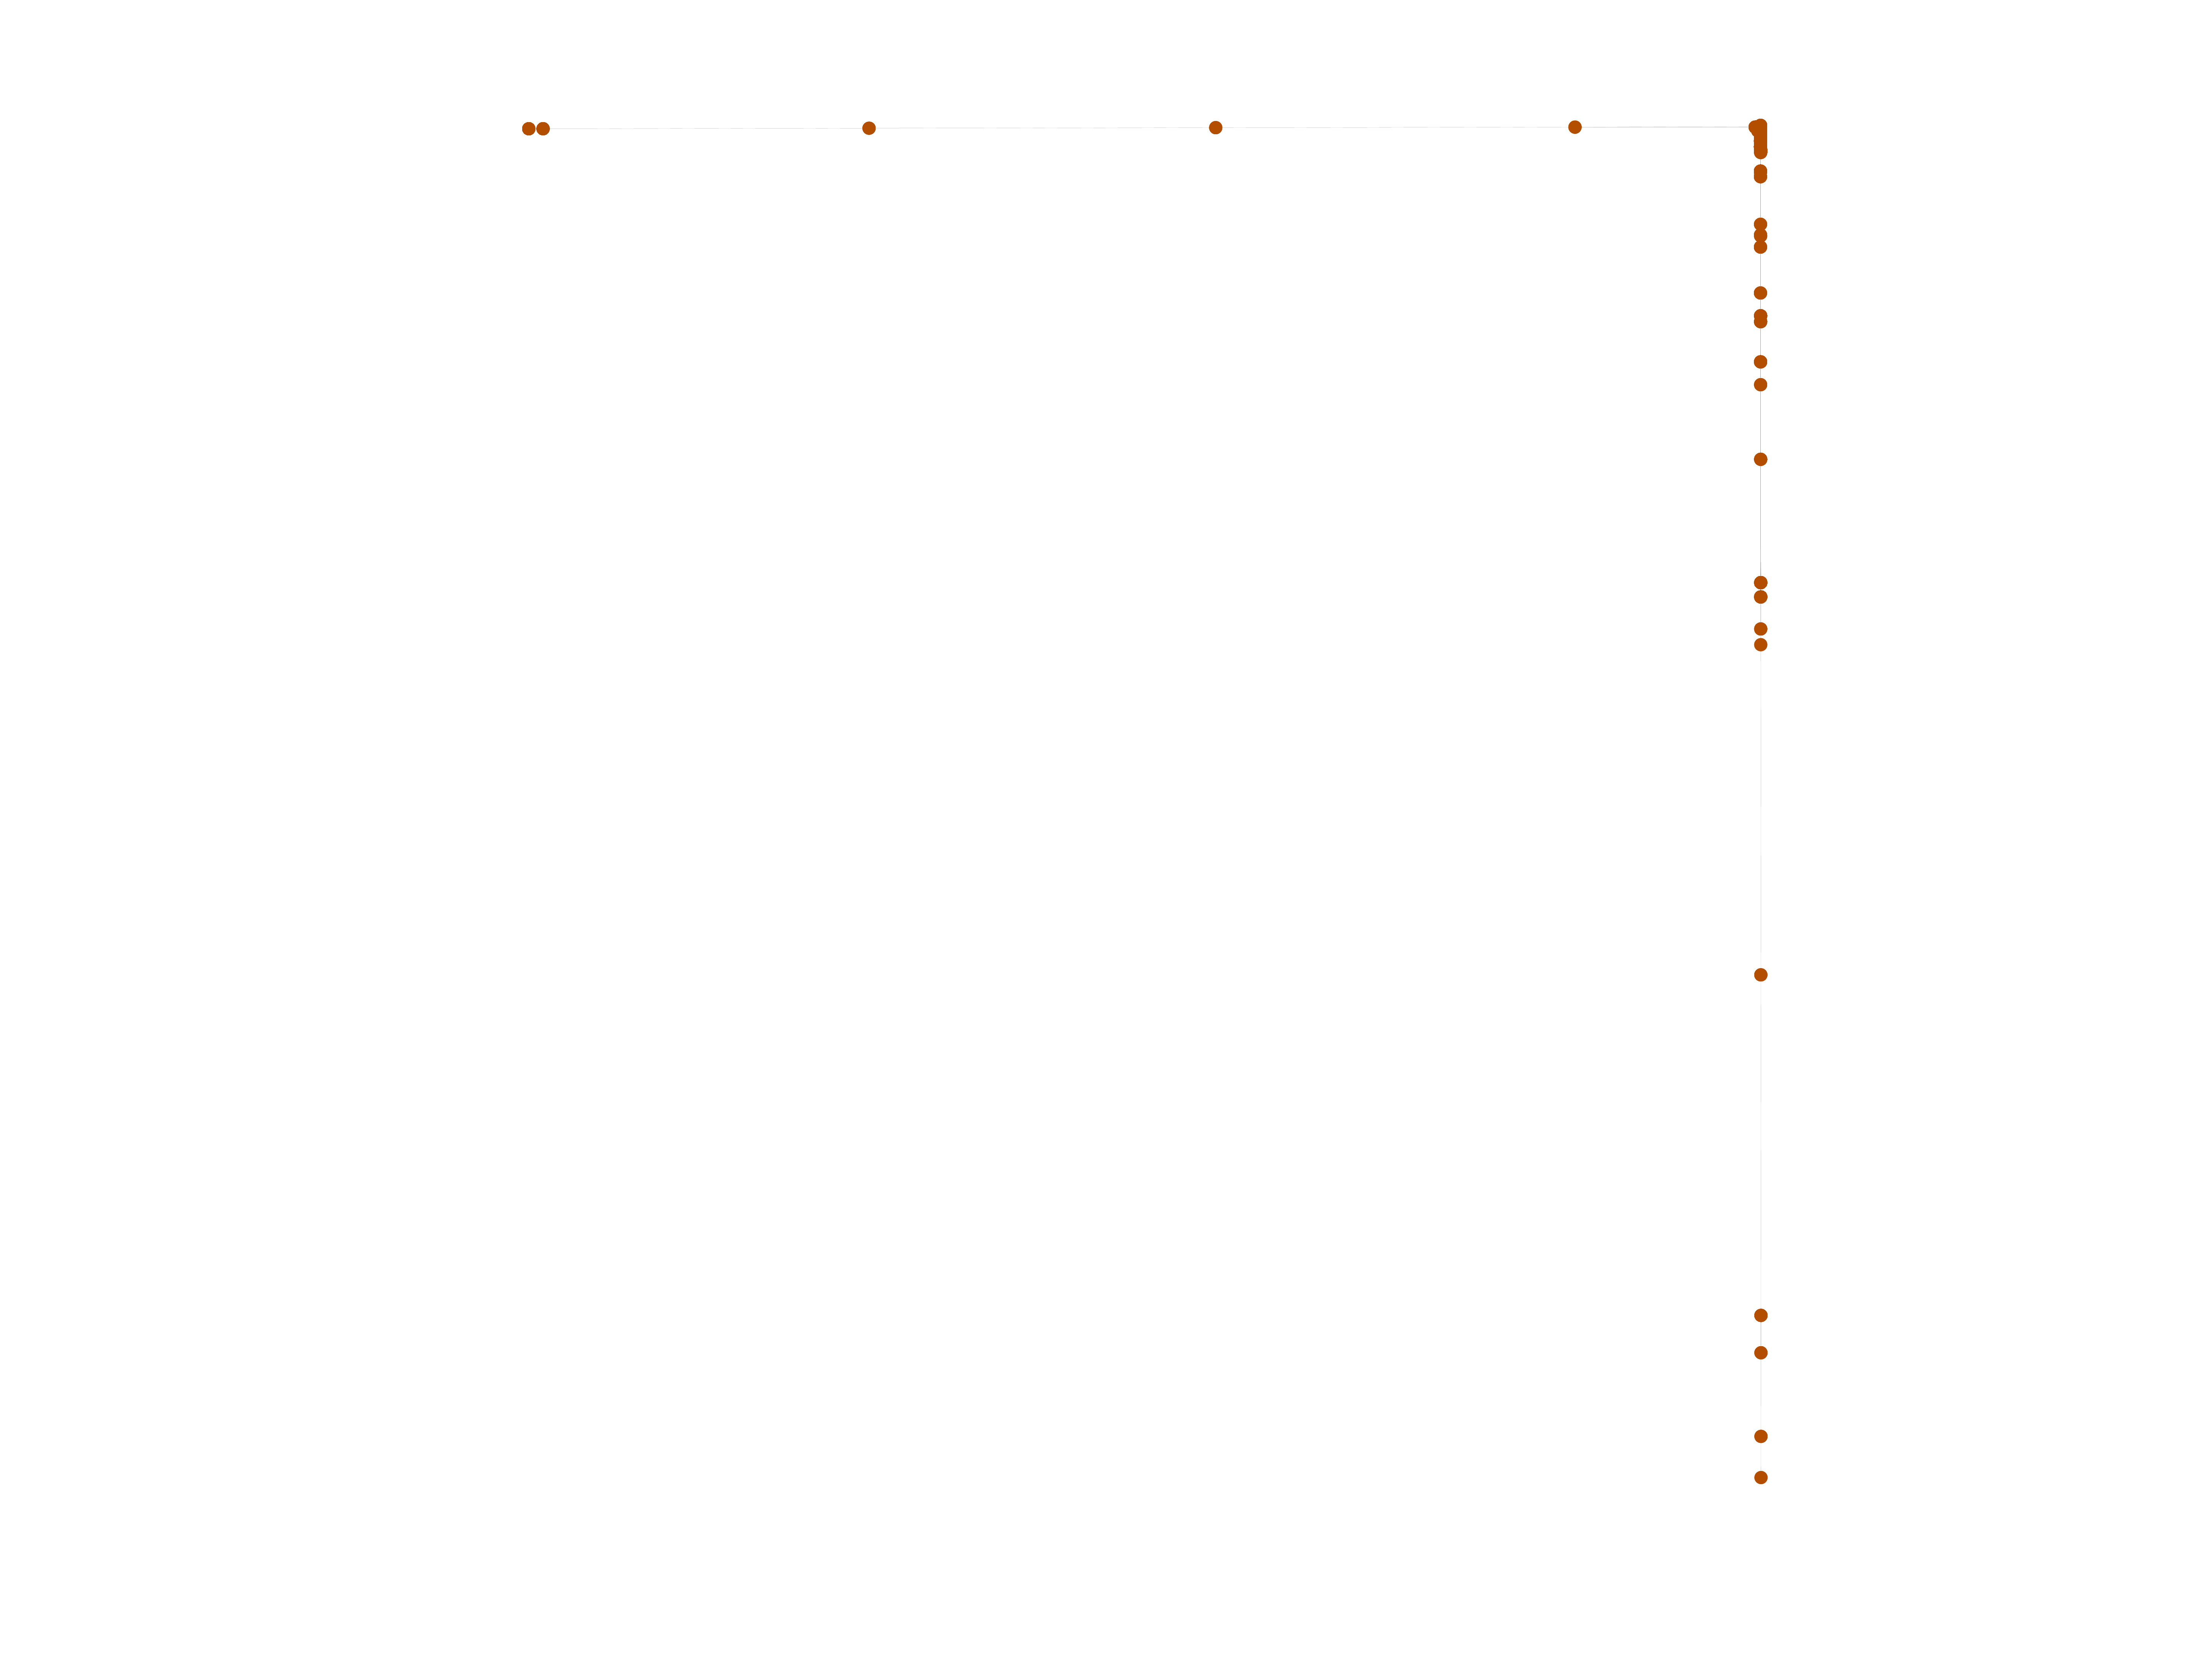
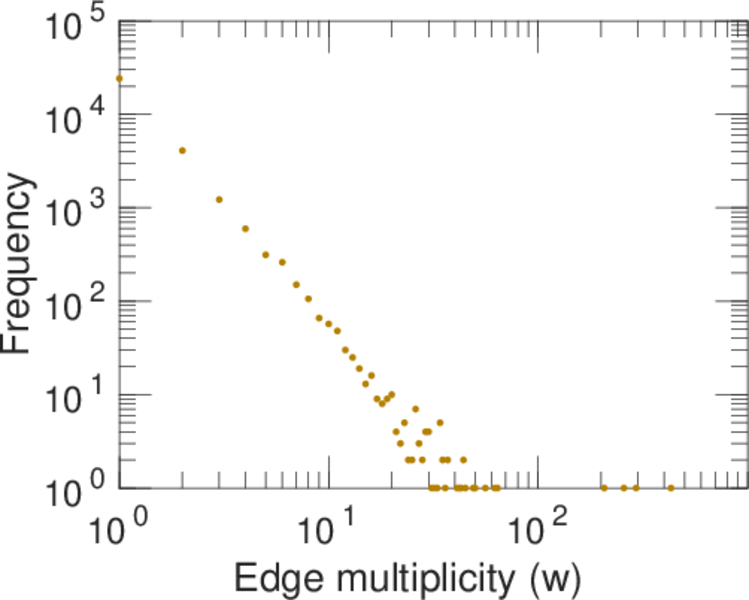
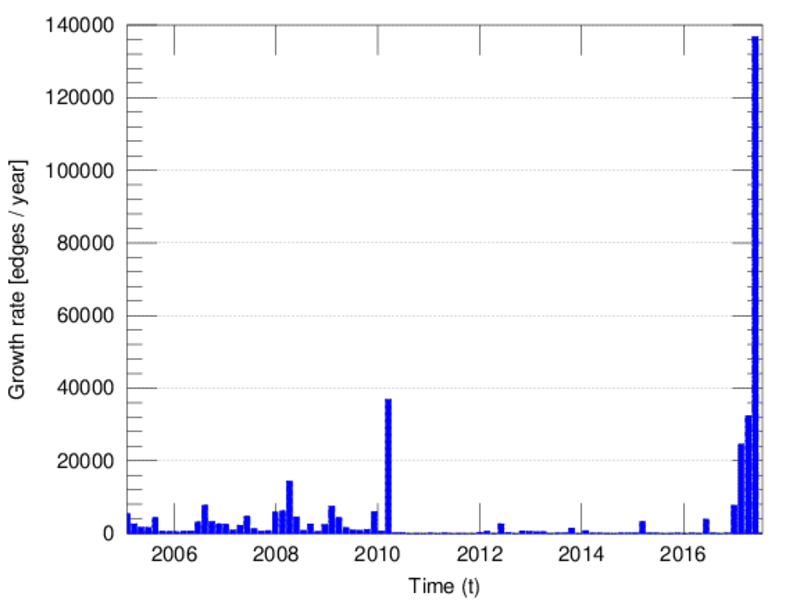
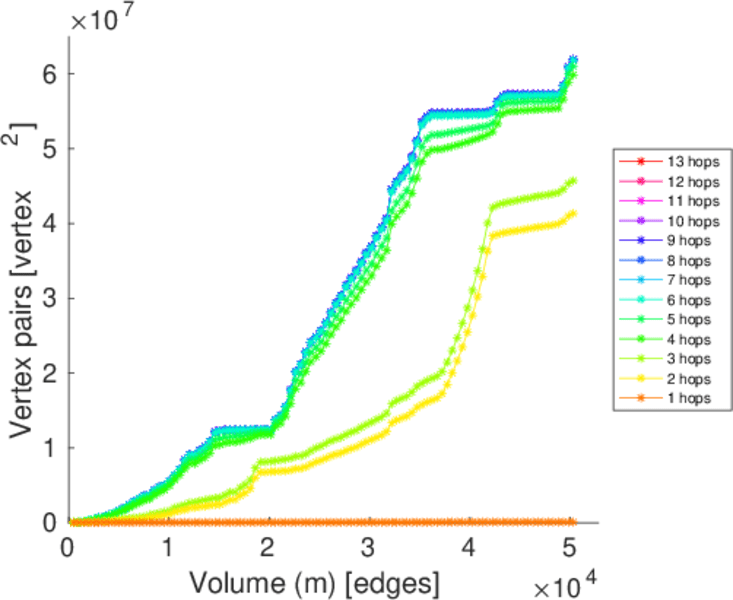
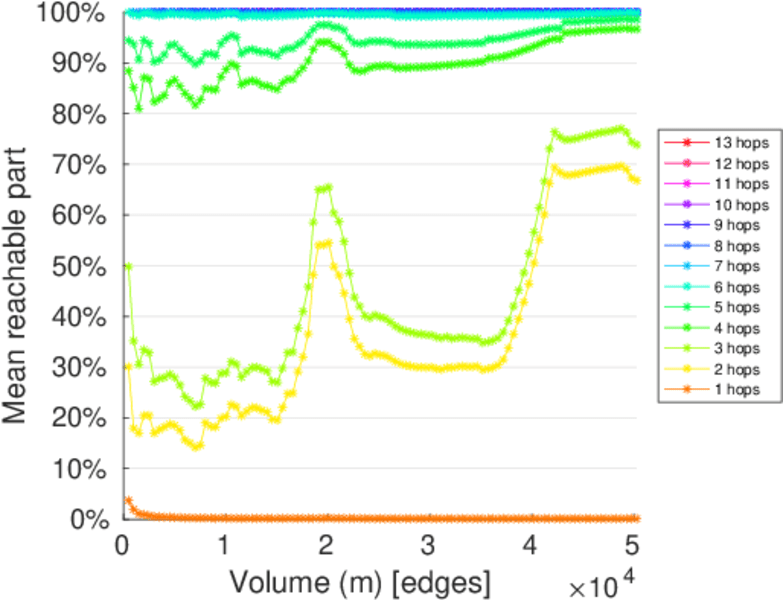
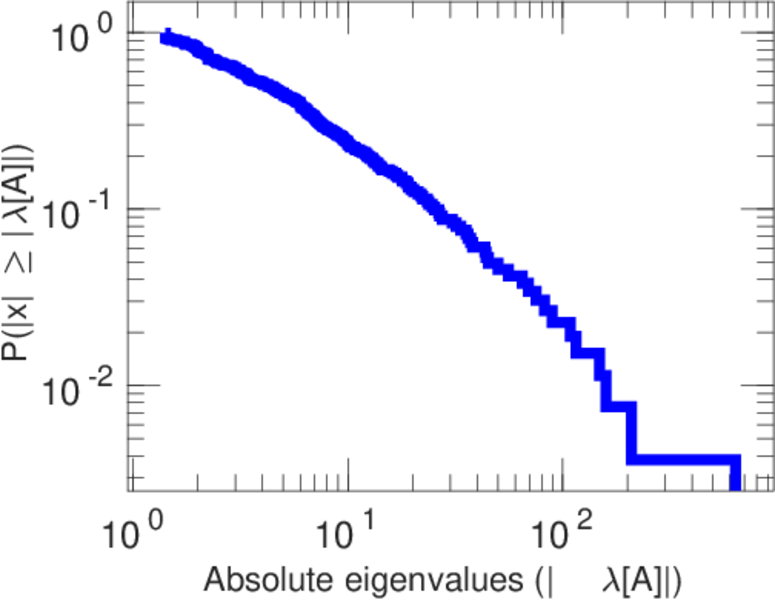
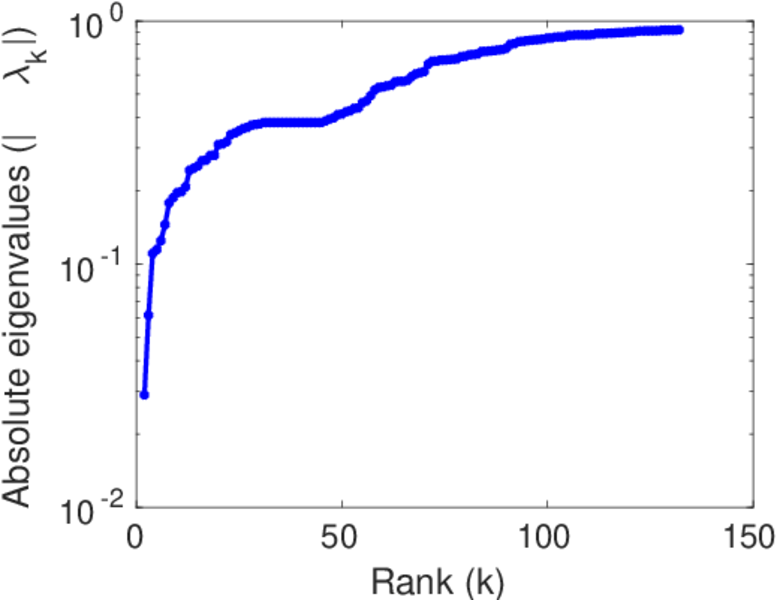
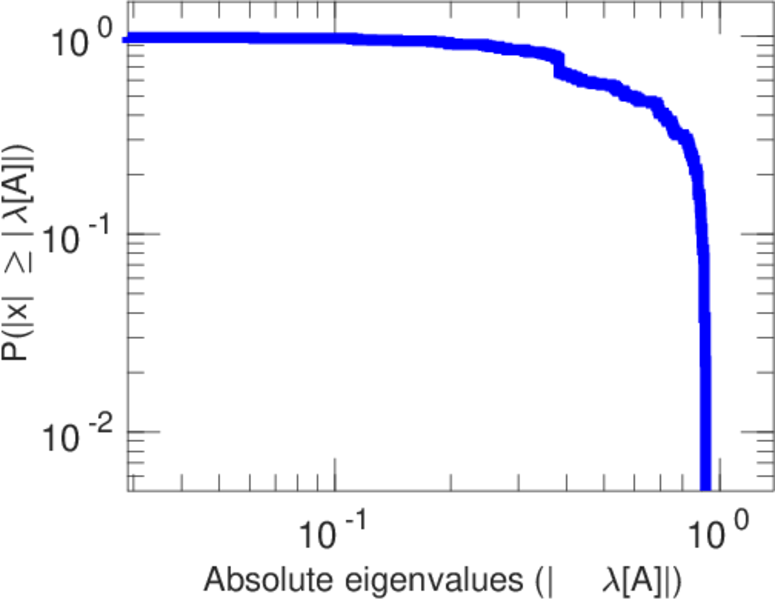
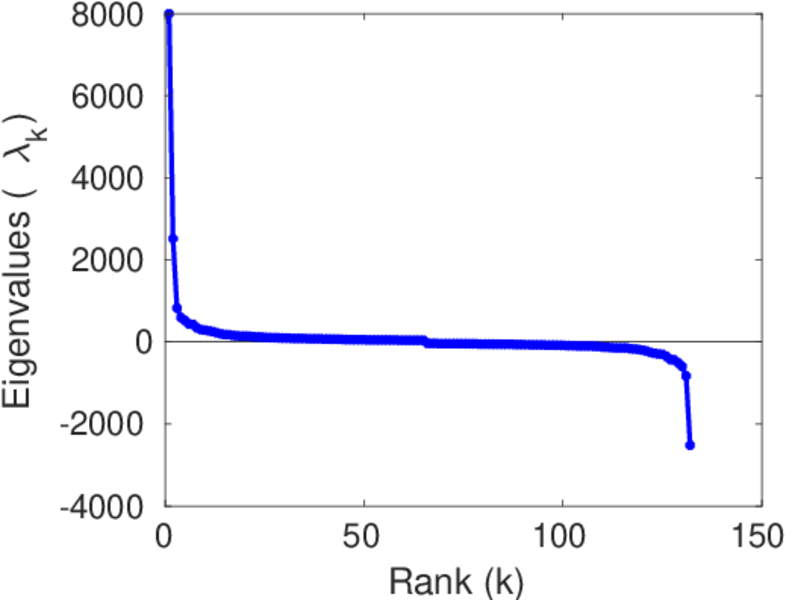
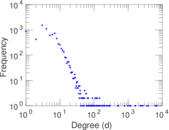
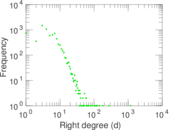
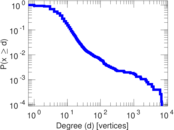
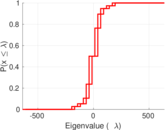
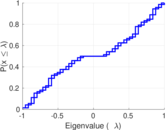
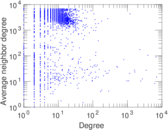
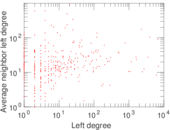
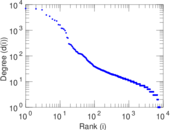
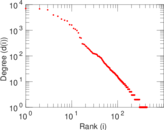
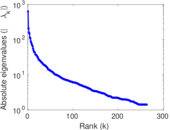
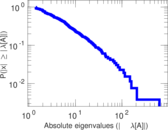
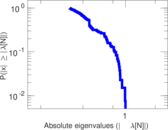
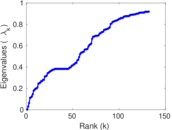
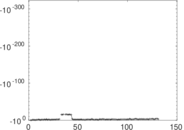
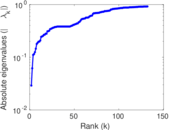
Plots


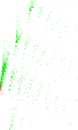

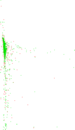


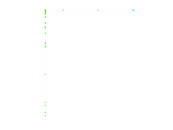

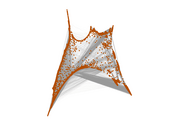


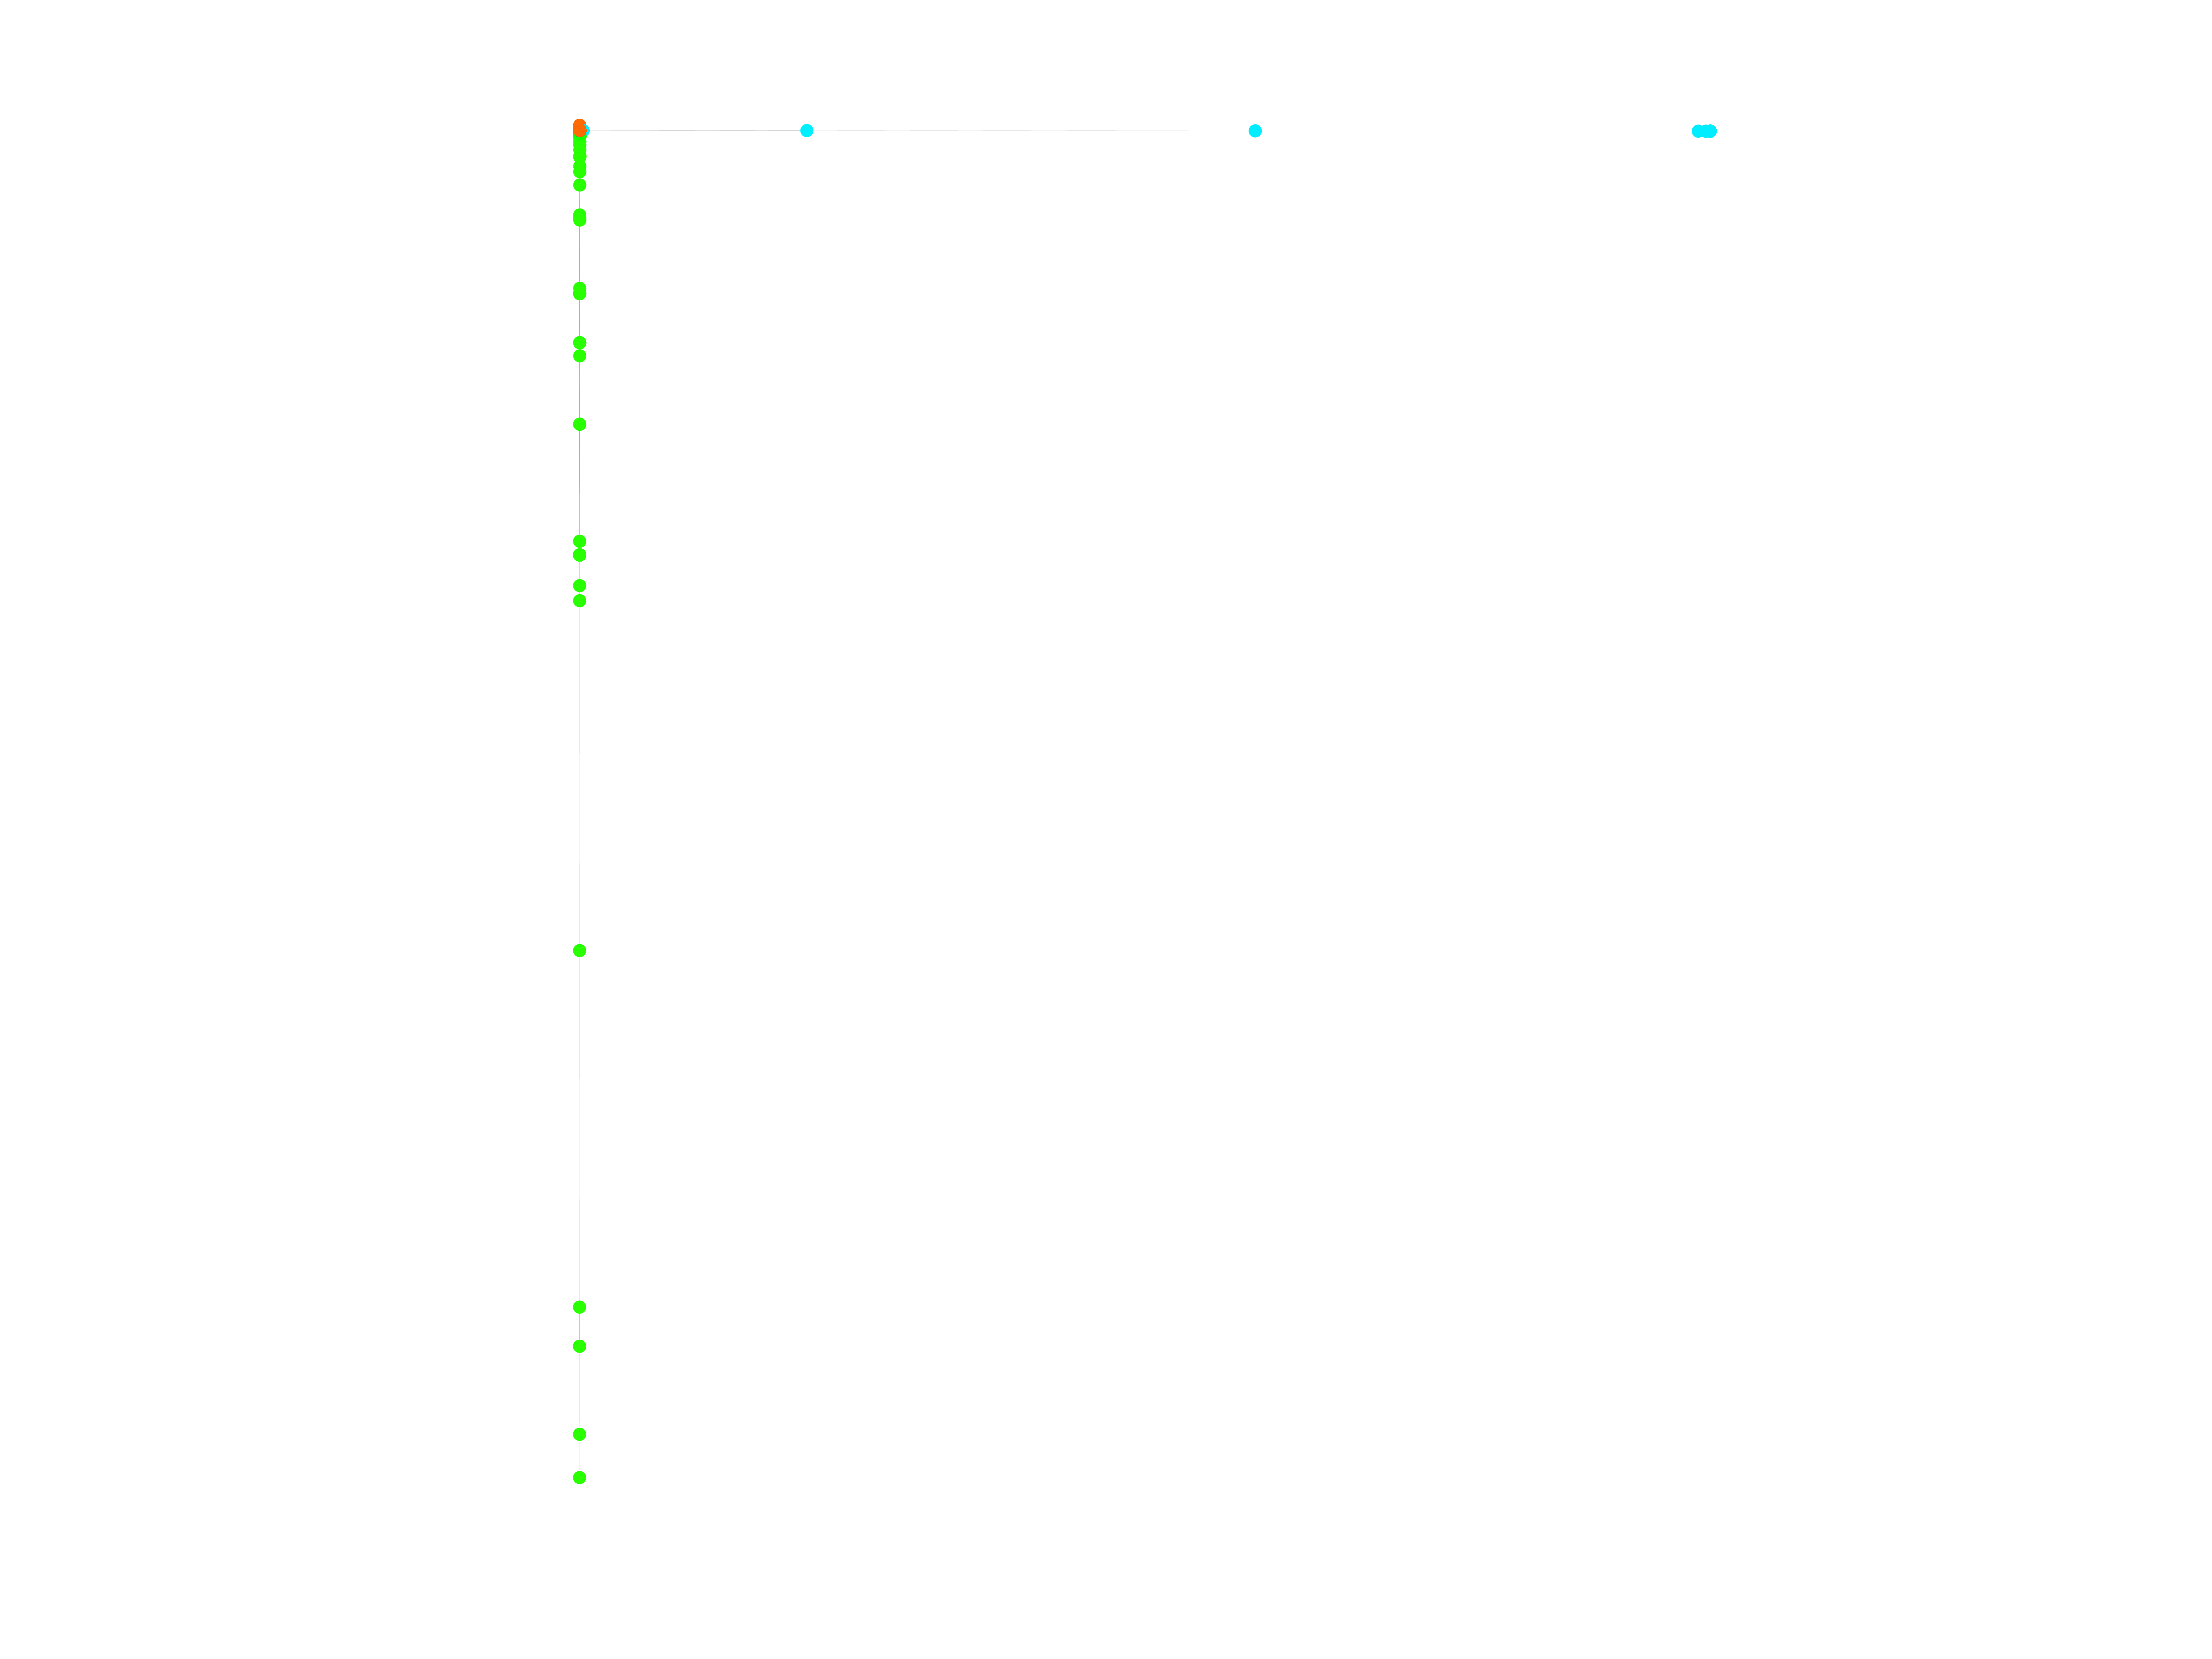
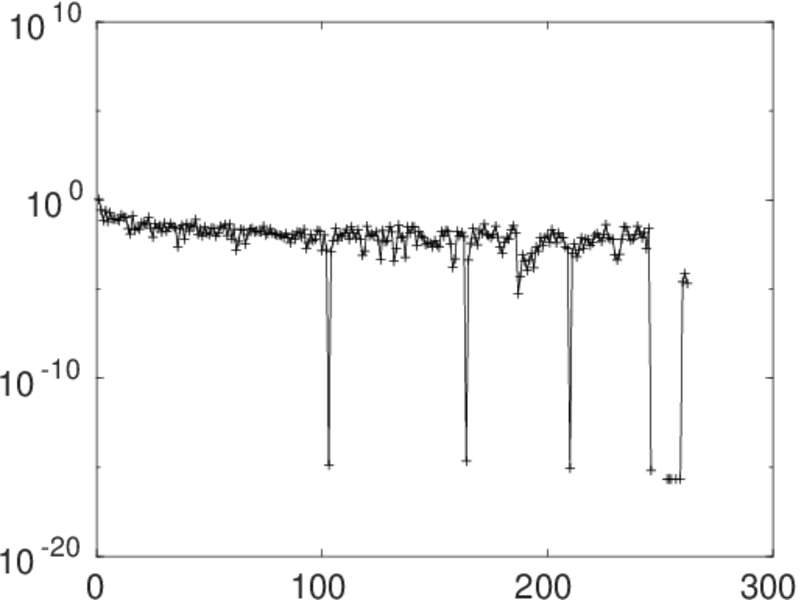
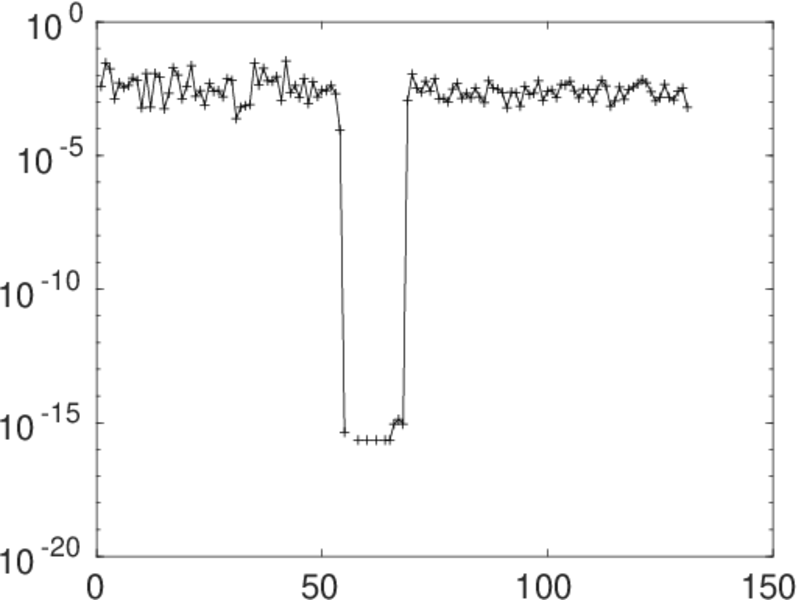
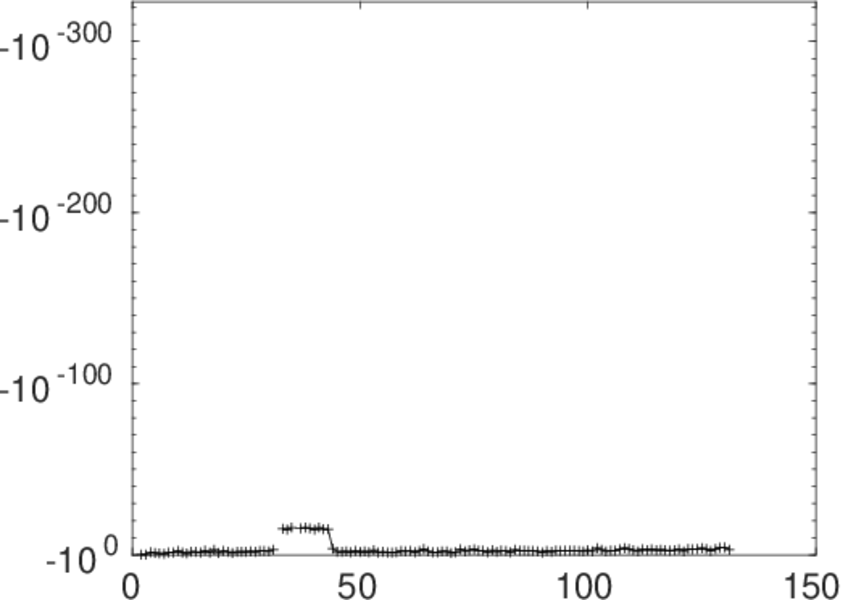
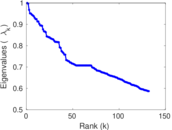
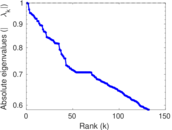
Matrix decompositions plots


Downloads
References
|
[1]
|
Jérôme Kunegis.
KONECT – The Koblenz Network Collection.
In Proc. Int. Conf. on World Wide Web Companion, pages
1343–1350, 2013.
[ http ]
|
|
[2]
|
Wikimedia Foundation.
Wikimedia downloads.
http://dumps.wikimedia.org/, January 2010.
|
 KONECT ‣ Networks ‣
Buy Me a Coffee
KONECT ‣ Networks ‣
Buy Me a Coffee