Wikivoyage edits (nl)
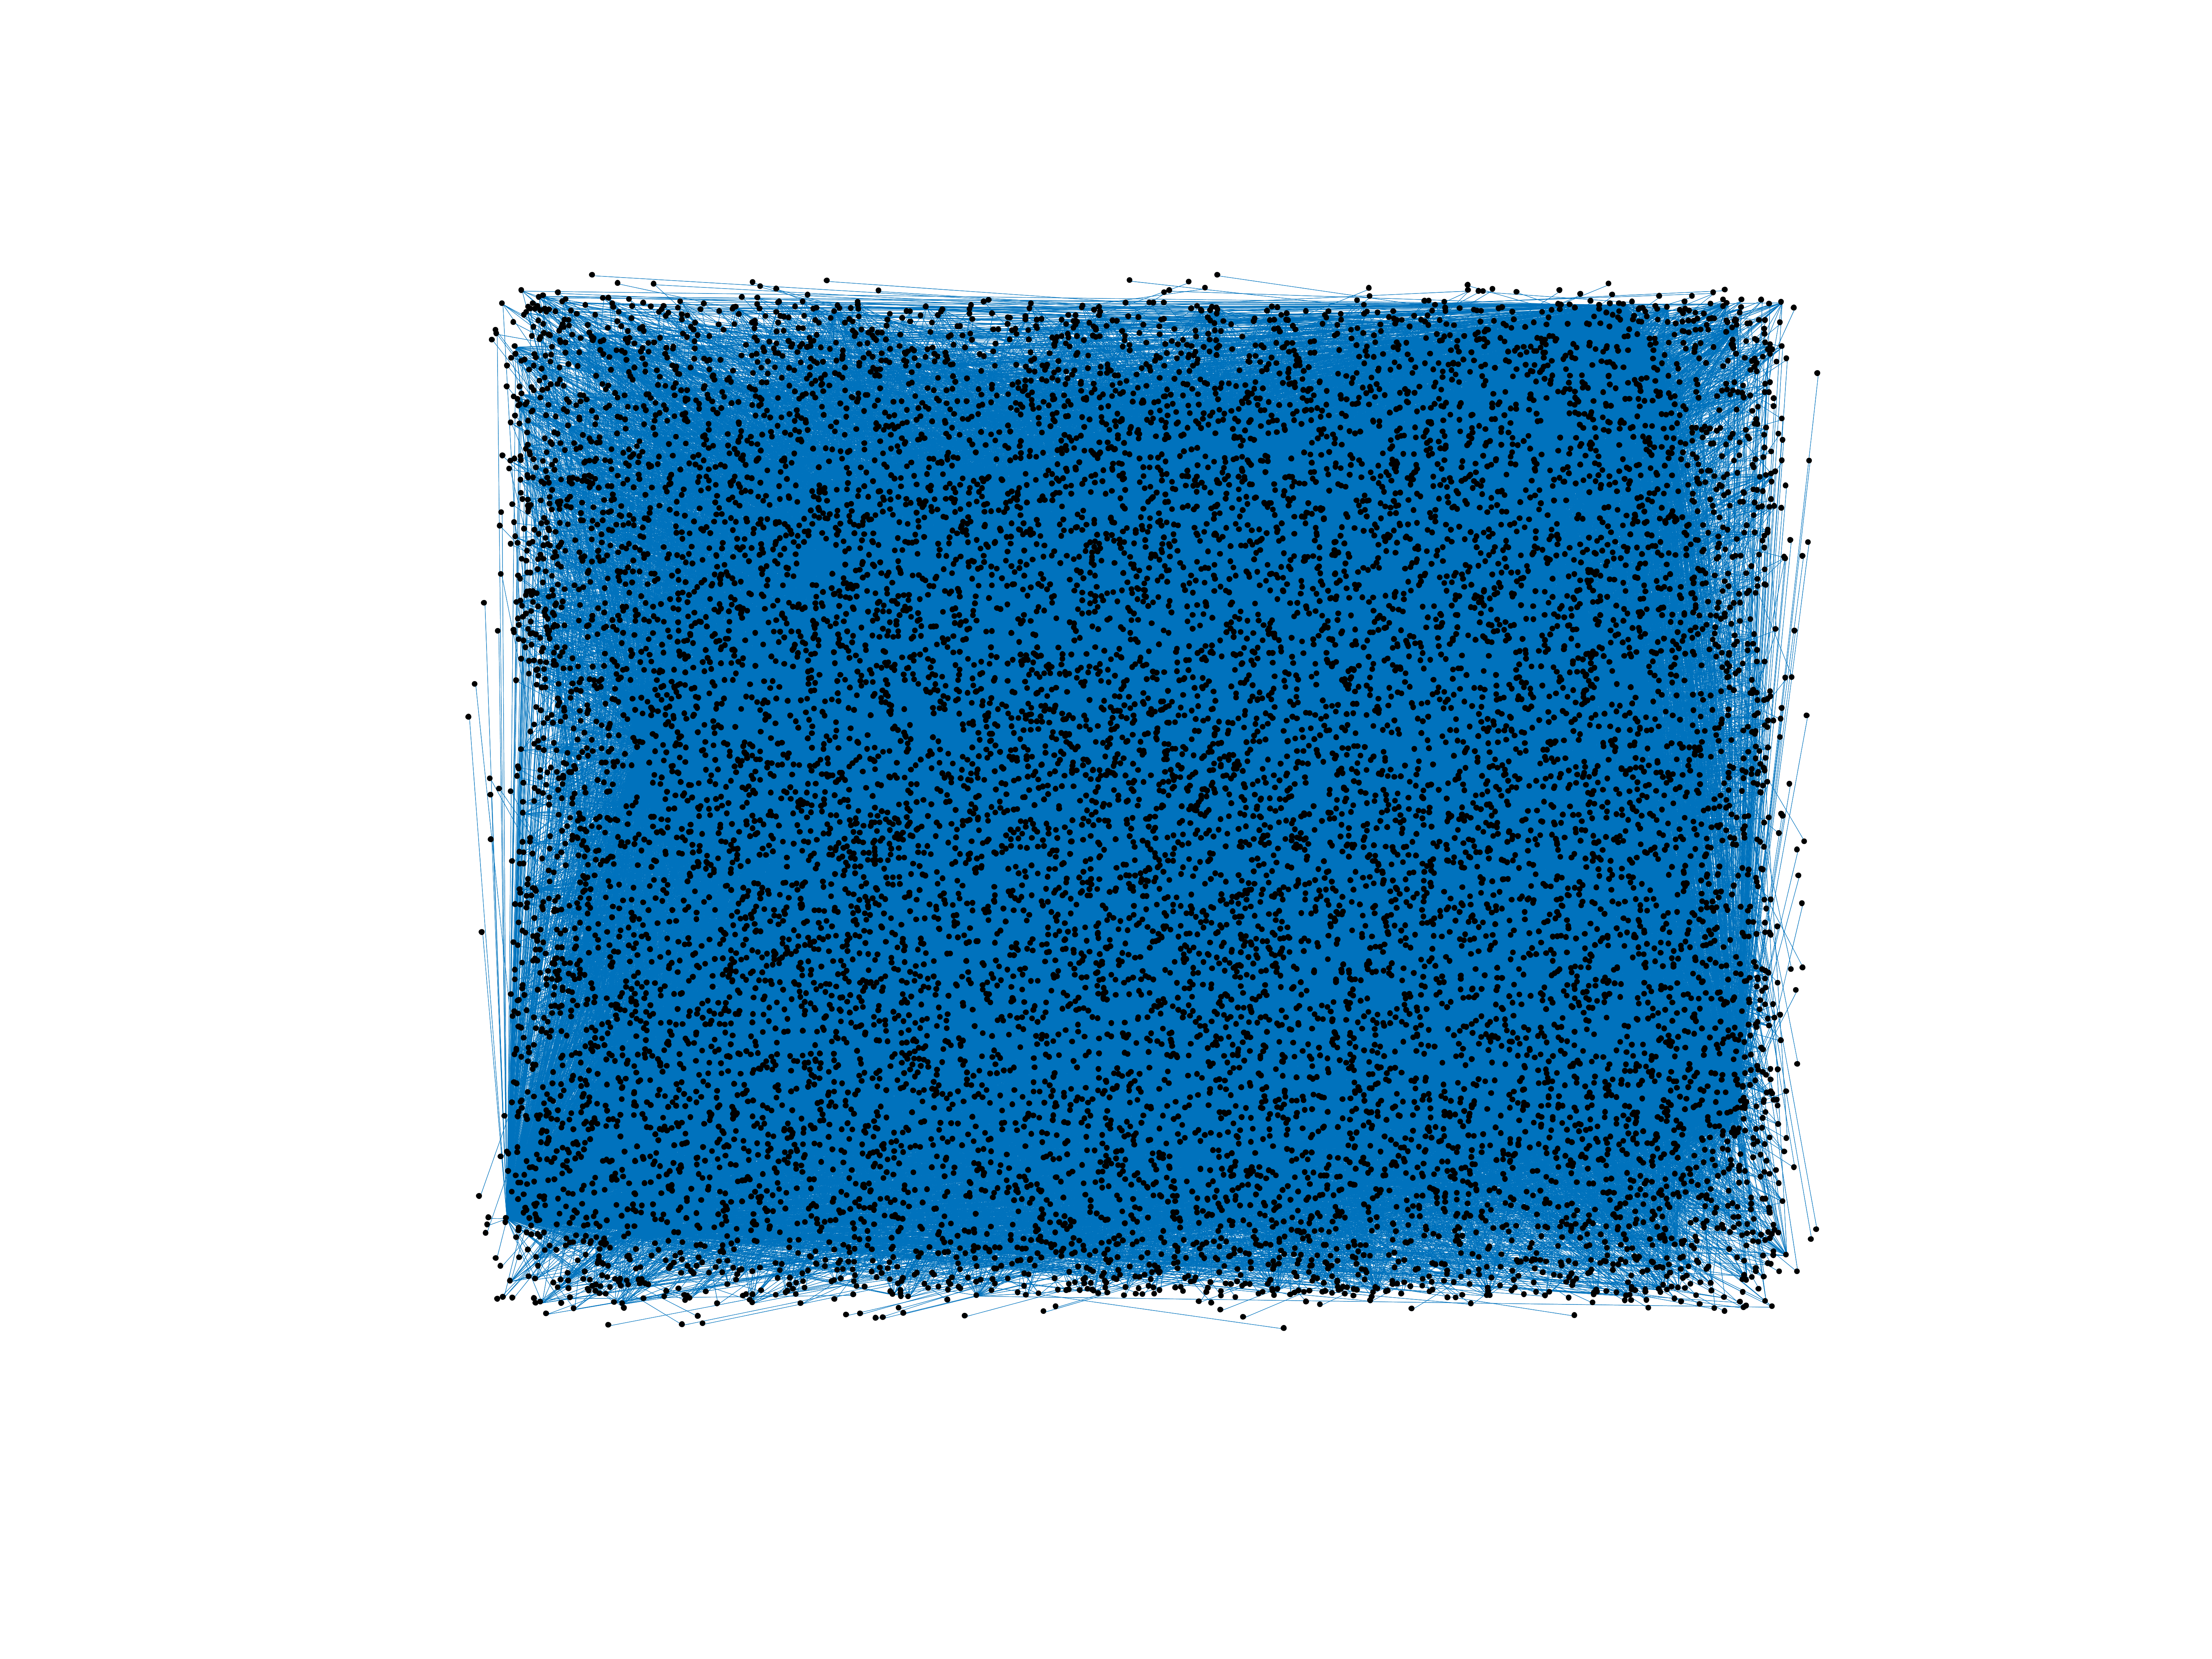
This is the bipartite edit network of the Dutch Wikivoyage. It contains users
and pages from the Dutch Wikivoyage, connected by edit events. Each edge
represents an edit. The dataset includes the timestamp of each edit.
Metadata
Statistics
| Size | n = | 12,679
|
| Left size | n1 = | 1,133
|
| Right size | n2 = | 11,546
|
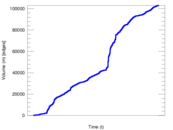
| Volume | m = | 103,017
|
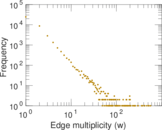
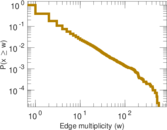
| Unique edge count | m̿ = | 40,464
|
| Wedge count | s = | 36,143,488
|
| Claw count | z = | 31,122,417,945
|
| Cross count | x = | 22,551,362,556,989
|
| Square count | q = | 42,515,371
|
| 4-Tour count | T4 = | 484,848,180
|
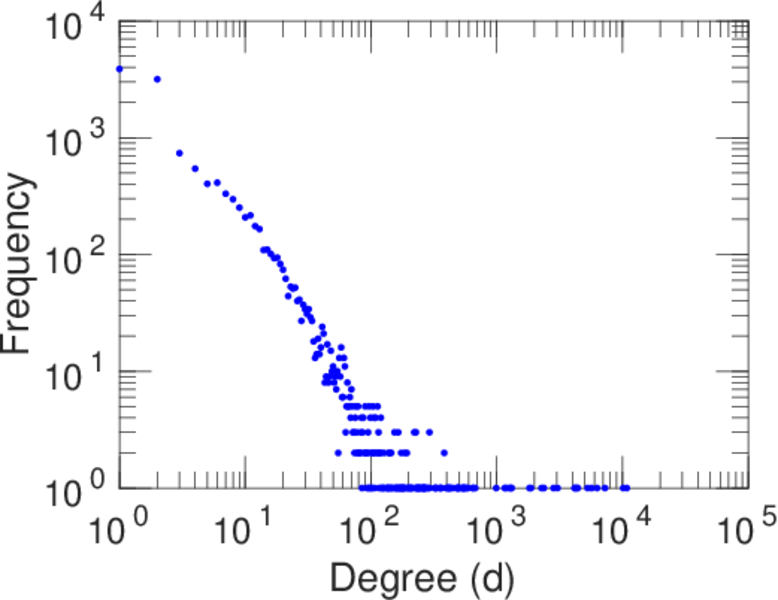
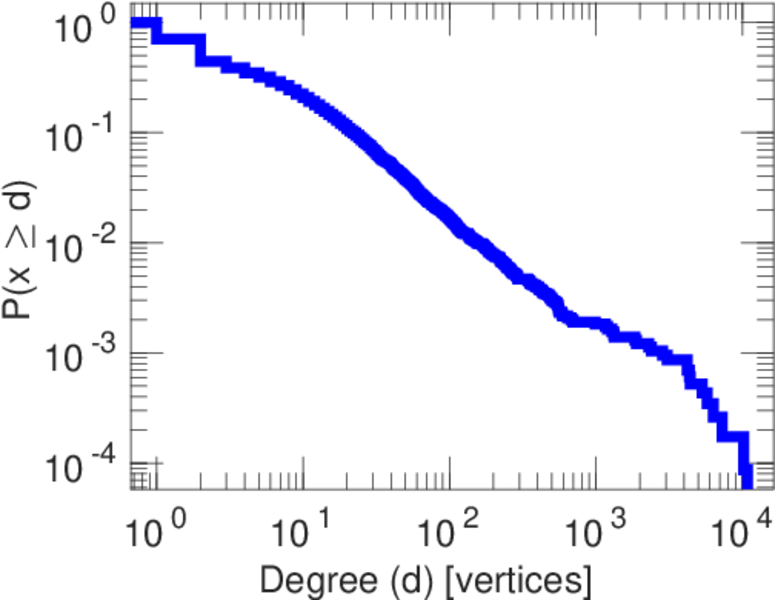
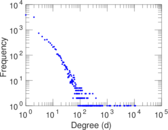
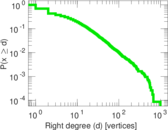
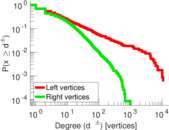
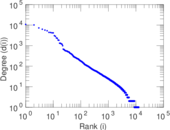
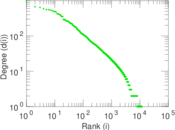
| Maximum degree | dmax = | 10,845
|
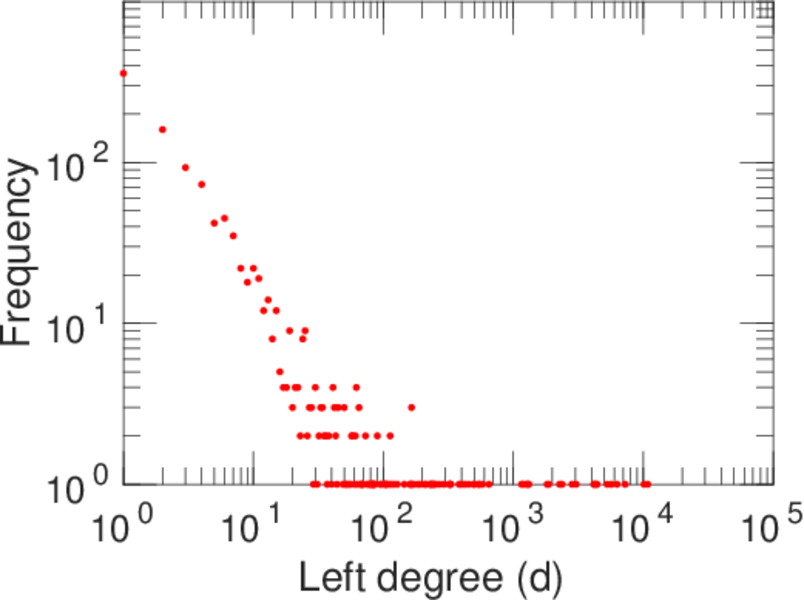
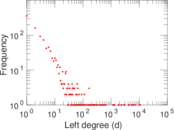
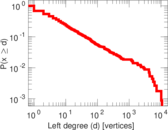
| Maximum left degree | d1max = | 10,845
|
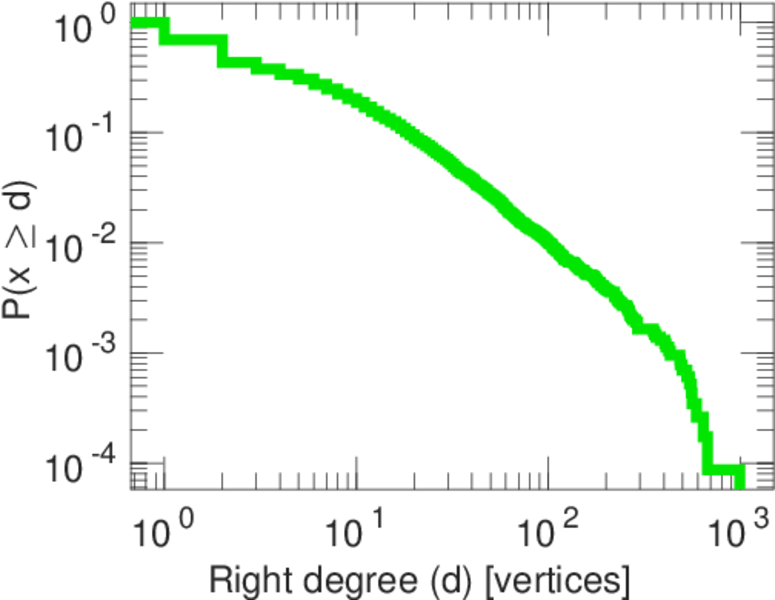
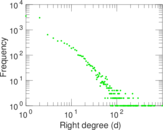
| Maximum right degree | d2max = | 992
|
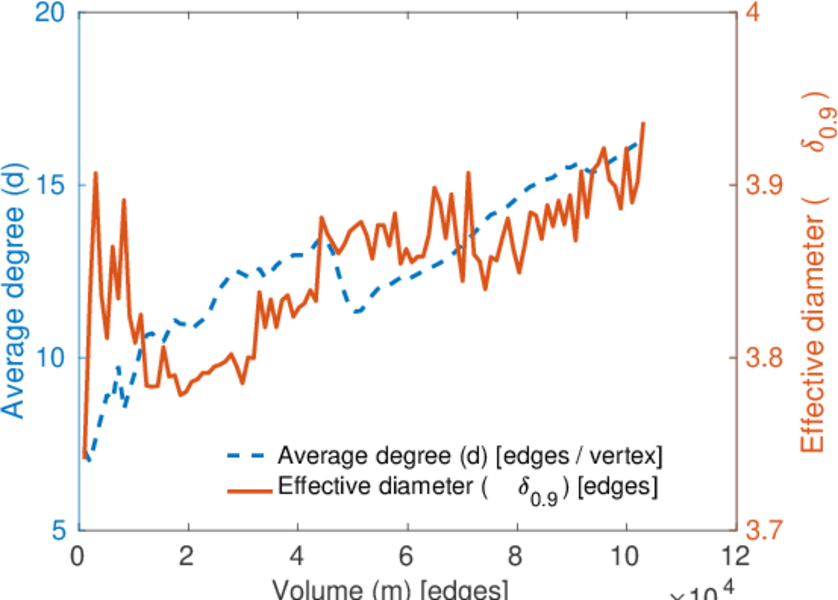
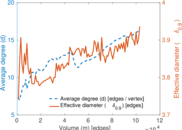
| Average degree | d = | 16.250 0
|
| Average left degree | d1 = | 90.924 1
|
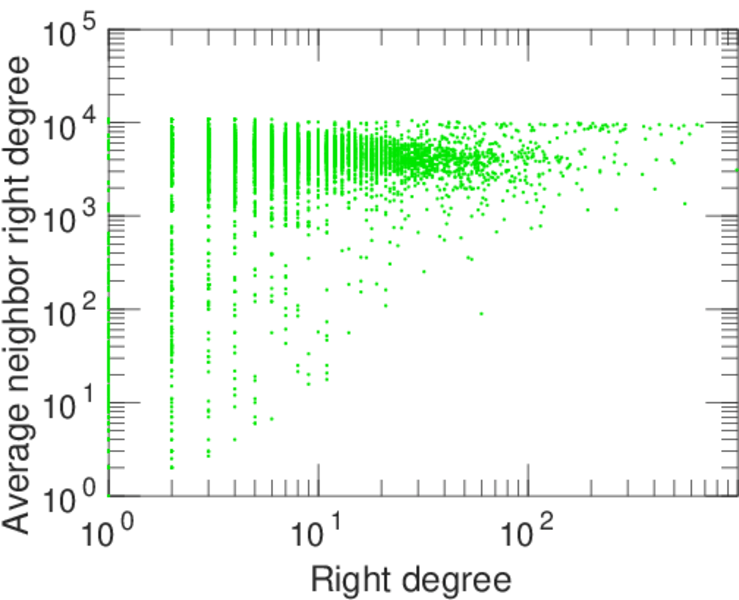
| Average right degree | d2 = | 8.922 31
|
| Fill | p = | 0.003 093 20
|
| Average edge multiplicity | m̃ = | 2.545 89
|
| Size of LCC | N = | 12,444
|
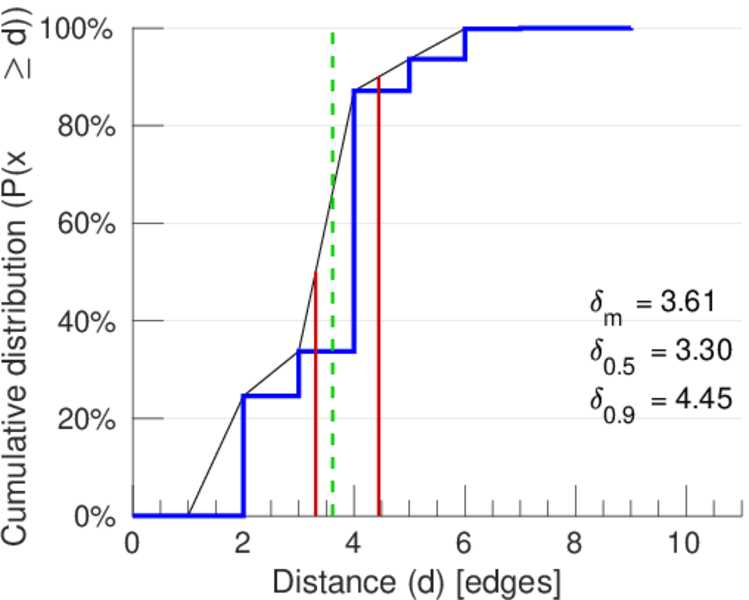
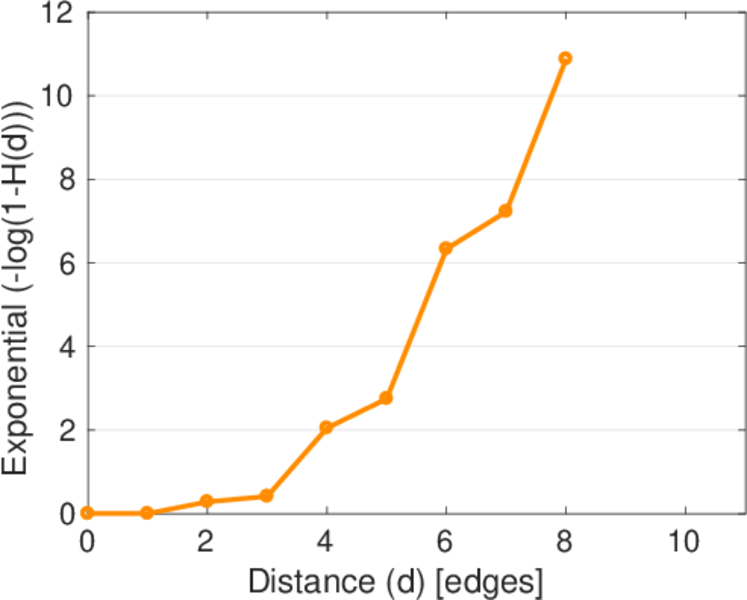
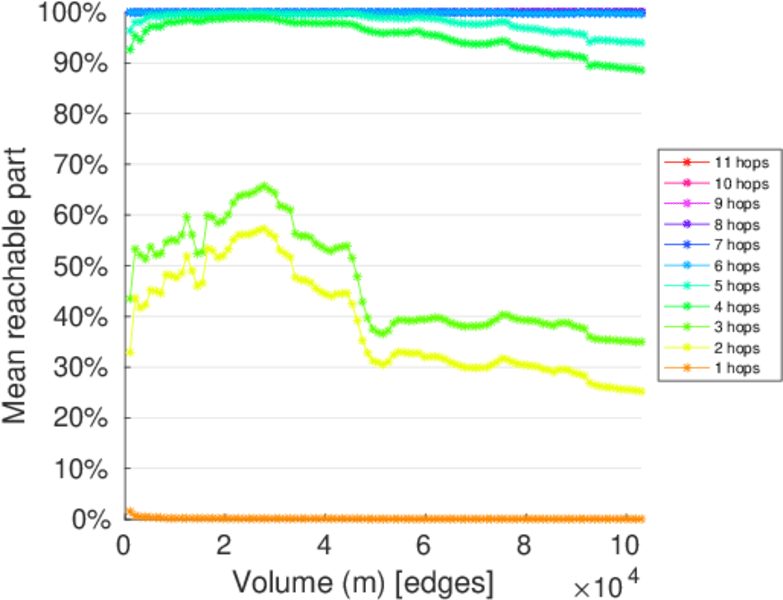
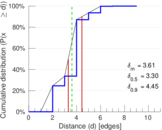
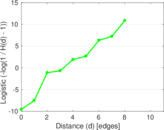
| Diameter | δ = | 11
|
| 50-Percentile effective diameter | δ0.5 = | 3.304 57
|
| 90-Percentile effective diameter | δ0.9 = | 4.446 33
|
| Median distance | δM = | 4
|
| Mean distance | δm = | 3.611 75
|
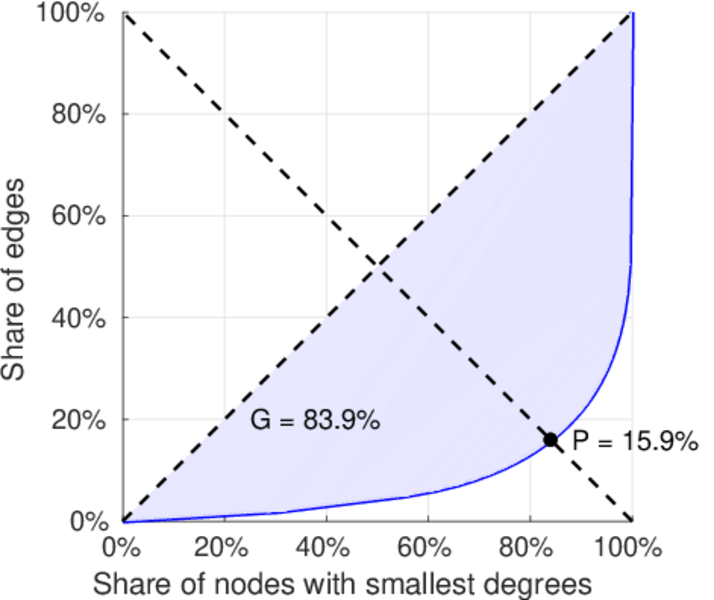
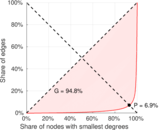
| Gini coefficient | G = | 0.844 828
|
| Balanced inequality ratio | P = | 0.152 800
|
| Left balanced inequality ratio | P1 = | 0.068 843 0
|
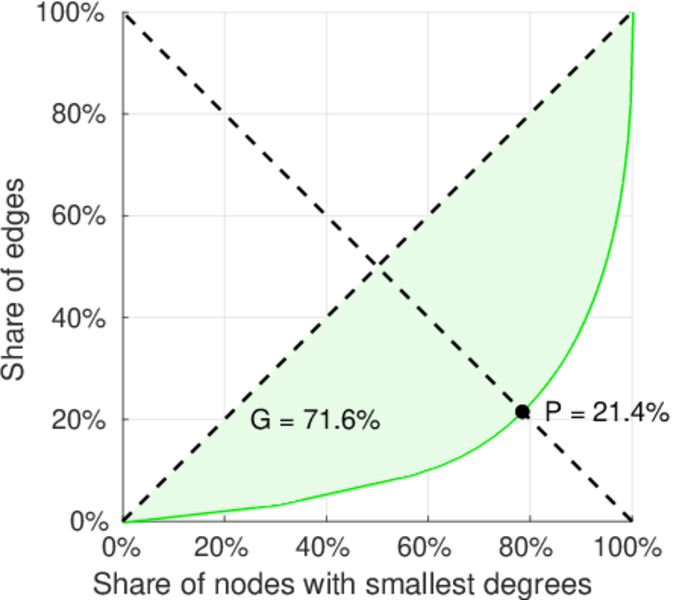
| Right balanced inequality ratio | P2 = | 0.213 693
|
| Relative edge distribution entropy | Her = | 0.742 498
|
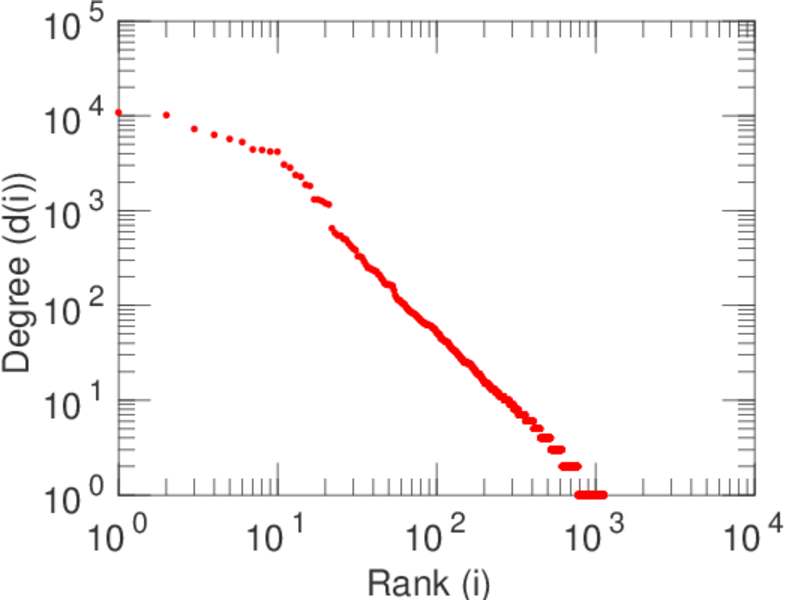
| Power law exponent | γ = | 2.318 60
|
| Tail power law exponent | γt = | 2.641 00
|
| Tail power law exponent with p | γ3 = | 2.641 00
|
| p-value | p = | 0.000 00
|
| Left tail power law exponent with p | γ3,1 = | 1.731 00
|
| Left p-value | p1 = | 0.013 000 0
|
| Right tail power law exponent with p | γ3,2 = | 6.191 00
|
| Right p-value | p2 = | 0.398 000
|
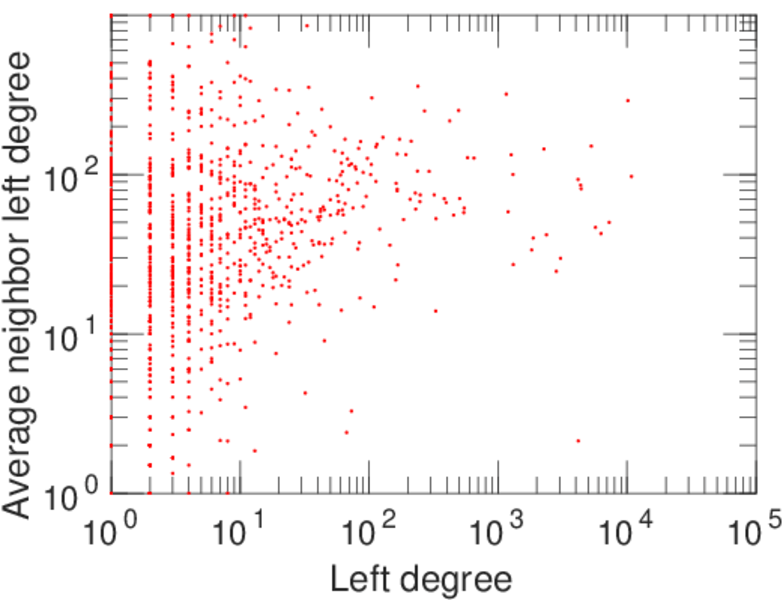
| Degree assortativity | ρ = | −0.229 038
|
| Degree assortativity p-value | pρ = | 0.000 00
|
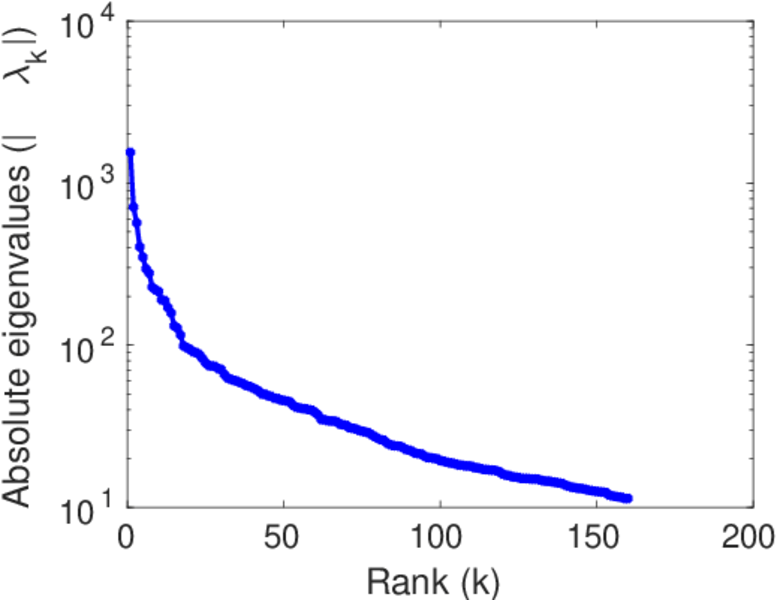
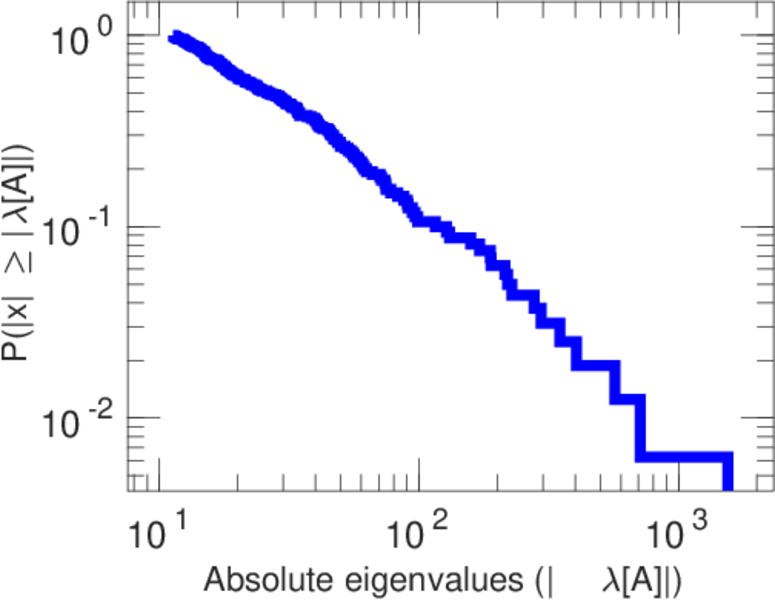
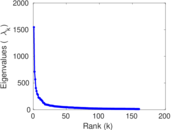
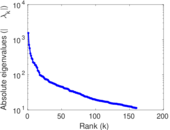
| Spectral norm | α = | 1,546.07
|
| Algebraic connectivity | a = | 0.045 314 2
|
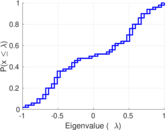
| Spectral separation | |λ1[A] / λ2[A]| = | 2.174 32
|
| Controllability | C = | 10,698
|
| Relative controllability | Cr = | 0.846 093
|
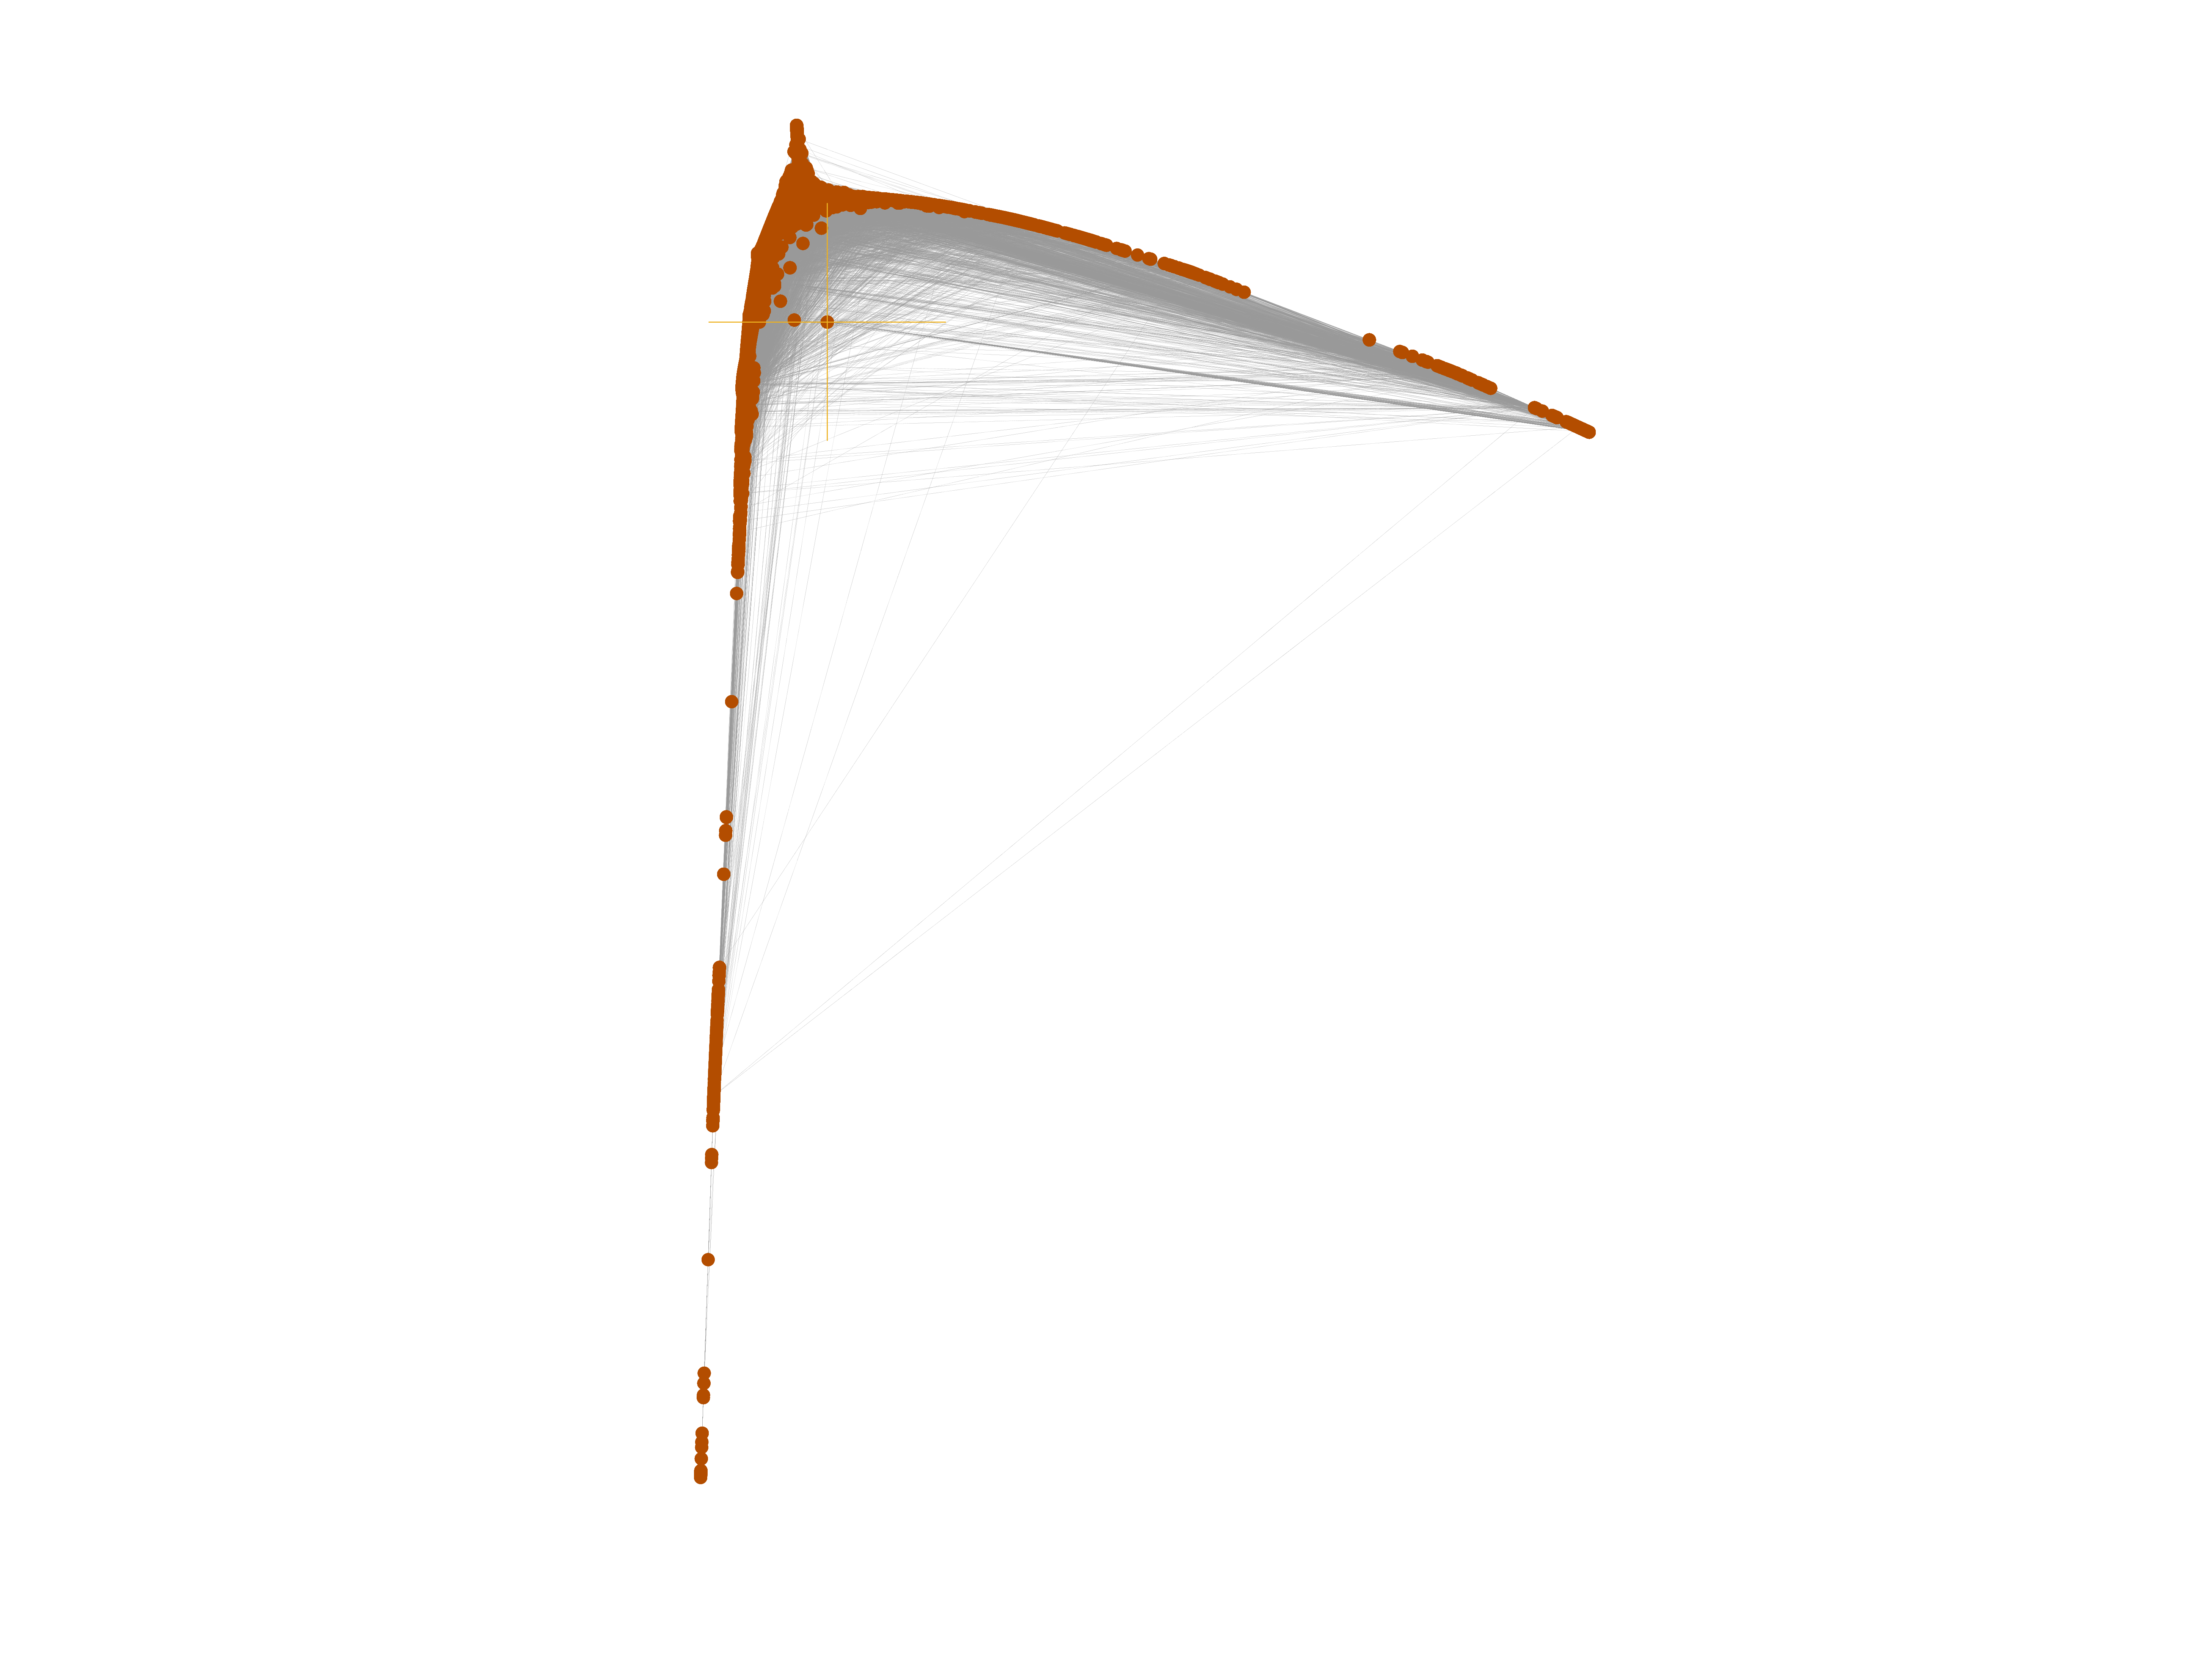
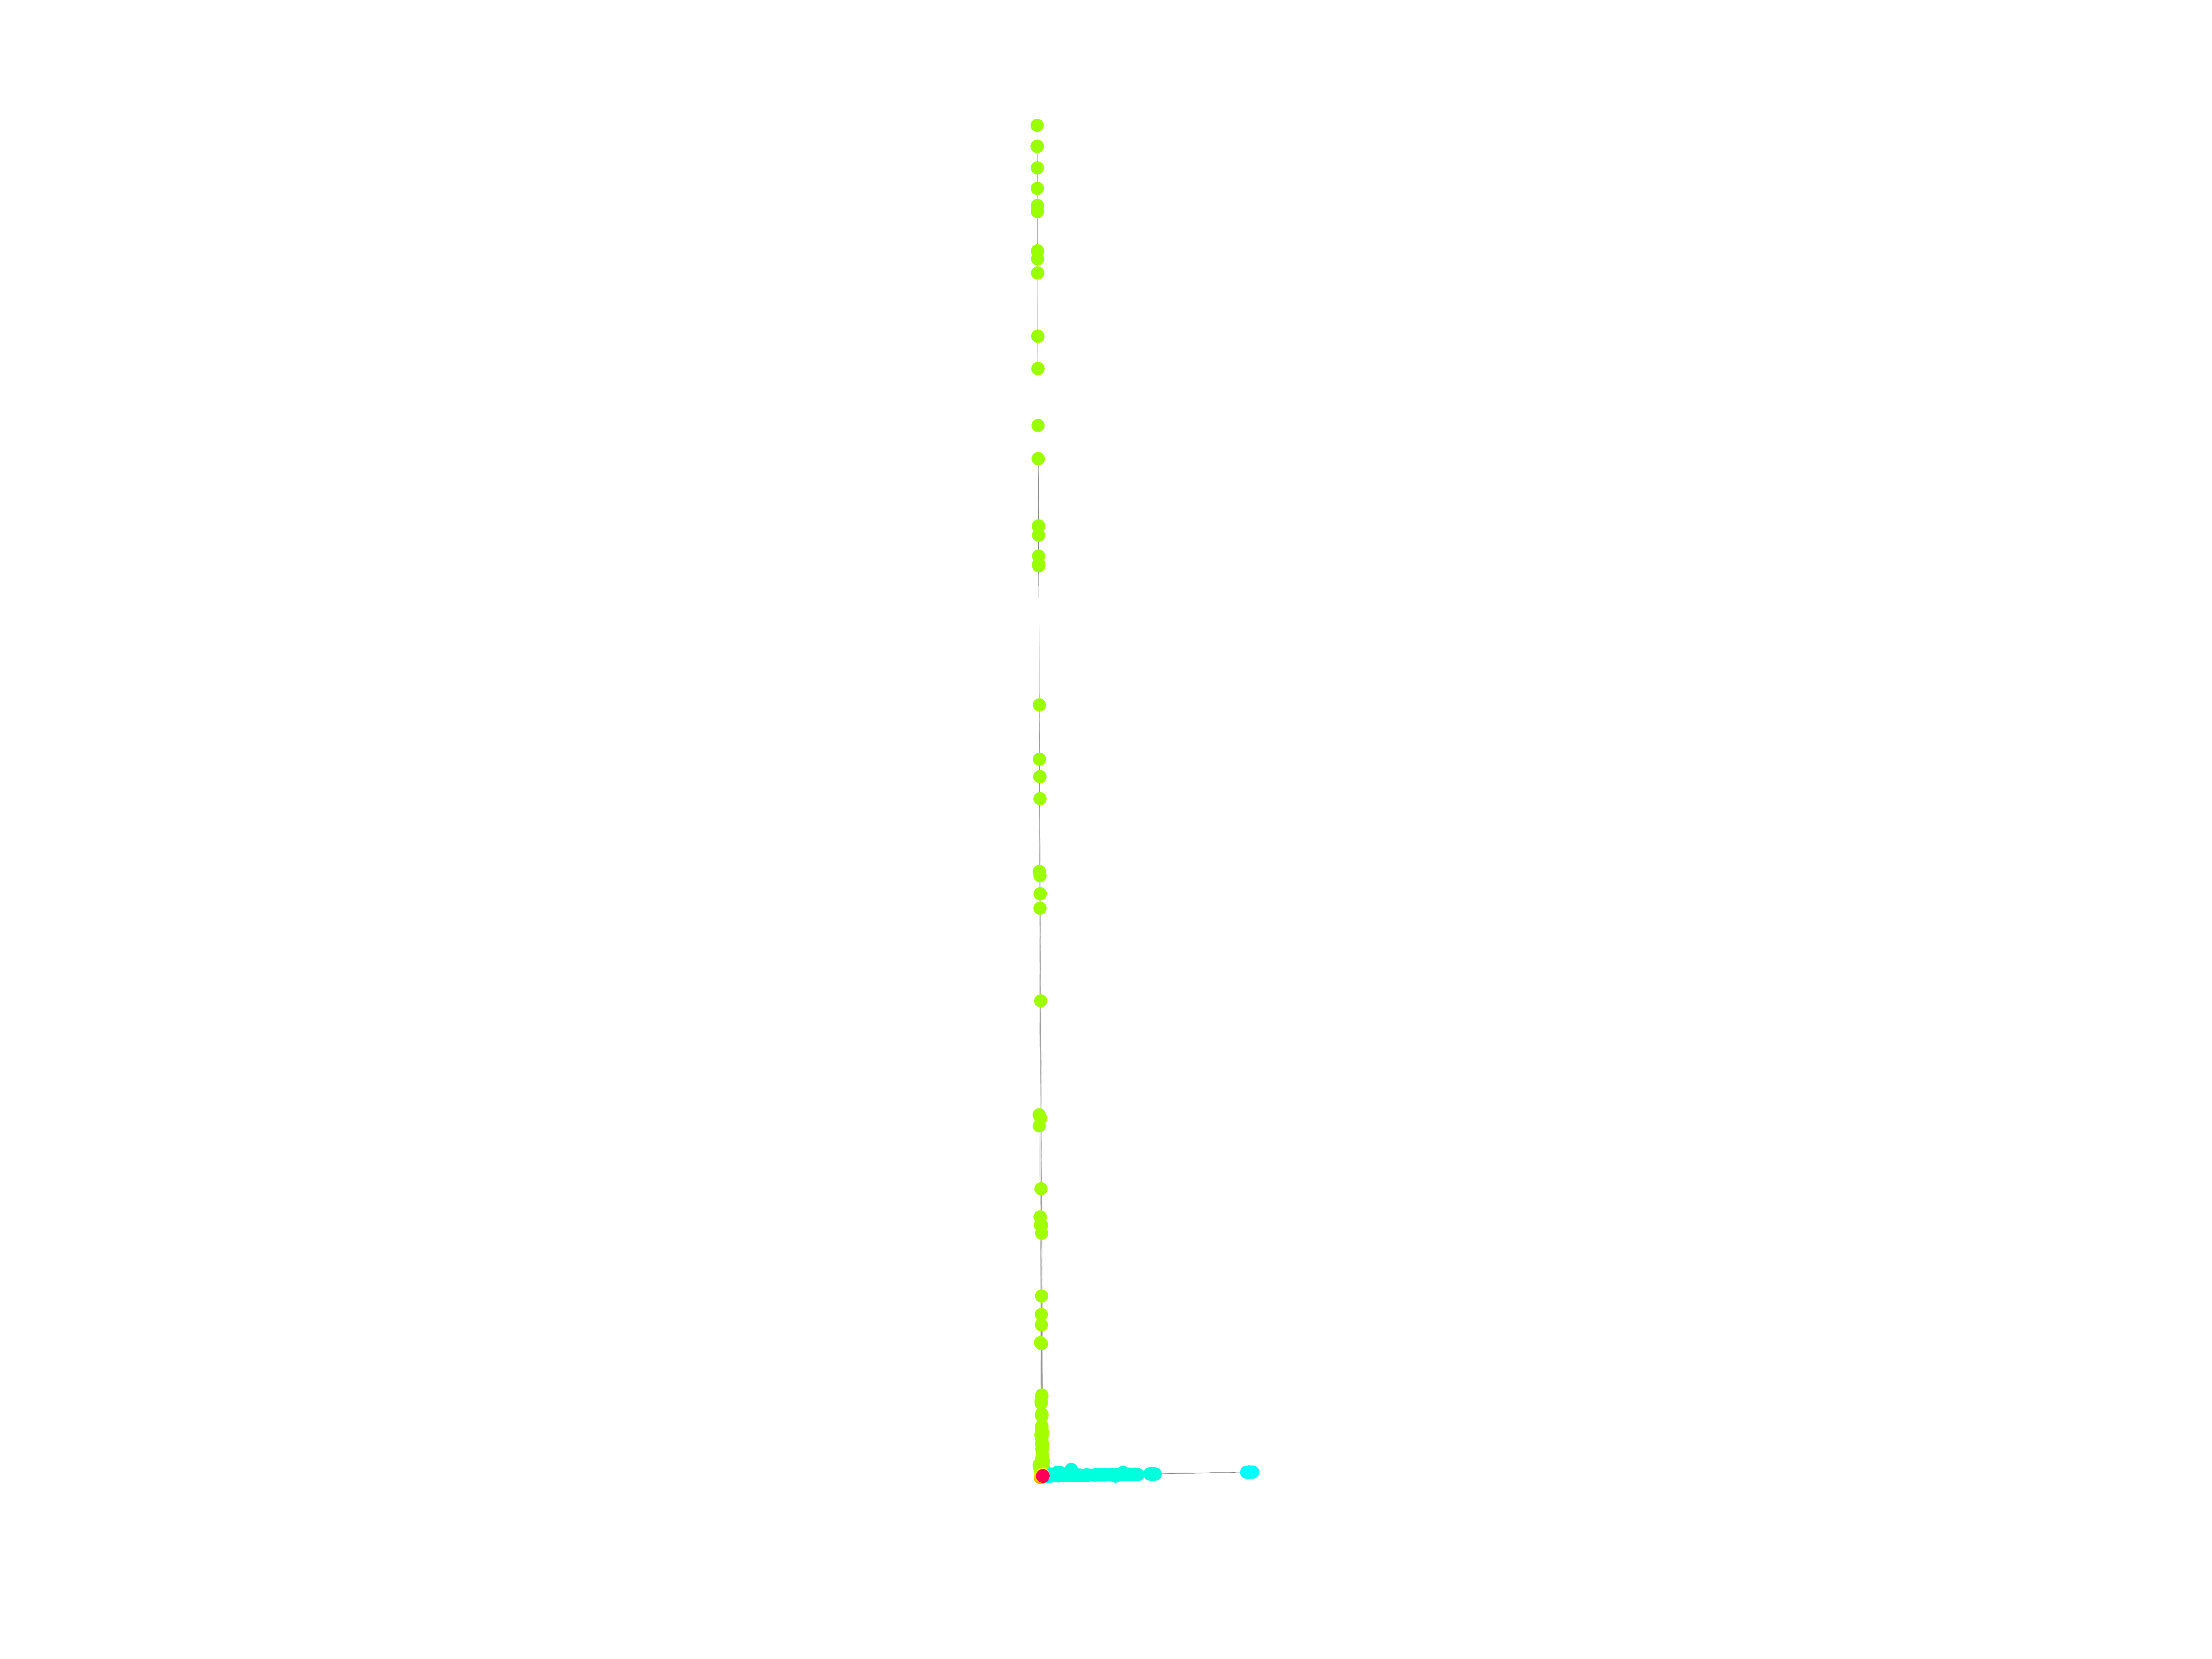
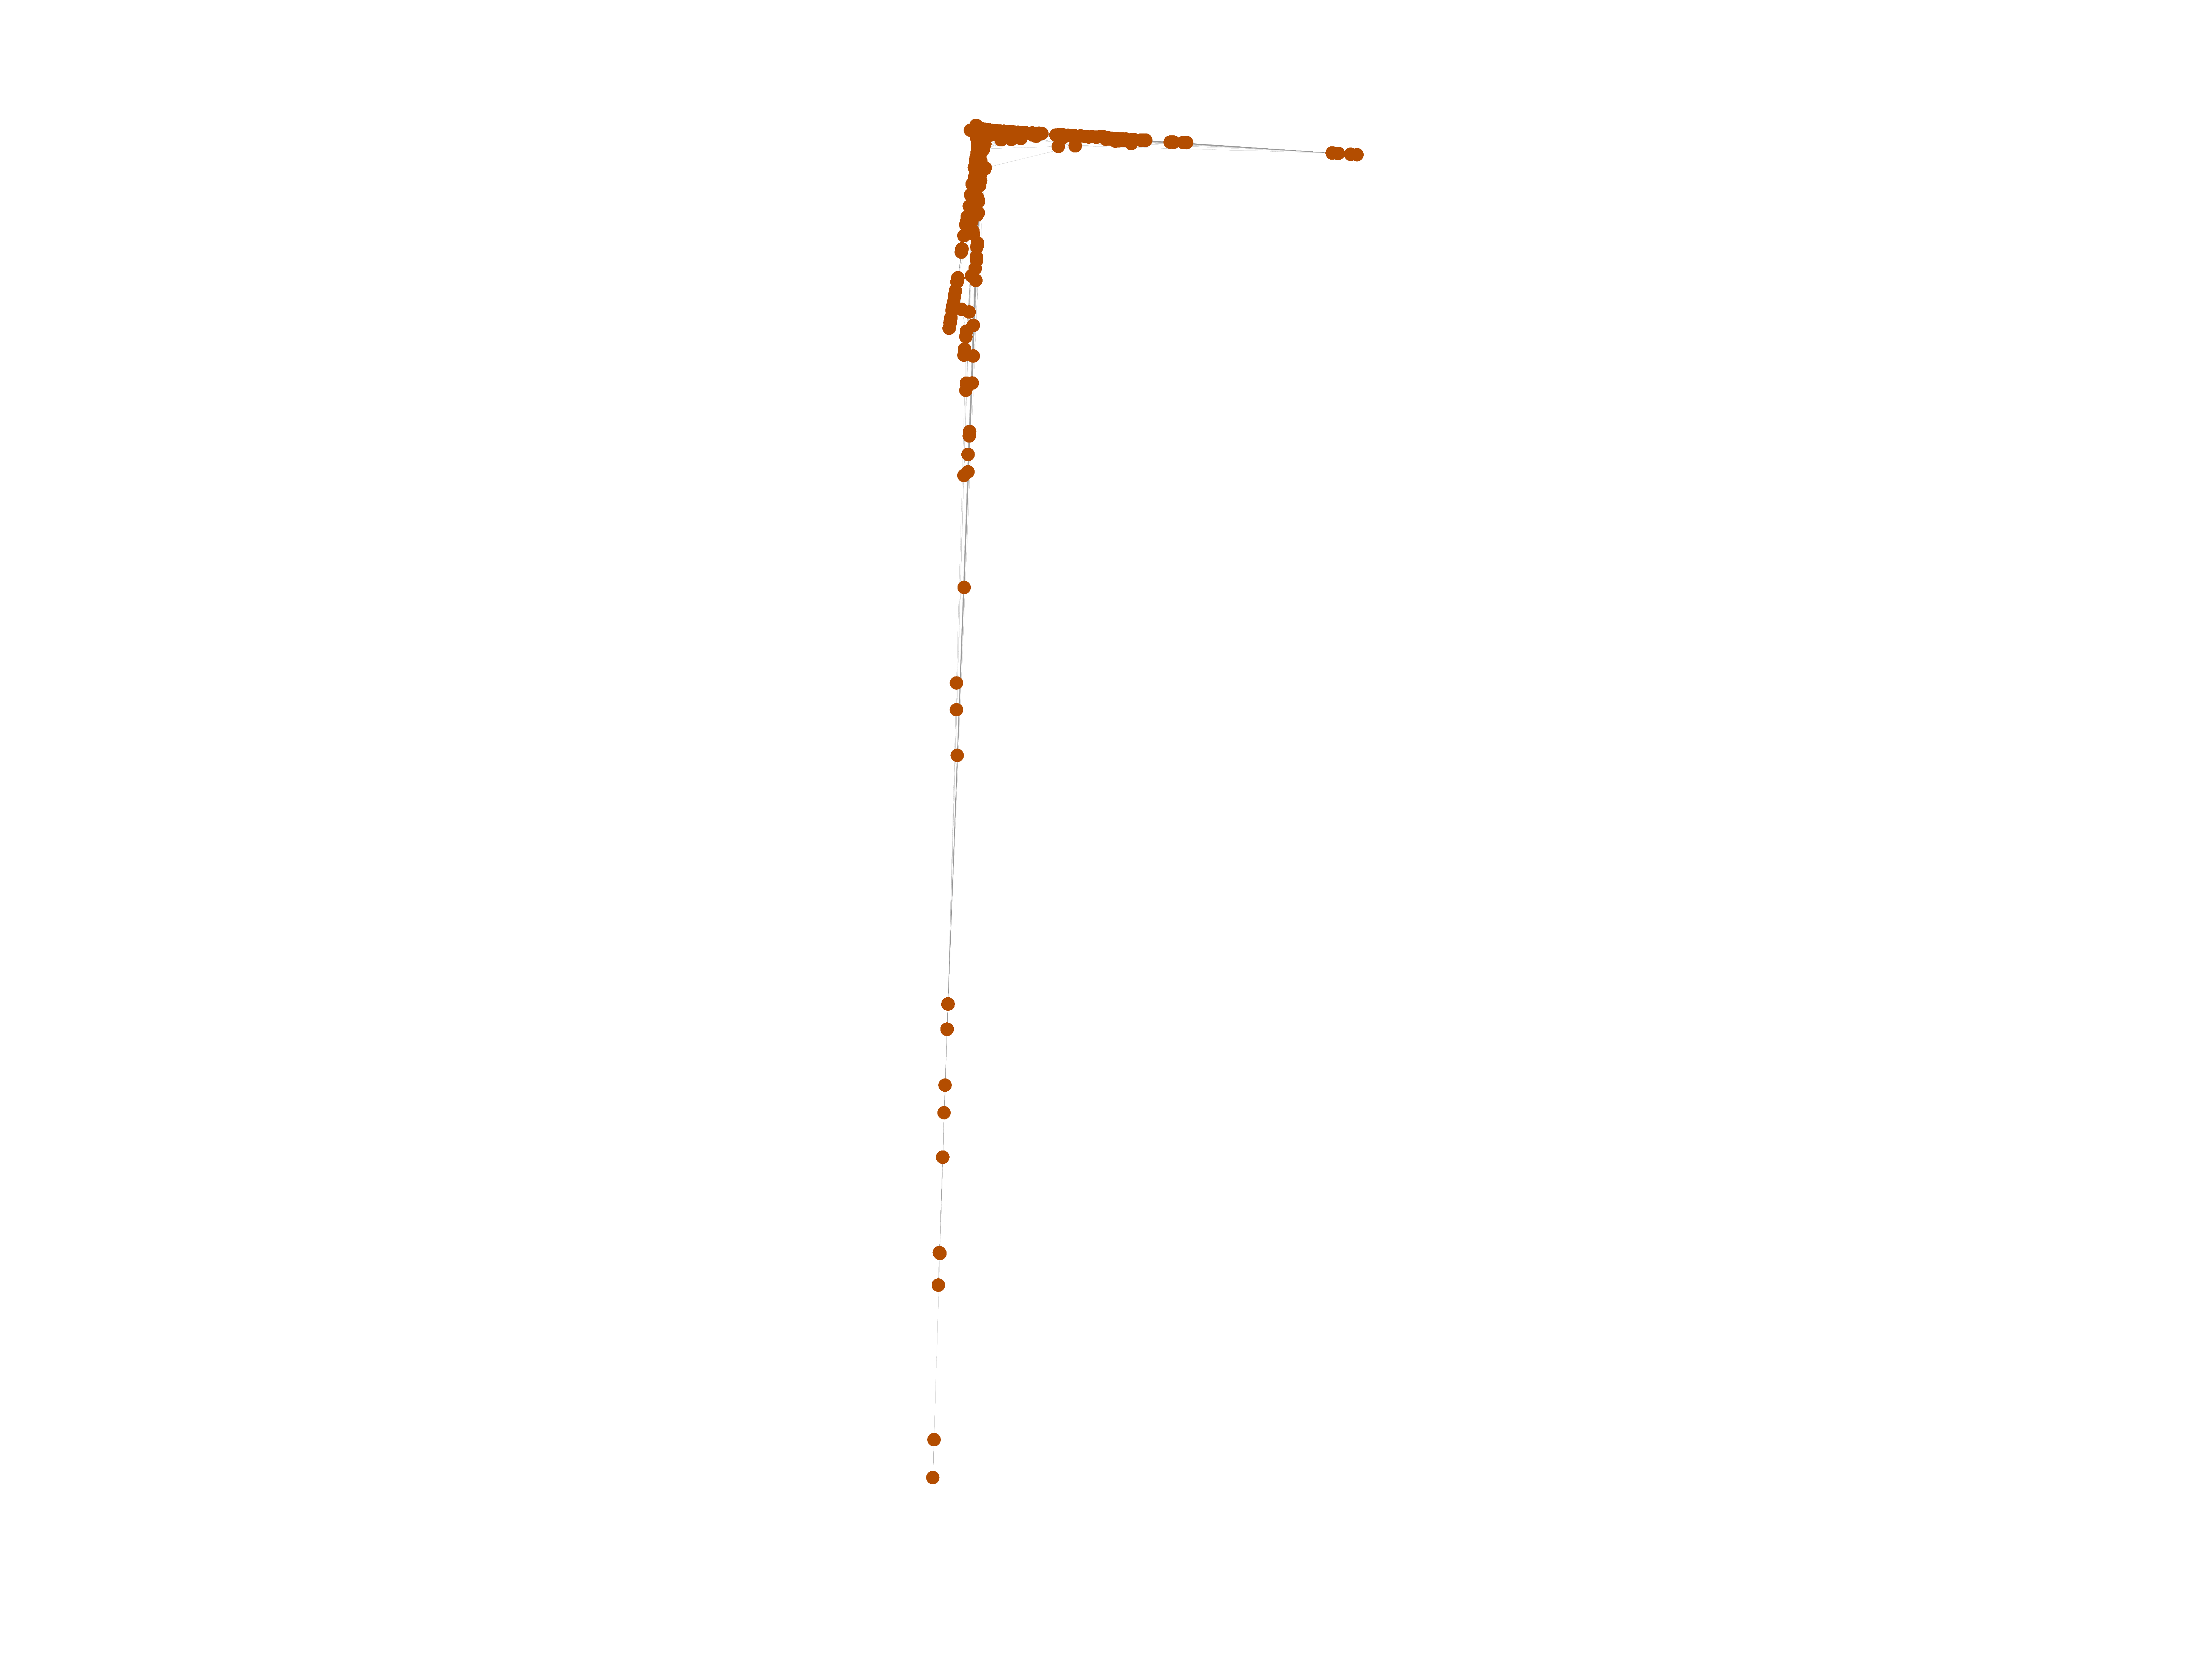
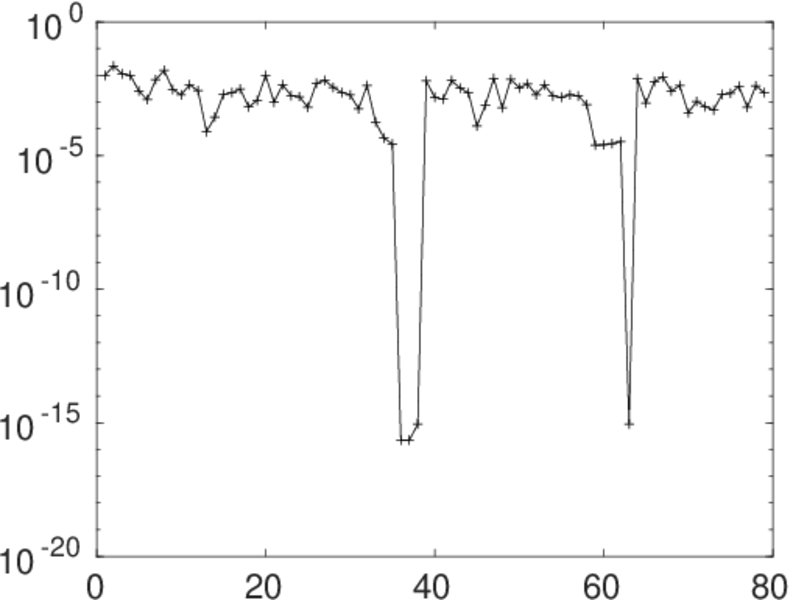
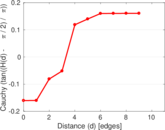
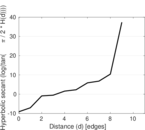
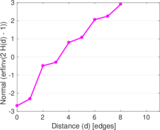
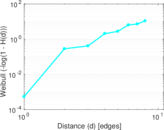
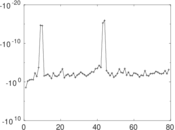
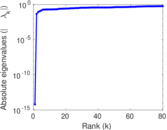
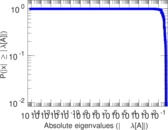
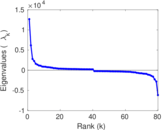
Plots


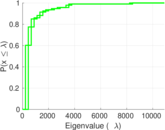
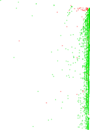
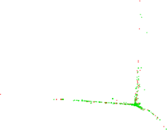
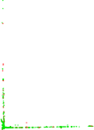


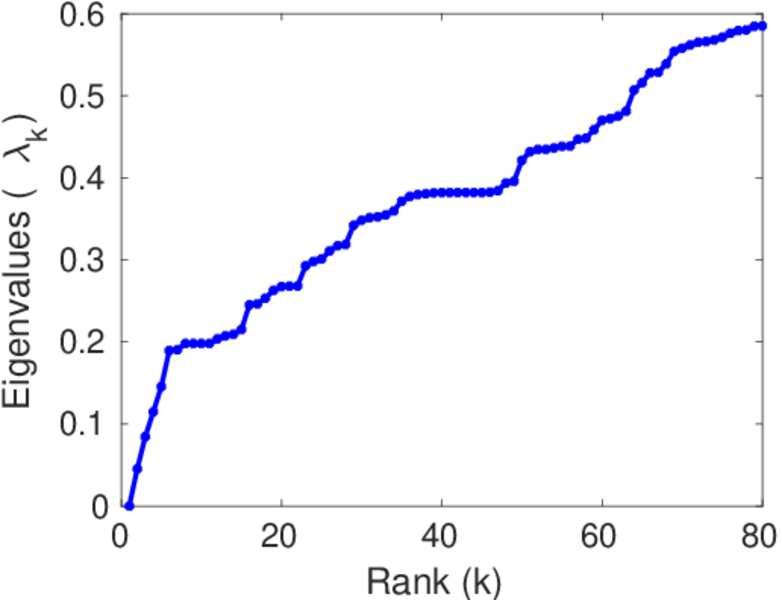
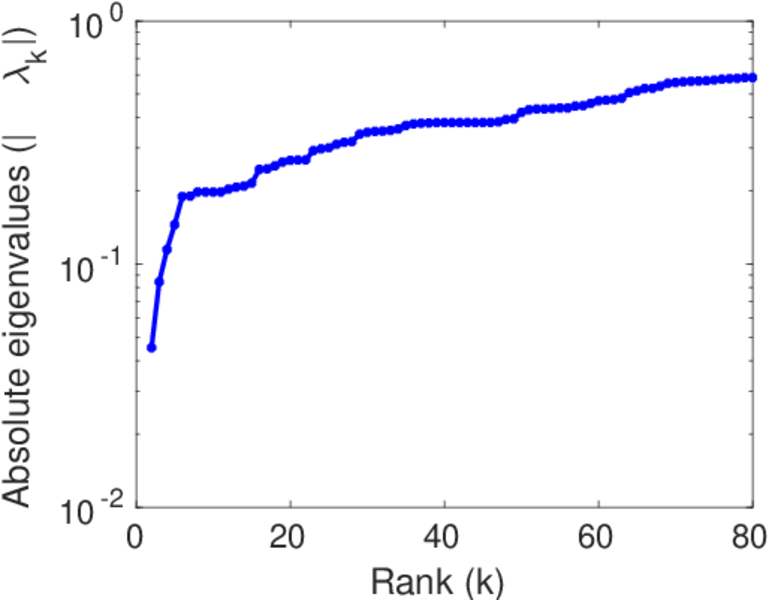
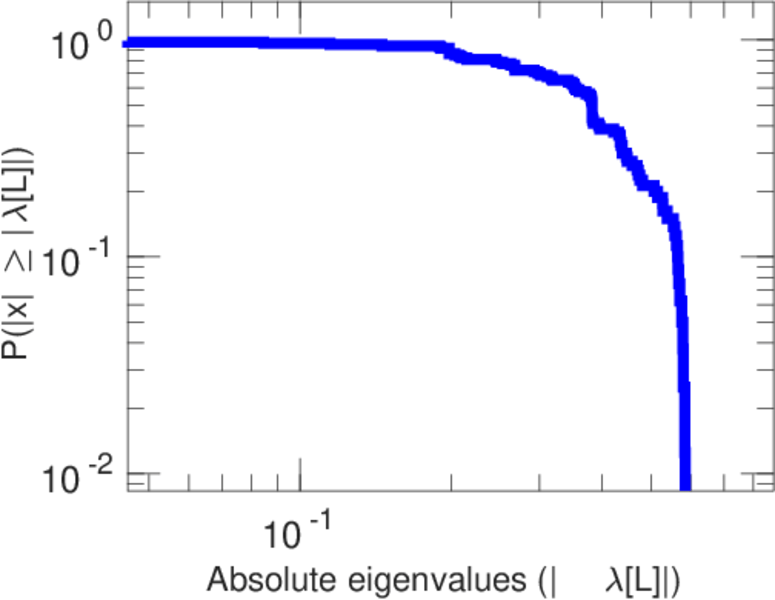
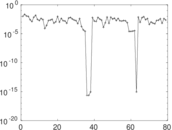
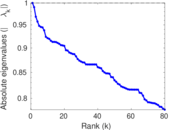
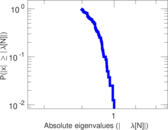
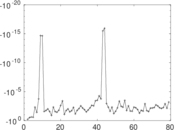
Matrix decompositions plots


Downloads
References
|
[1]
|
Jérôme Kunegis.
KONECT – The Koblenz Network Collection.
In Proc. Int. Conf. on World Wide Web Companion, pages
1343–1350, 2013.
[ http ]
|
|
[2]
|
Wikimedia Foundation.
Wikimedia downloads.
http://dumps.wikimedia.org/, January 2010.
|
 KONECT ‣ Networks ‣
Buy Me a Coffee
KONECT ‣ Networks ‣
Buy Me a Coffee