Wiktionary edits (nl)
This is the bipartite edit network of the Dutch Wiktionary. It contains users
and pages from the Dutch Wiktionary, connected by edit events. Each edge
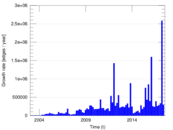
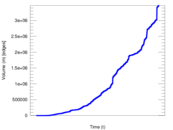
represents an edit. The dataset includes the timestamp of each edit.
Metadata
Statistics
| Size | n = | 658,240
|
| Left size | n1 = | 2,144
|
| Right size | n2 = | 656,096
|
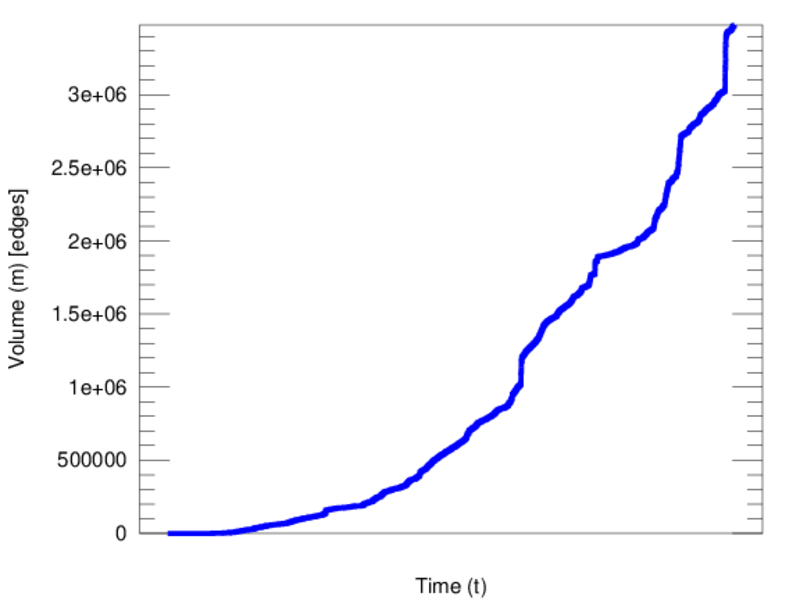
| Volume | m = | 3,476,883
|
| Unique edge count | m̿ = | 2,197,014
|
| Wedge count | s = | 160,181,315,684
|
| Claw count | z = | 12,875,199,316,255,094
|
| Cross count | x = | 9.405 67 × 1020
|
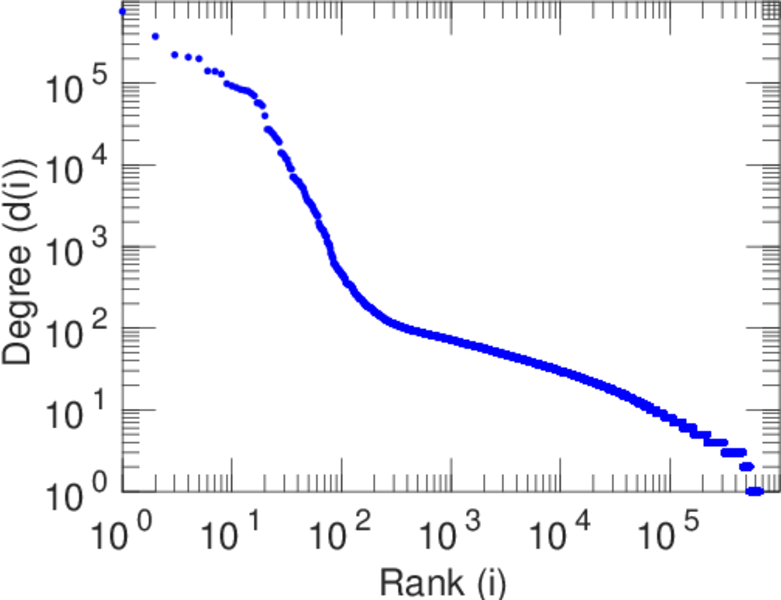
| Maximum degree | dmax = | 757,493
|
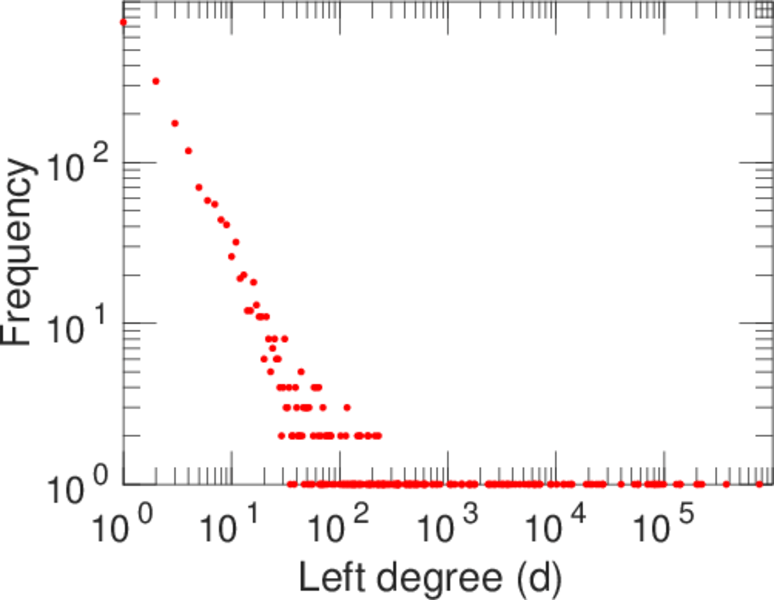
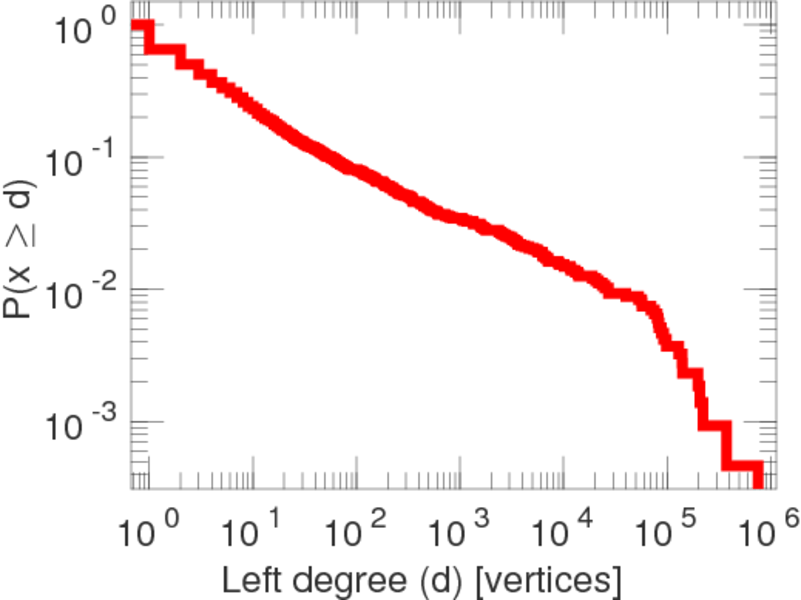
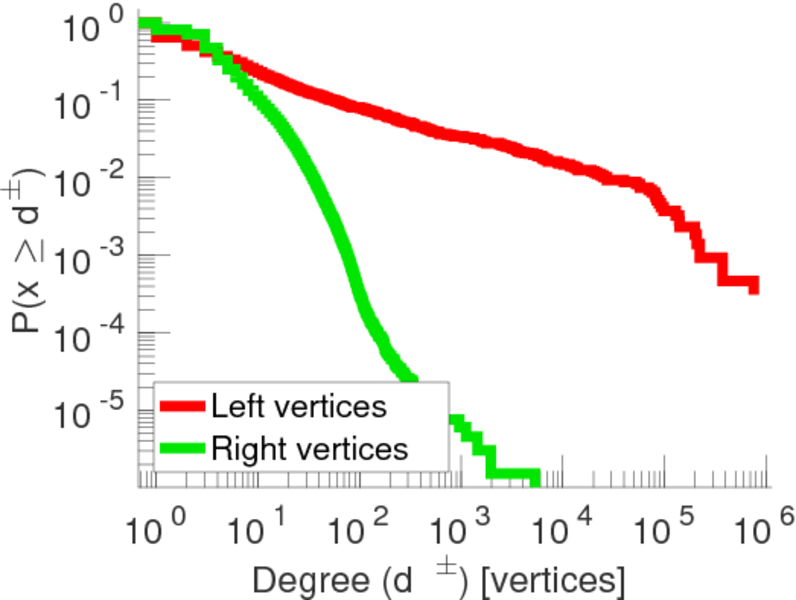
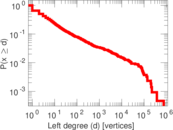
| Maximum left degree | d1max = | 757,493
|
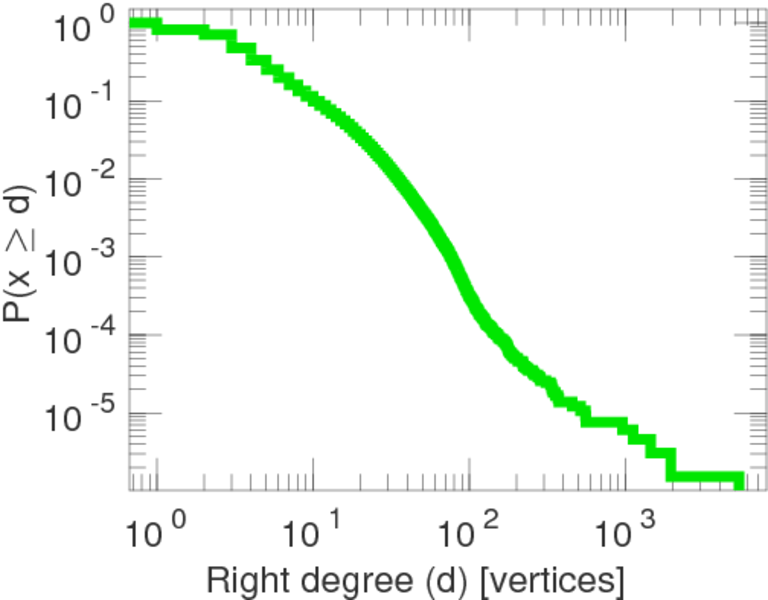
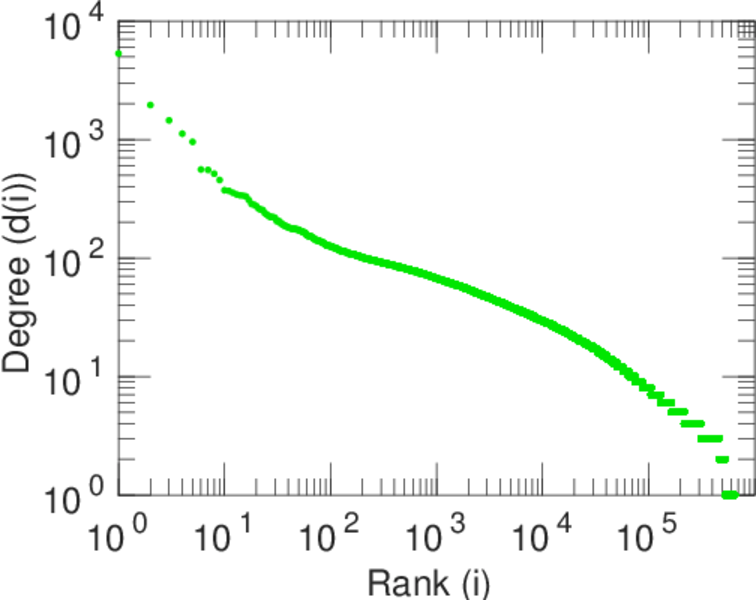
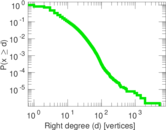
| Maximum right degree | d2max = | 5,319
|
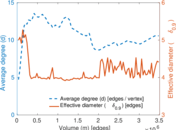
| Average degree | d = | 10.564 2
|
| Average left degree | d1 = | 1,621.68
|
| Average right degree | d2 = | 5.299 35
|
| Fill | p = | 0.001 561 85
|
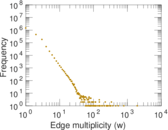
| Average edge multiplicity | m̃ = | 1.582 55
|
| Size of LCC | N = | 657,621
|
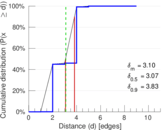
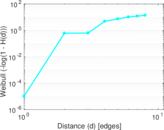
| Diameter | δ = | 11
|
| 50-Percentile effective diameter | δ0.5 = | 3.074 20
|
| 90-Percentile effective diameter | δ0.9 = | 3.827 11
|
| Median distance | δM = | 4
|
| Mean distance | δm = | 3.098 44
|
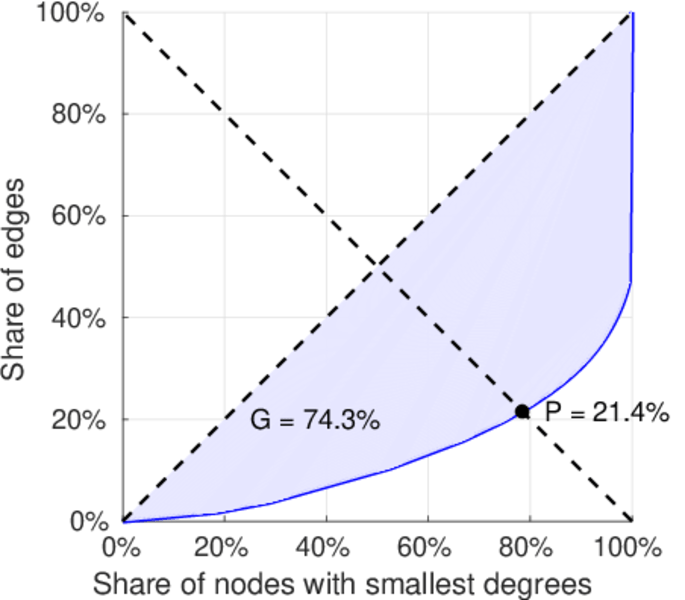
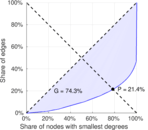
| Gini coefficient | G = | 0.743 905
|
| Balanced inequality ratio | P = | 0.213 465
|
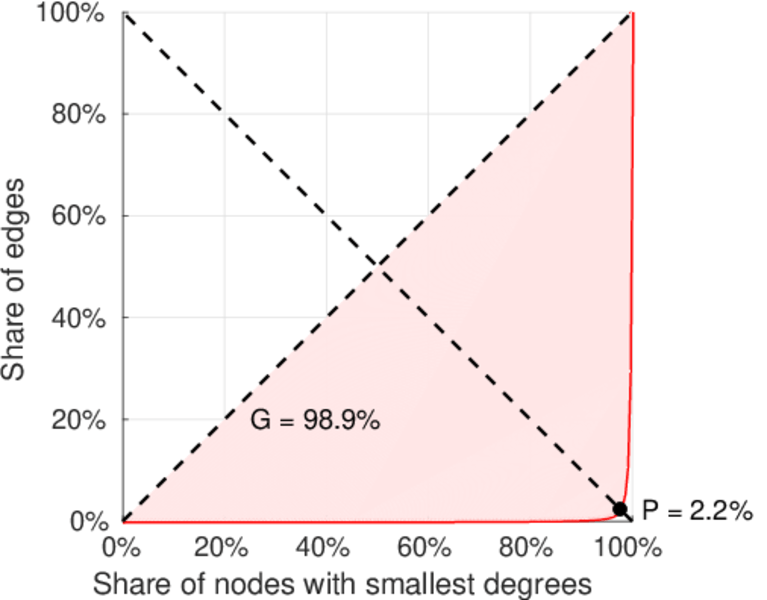
| Left balanced inequality ratio | P1 = | 0.022 272 5
|
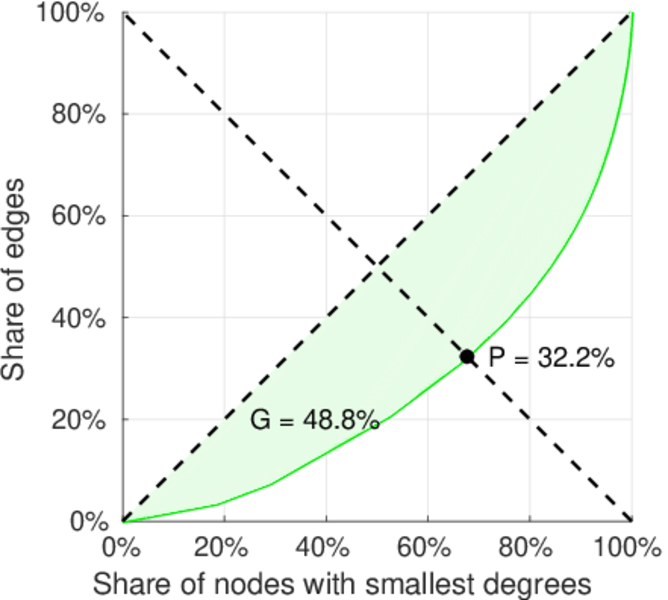
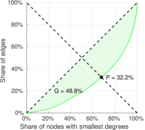
| Right balanced inequality ratio | P2 = | 0.321 853
|
| Relative edge distribution entropy | Her = | 0.662 374
|
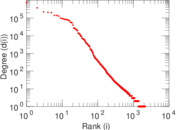
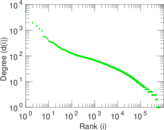
| Power law exponent | γ = | 2.092 61
|
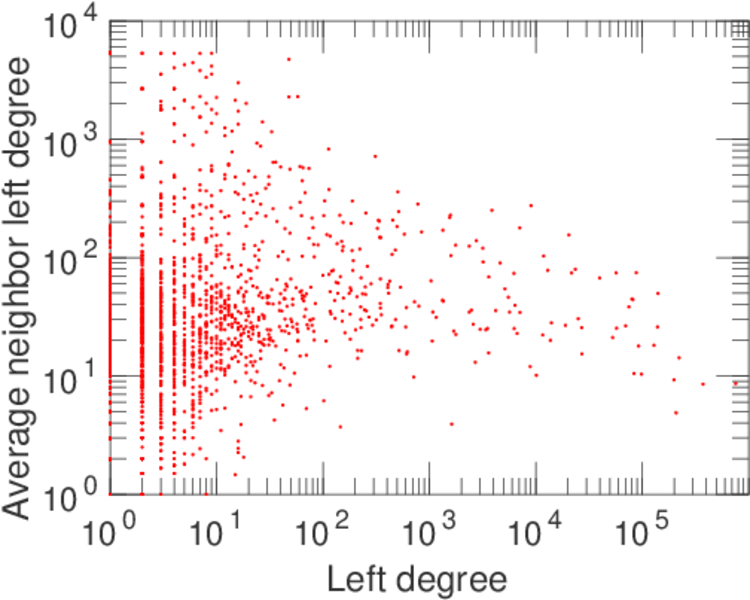
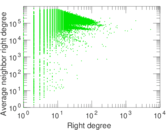
| Degree assortativity | ρ = | −0.312 139
|
| Degree assortativity p-value | pρ = | 0.000 00
|
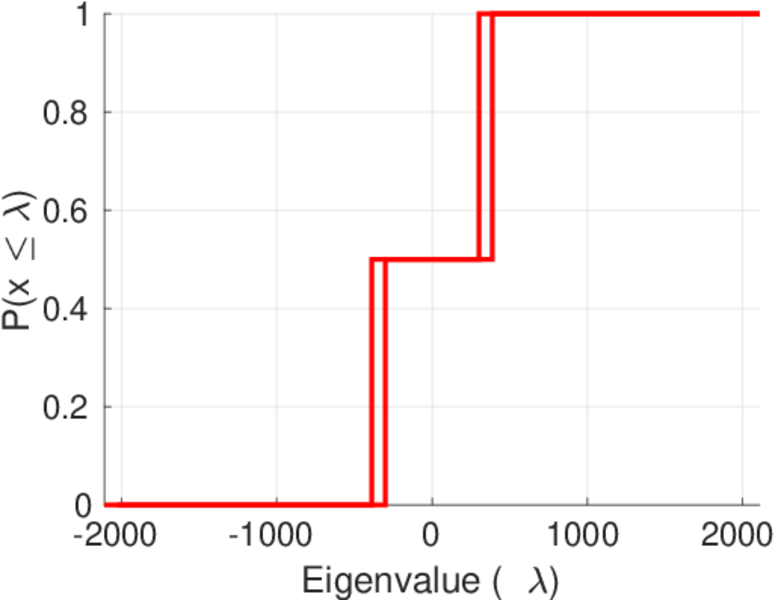
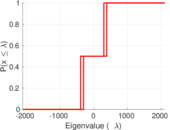
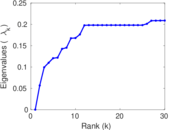
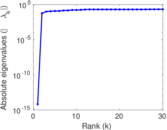
| Spectral norm | α = | 2,110.23
|
| Controllability | C = | 653,951
|
| Relative controllability | Cr = | 0.993 945
|
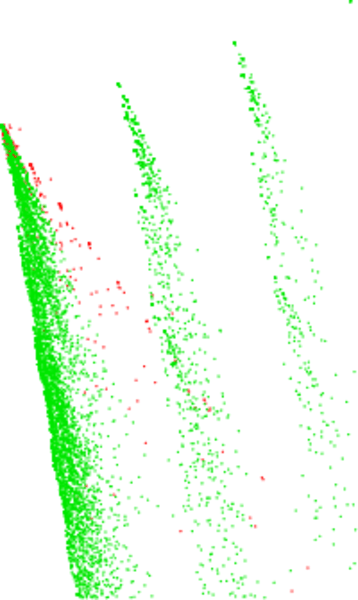
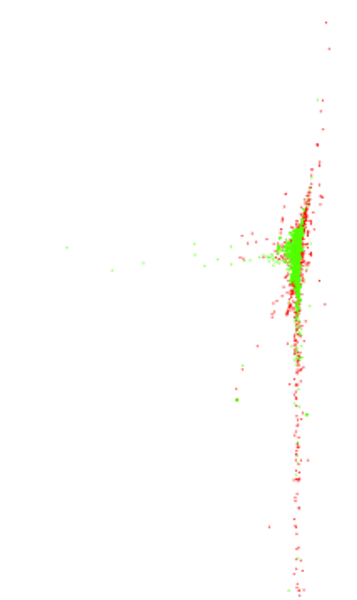
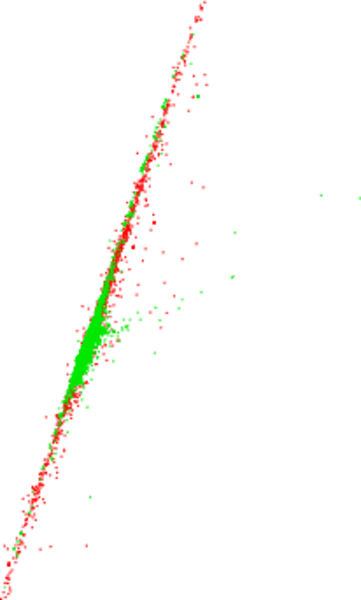
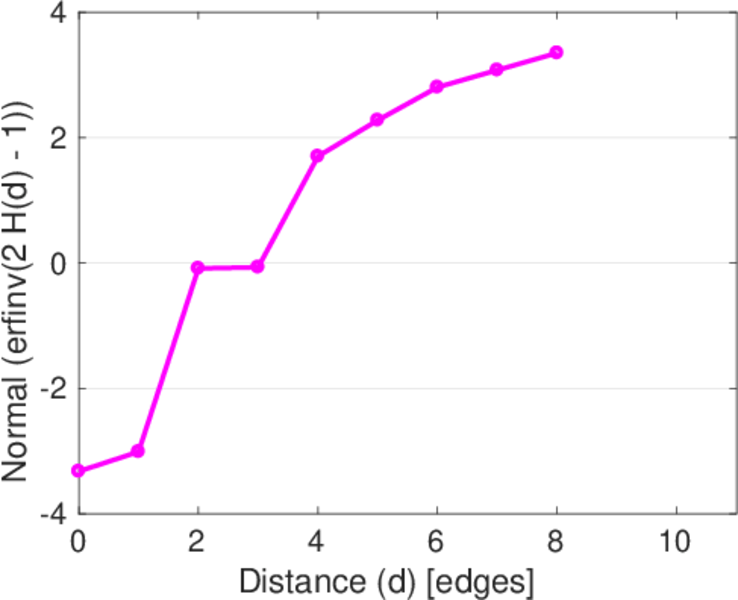
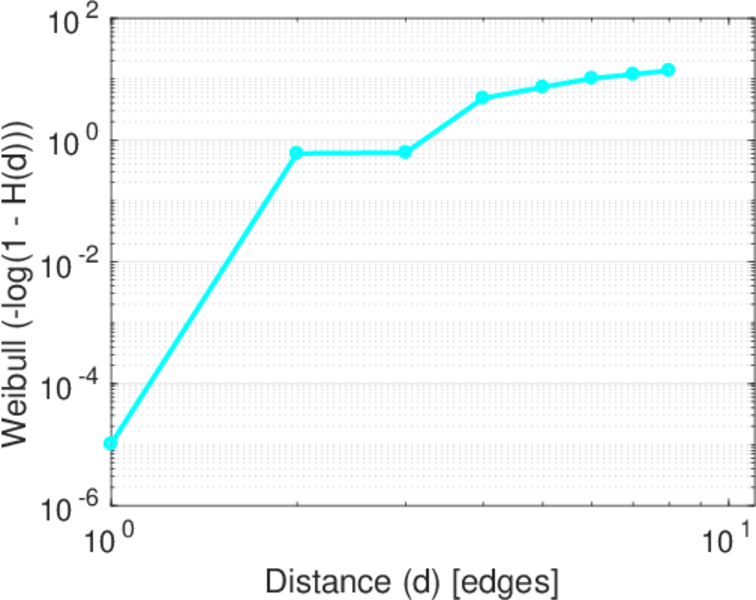
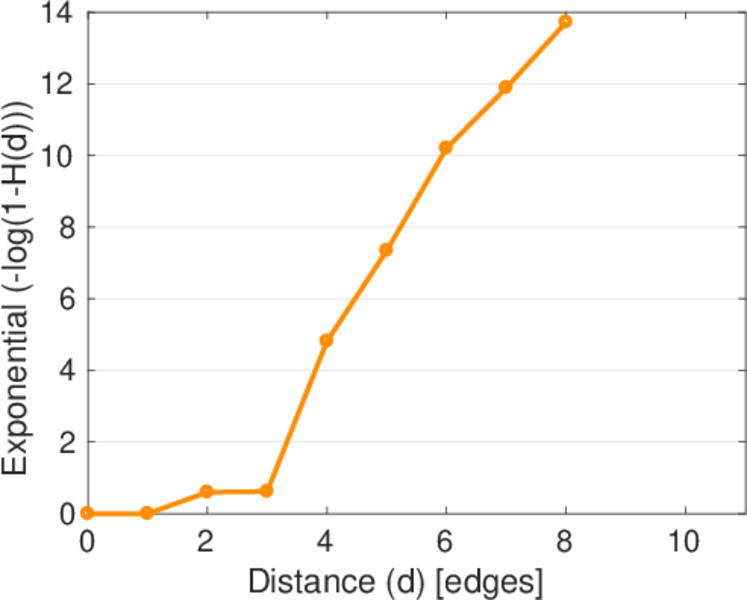
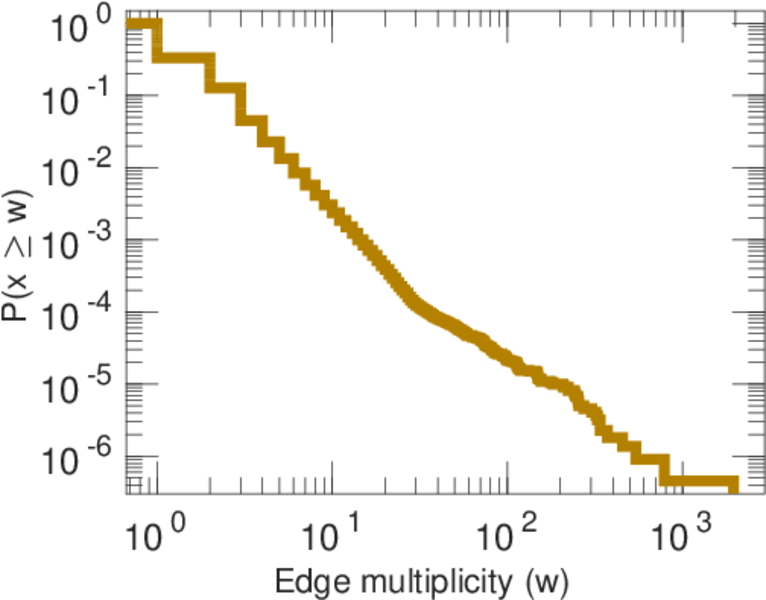
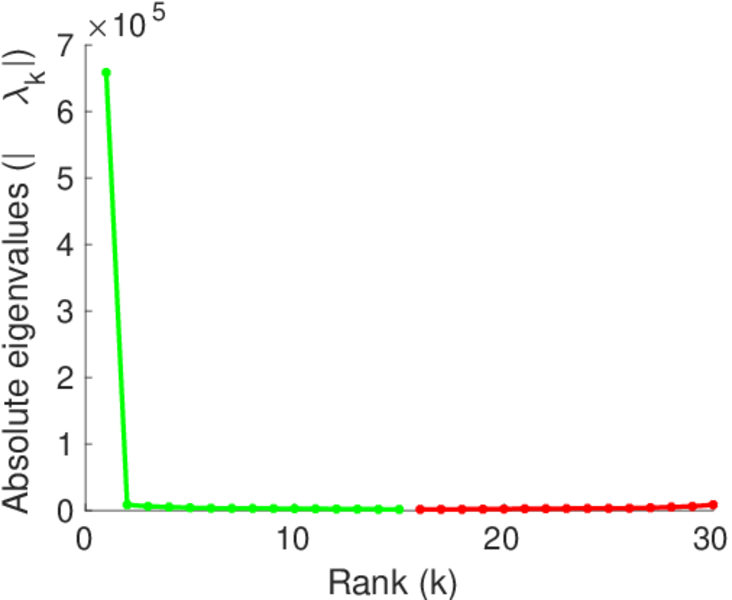
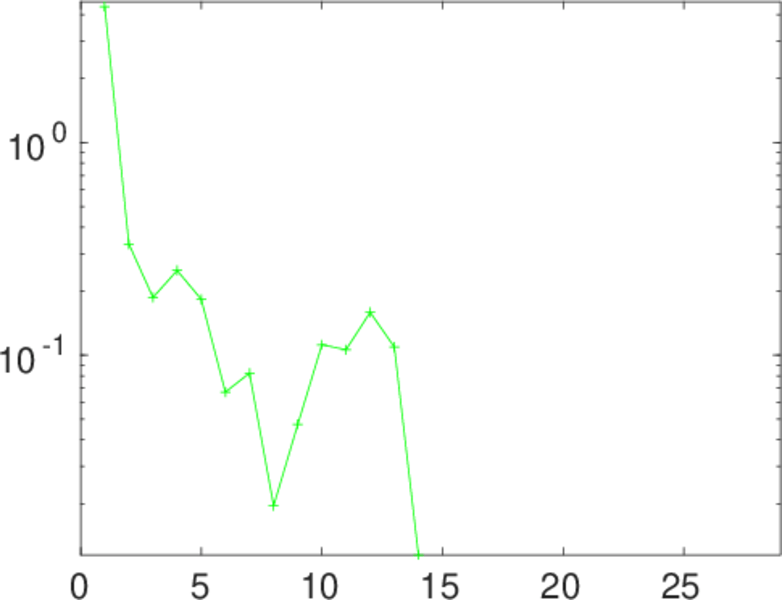
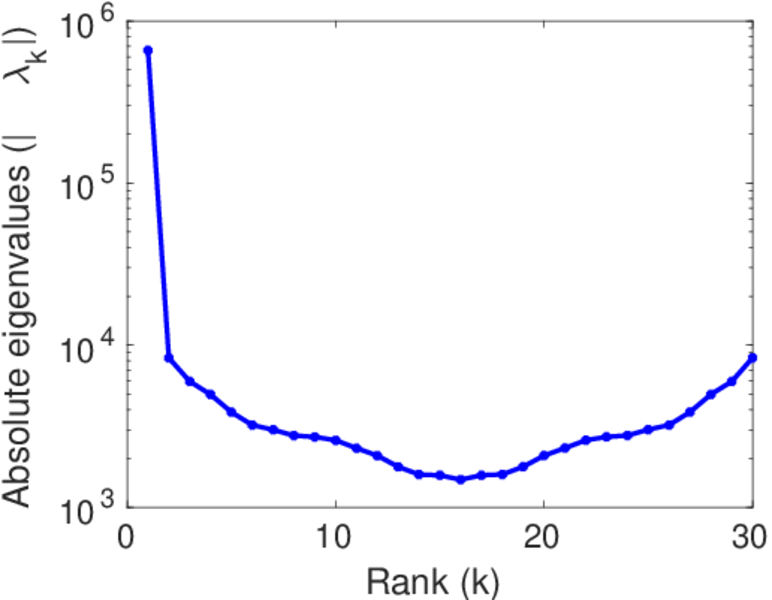
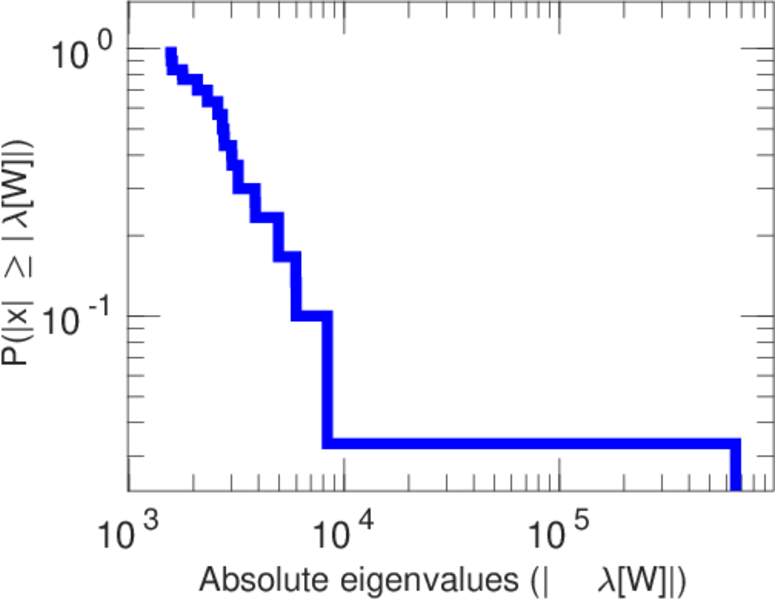
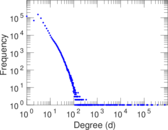
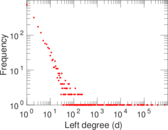
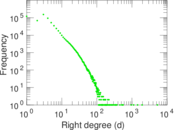
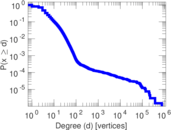
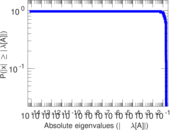
Plots


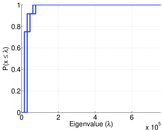


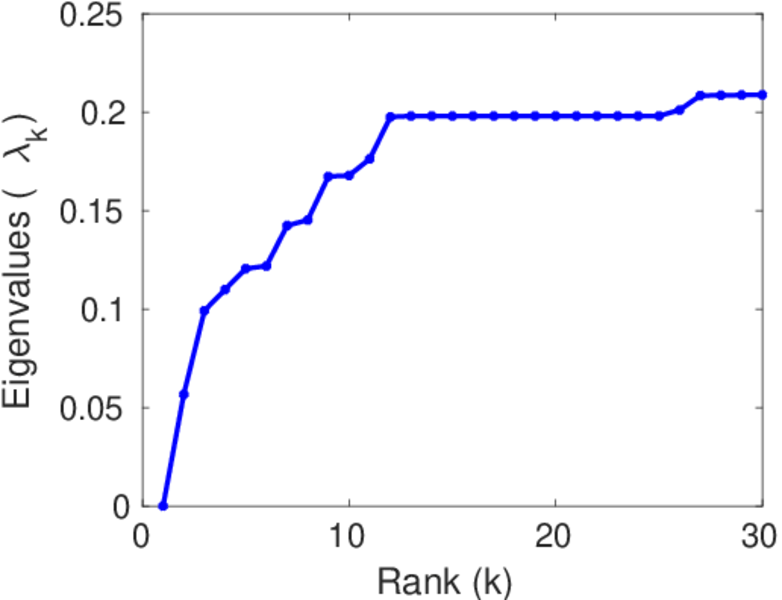
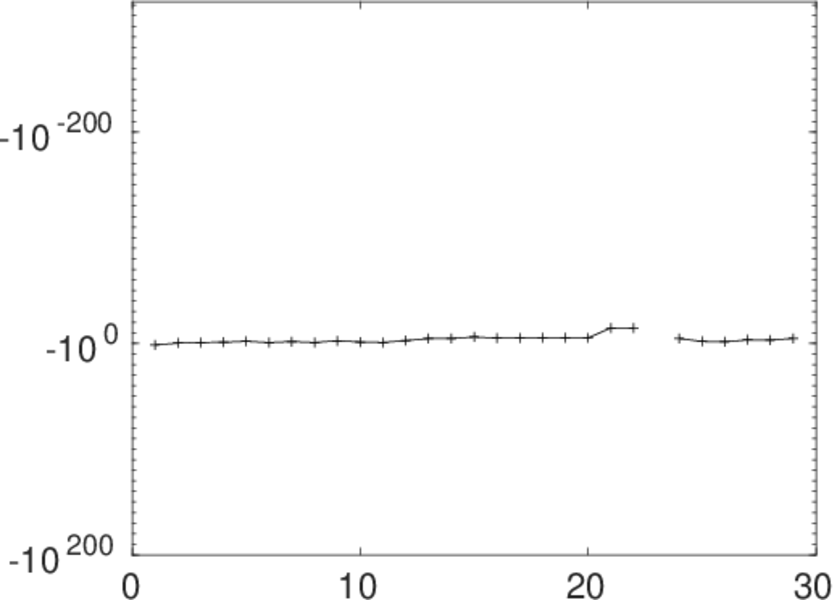
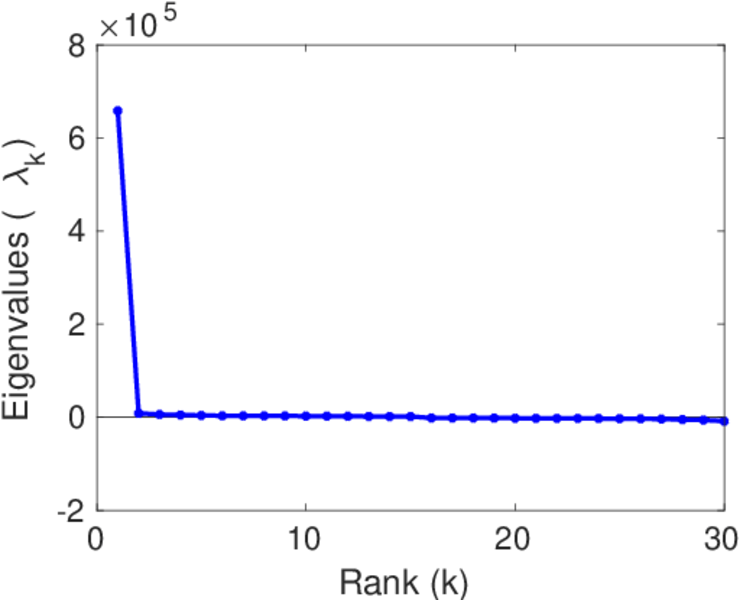
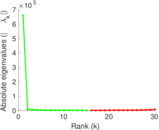
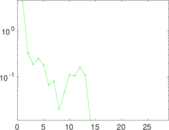
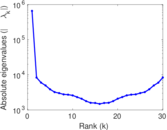
Matrix decompositions plots


Downloads
References
|
[1]
|
Jérôme Kunegis.
KONECT – The Koblenz Network Collection.
In Proc. Int. Conf. on World Wide Web Companion, pages
1343–1350, 2013.
[ http ]
|
|
[2]
|
Wikimedia Foundation.
Wikimedia downloads.
http://dumps.wikimedia.org/, January 2010.
|
 KONECT ‣ Networks ‣
Buy Me a Coffee
KONECT ‣ Networks ‣
Buy Me a Coffee