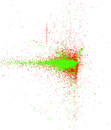
Wikipedia edits (nn)
This is the bipartite edit network of the Norwegian Nynorsk Wikipedia. It
contains users and pages from the Norwegian Nynorsk Wikipedia, connected by
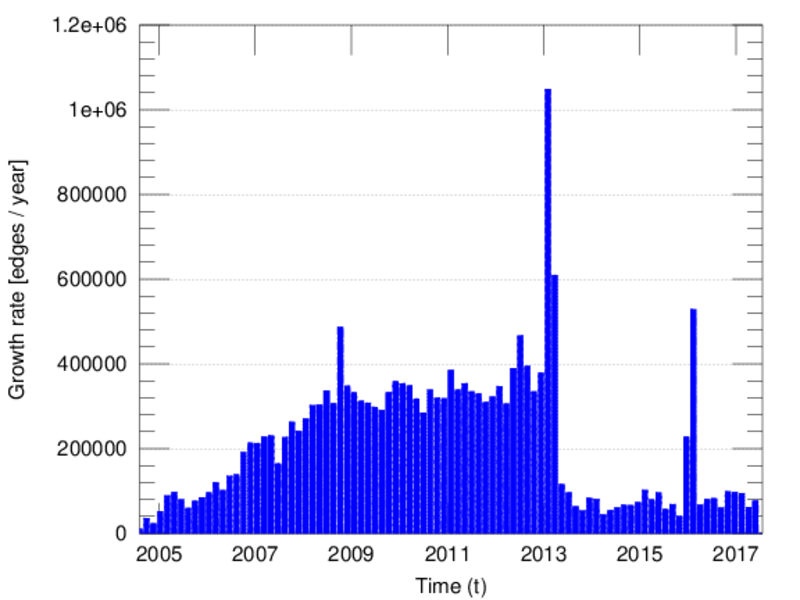
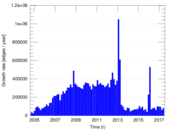
edit events. Each edge represents an edit. The dataset includes the timestamp
of each edit.
Metadata
Statistics
| Size | n = | 328,414
|
| Left size | n1 = | 10,529
|
| Right size | n2 = | 317,885
|
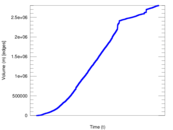
| Volume | m = | 2,803,064
|
| Unique edge count | m̿ = | 1,612,792
|
| Wedge count | s = | 32,600,290,661
|
| Claw count | z = | 898,534,934,741,636
|
| Square count | q = | 45,823,346,622
|
| 4-Tour count | T4 = | 496,994,079,552
|
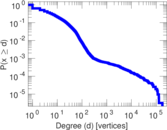
| Maximum degree | dmax = | 177,546
|
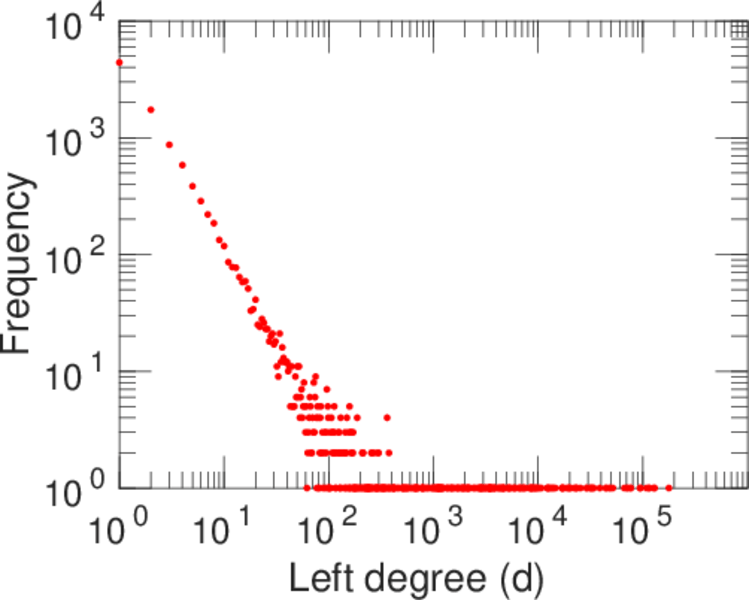
| Maximum left degree | d1max = | 177,546
|
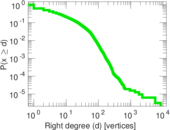
| Maximum right degree | d2max = | 8,511
|
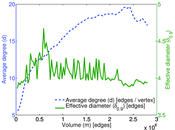
| Average degree | d = | 17.070 3
|
| Average left degree | d1 = | 266.223
|
| Average right degree | d2 = | 8.817 86
|
| Fill | p = | 0.000 481 860
|
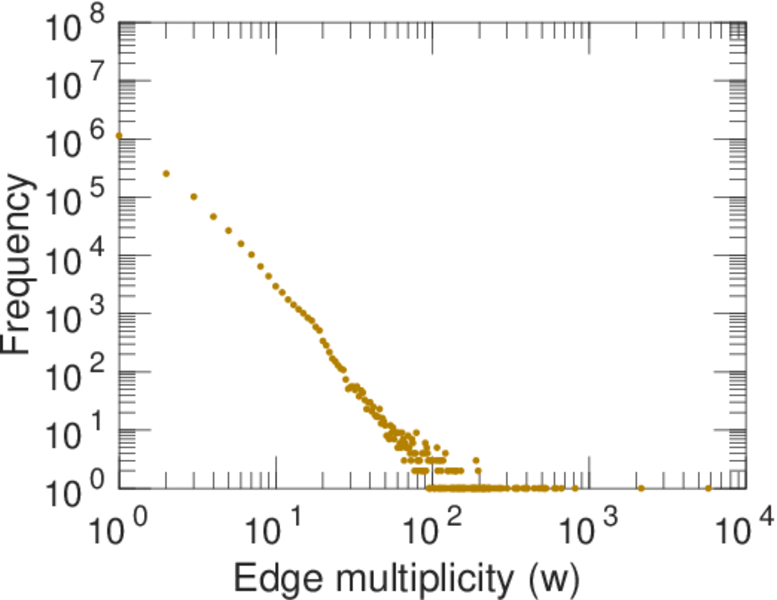
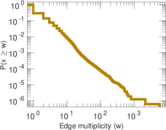
| Average edge multiplicity | m̃ = | 1.738 02
|
| Size of LCC | N = | 325,559
|
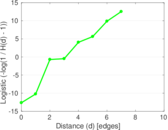
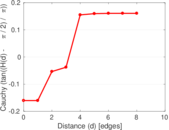
| Diameter | δ = | 11
|
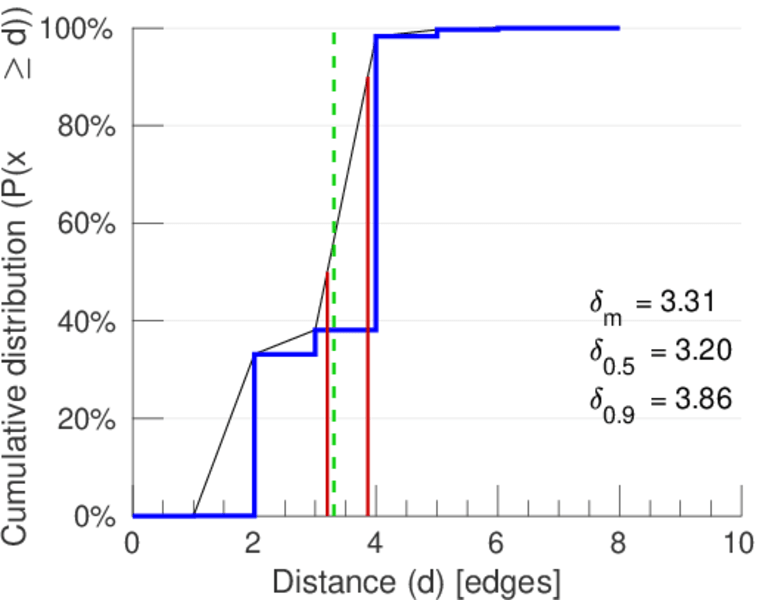
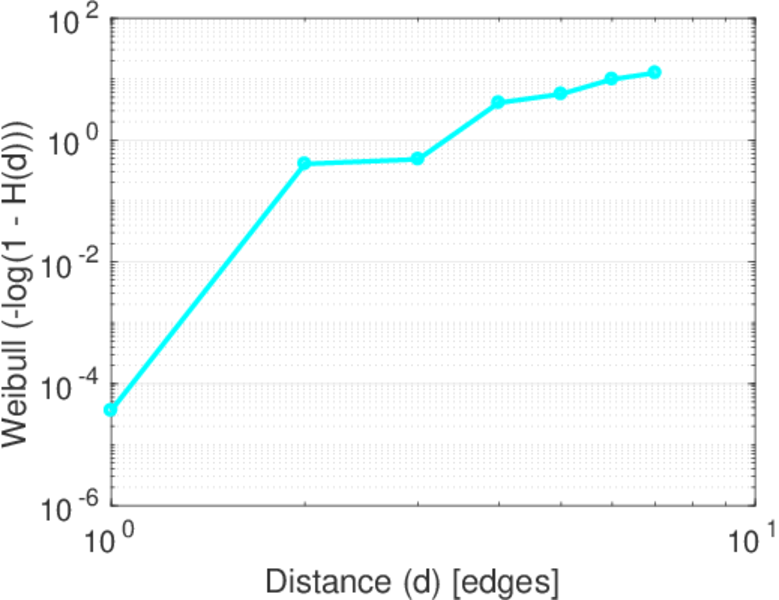
| 50-Percentile effective diameter | δ0.5 = | 3.197 48
|
| 90-Percentile effective diameter | δ0.9 = | 3.862 51
|
| Median distance | δM = | 4
|
| Mean distance | δm = | 3.308 17
|
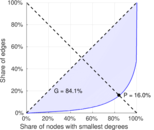
| Gini coefficient | G = | 0.843 385
|
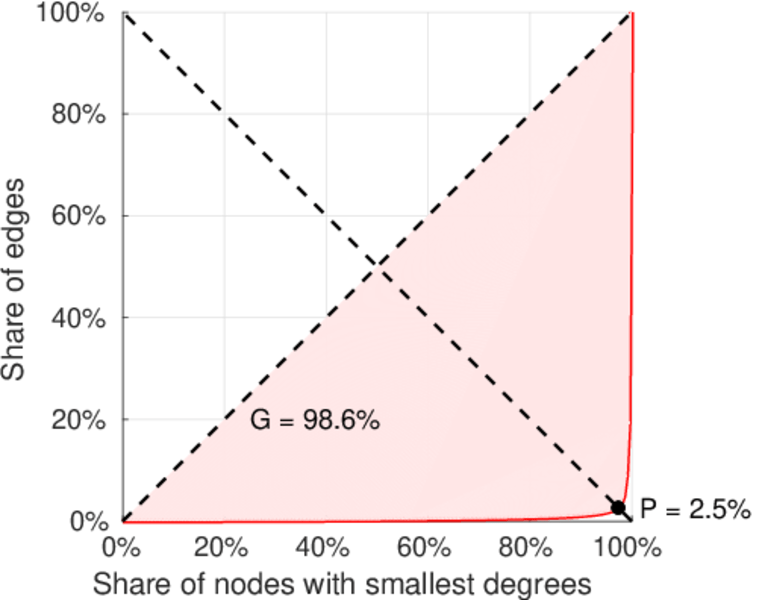
| Balanced inequality ratio | P = | 0.158 159
|
| Left balanced inequality ratio | P1 = | 0.024 896 7
|
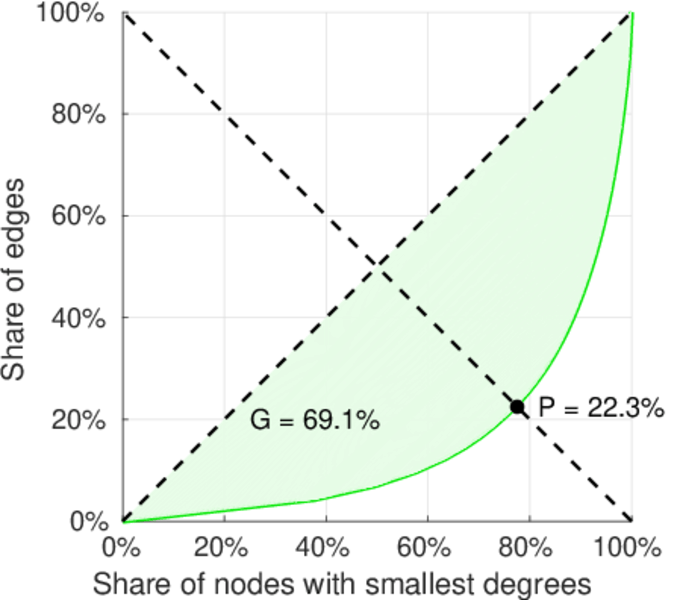
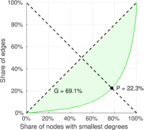
| Right balanced inequality ratio | P2 = | 0.223 223
|
| Relative edge distribution entropy | Her = | 0.705 598
|
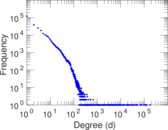
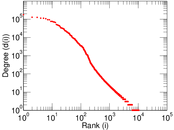
| Power law exponent | γ = | 2.041 15
|
| Tail power law exponent | γt = | 3.371 00
|
| Tail power law exponent with p | γ3 = | 3.371 00
|
| p-value | p = | 0.000 00
|
| Left tail power law exponent with p | γ3,1 = | 1.771 00
|
| Left p-value | p1 = | 0.000 00
|
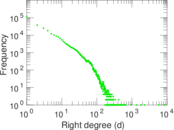
| Right tail power law exponent with p | γ3,2 = | 6.701 00
|
| Right p-value | p2 = | 0.044 000 0
|
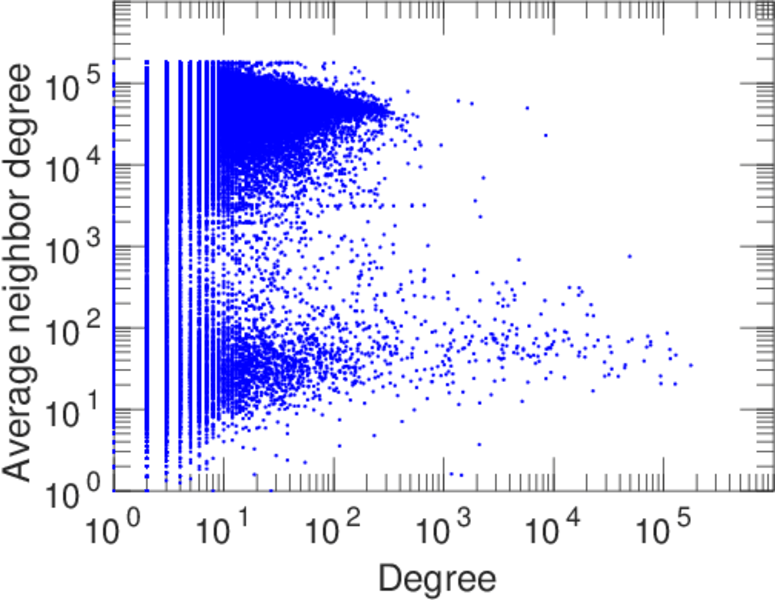
| Degree assortativity | ρ = | −0.289 464
|
| Degree assortativity p-value | pρ = | 0.000 00
|
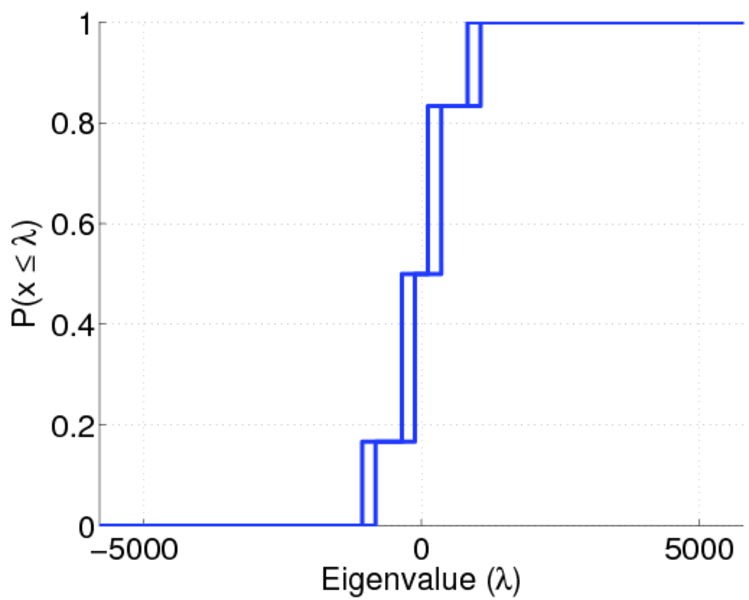
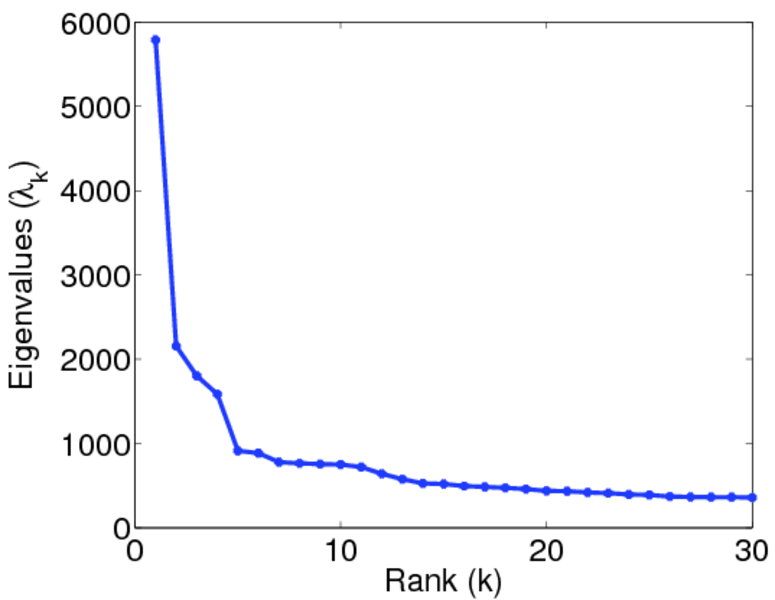
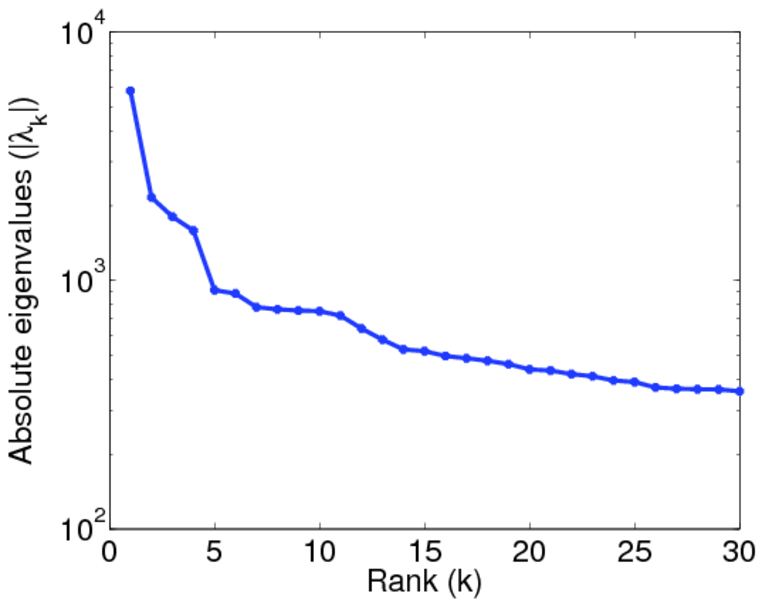
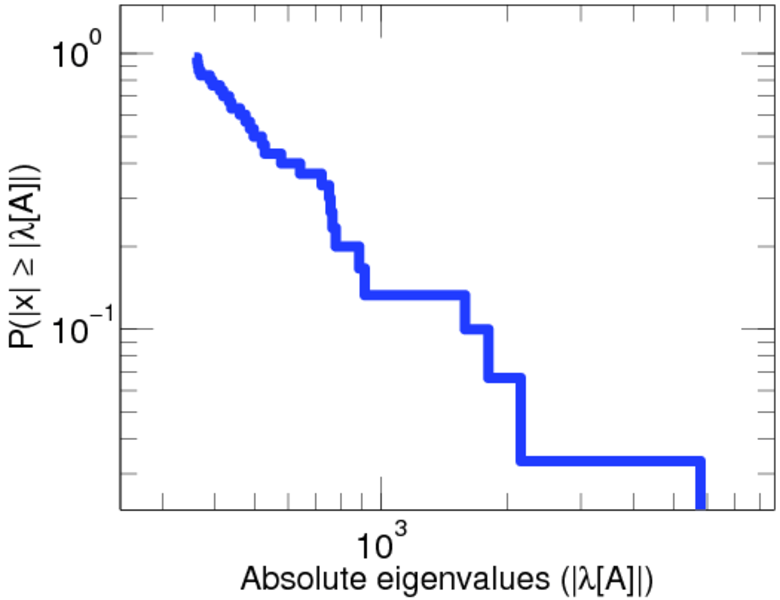
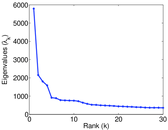
| Spectral norm | α = | 5,790.13
|
| Algebraic connectivity | a = | 0.100 164
|
| Spectral separation | |λ1[A] / λ2[A]| = | 2.685 51
|
| Controllability | C = | 307,189
|
| Relative controllability | Cr = | 0.939 767
|
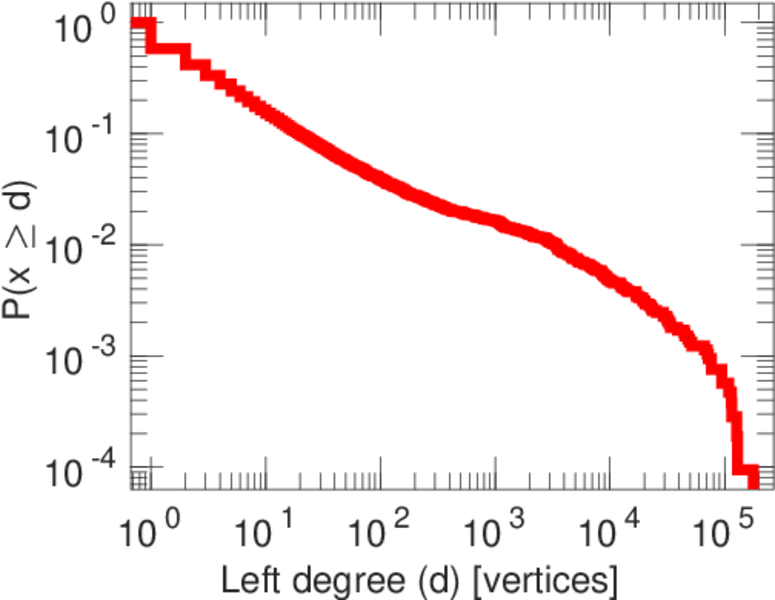
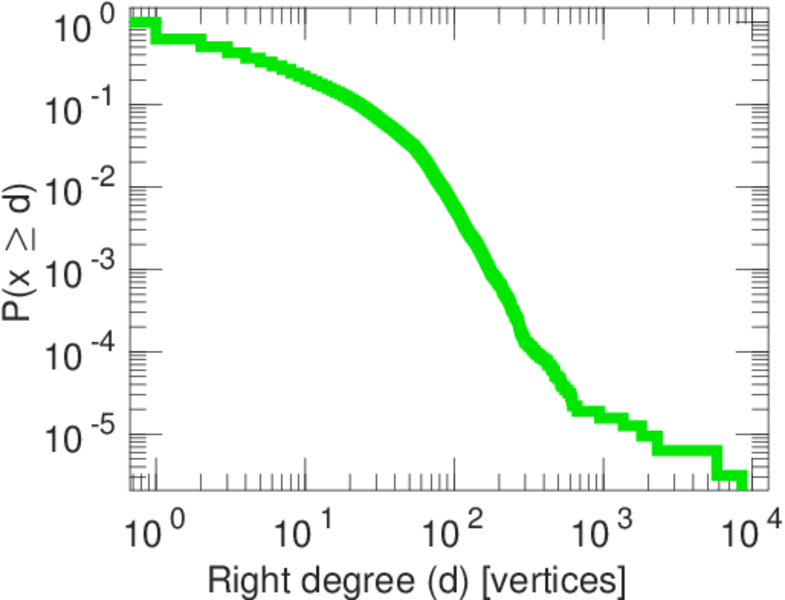
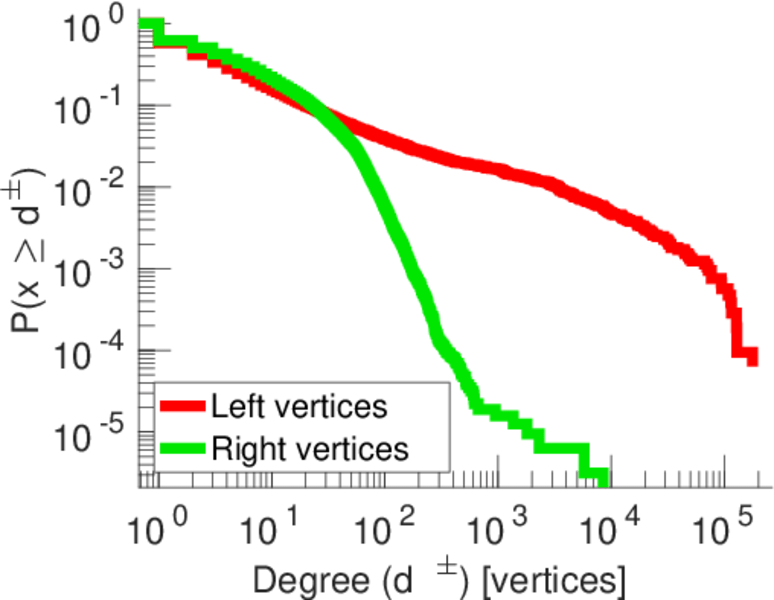
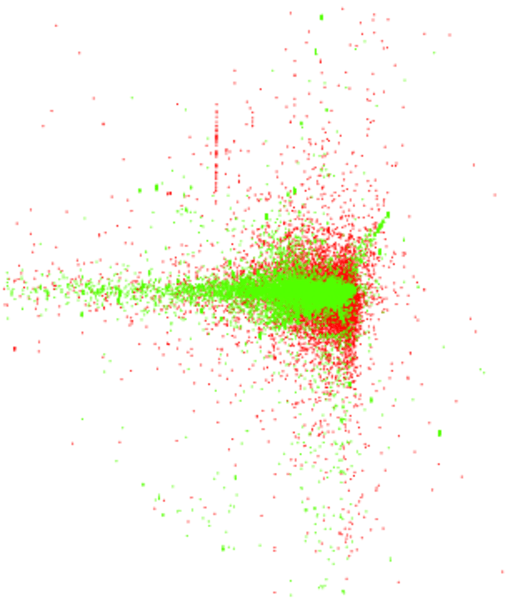
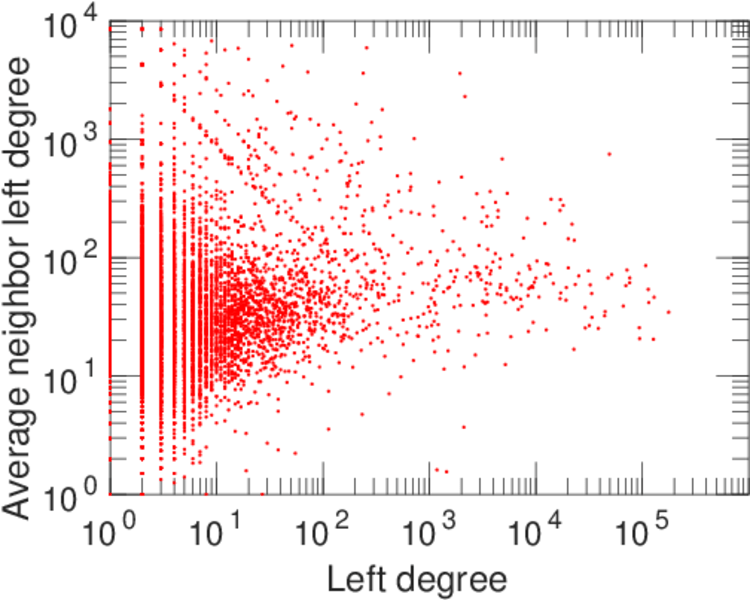
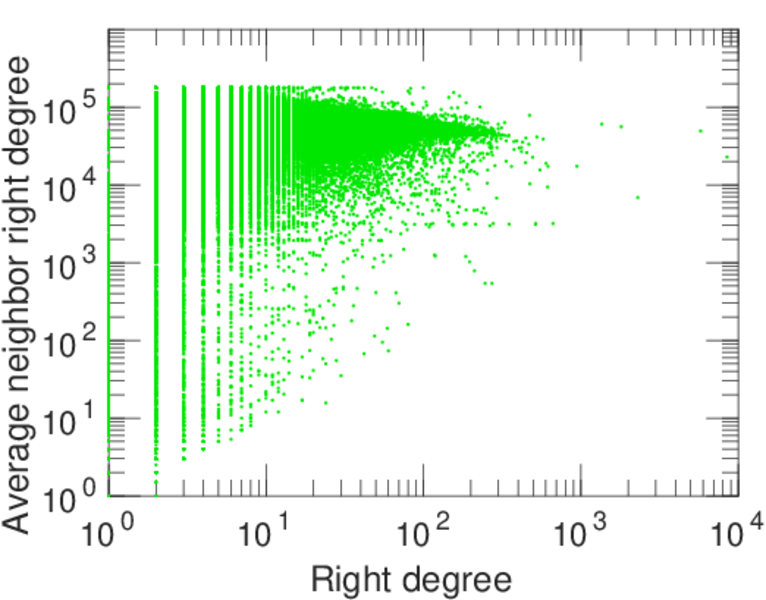
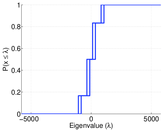
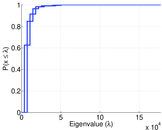
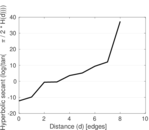
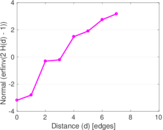
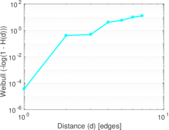
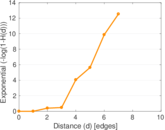
Plots


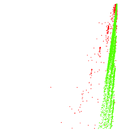
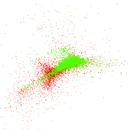


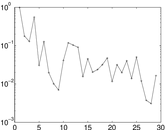
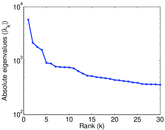
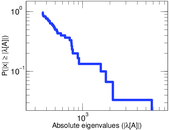
Matrix decompositions plots
Downloads
References
|
[1]
|
Jérôme Kunegis.
KONECT – The Koblenz Network Collection.
In Proc. Int. Conf. on World Wide Web Companion, pages
1343–1350, 2013.
[ http ]
|
|
[2]
|
Wikimedia Foundation.
Wikimedia downloads.
http://dumps.wikimedia.org/, January 2010.
|
 KONECT ‣ Networks ‣
Buy Me a Coffee
KONECT ‣ Networks ‣
Buy Me a Coffee