Wikiquote edits (nn)
This is the bipartite edit network of the Norwegian Nynorsk Wikiquote. It
contains users and pages from the Norwegian Nynorsk Wikiquote, connected by
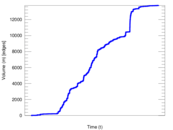
edit events. Each edge represents an edit. The dataset includes the timestamp
of each edit.
Metadata
Statistics
| Size | n = | 4,232
|
| Left size | n1 = | 210
|
| Right size | n2 = | 4,022
|
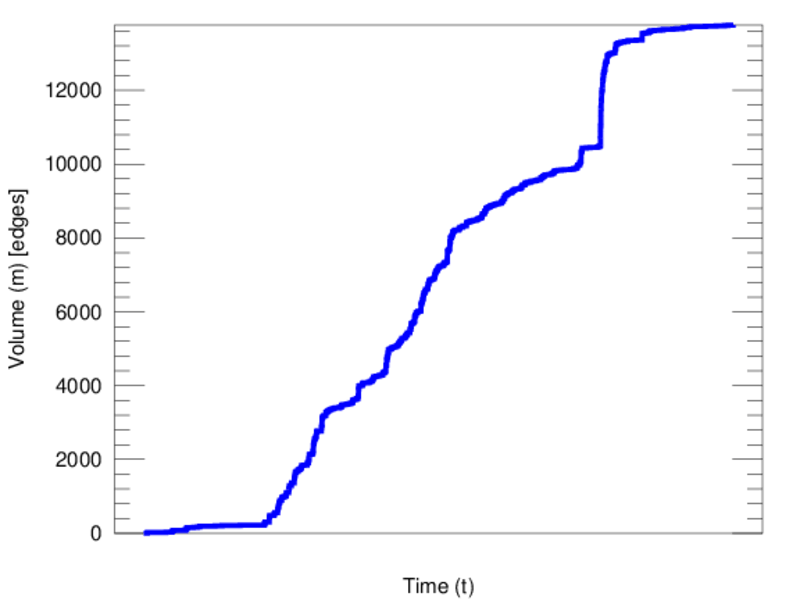
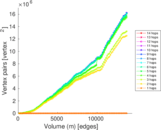
| Volume | m = | 13,767
|
| Unique edge count | m̿ = | 6,048
|
| Wedge count | s = | 6,404,652
|
| Claw count | z = | 7,337,992,757
|
| Cross count | x = | 6,459,657,987,322
|
| Square count | q = | 198,272
|
| 4-Tour count | T4 = | 27,218,132
|
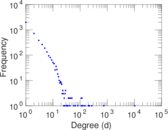
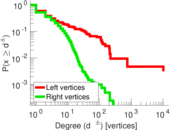
| Maximum degree | dmax = | 10,275
|
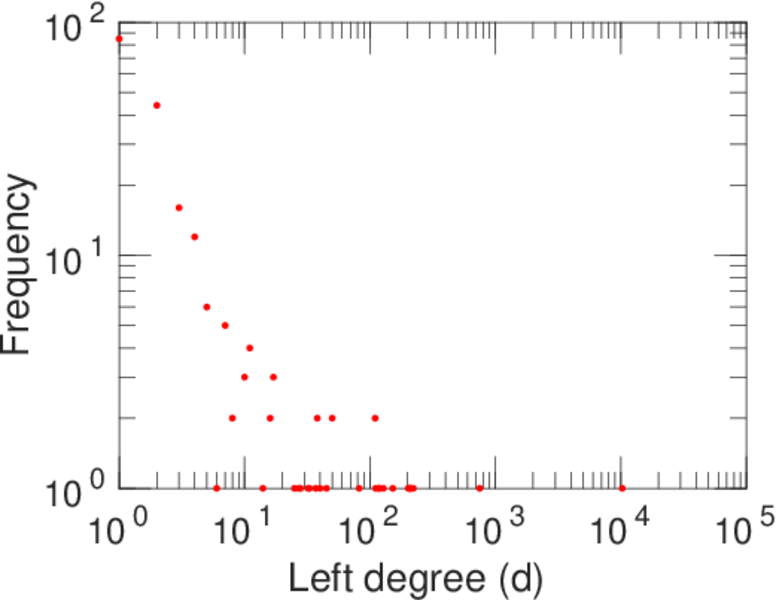
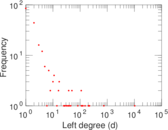
| Maximum left degree | d1max = | 10,275
|
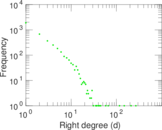
| Maximum right degree | d2max = | 269
|
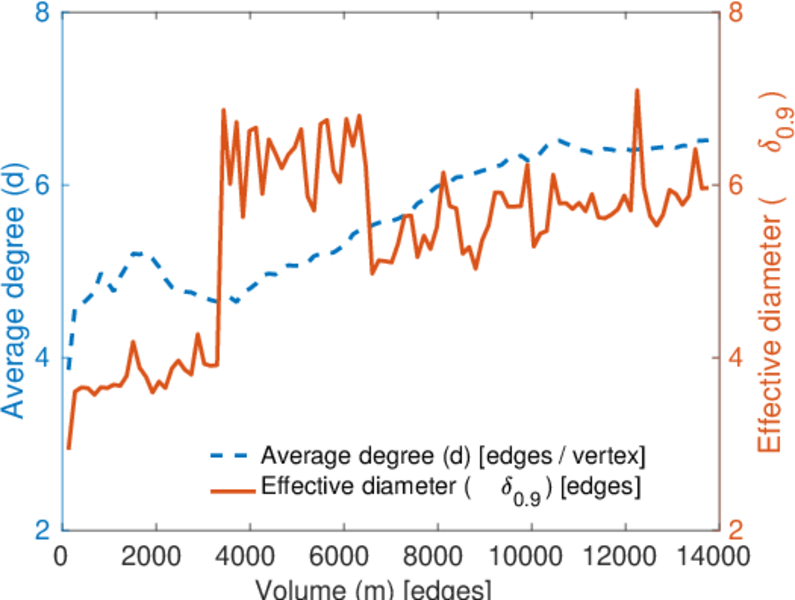
| Average degree | d = | 6.506 14
|
| Average left degree | d1 = | 65.557 1
|
| Average right degree | d2 = | 3.422 92
|
| Fill | p = | 0.007 160 62
|
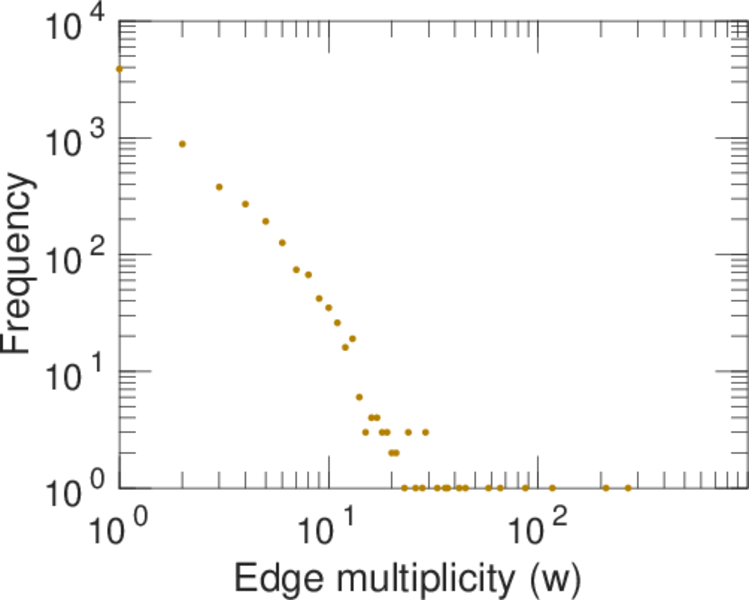
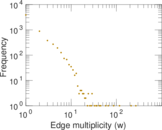
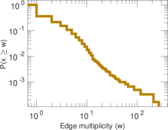
| Average edge multiplicity | m̃ = | 2.276 29
|
| Size of LCC | N = | 4,027
|
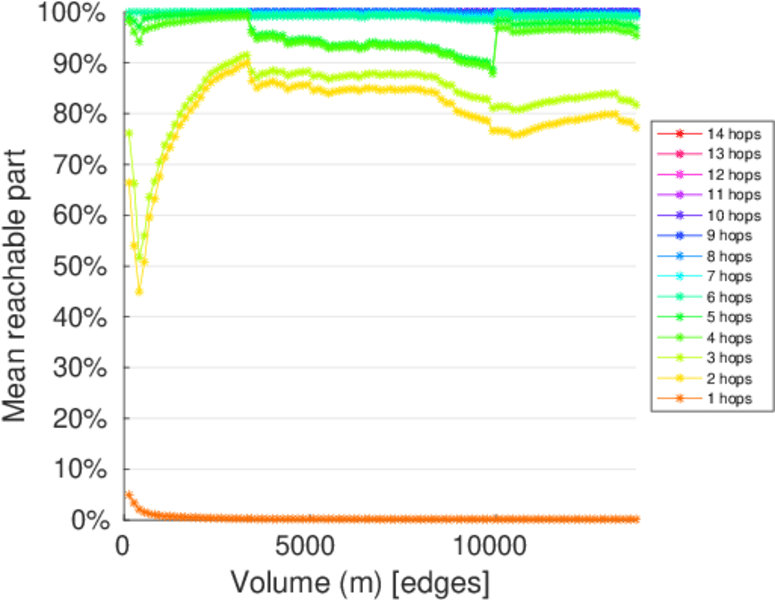
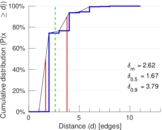
| Diameter | δ = | 14
|
| 50-Percentile effective diameter | δ0.5 = | 1.671 38
|
| 90-Percentile effective diameter | δ0.9 = | 3.785 01
|
| Median distance | δM = | 2
|
| Mean distance | δm = | 2.617 75
|
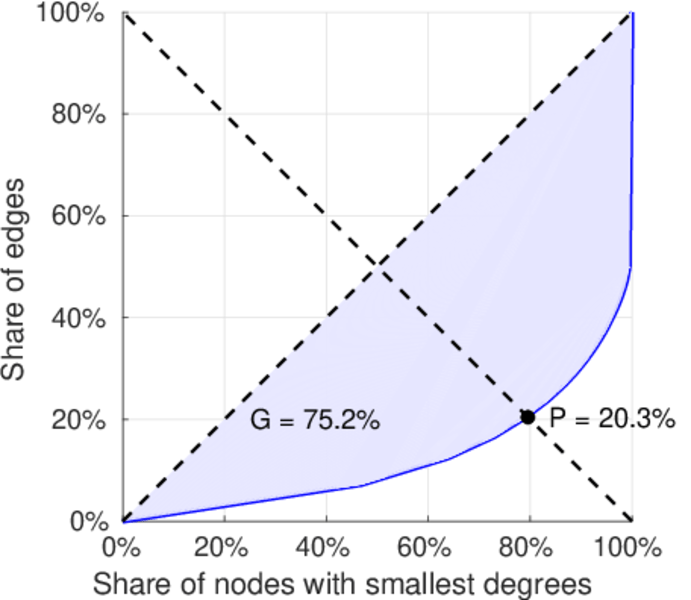
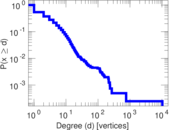
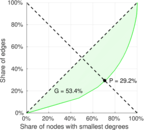
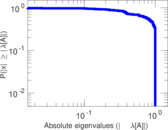
| Gini coefficient | G = | 0.758 139
|
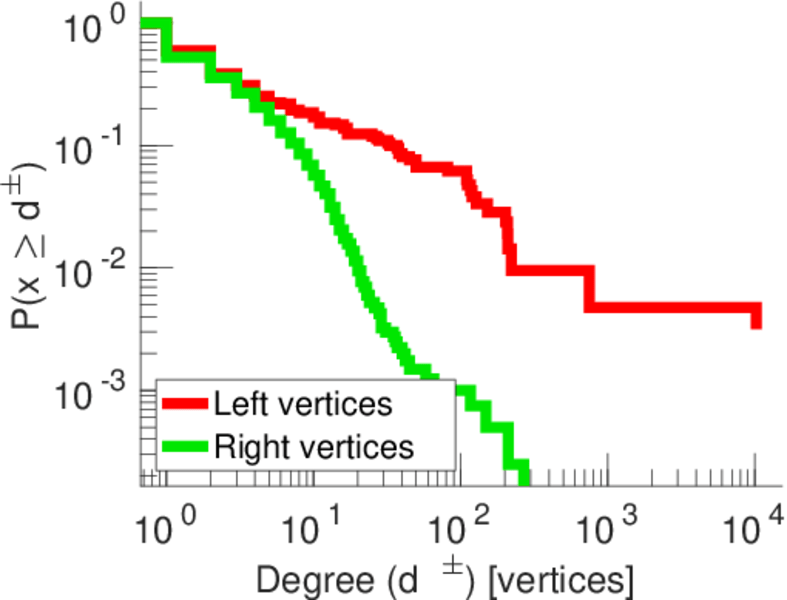
| Balanced inequality ratio | P = | 0.202 186
|
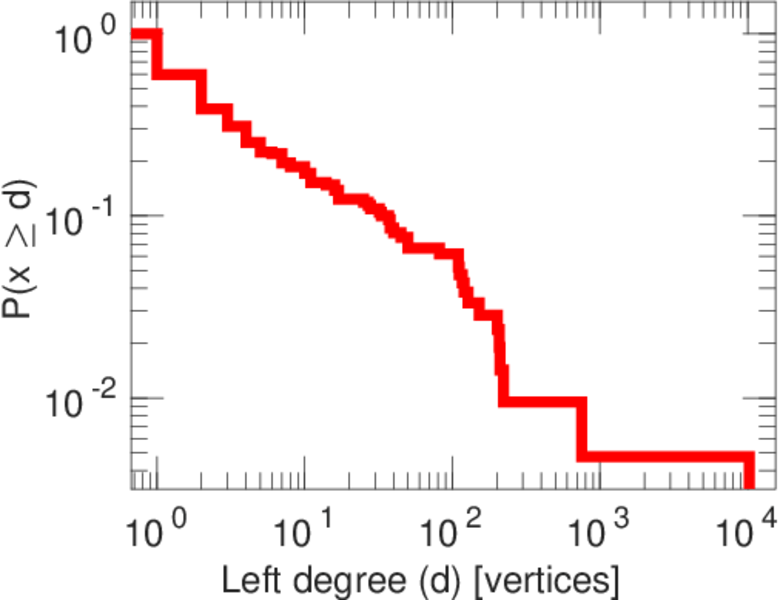
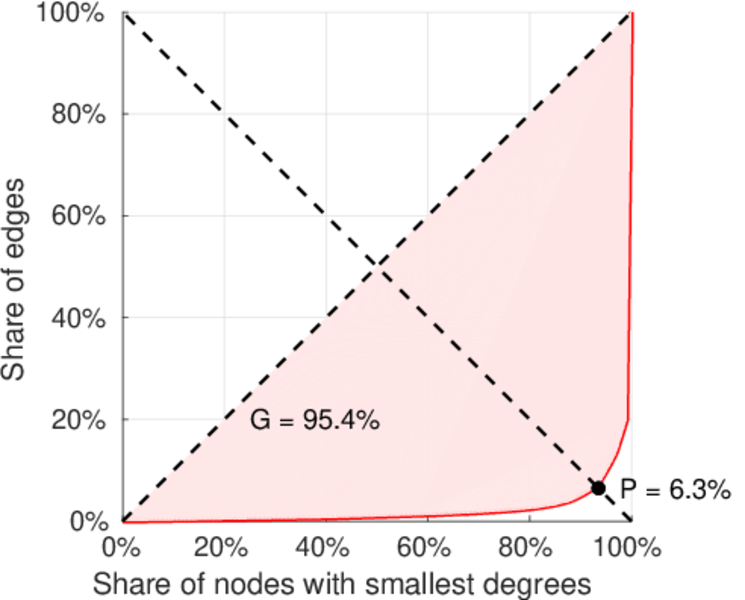
| Left balanced inequality ratio | P1 = | 0.063 194 6
|
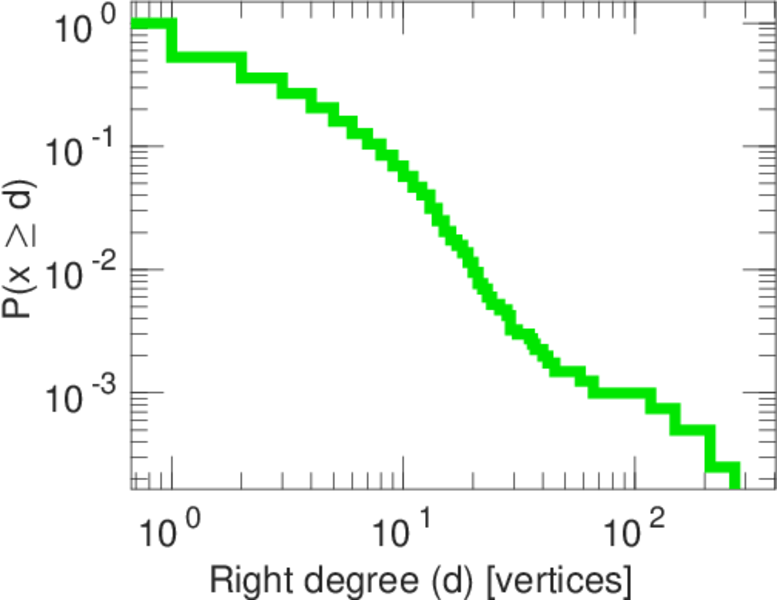
| Right balanced inequality ratio | P2 = | 0.292 075
|
| Relative edge distribution entropy | Her = | 0.696 269
|
| Power law exponent | γ = | 4.771 77
|
| Tail power law exponent | γt = | 2.571 00
|
| Tail power law exponent with p | γ3 = | 2.571 00
|
| p-value | p = | 0.000 00
|
| Left tail power law exponent with p | γ3,1 = | 1.691 00
|
| Left p-value | p1 = | 0.484 000
|
| Right tail power law exponent with p | γ3,2 = | 2.701 00
|
| Right p-value | p2 = | 0.000 00
|
| Degree assortativity | ρ = | −0.550 035
|
| Degree assortativity p-value | pρ = | 0.000 00
|
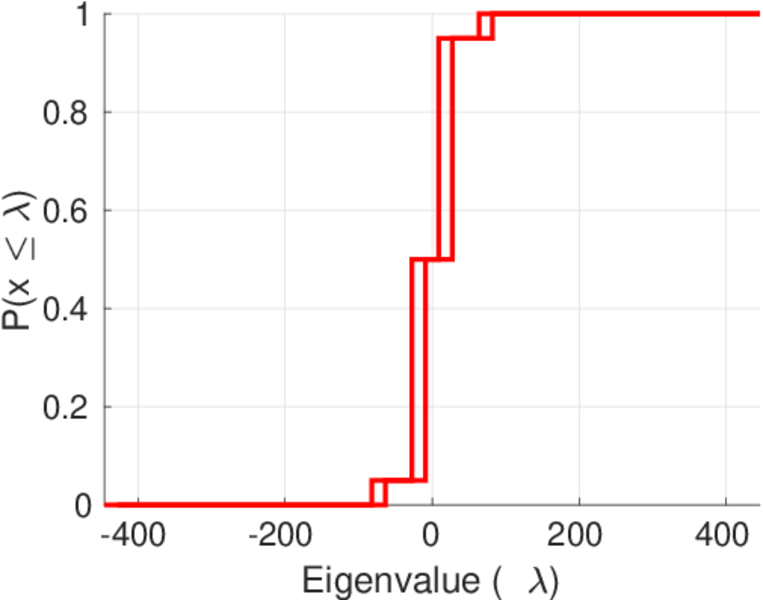
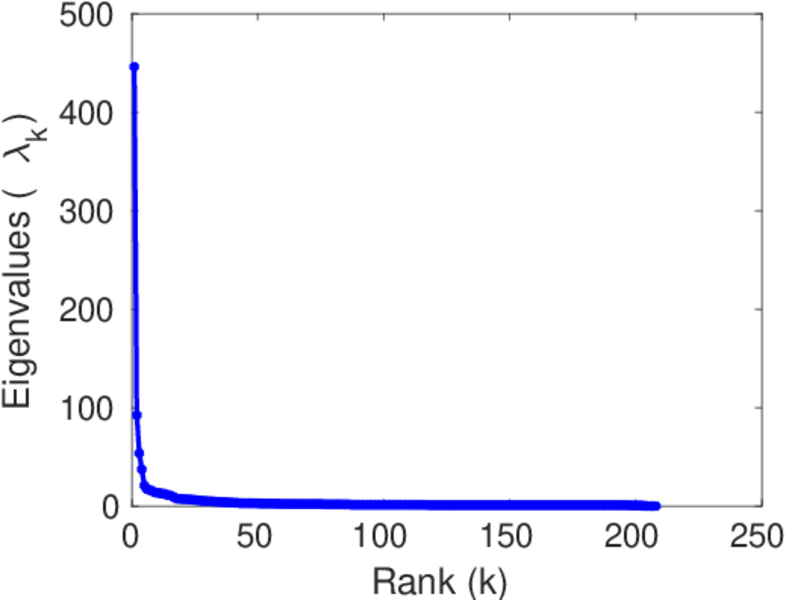
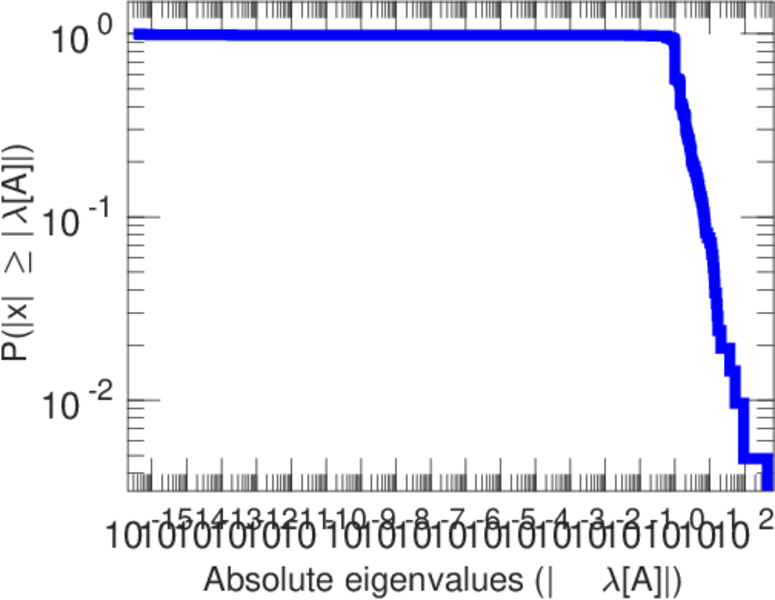
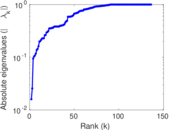
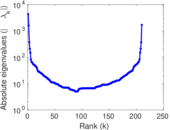
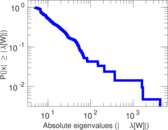
| Spectral norm | α = | 446.013
|
| Algebraic connectivity | a = | 0.015 923 0
|
| Spectral separation | |λ1[A] / λ2[A]| = | 4.827 04
|
| Controllability | C = | 3,817
|
| Relative controllability | Cr = | 0.903 432
|
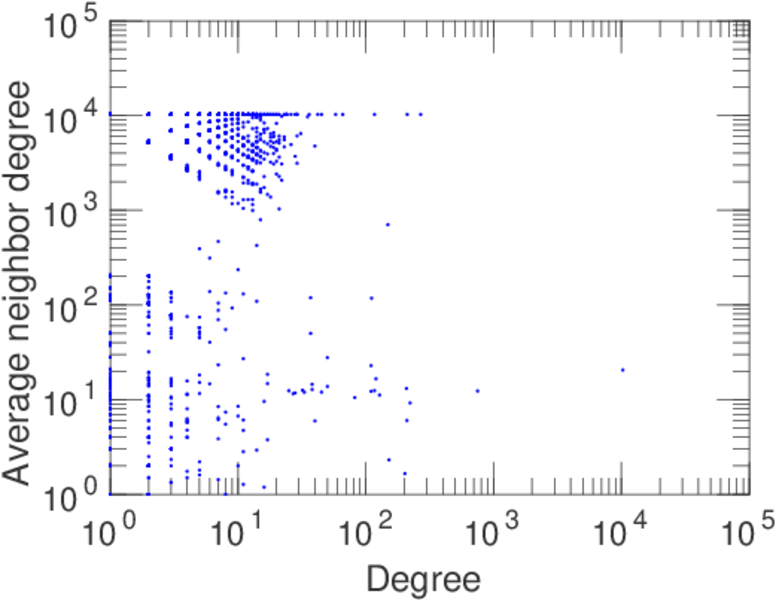
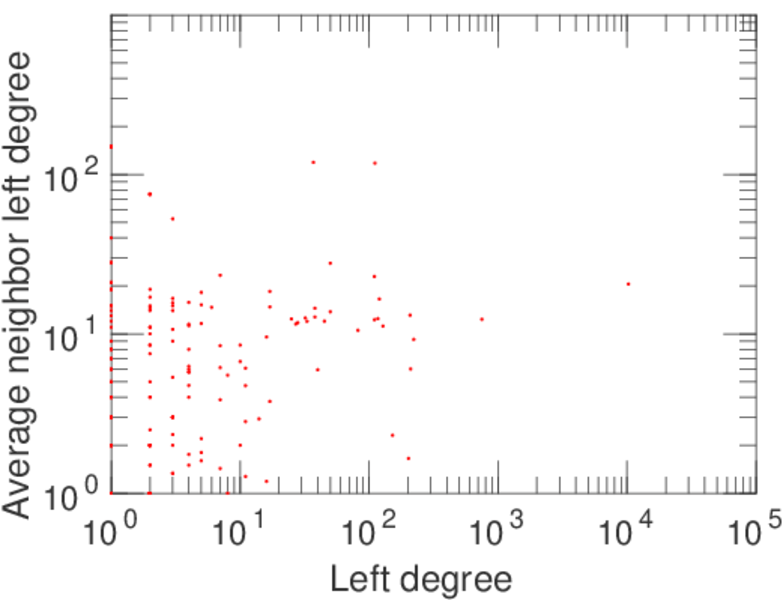
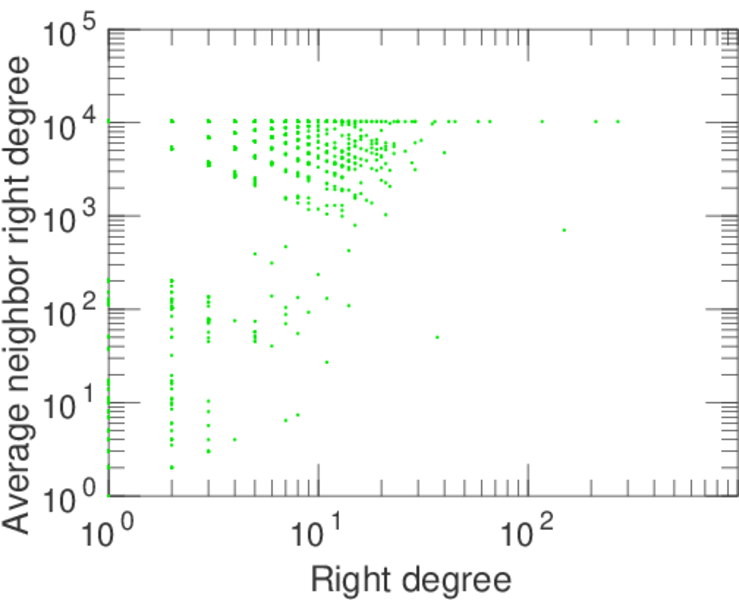
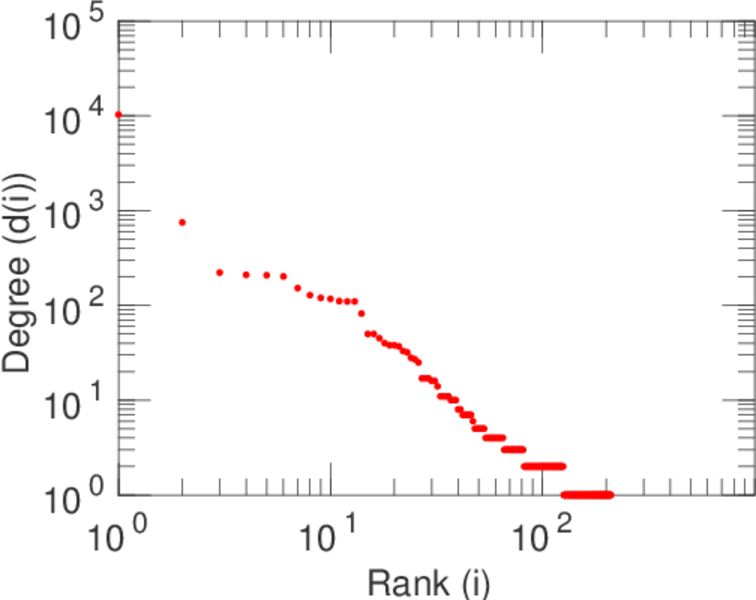
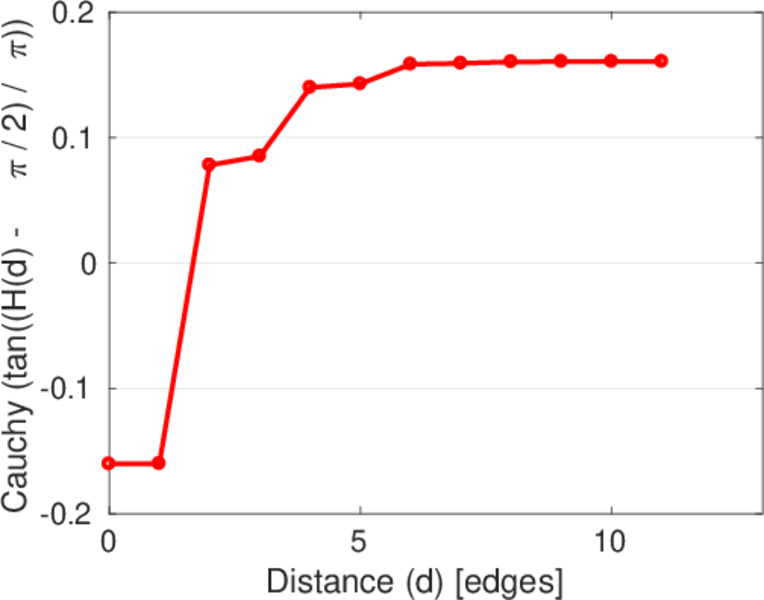
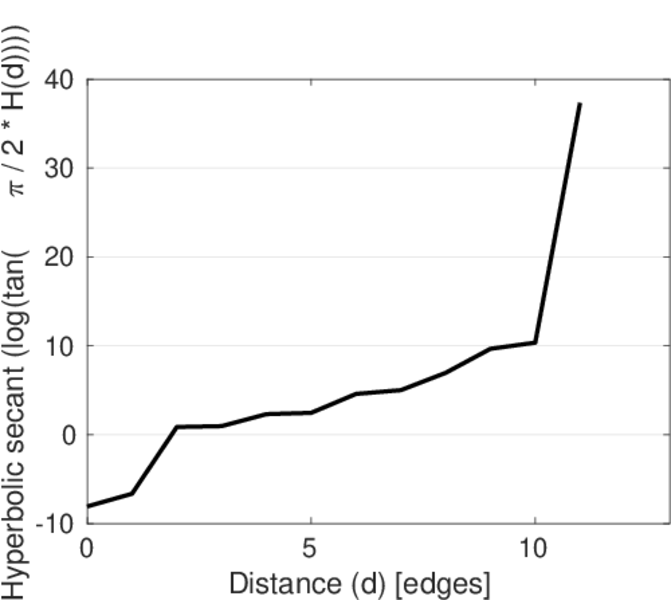
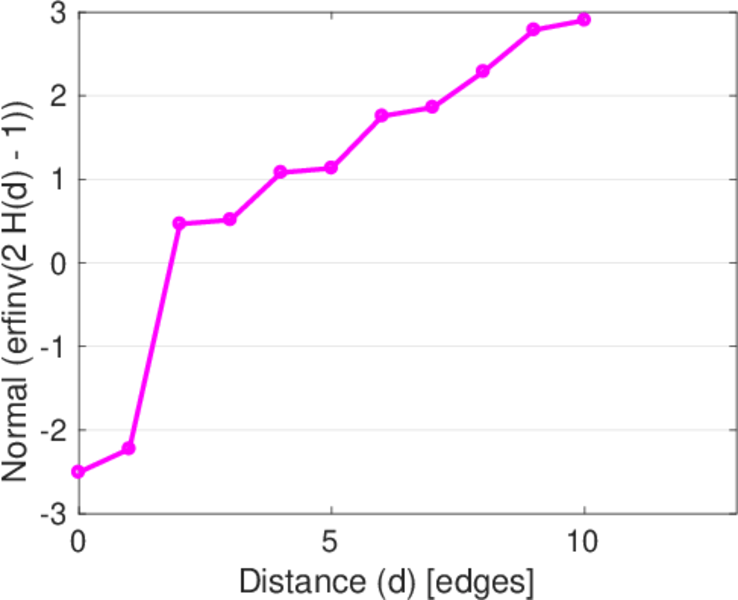
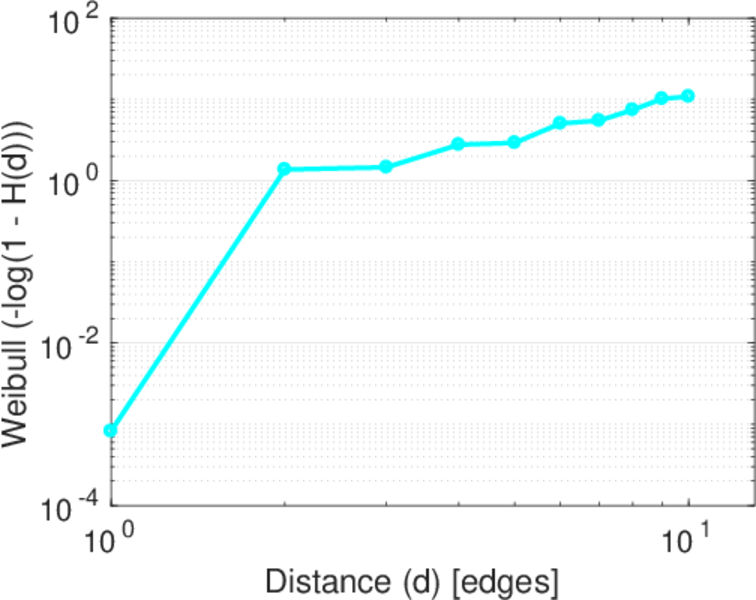
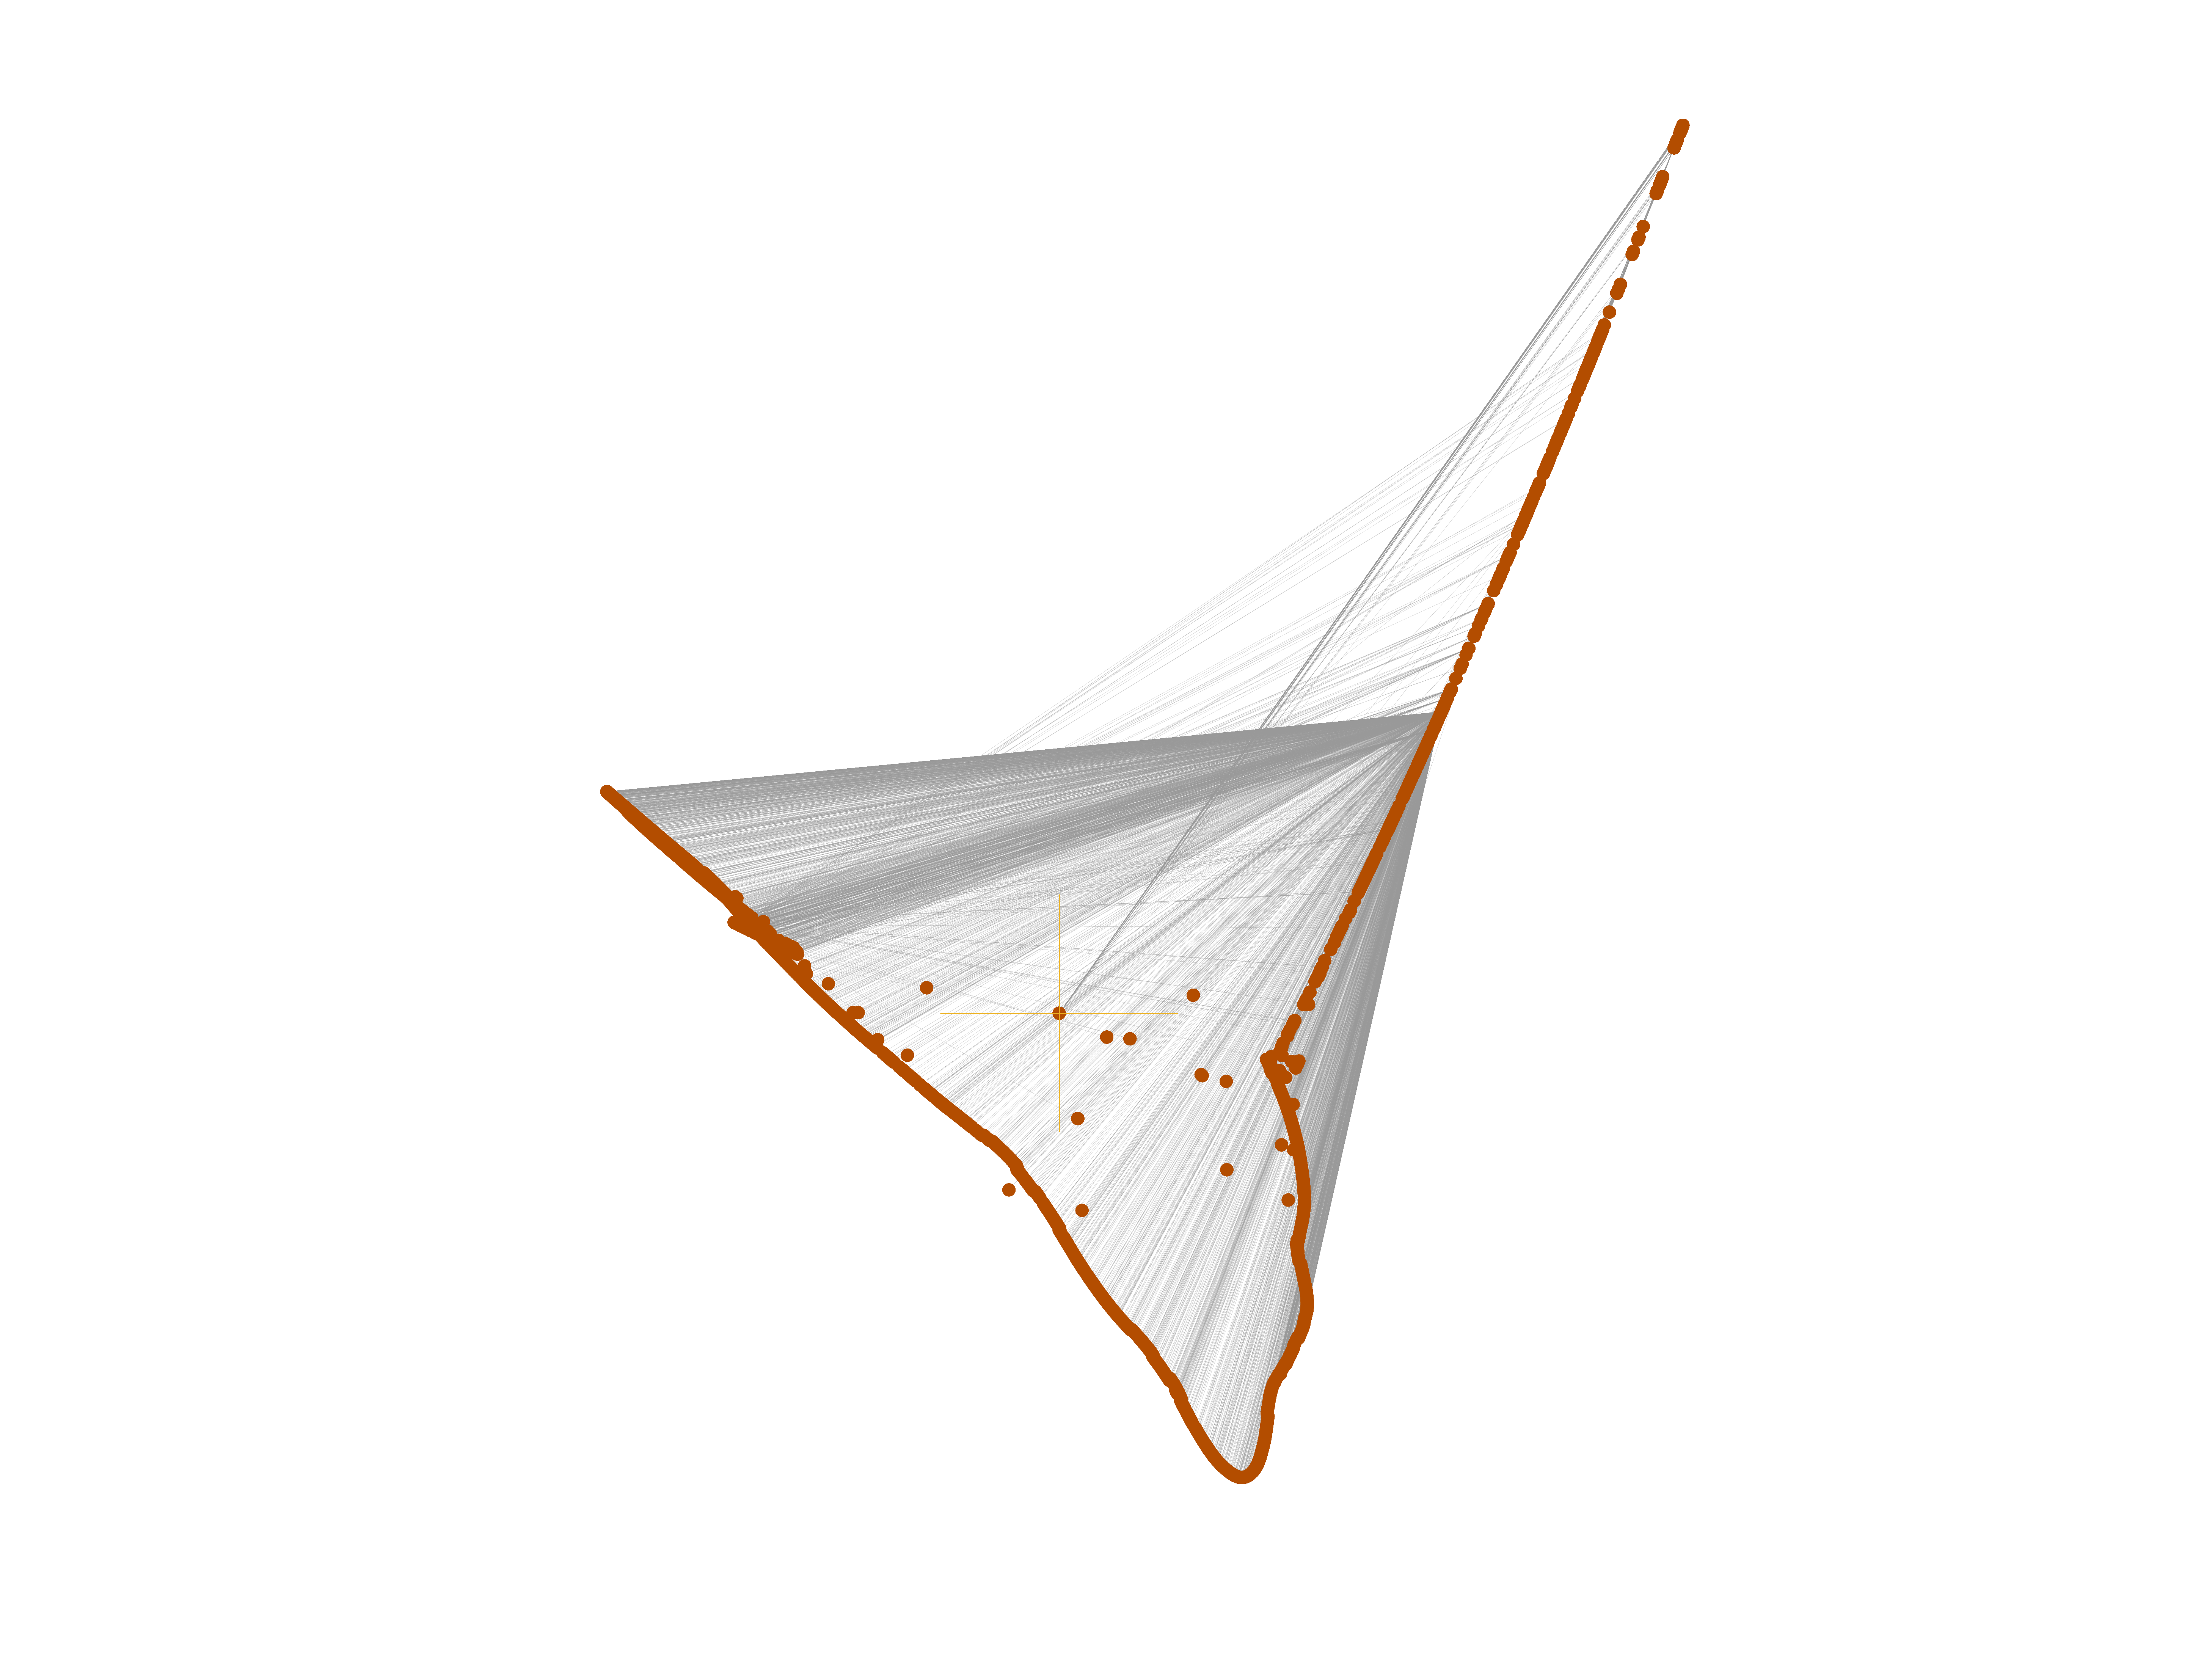
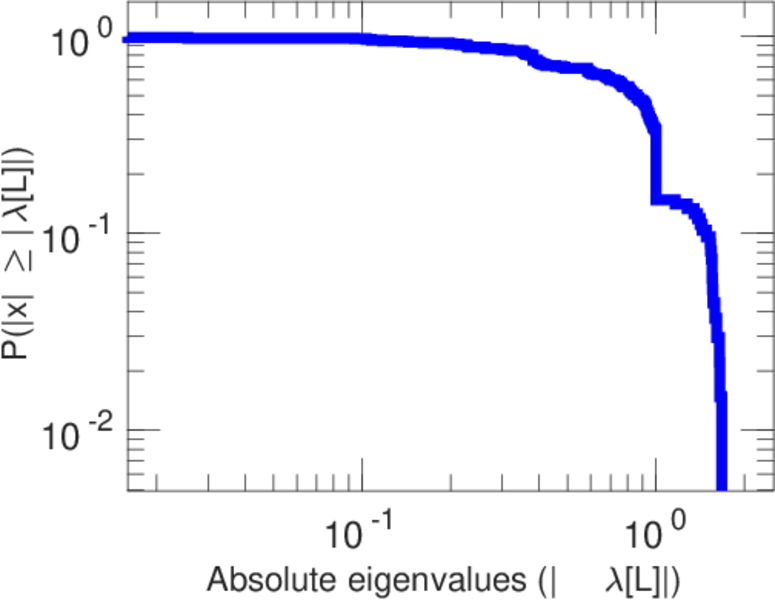
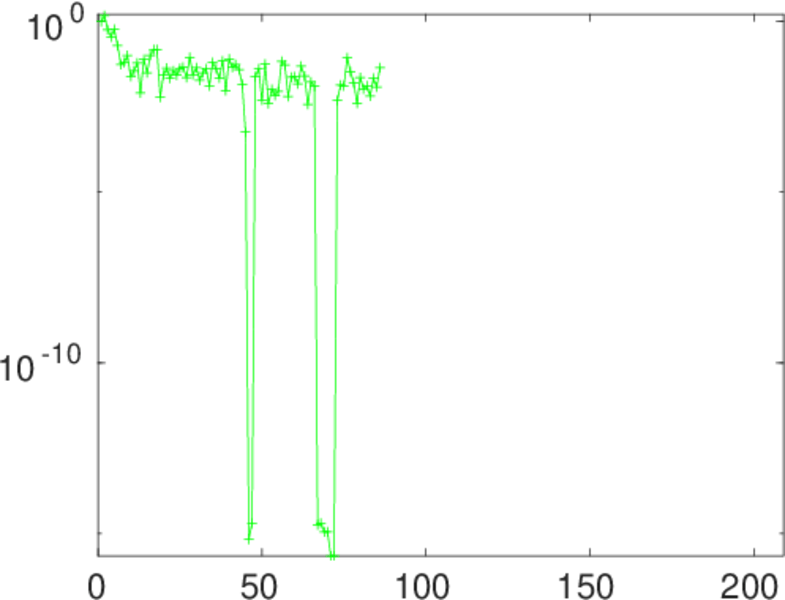
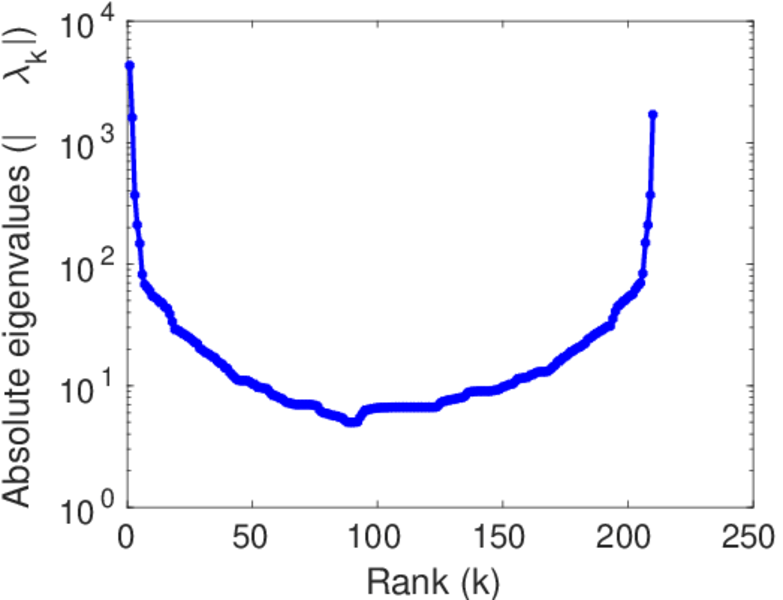
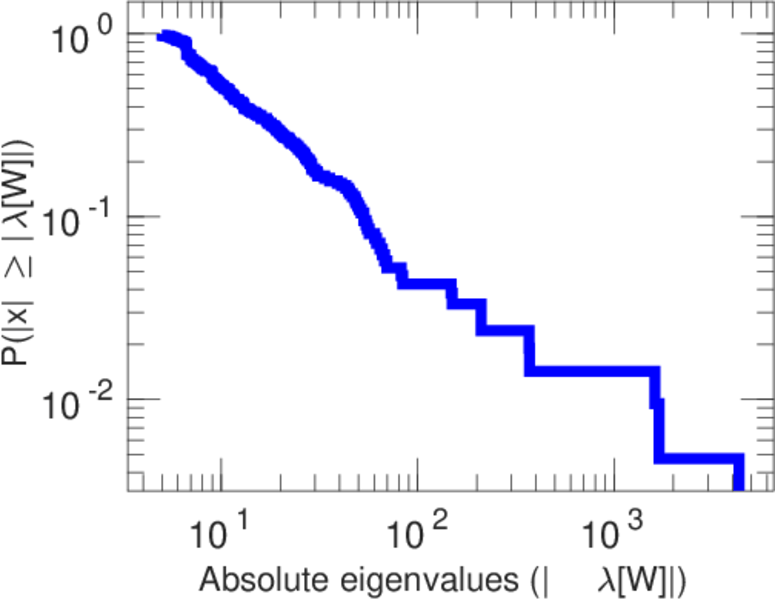
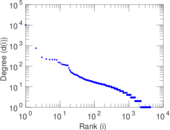
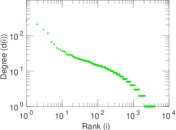
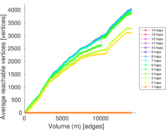
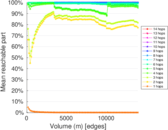
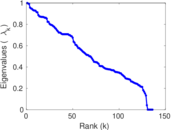
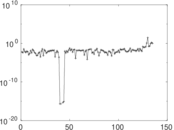
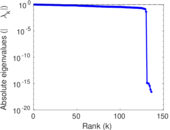
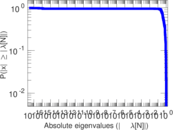
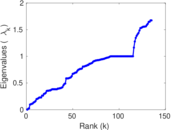
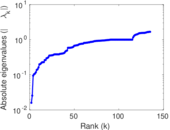
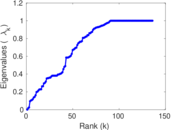
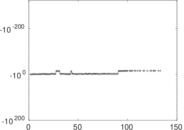
Plots


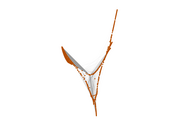
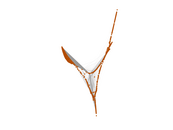


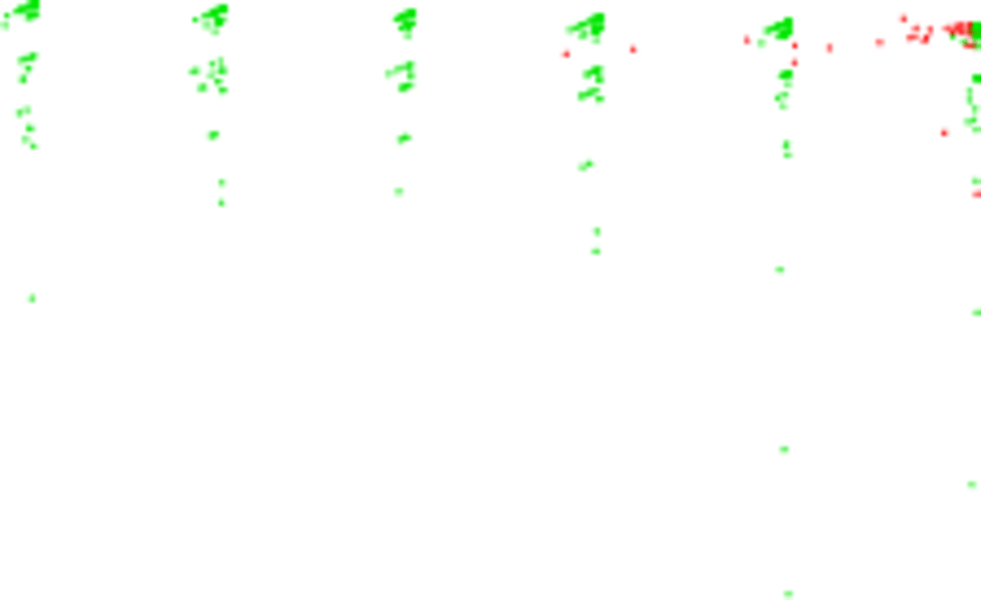
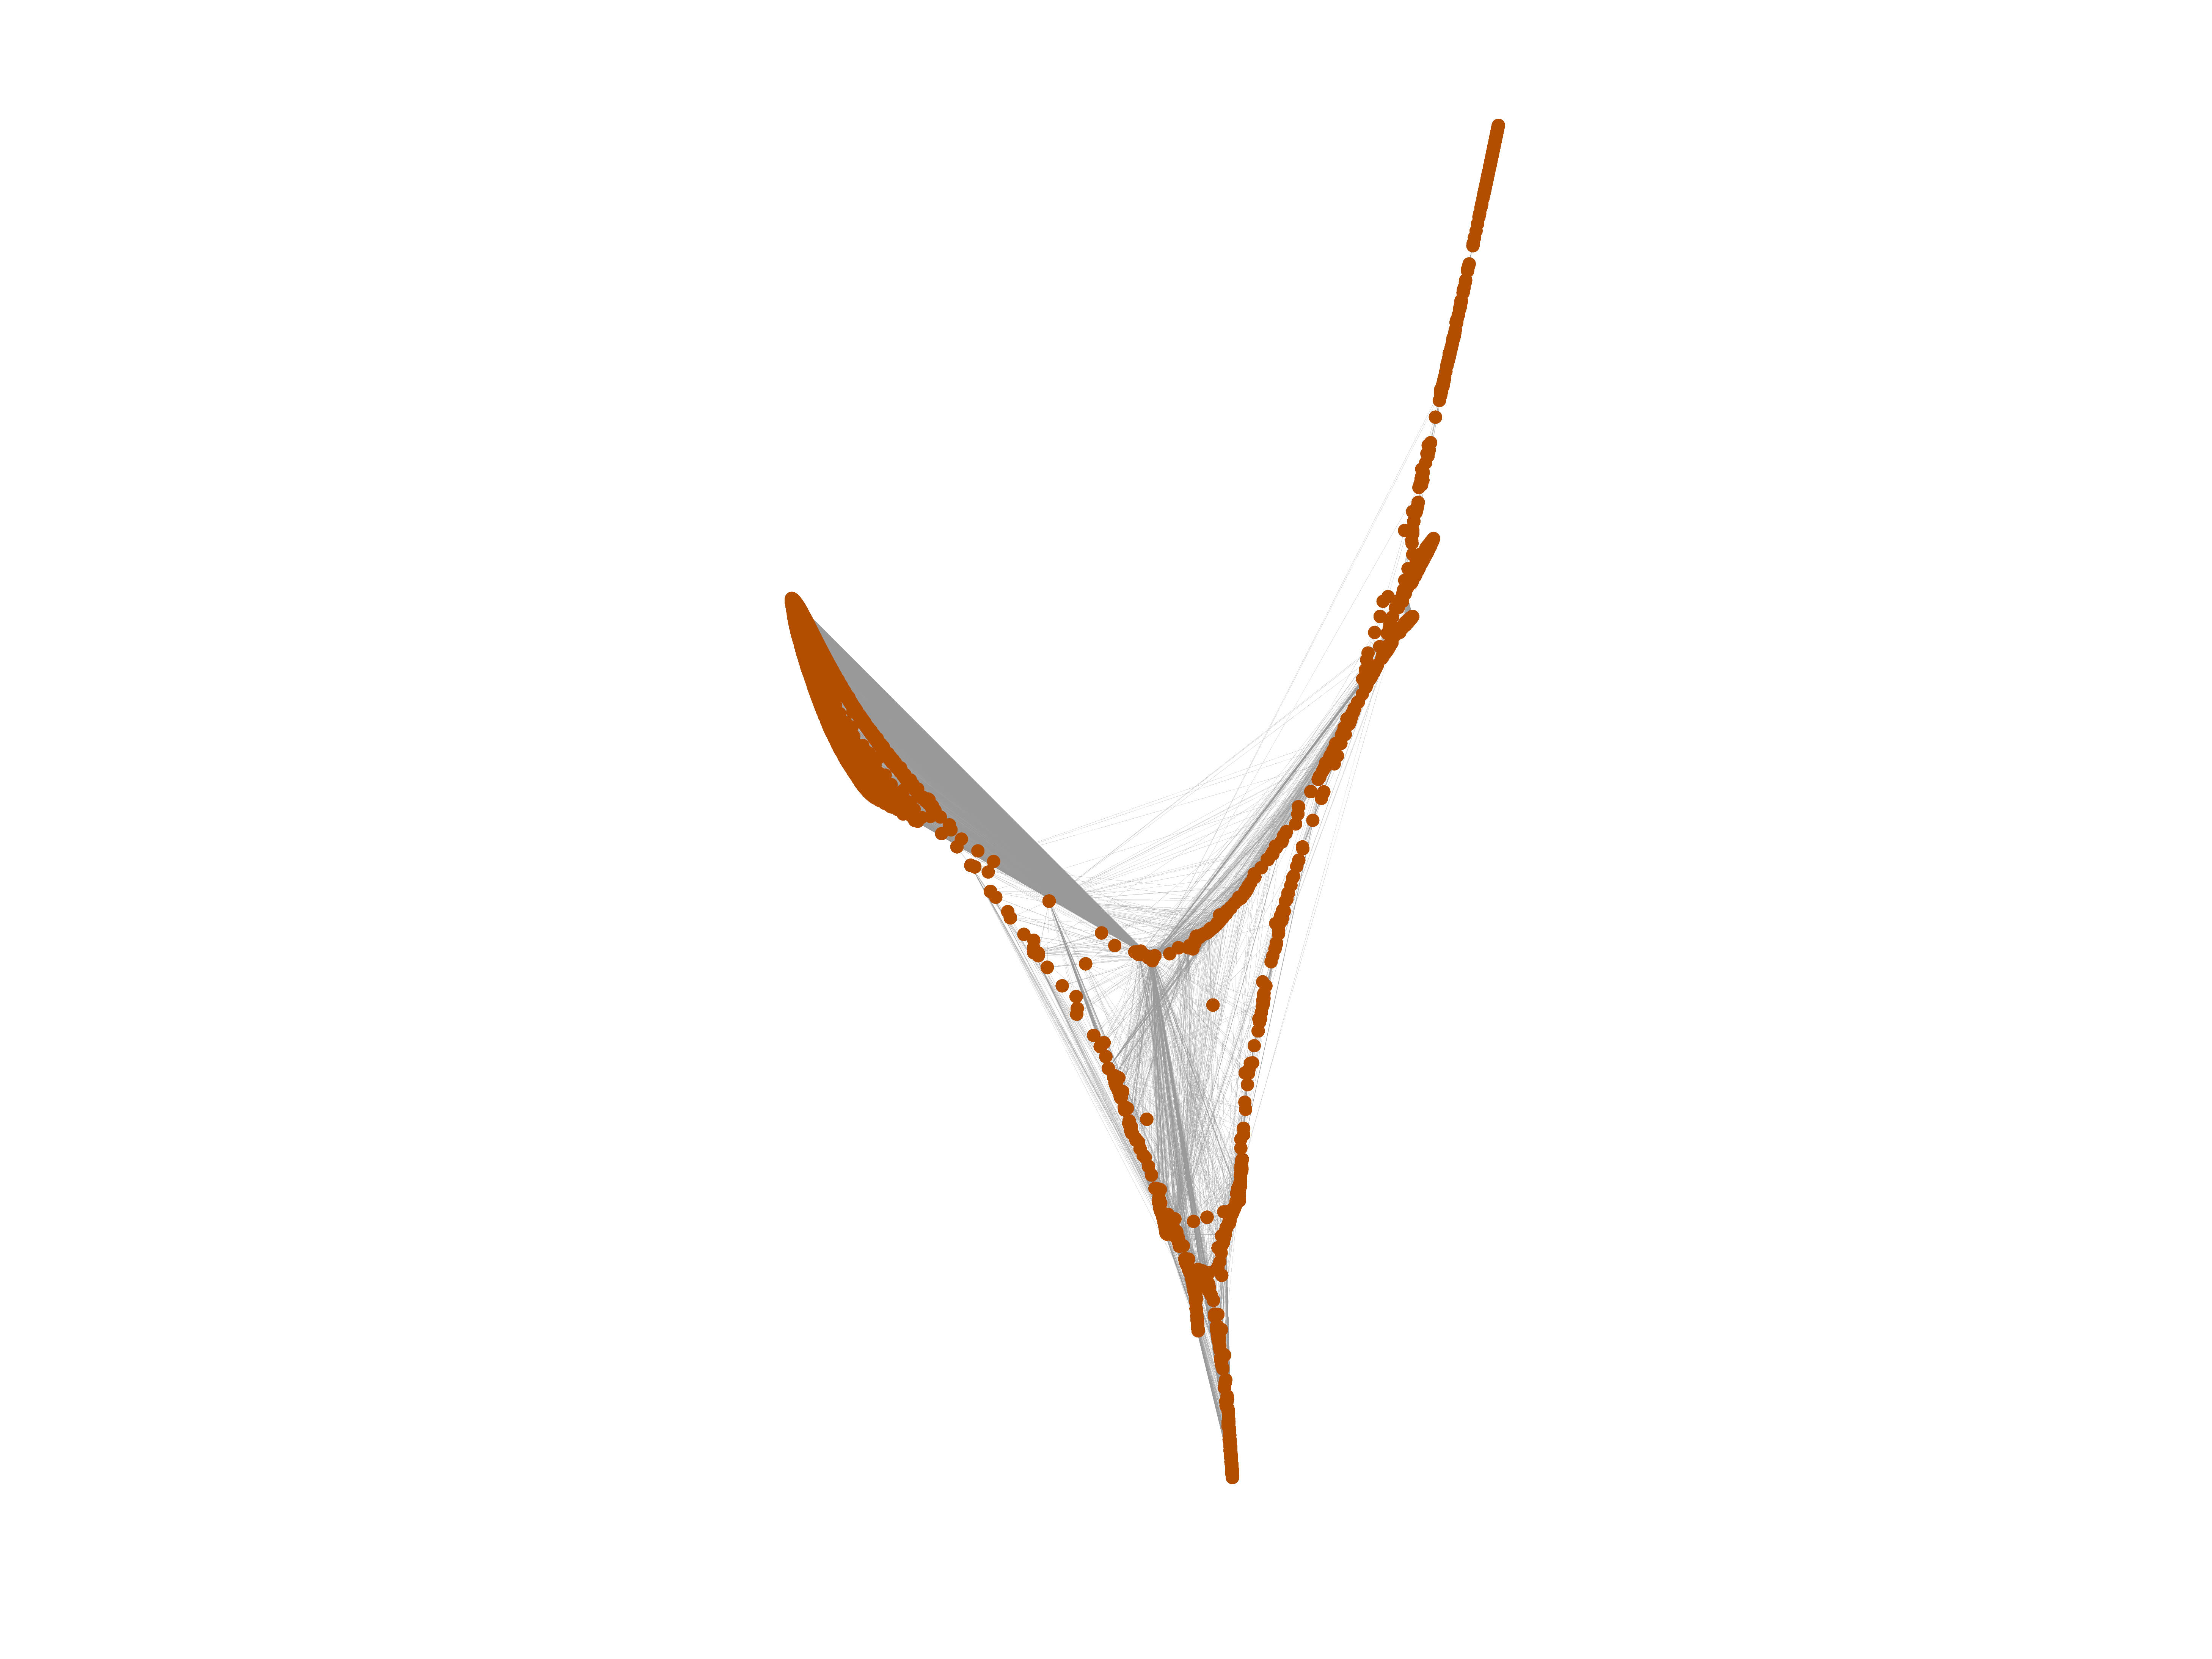
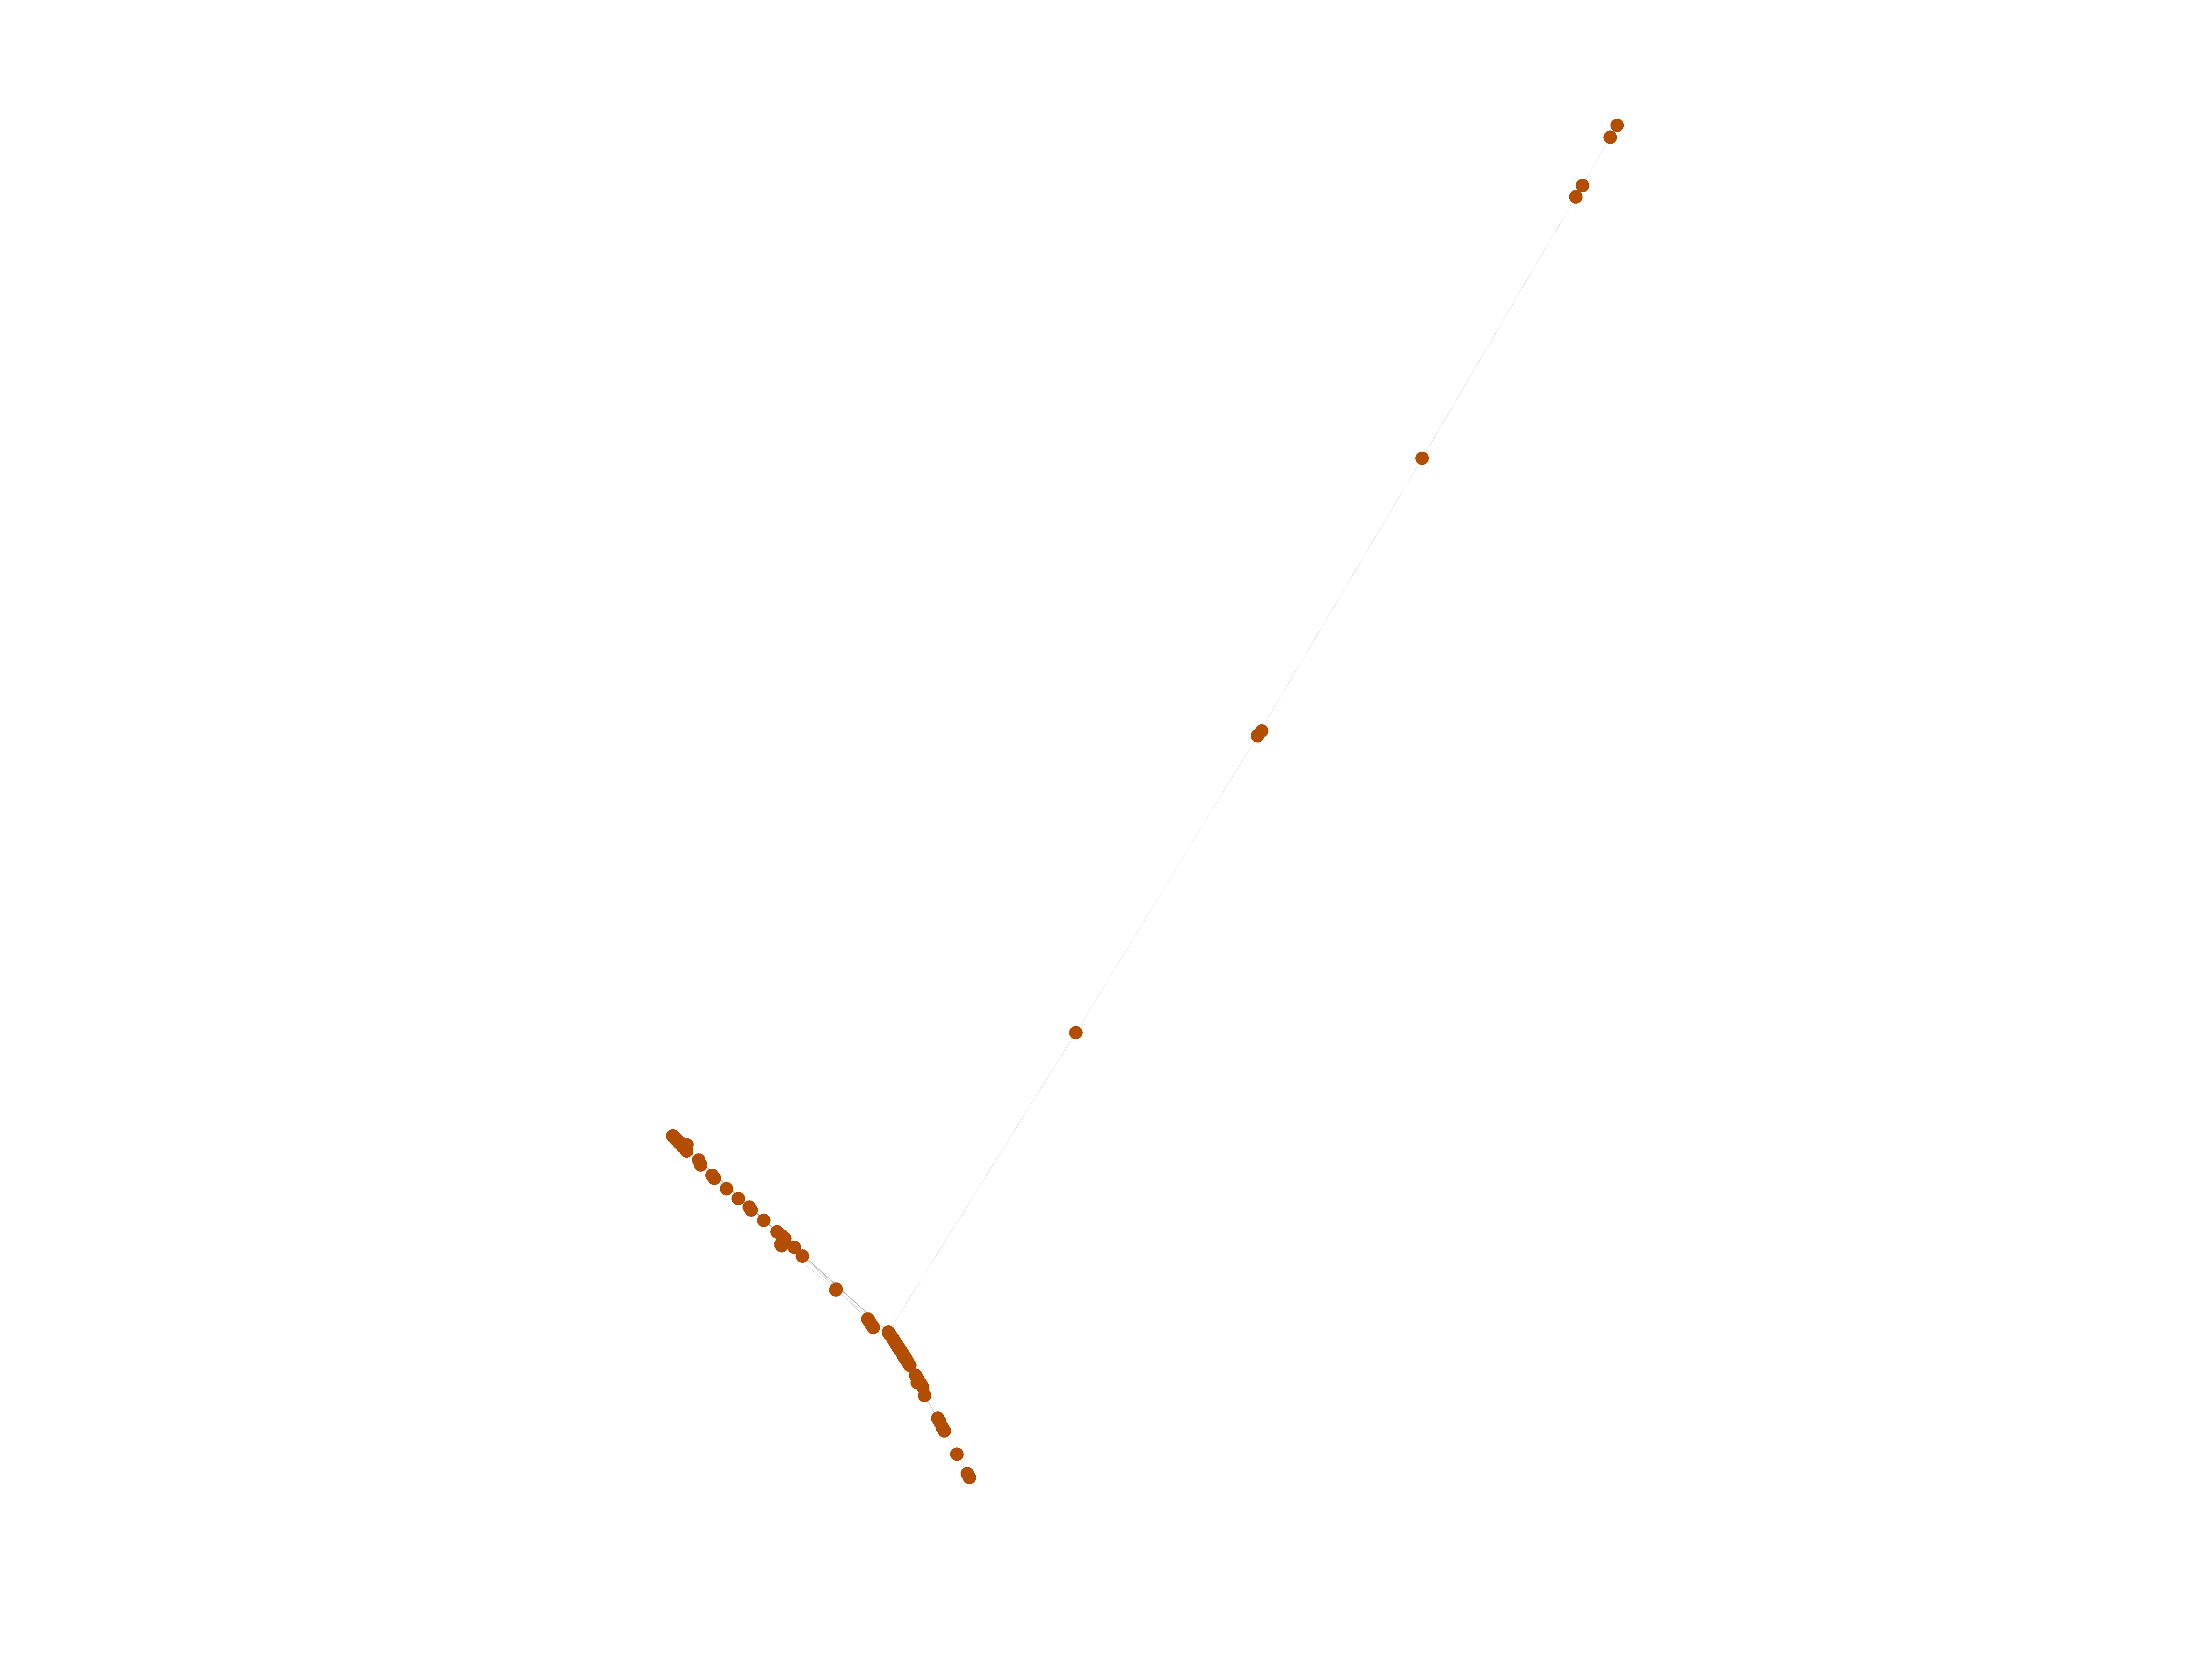
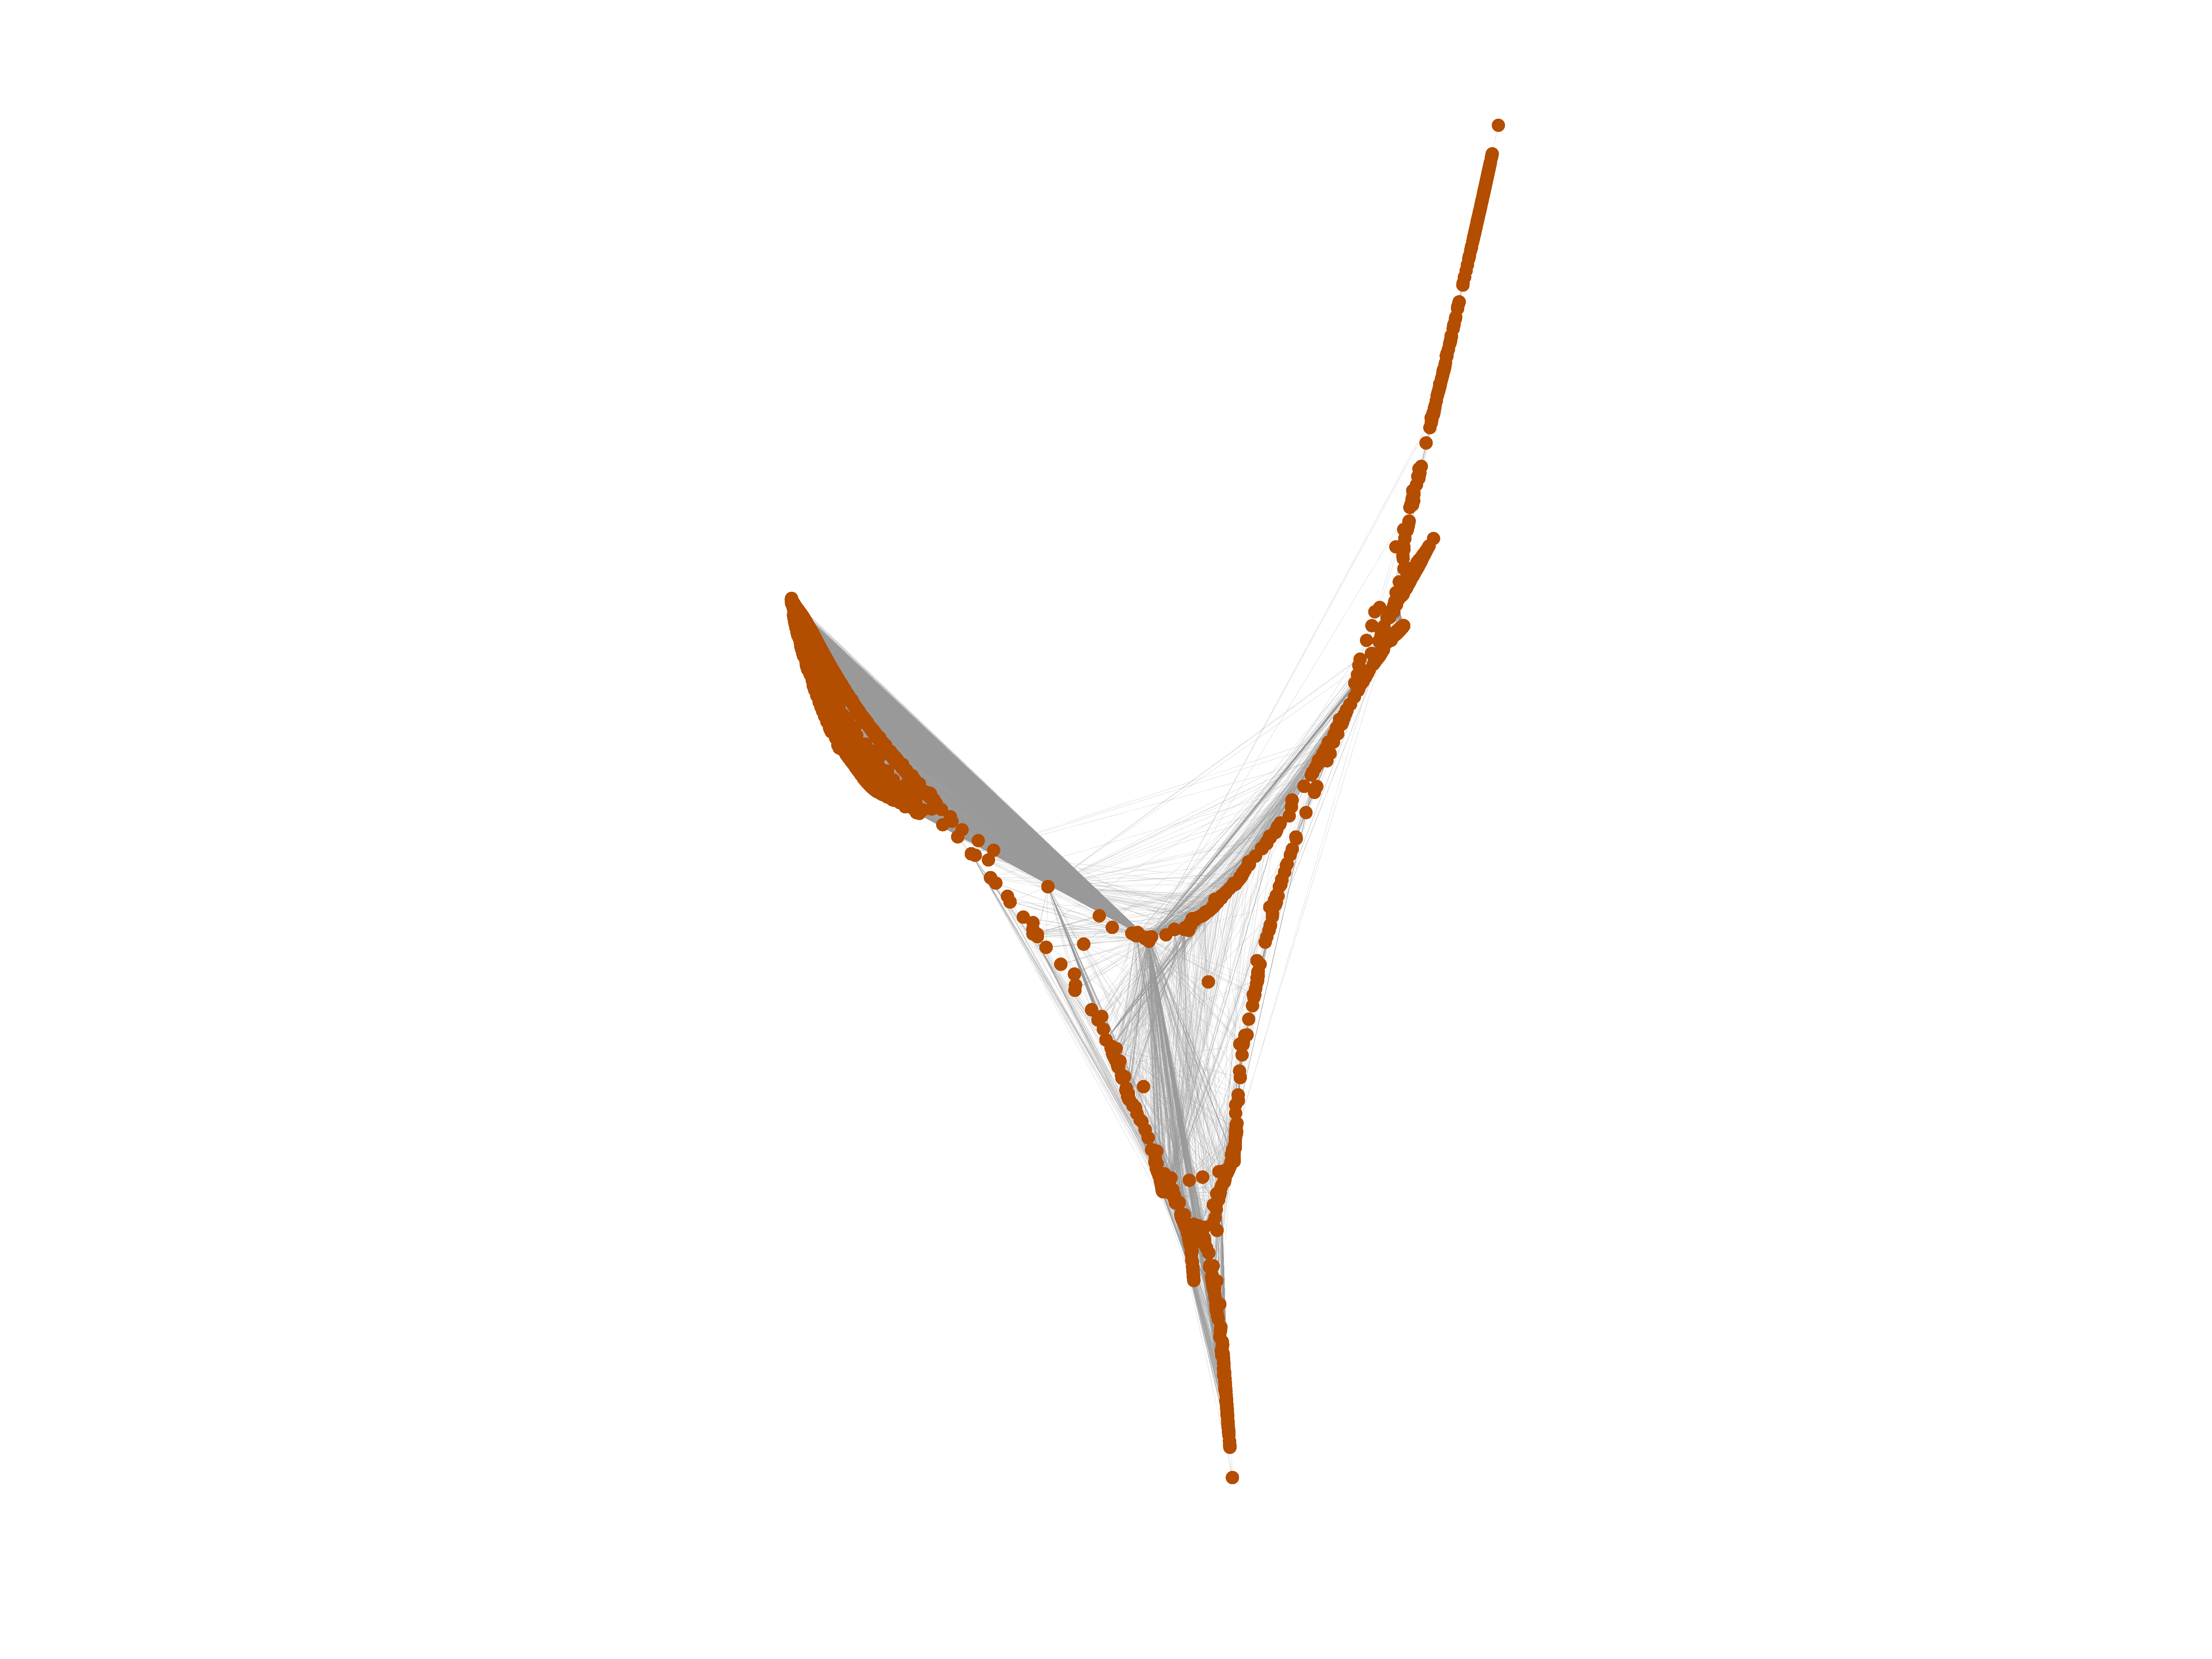
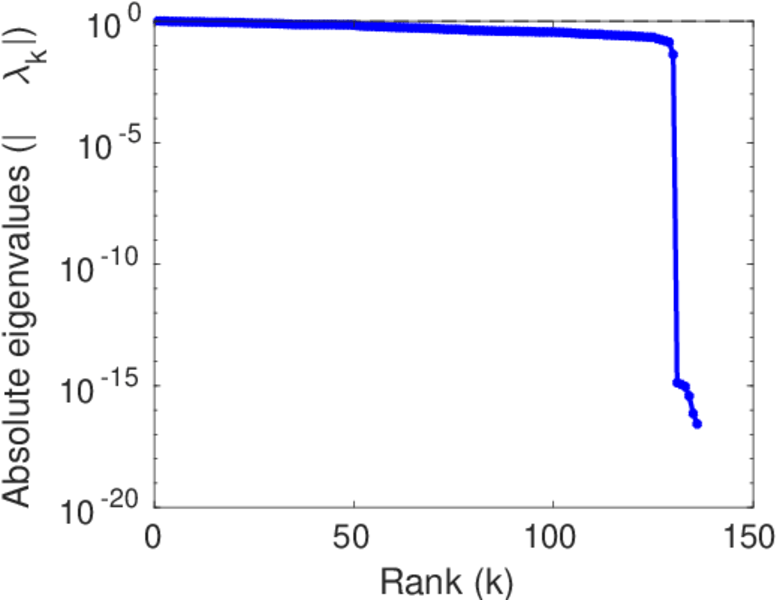
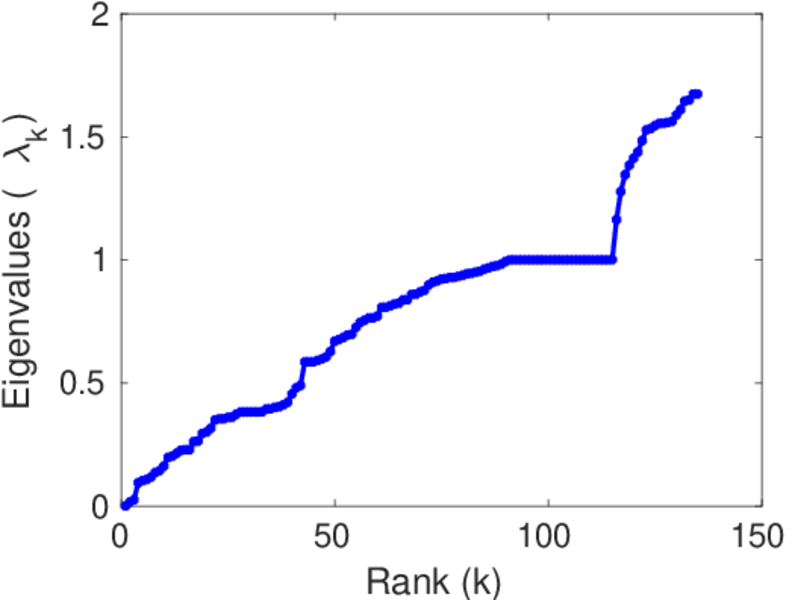
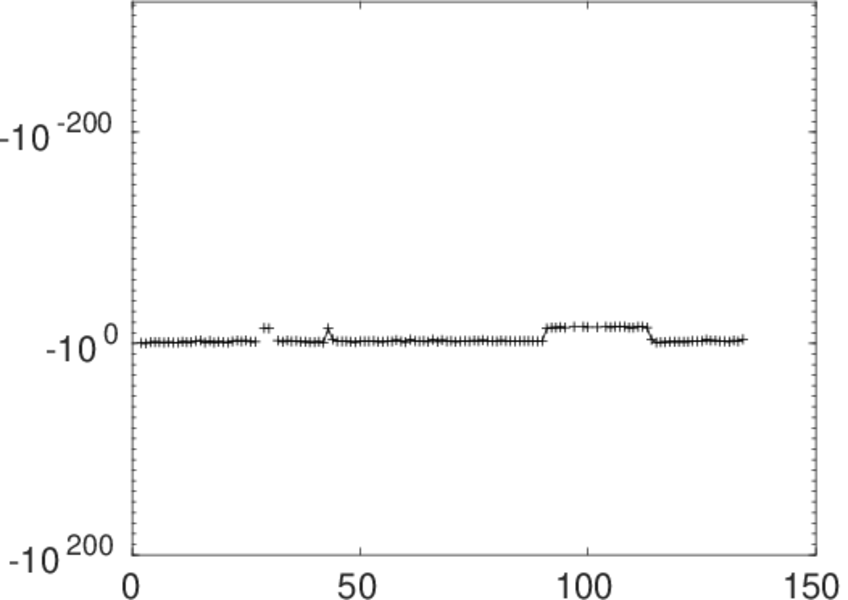
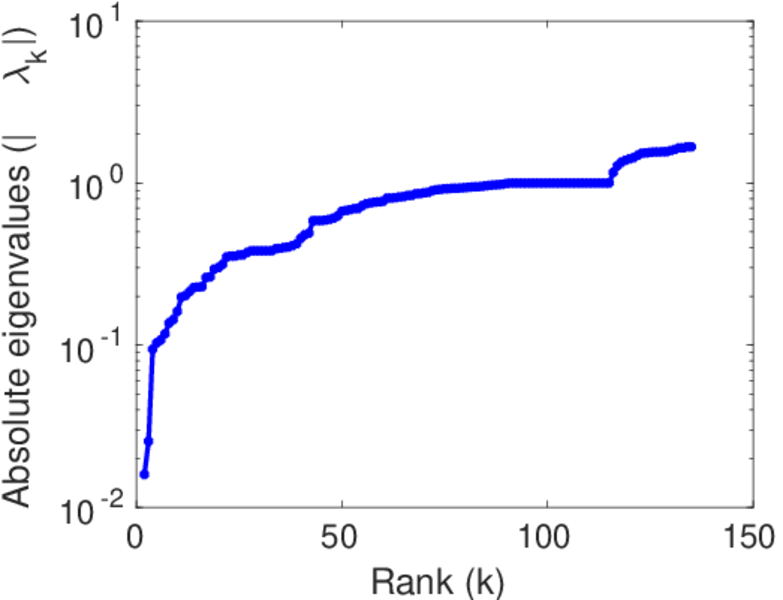
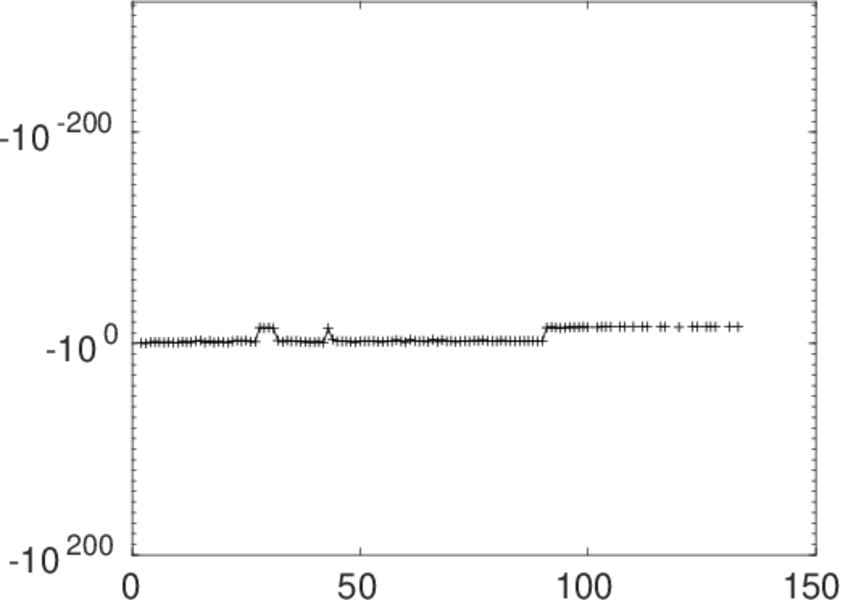
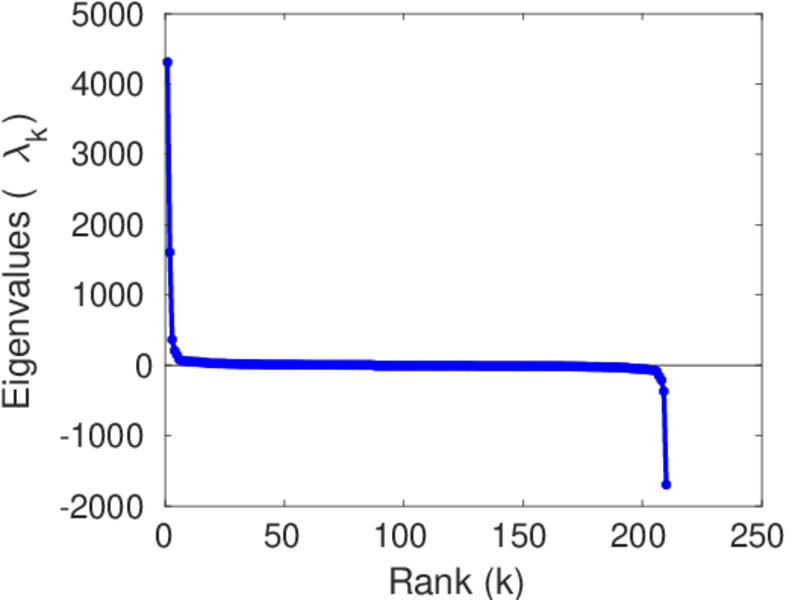
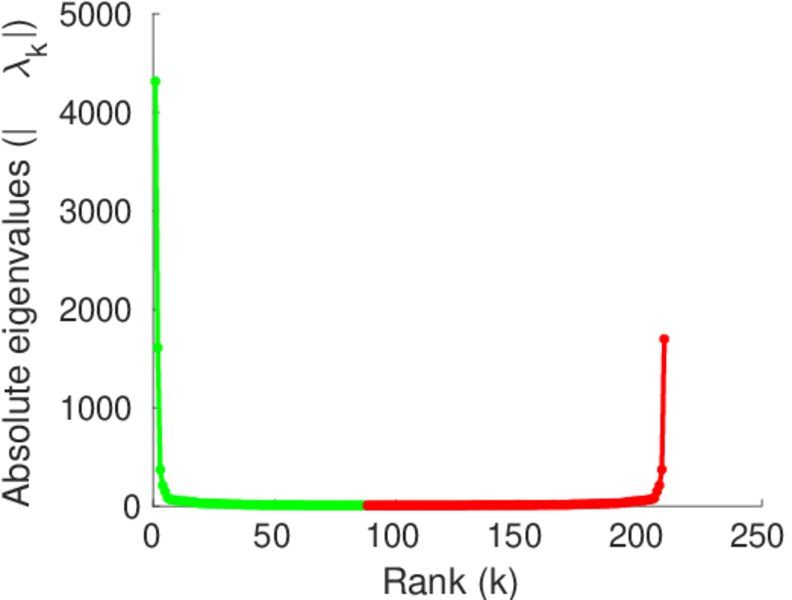
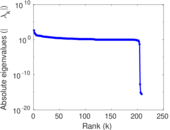
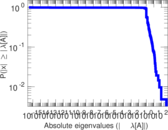
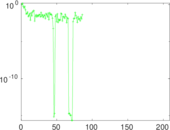
Matrix decompositions plots


Downloads
References
|
[1]
|
Jérôme Kunegis.
KONECT – The Koblenz Network Collection.
In Proc. Int. Conf. on World Wide Web Companion, pages
1343–1350, 2013.
[ http ]
|
|
[2]
|
Wikimedia Foundation.
Wikimedia downloads.
http://dumps.wikimedia.org/, January 2010.
|
 KONECT ‣ Networks ‣
Buy Me a Coffee
KONECT ‣ Networks ‣
Buy Me a Coffee