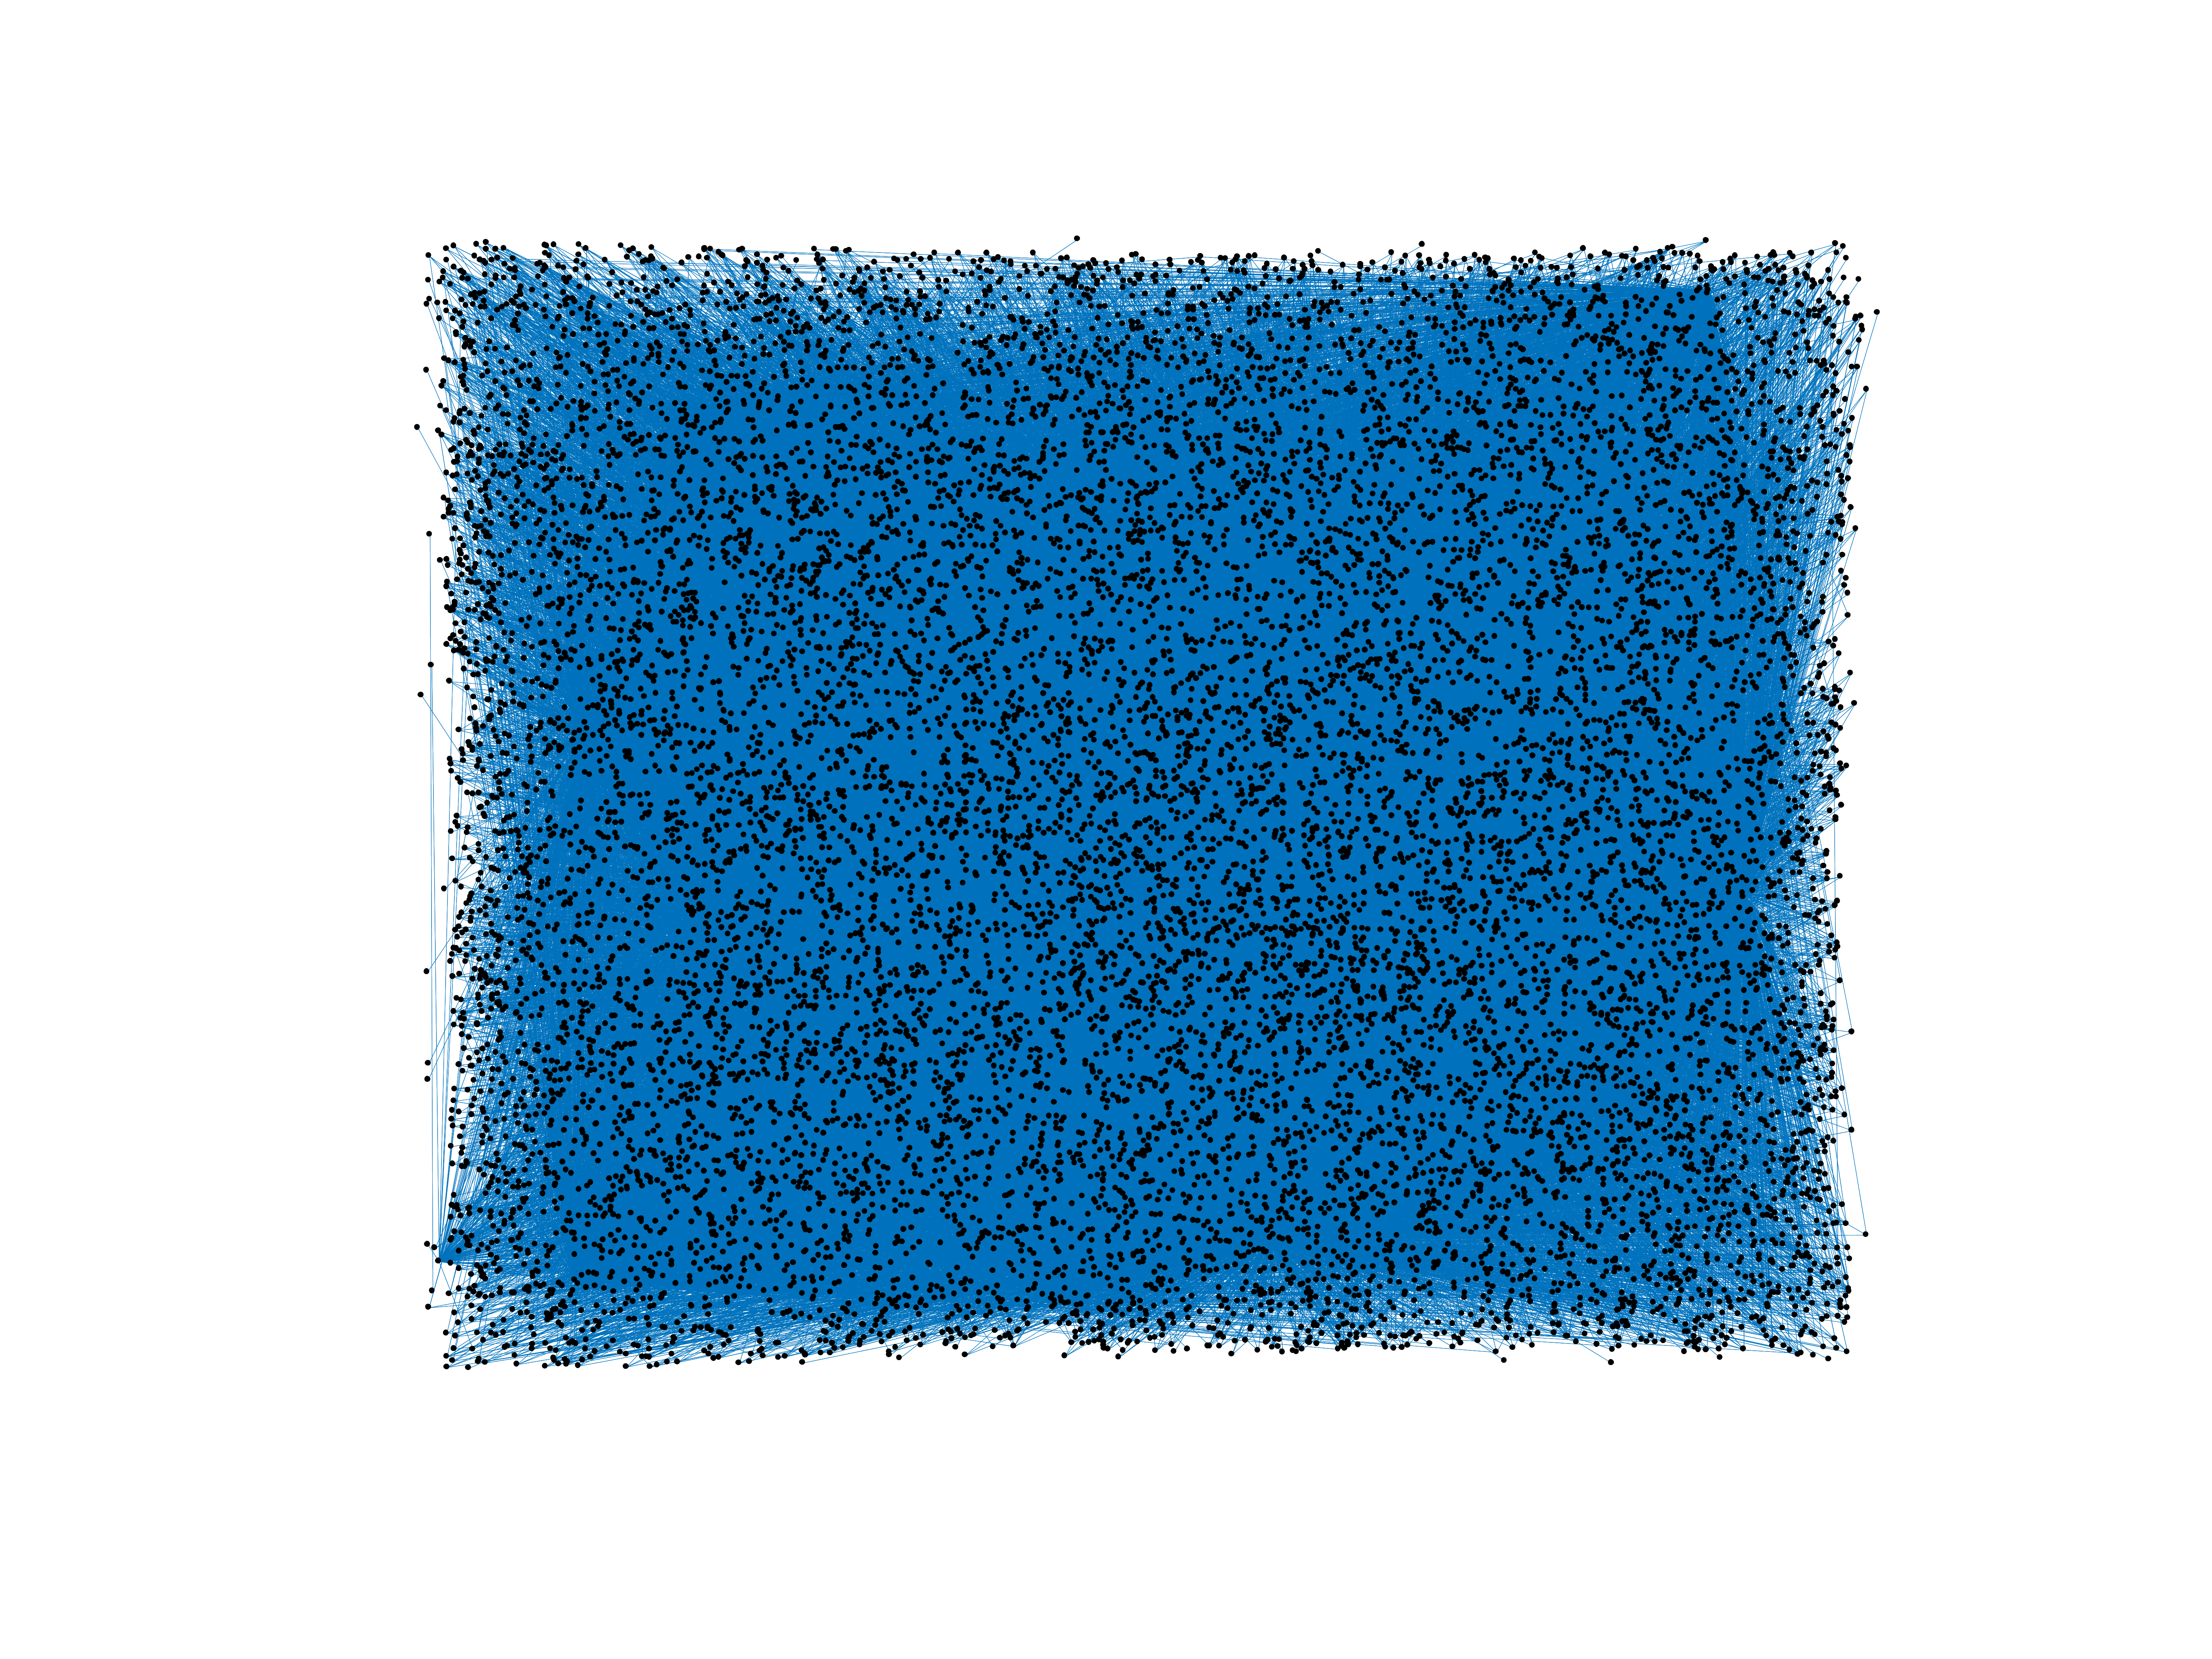
Wiktionary edits (nn)
This is the bipartite edit network of the Norwegian Nynorsk Wiktionary. It
contains users and pages from the Norwegian Nynorsk Wiktionary, connected by
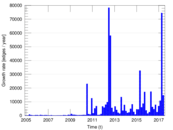
edit events. Each edge represents an edit. The dataset includes the timestamp
of each edit.
Metadata
Statistics
| Size | n = | 13,925
|
| Left size | n1 = | 266
|
| Right size | n2 = | 13,659
|
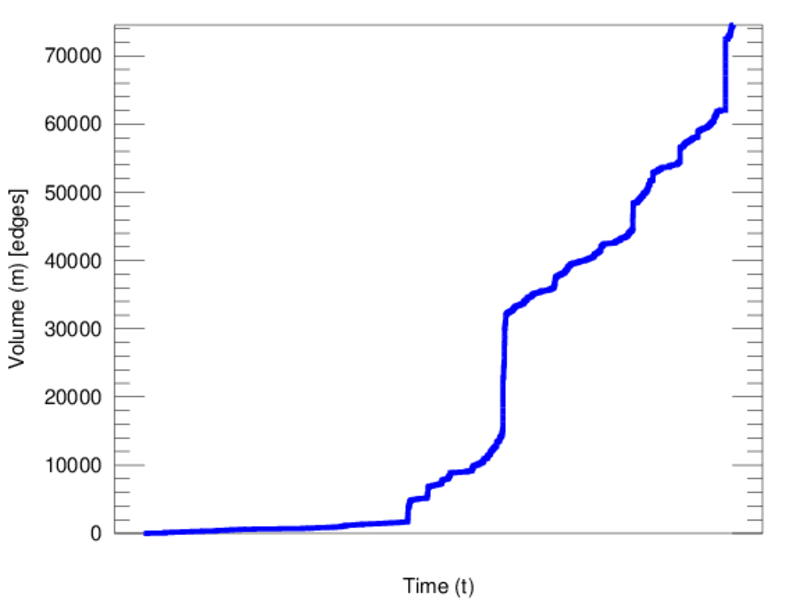
| Volume | m = | 74,531
|
| Unique edge count | m̿ = | 51,179
|
| Wedge count | s = | 168,336,536
|
| Claw count | z = | 489,727,435,229
|
| Cross count | x = | 1,163,490,458,854,907
|
| Square count | q = | 153,265,996
|
| 4-Tour count | T4 = | 1,899,611,518
|
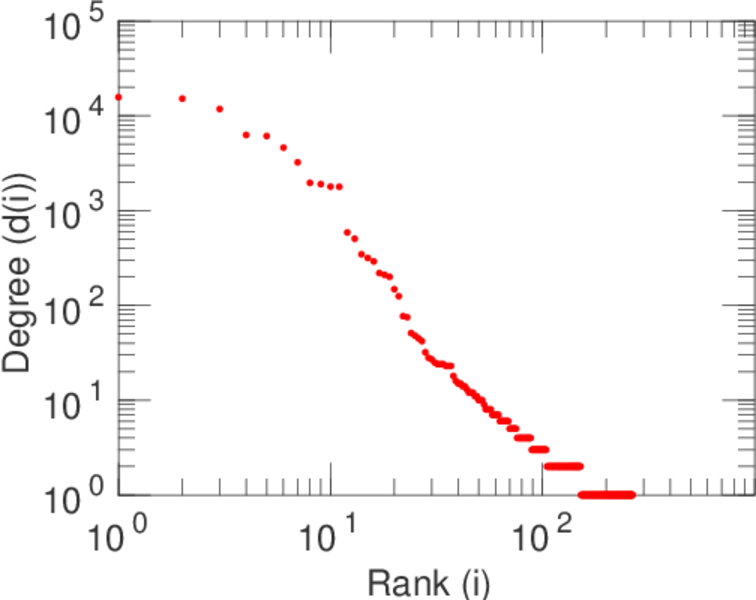
| Maximum degree | dmax = | 15,703
|
| Maximum left degree | d1max = | 15,703
|
| Maximum right degree | d2max = | 133
|
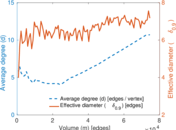
| Average degree | d = | 10.704 6
|
| Average left degree | d1 = | 280.192
|
| Average right degree | d2 = | 5.456 55
|
| Fill | p = | 0.014 086 1
|
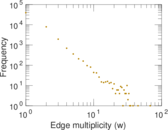
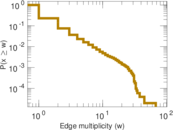
| Average edge multiplicity | m̃ = | 1.456 28
|
| Size of LCC | N = | 13,690
|
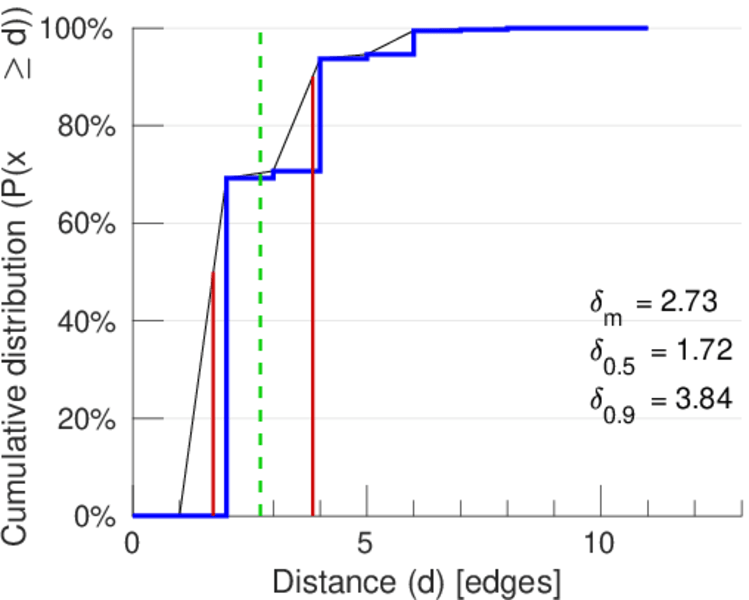
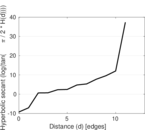
| Diameter | δ = | 14
|
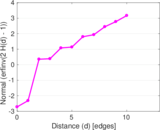
| 50-Percentile effective diameter | δ0.5 = | 1.722 49
|
| 90-Percentile effective diameter | δ0.9 = | 3.840 35
|
| Median distance | δM = | 2
|
| Mean distance | δm = | 2.726 87
|
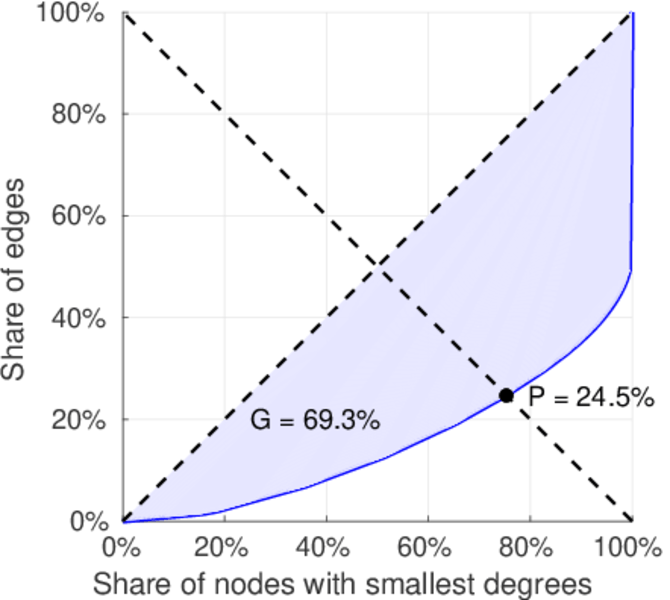
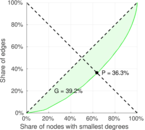
| Gini coefficient | G = | 0.692 114
|
| Balanced inequality ratio | P = | 0.245 448
|
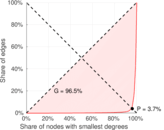
| Left balanced inequality ratio | P1 = | 0.036 897 4
|
| Right balanced inequality ratio | P2 = | 0.362 856
|
| Relative edge distribution entropy | Her = | 0.691 653
|
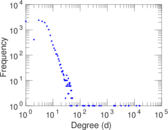
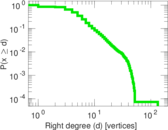
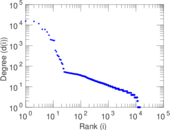
| Power law exponent | γ = | 1.868 52
|
| Tail power law exponent | γt = | 4.621 00
|
| Tail power law exponent with p | γ3 = | 4.621 00
|
| p-value | p = | 0.000 00
|
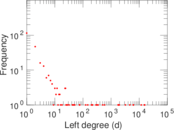
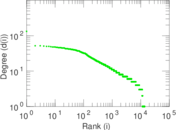
| Left tail power law exponent with p | γ3,1 = | 1.631 00
|
| Left p-value | p1 = | 0.000 00
|
| Right tail power law exponent with p | γ3,2 = | 5.611 00
|
| Right p-value | p2 = | 0.000 00
|
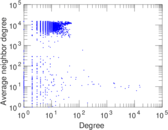
| Degree assortativity | ρ = | −0.257 228
|
| Degree assortativity p-value | pρ = | 0.000 00
|
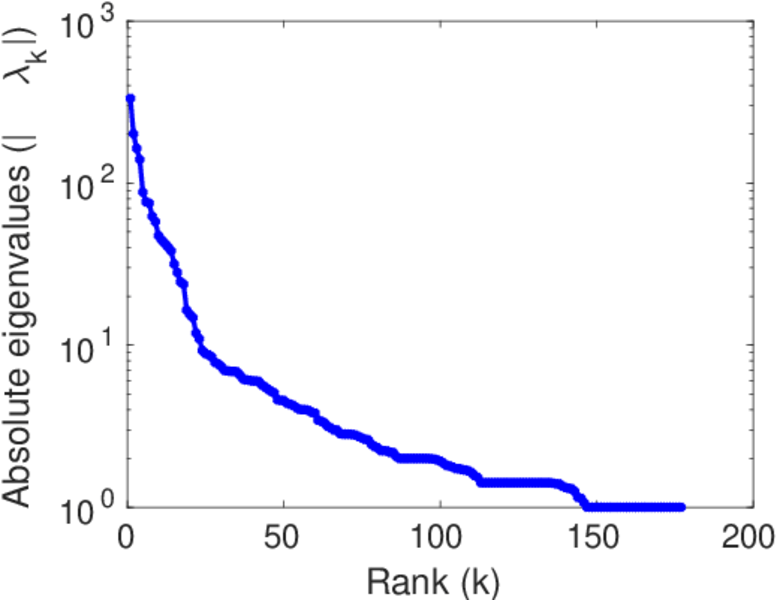
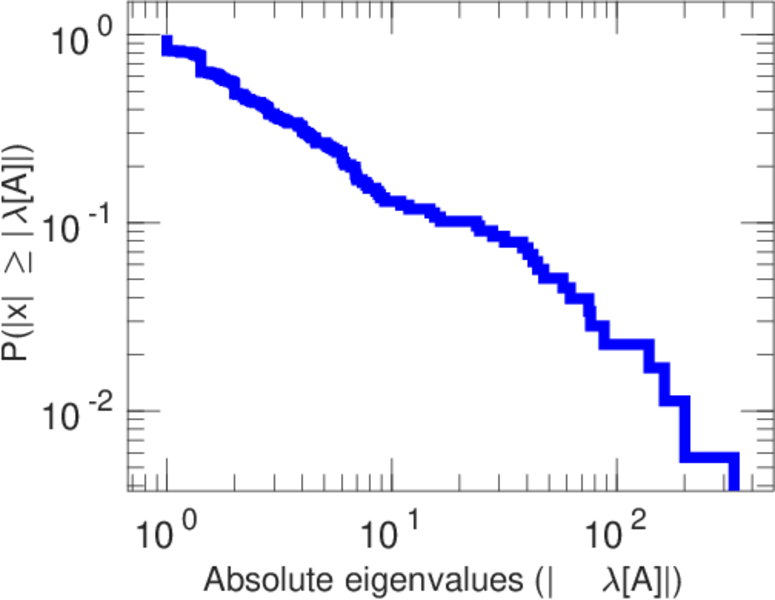
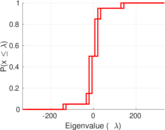
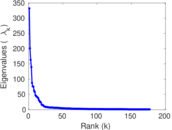
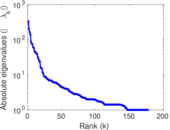
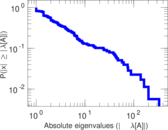
| Spectral norm | α = | 332.420
|
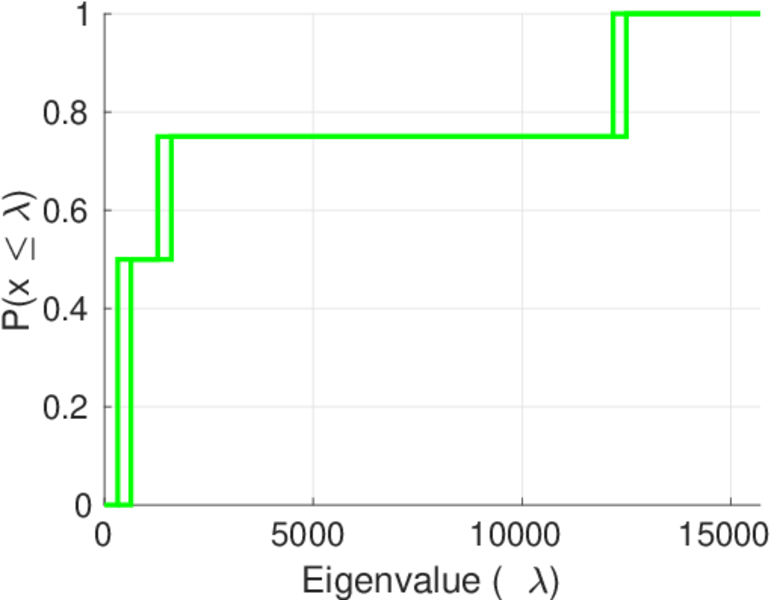
| Algebraic connectivity | a = | 0.013 170 5
|
| Spectral separation | |λ1[A] / λ2[A]| = | 1.651 47
|
| Controllability | C = | 13,413
|
| Relative controllability | Cr = | 0.963 508
|
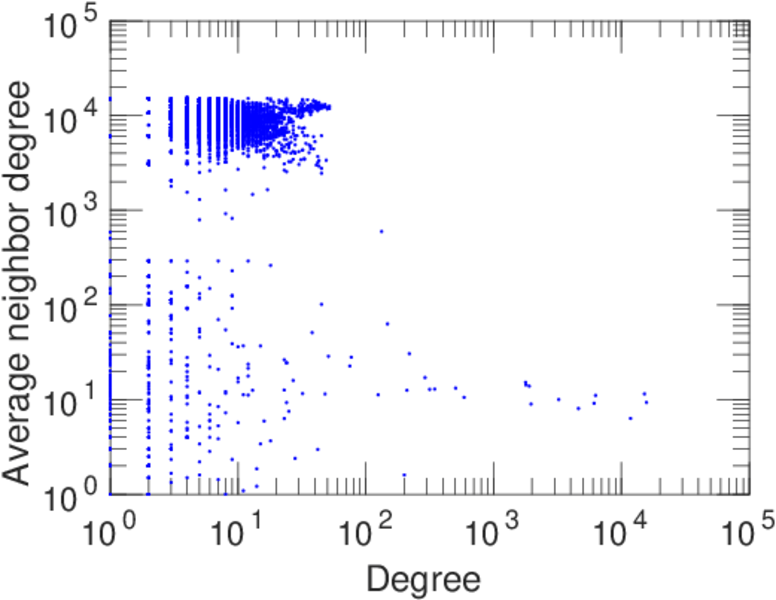
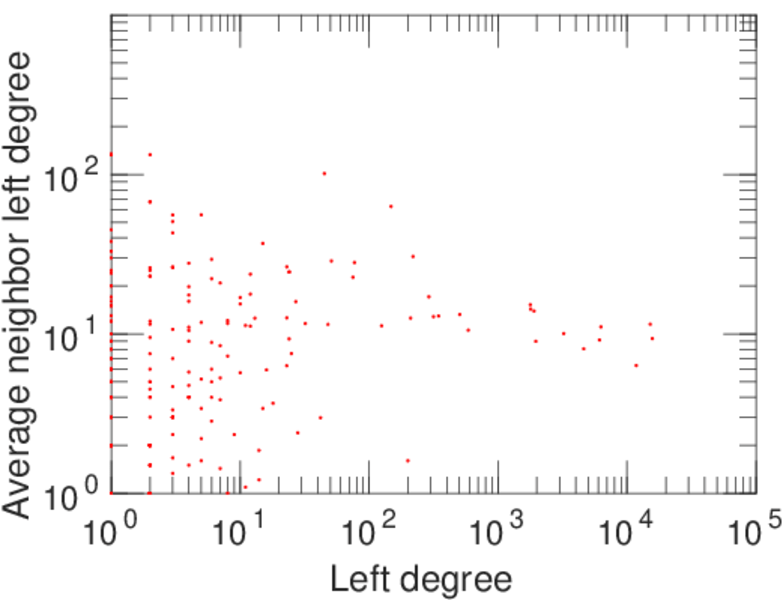
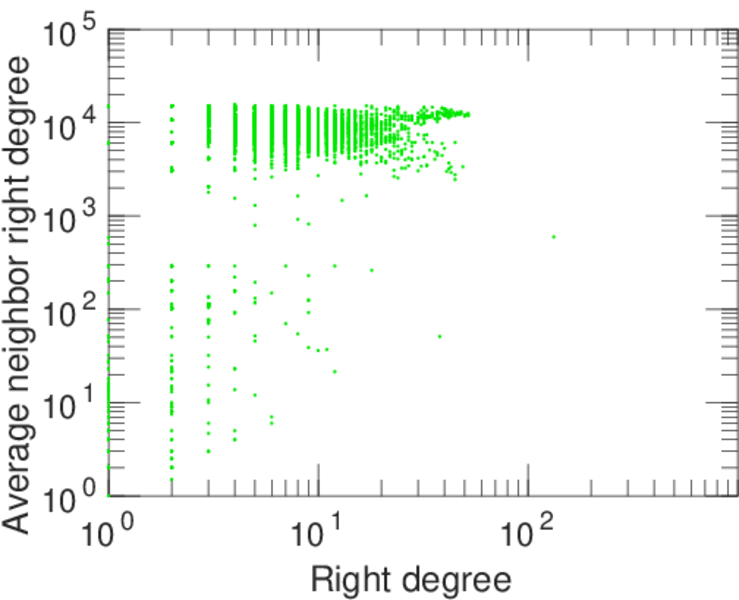
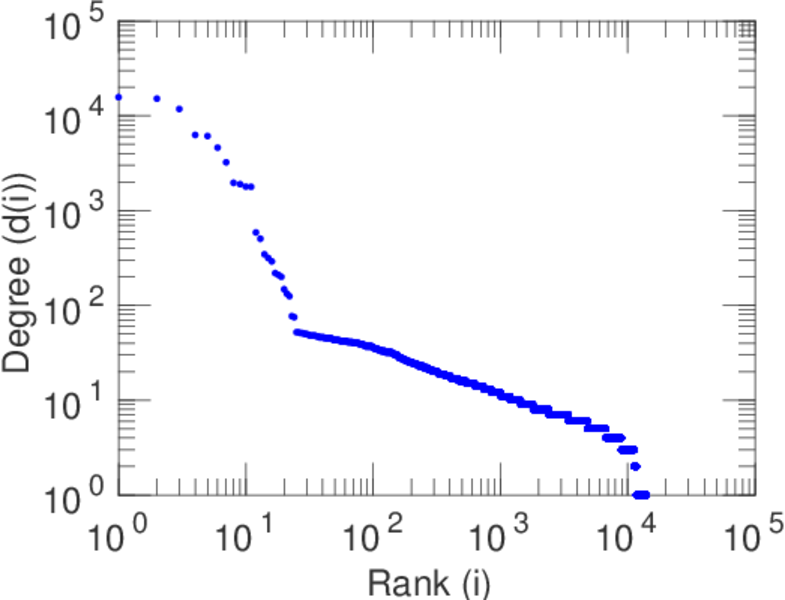
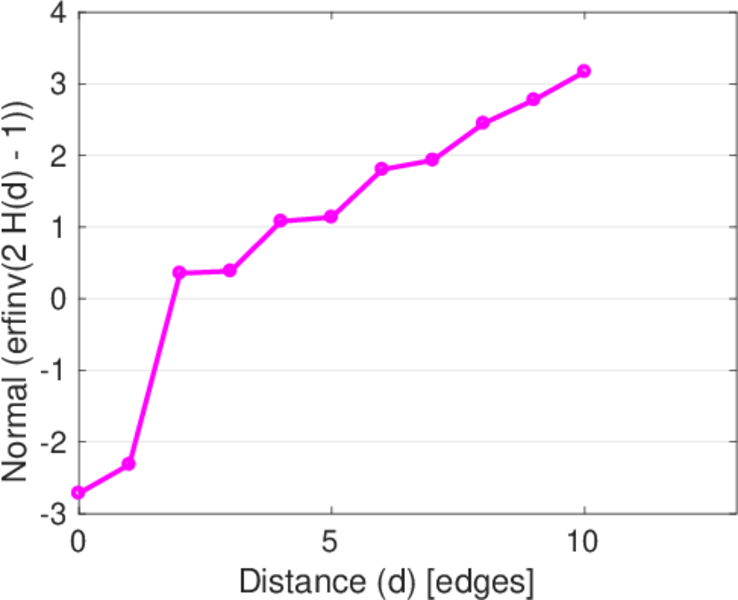
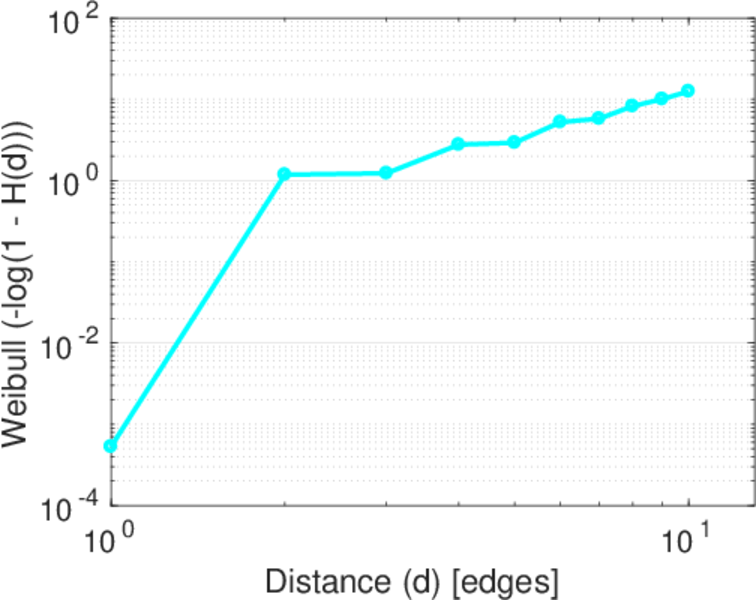
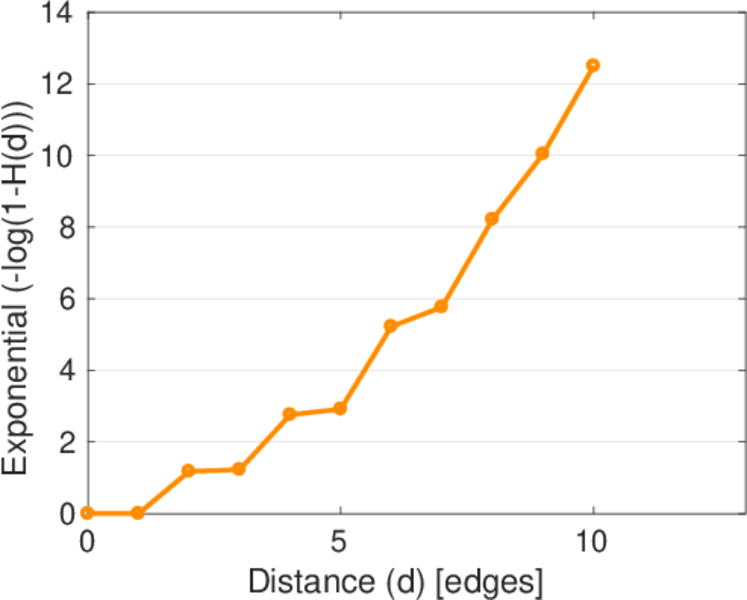
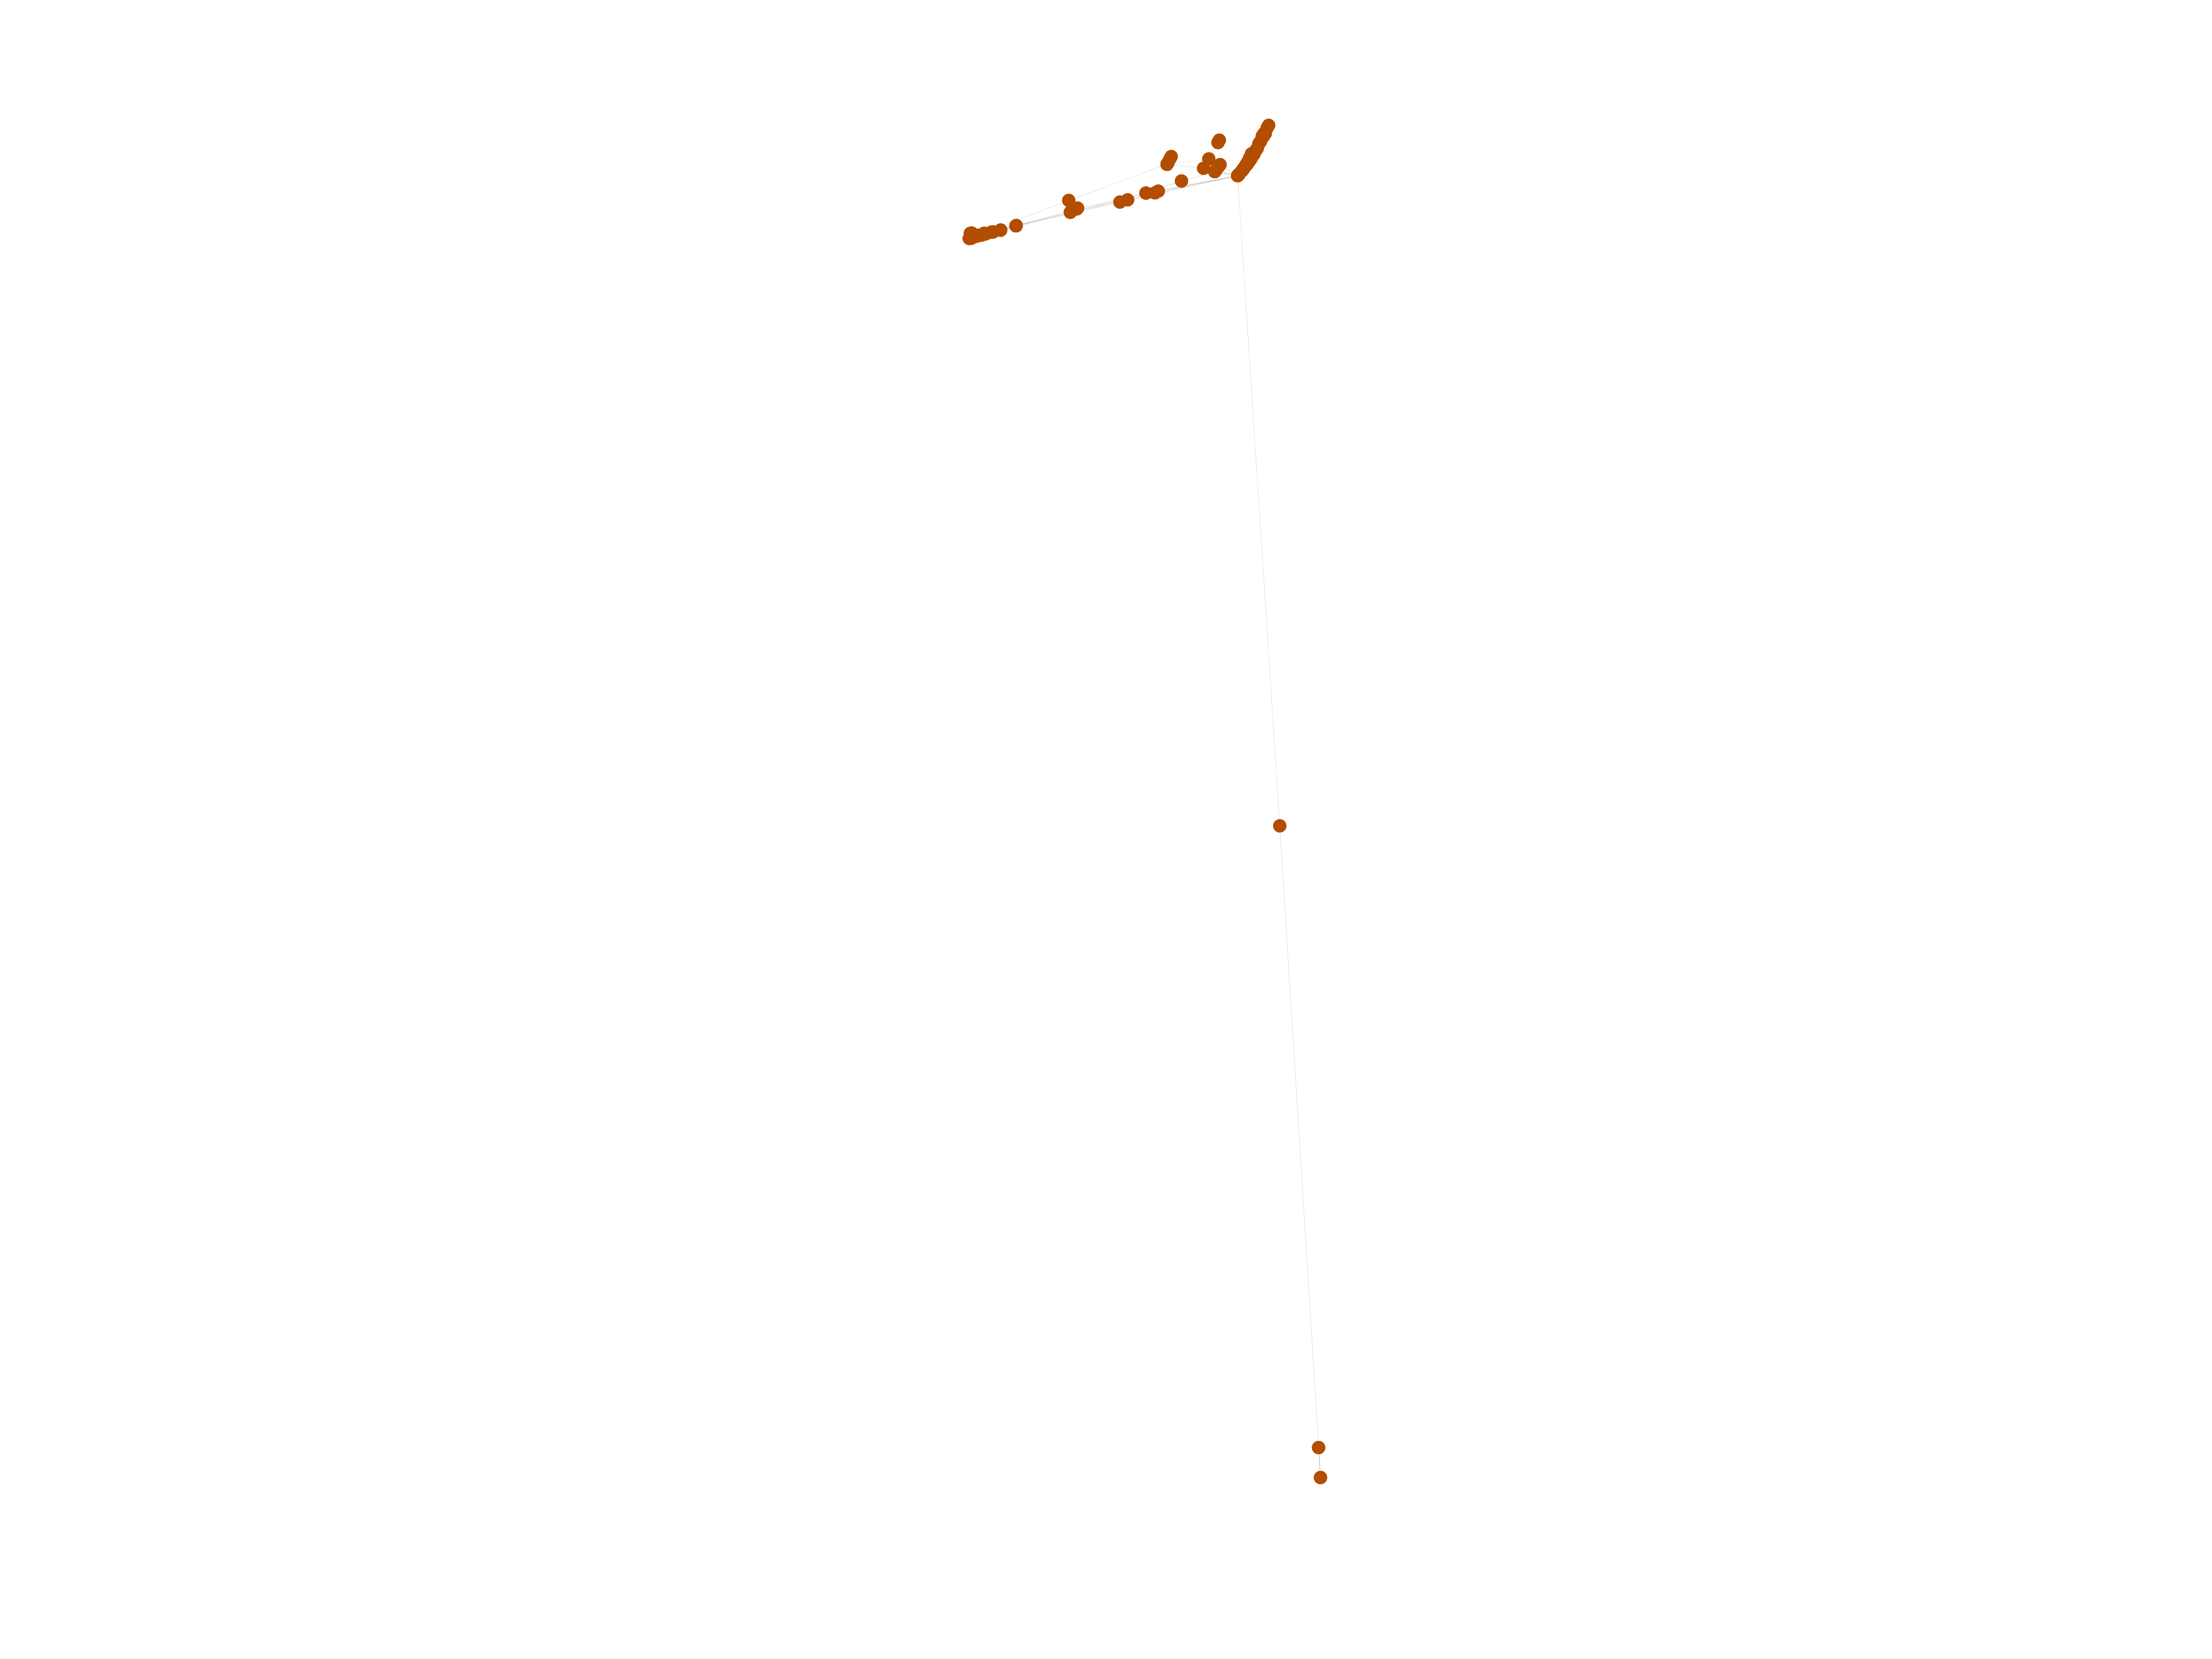
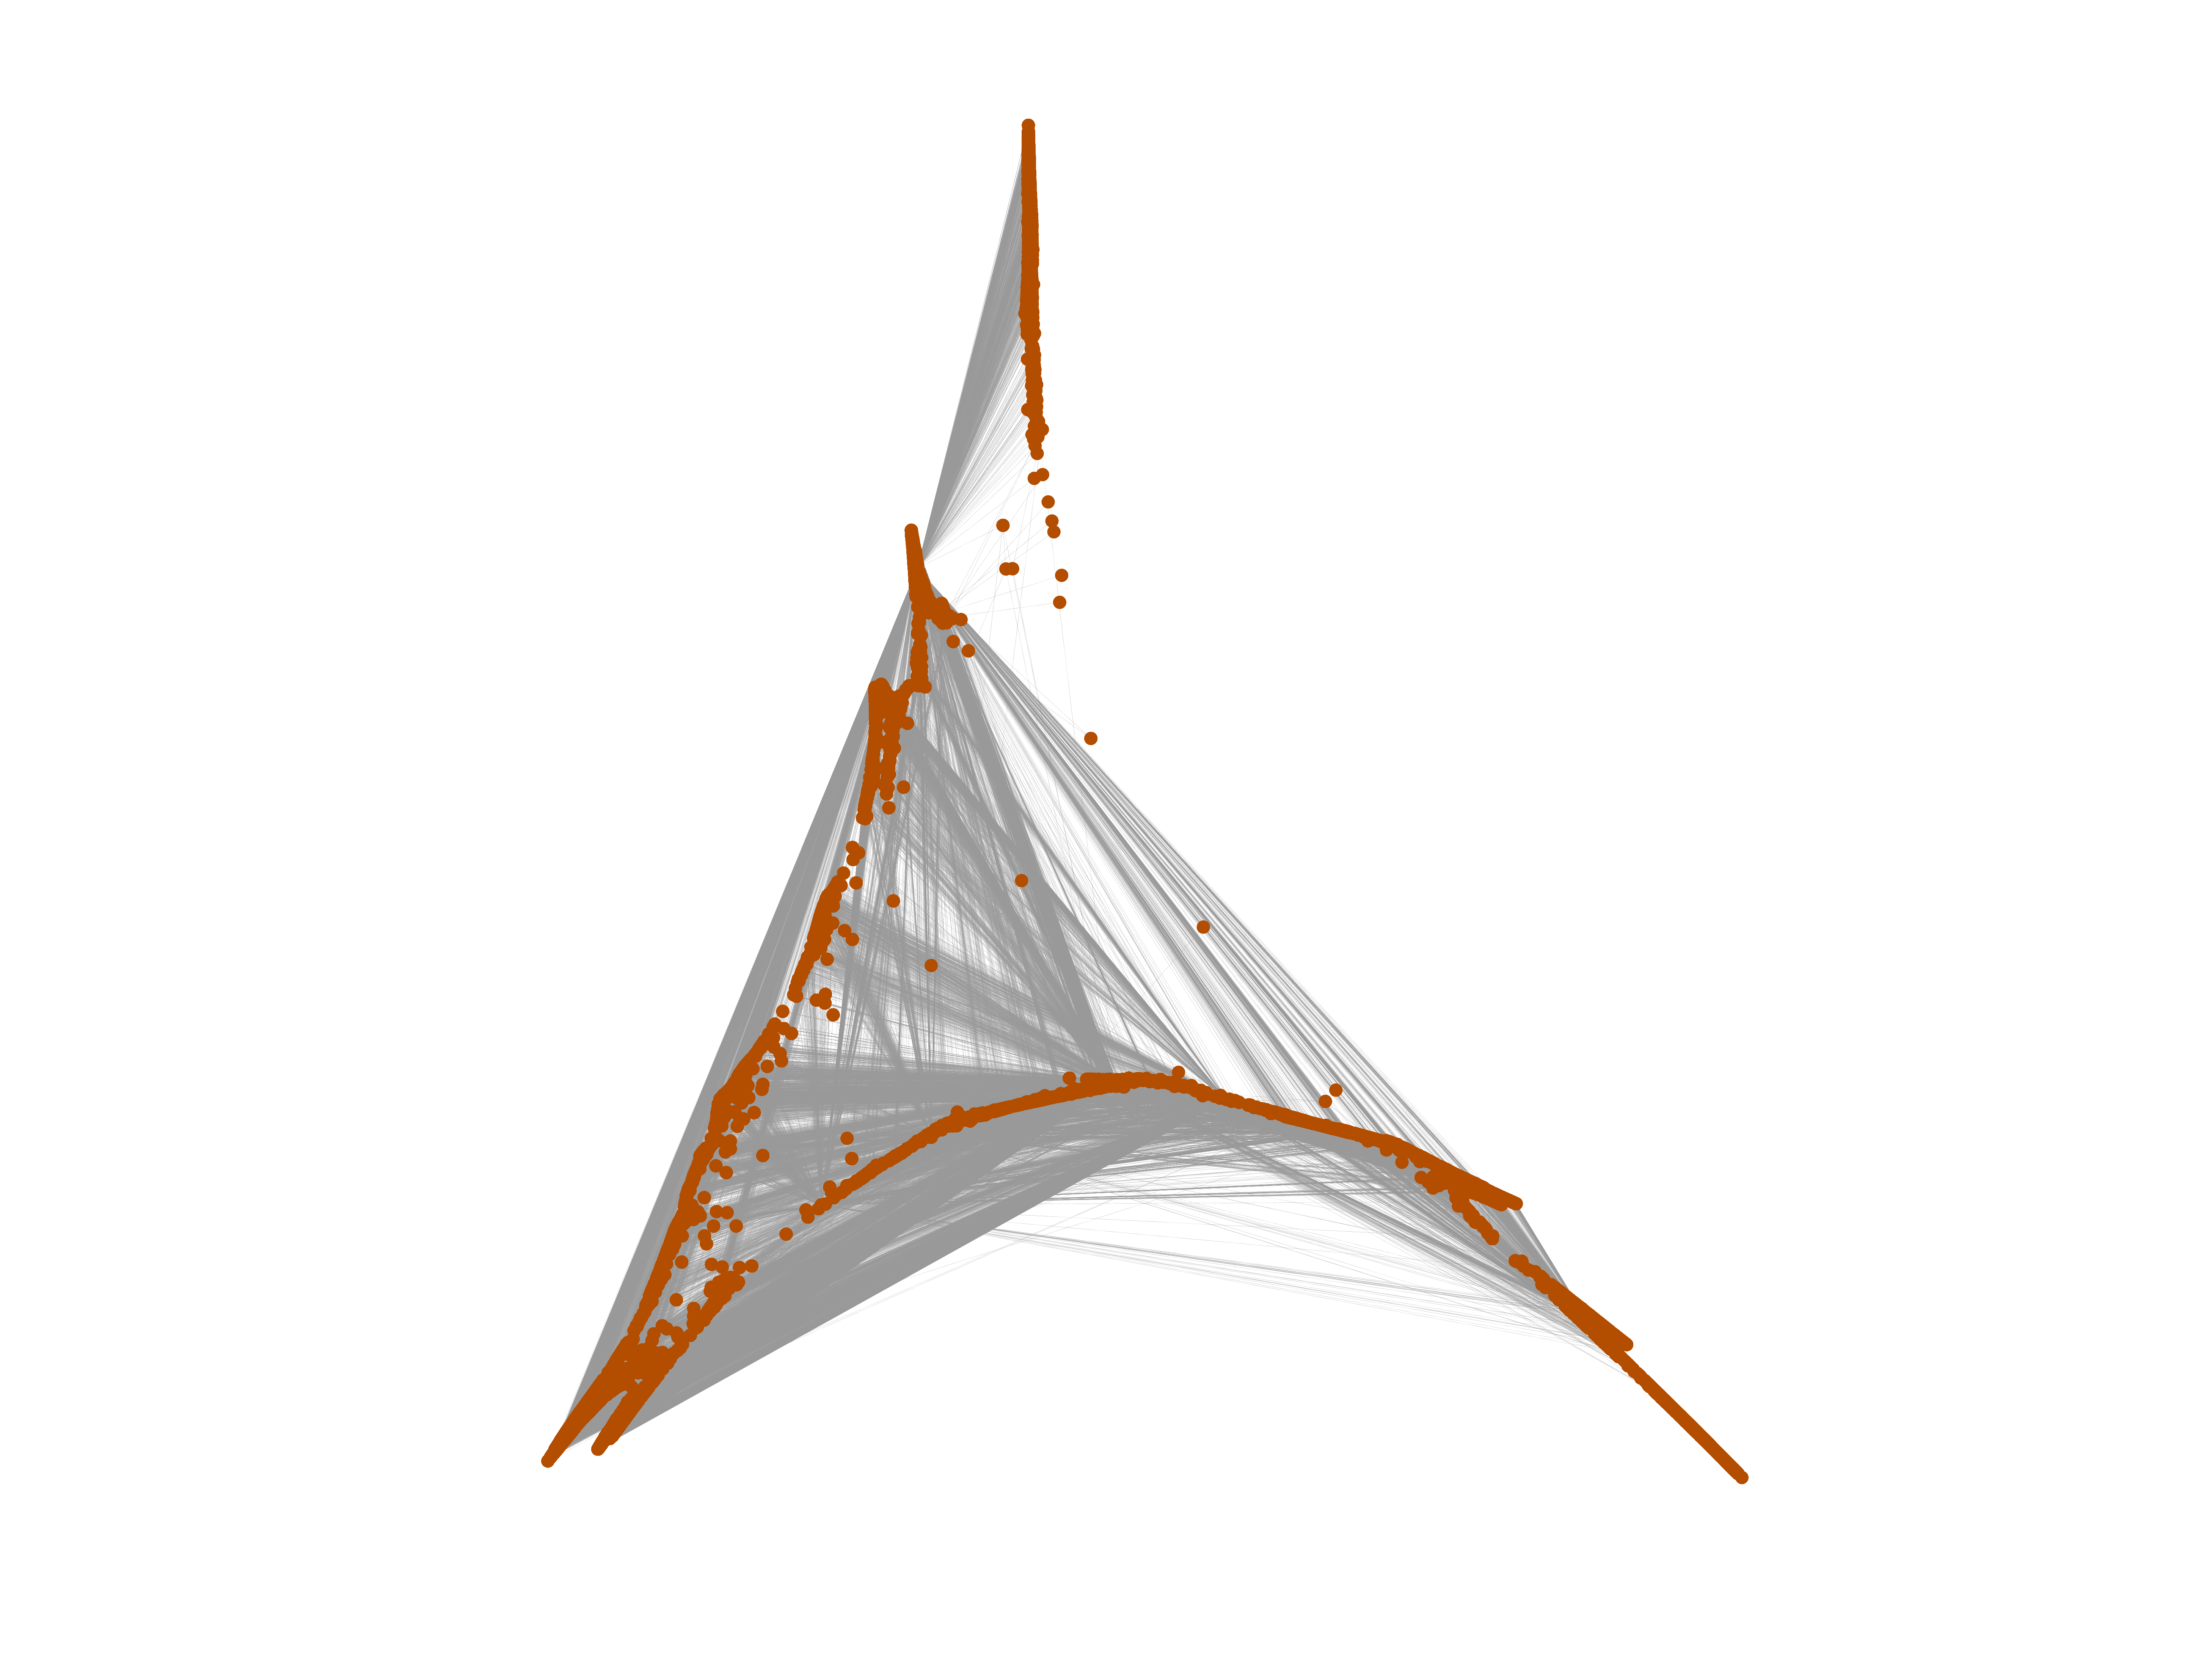
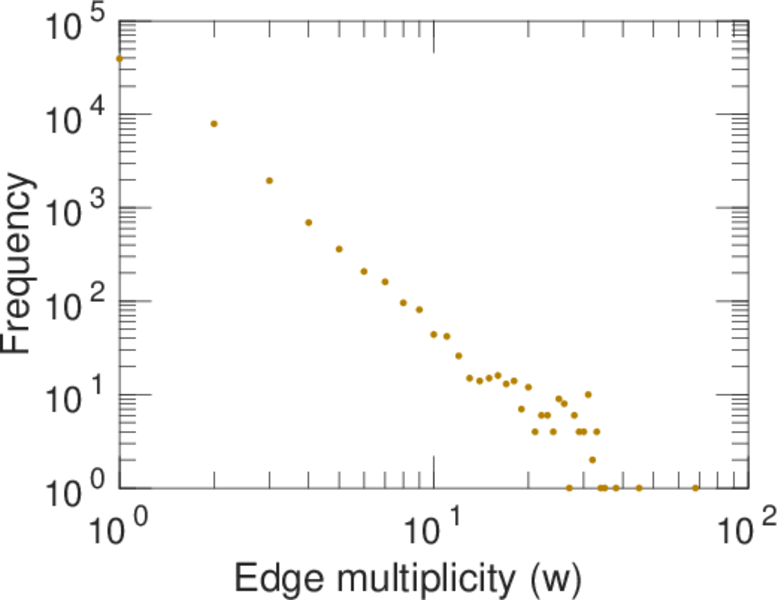
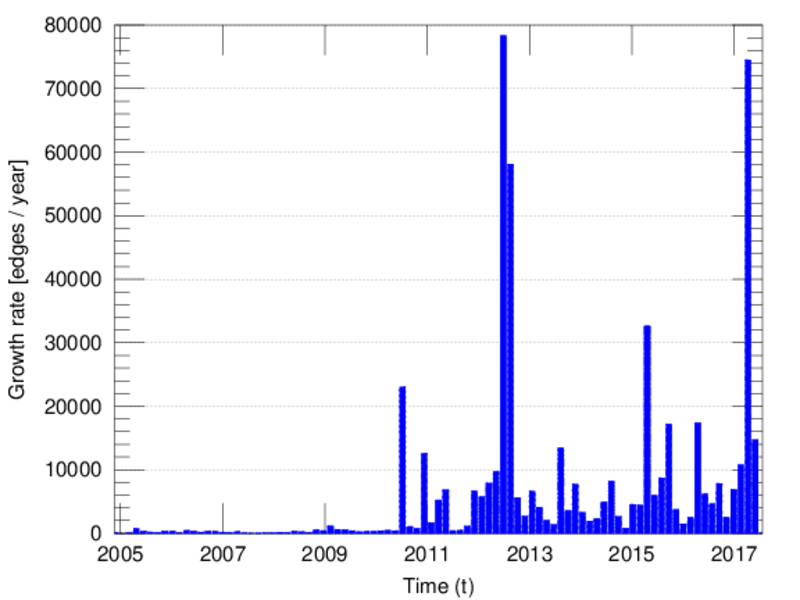
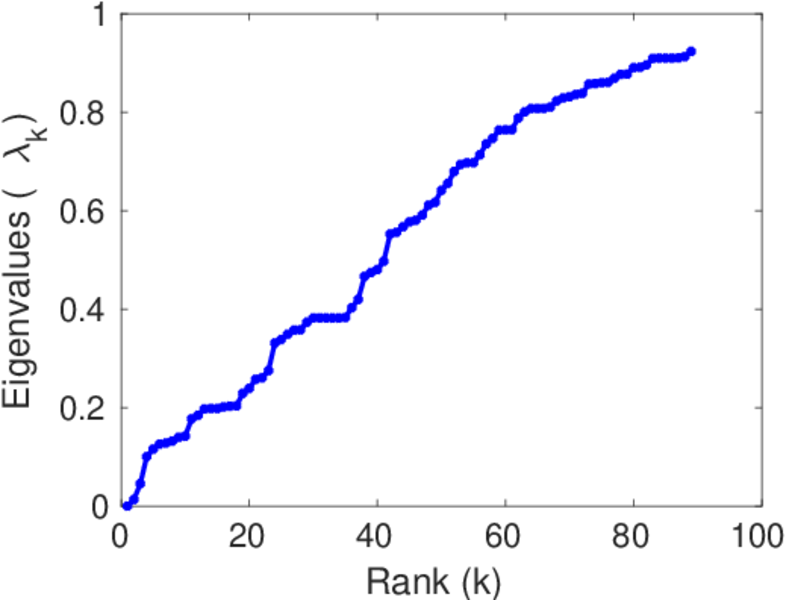
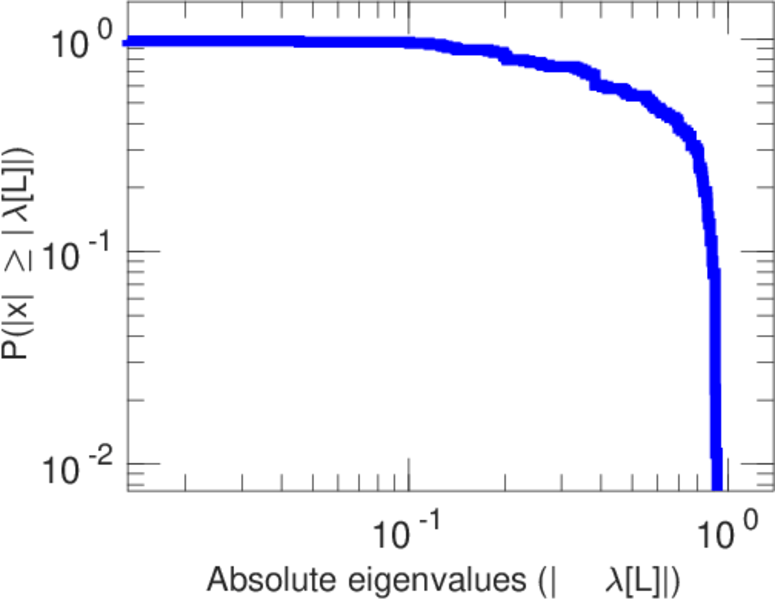
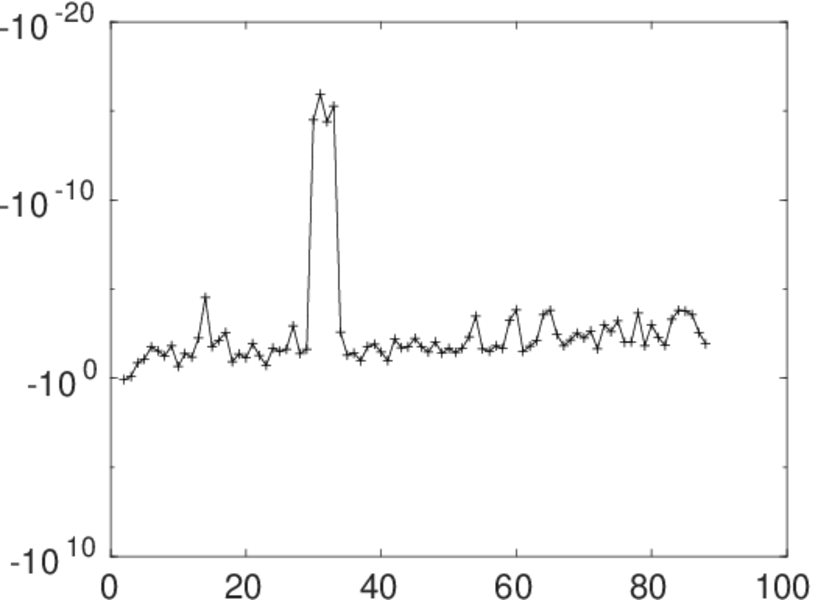
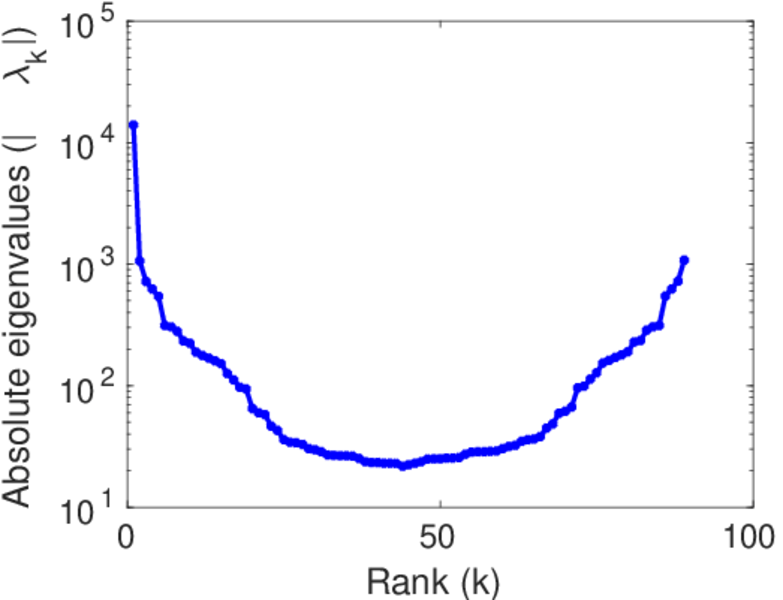
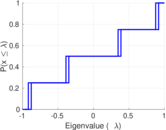
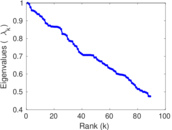
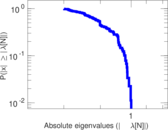
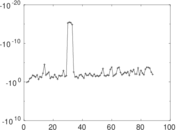
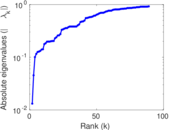
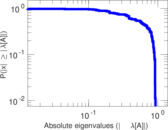
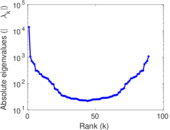
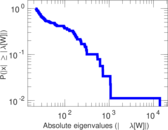
Plots


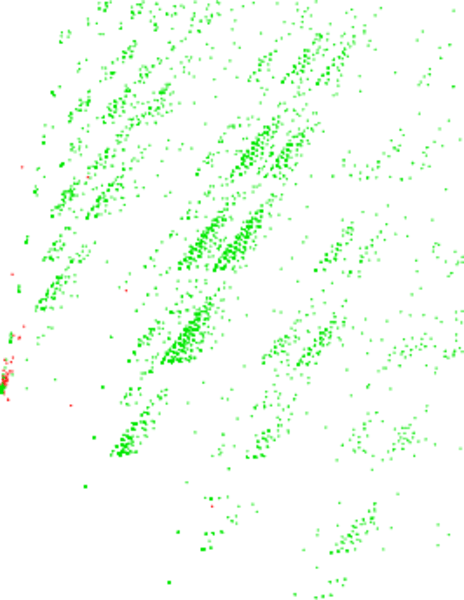
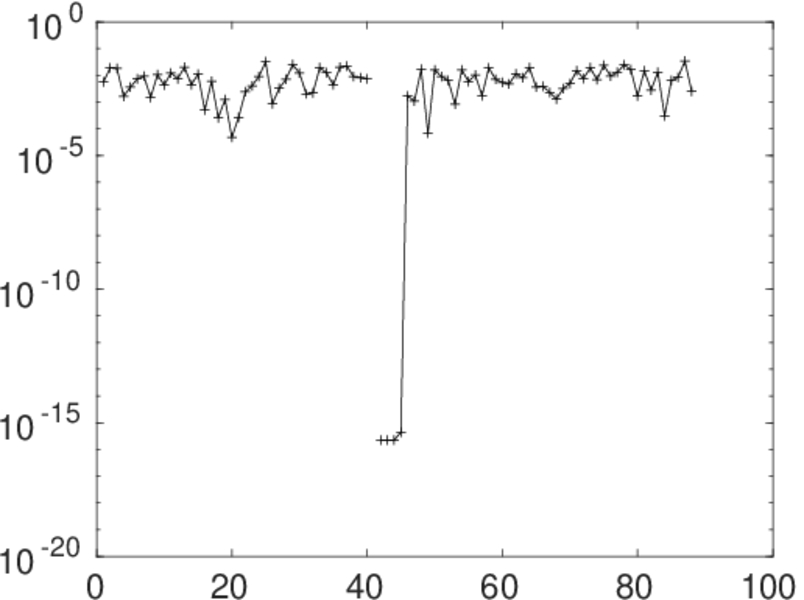
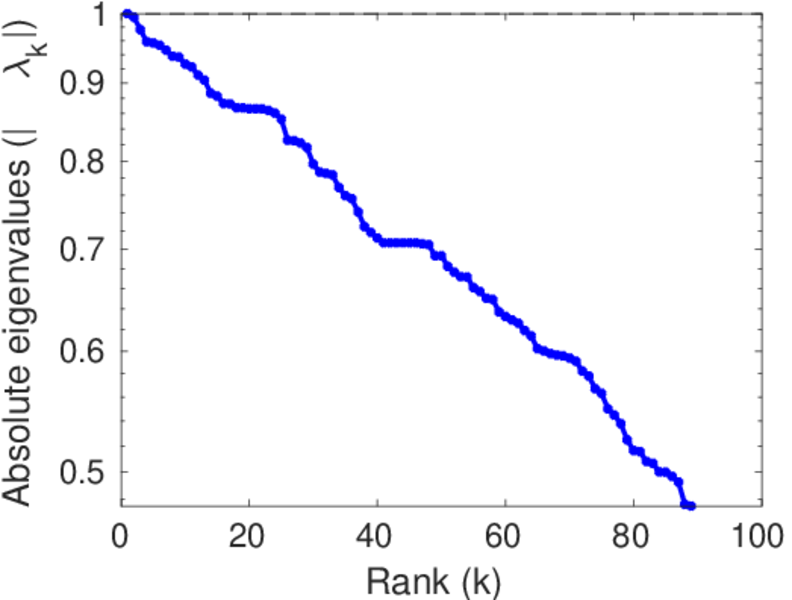
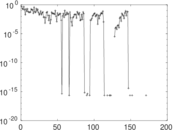
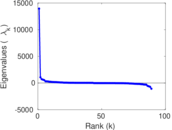
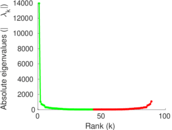
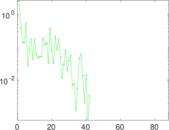
Matrix decompositions plots


Downloads
References
|
[1]
|
Jérôme Kunegis.
KONECT – The Koblenz Network Collection.
In Proc. Int. Conf. on World Wide Web Companion, pages
1343–1350, 2013.
[ http ]
|
|
[2]
|
Wikimedia Foundation.
Wikimedia downloads.
http://dumps.wikimedia.org/, January 2010.
|
 KONECT ‣ Networks ‣
Buy Me a Coffee
KONECT ‣ Networks ‣
Buy Me a Coffee