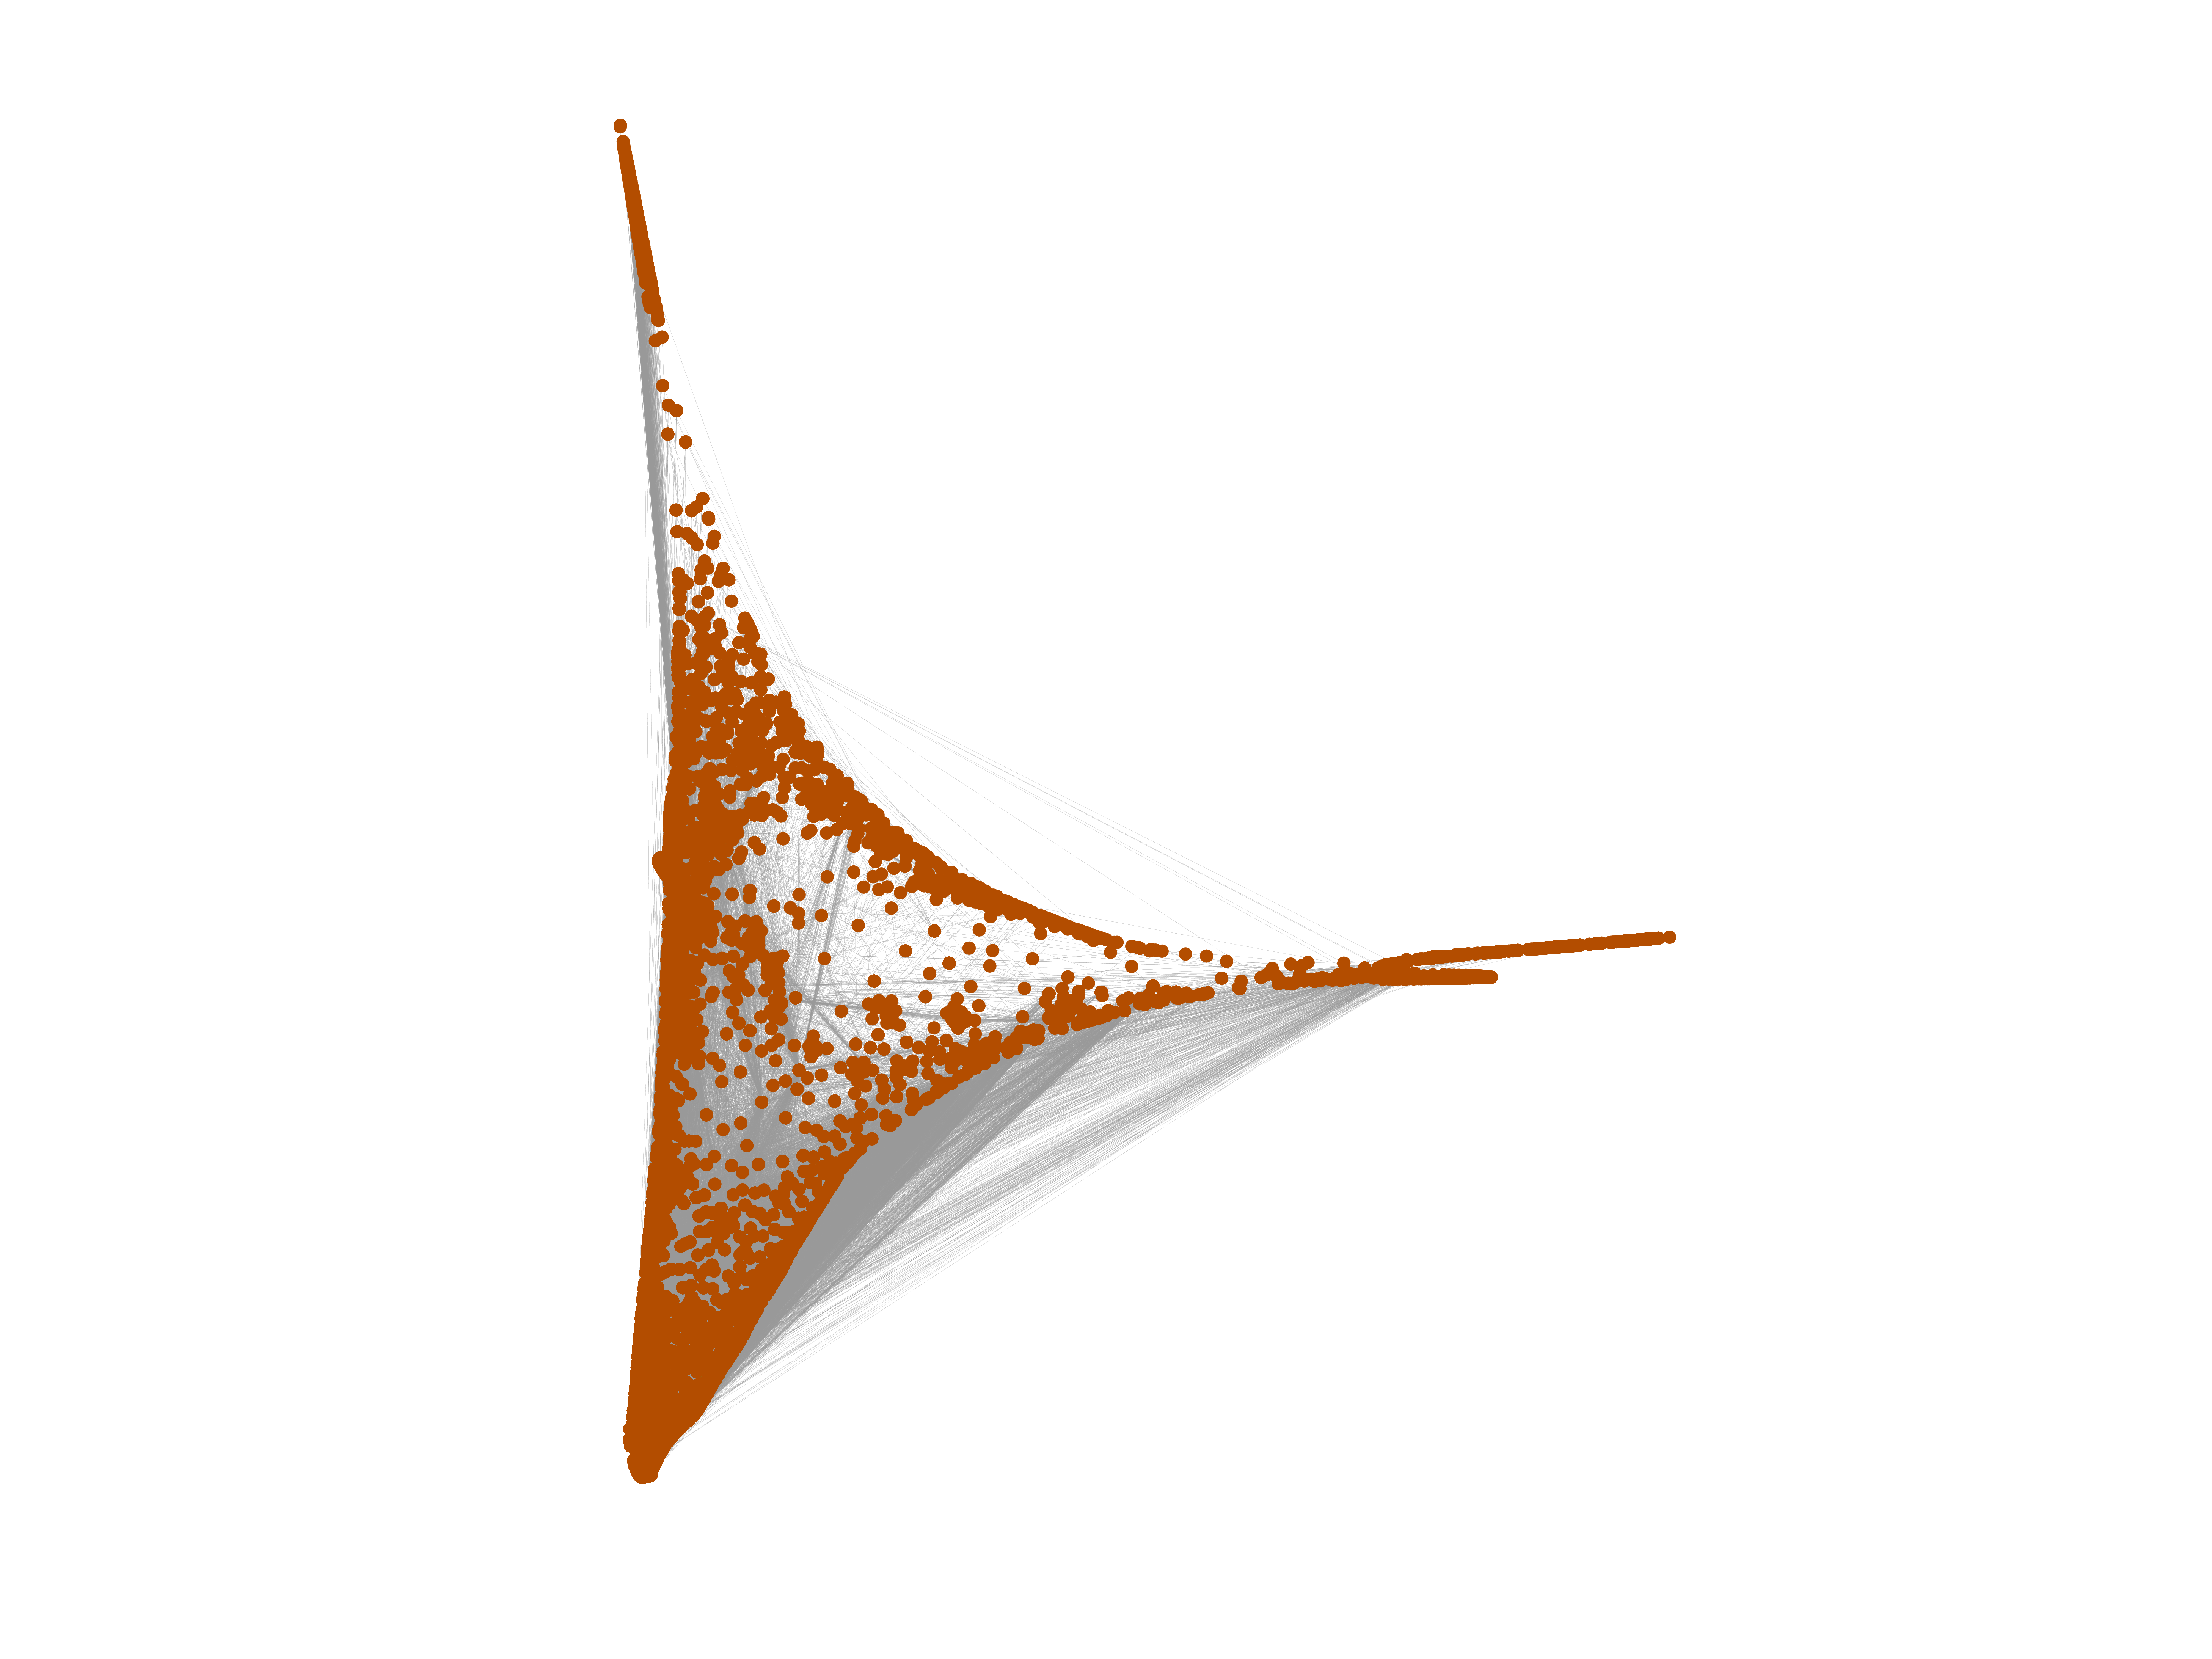
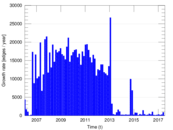
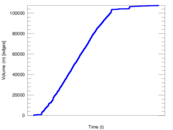
Wikipedia edits (nov)
This is the bipartite edit network of the Novial Wikipedia. It contains users
and pages from the Novial Wikipedia, connected by edit events. Each edge
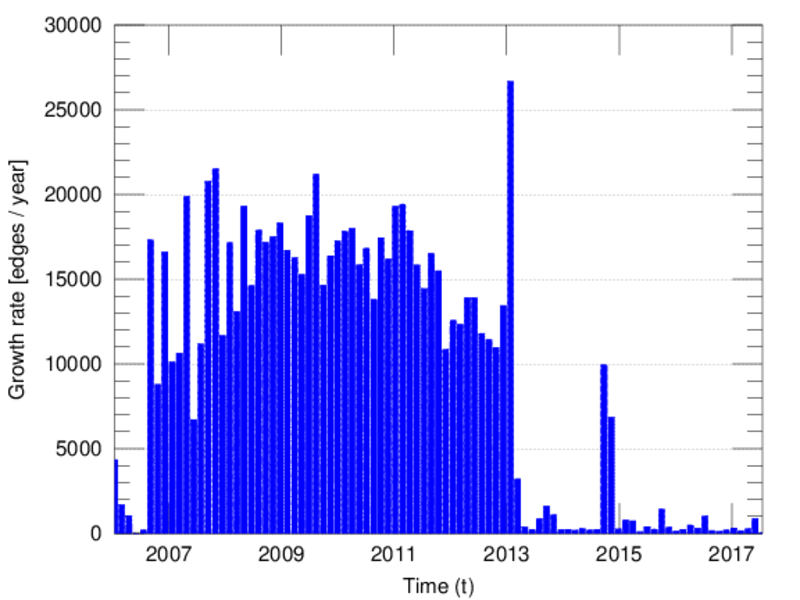
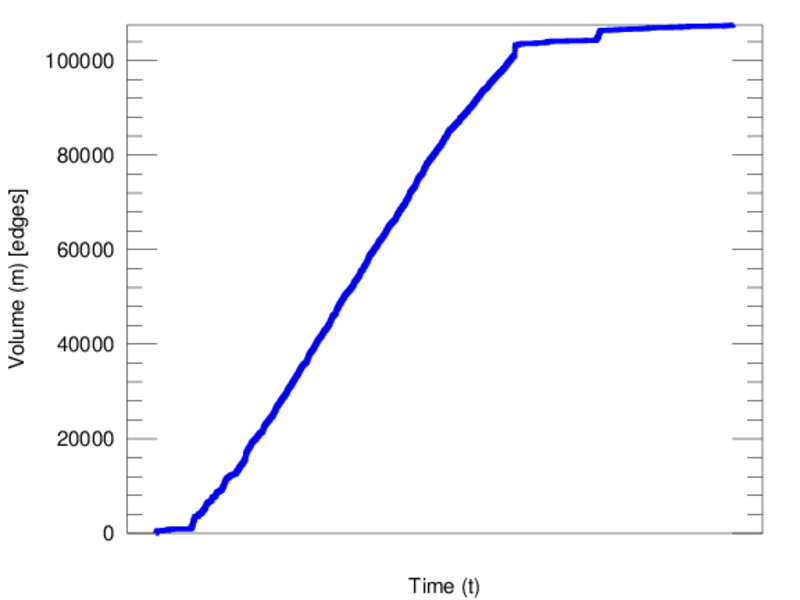
represents an edit. The dataset includes the timestamp of each edit.
Metadata
Statistics
| Size | n = | 5,108
|
| Left size | n1 = | 790
|
| Right size | n2 = | 4,318
|
| Volume | m = | 107,509
|
| Unique edge count | m̿ = | 41,045
|
| Wedge count | s = | 15,327,524
|
| Claw count | z = | 5,127,946,127
|
| Cross count | x = | 1,521,612,819,710
|
| Square count | q = | 85,469,928
|
| 4-Tour count | T4 = | 745,194,722
|
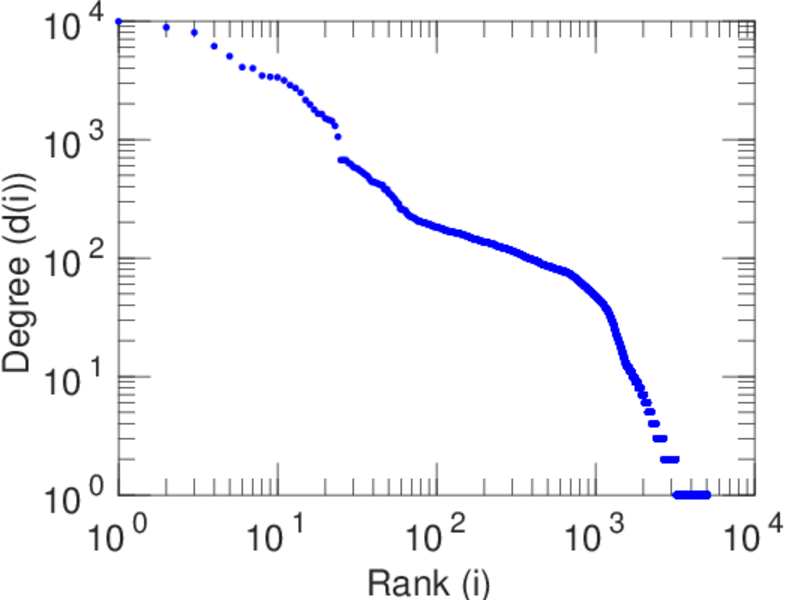
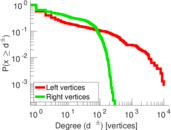
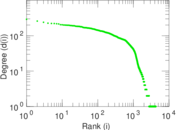
| Maximum degree | dmax = | 9,910
|
| Maximum left degree | d1max = | 9,910
|
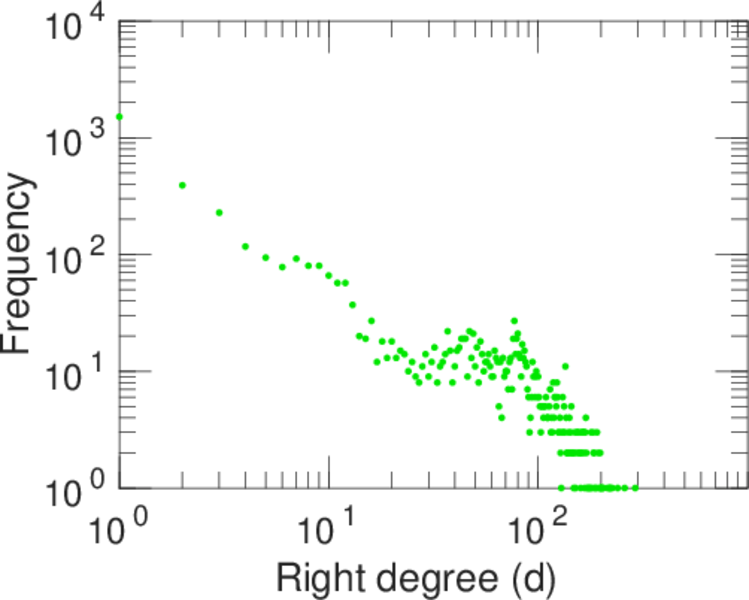
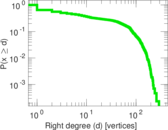
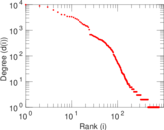
| Maximum right degree | d2max = | 291
|
| Average degree | d = | 42.094 4
|
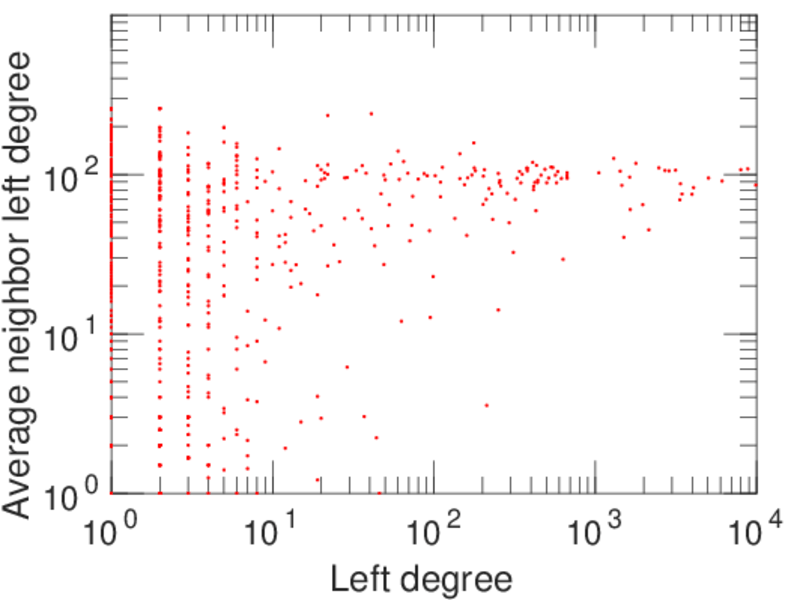
| Average left degree | d1 = | 136.087
|
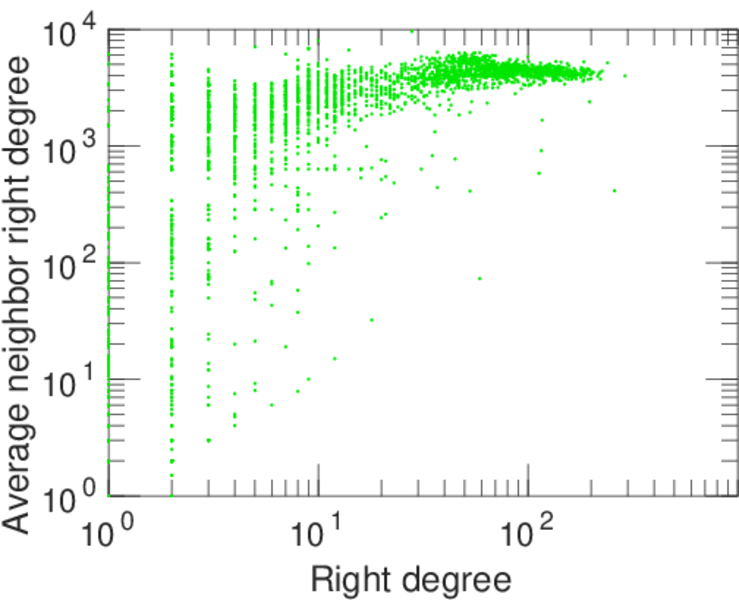
| Average right degree | d2 = | 24.897 9
|
| Fill | p = | 0.012 032 4
|
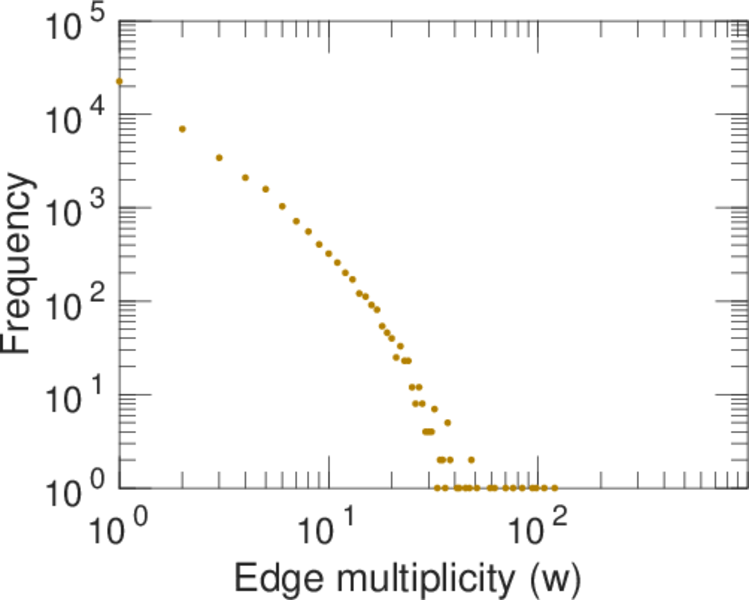
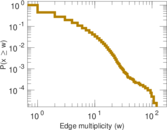
| Average edge multiplicity | m̃ = | 2.619 30
|
| Size of LCC | N = | 4,582
|
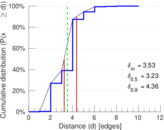
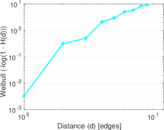
| Diameter | δ = | 12
|
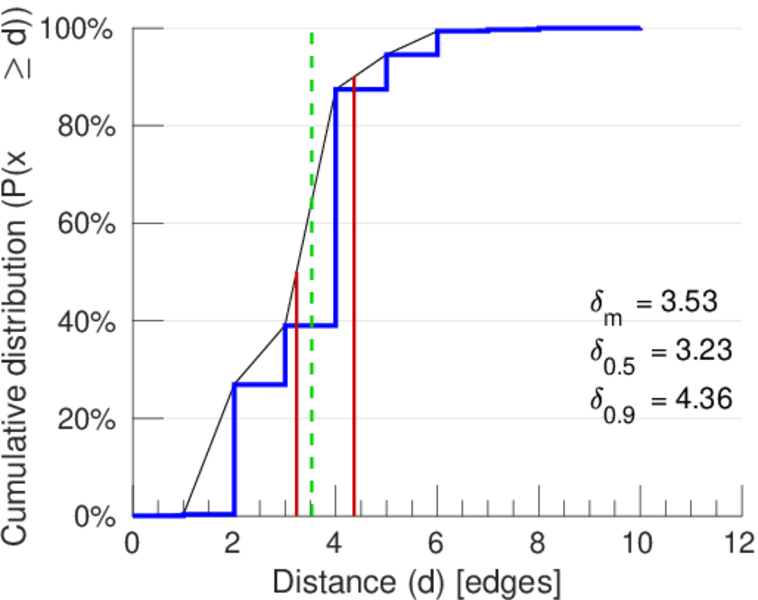
| 50-Percentile effective diameter | δ0.5 = | 3.226 64
|
| 90-Percentile effective diameter | δ0.9 = | 4.362 10
|
| Median distance | δM = | 4
|
| Mean distance | δm = | 3.527 41
|
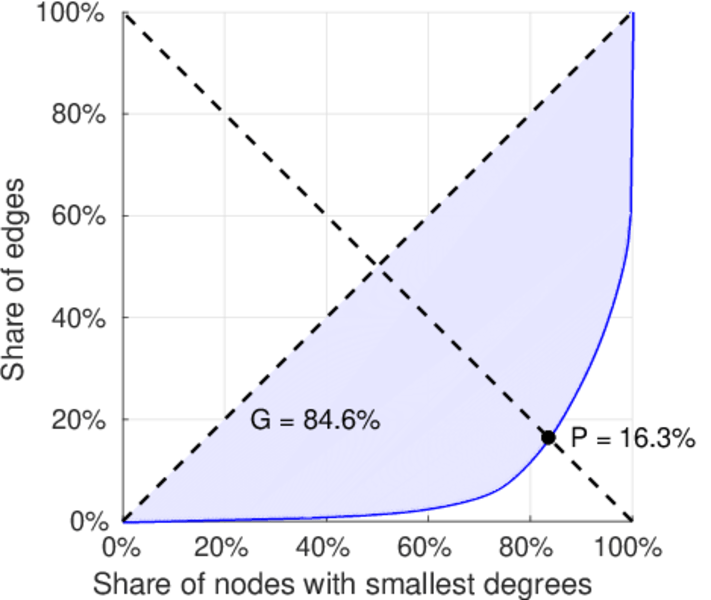
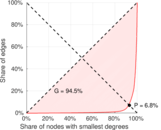
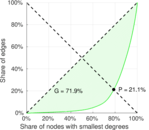
| Gini coefficient | G = | 0.839 068
|
| Balanced inequality ratio | P = | 0.166 991
|
| Left balanced inequality ratio | P1 = | 0.067 538 5
|
| Right balanced inequality ratio | P2 = | 0.210 773
|
| Relative edge distribution entropy | Her = | 0.790 350
|
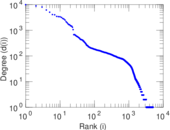
| Power law exponent | γ = | 1.780 25
|
| Tail power law exponent | γt = | 1.561 00
|
| Tail power law exponent with p | γ3 = | 1.561 00
|
| p-value | p = | 0.000 00
|
| Left tail power law exponent with p | γ3,1 = | 1.601 00
|
| Left p-value | p1 = | 0.000 00
|
| Right tail power law exponent with p | γ3,2 = | 8.911 00
|
| Right p-value | p2 = | 0.063 000 0
|
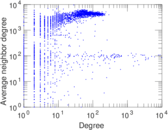
| Degree assortativity | ρ = | −0.096 673 5
|
| Degree assortativity p-value | pρ = | 8.401 10 × 10−86
|
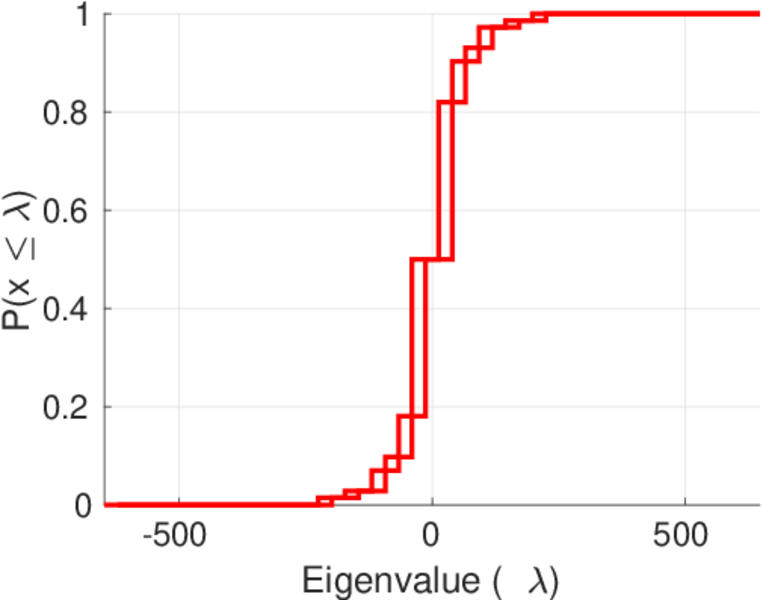
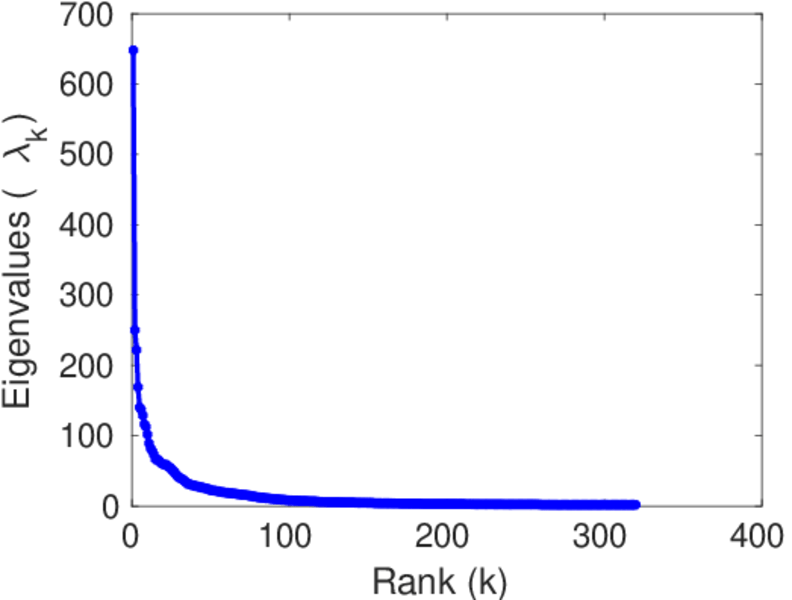
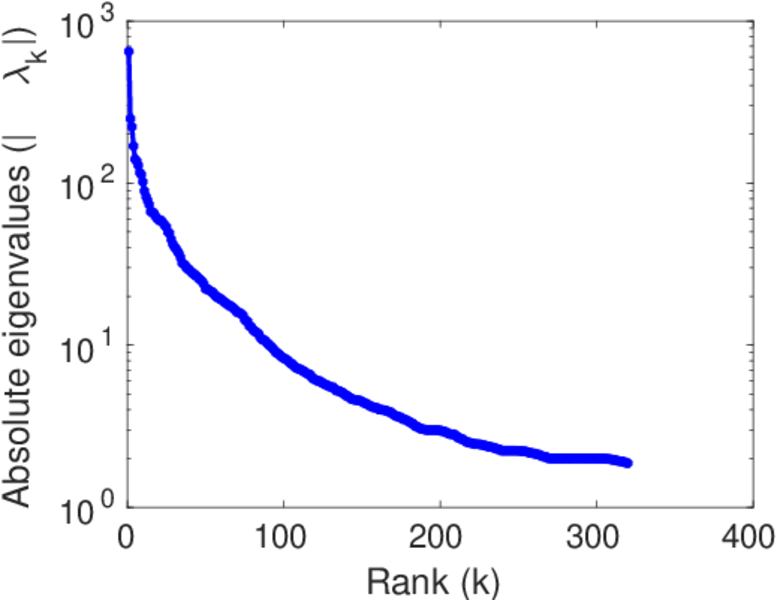
| Spectral norm | α = | 648.059
|
| Algebraic connectivity | a = | 0.030 529 2
|
| Spectral separation | |λ1[A] / λ2[A]| = | 2.590 36
|
| Controllability | C = | 3,610
|
| Relative controllability | Cr = | 0.712 875
|
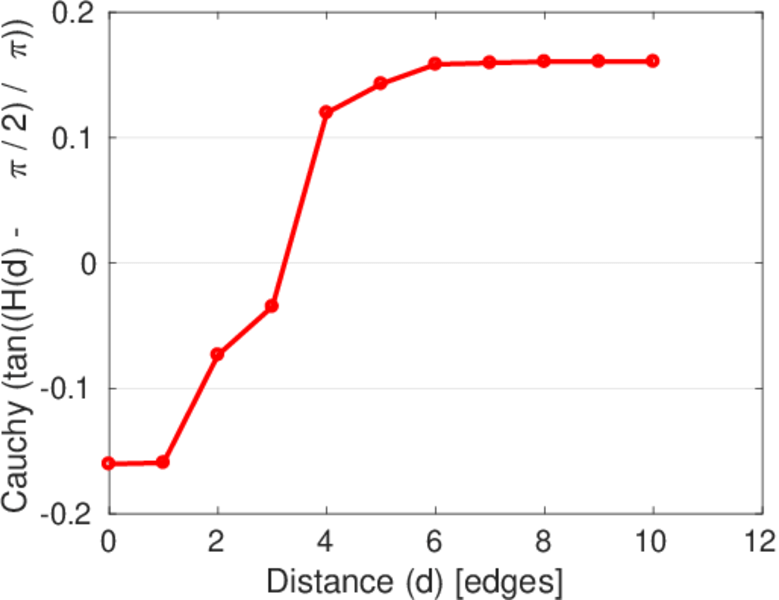
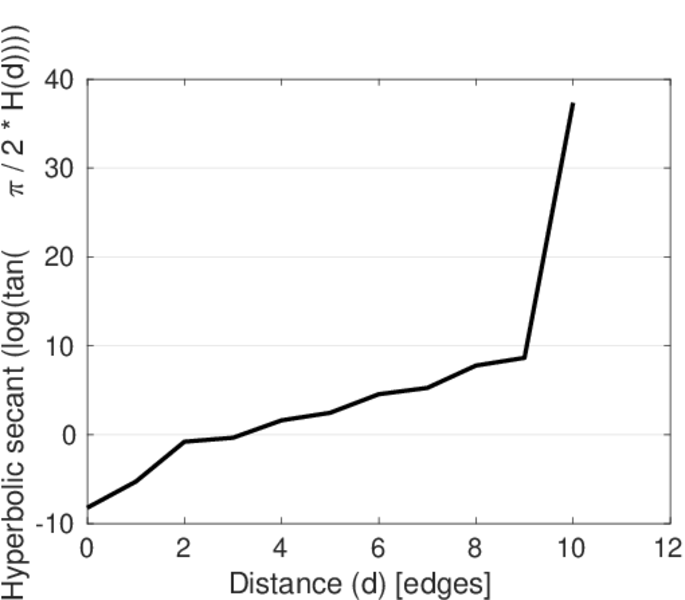
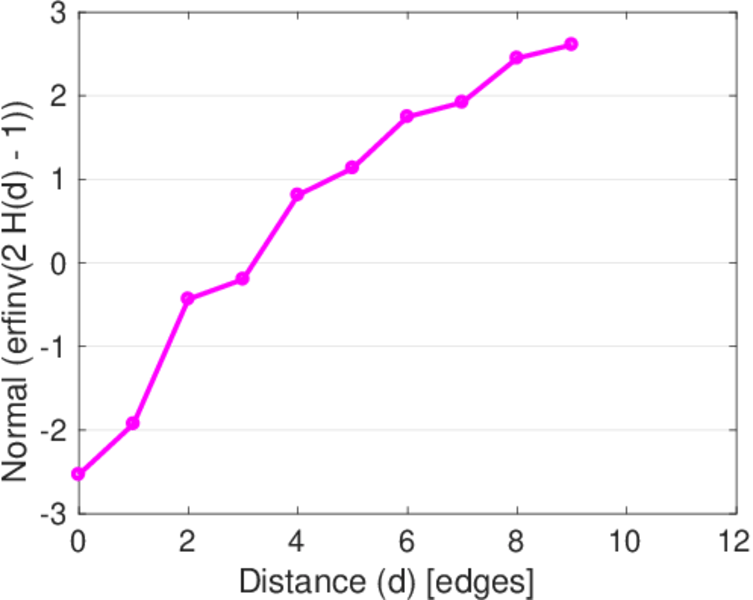
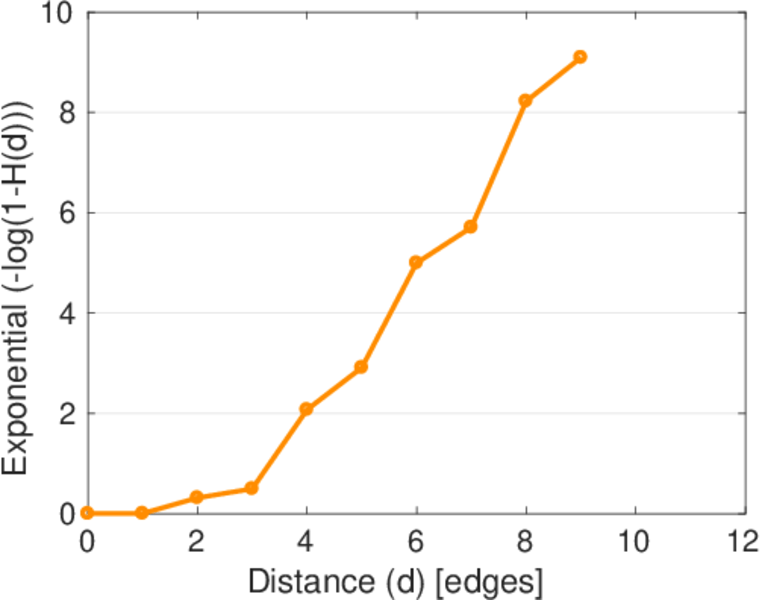
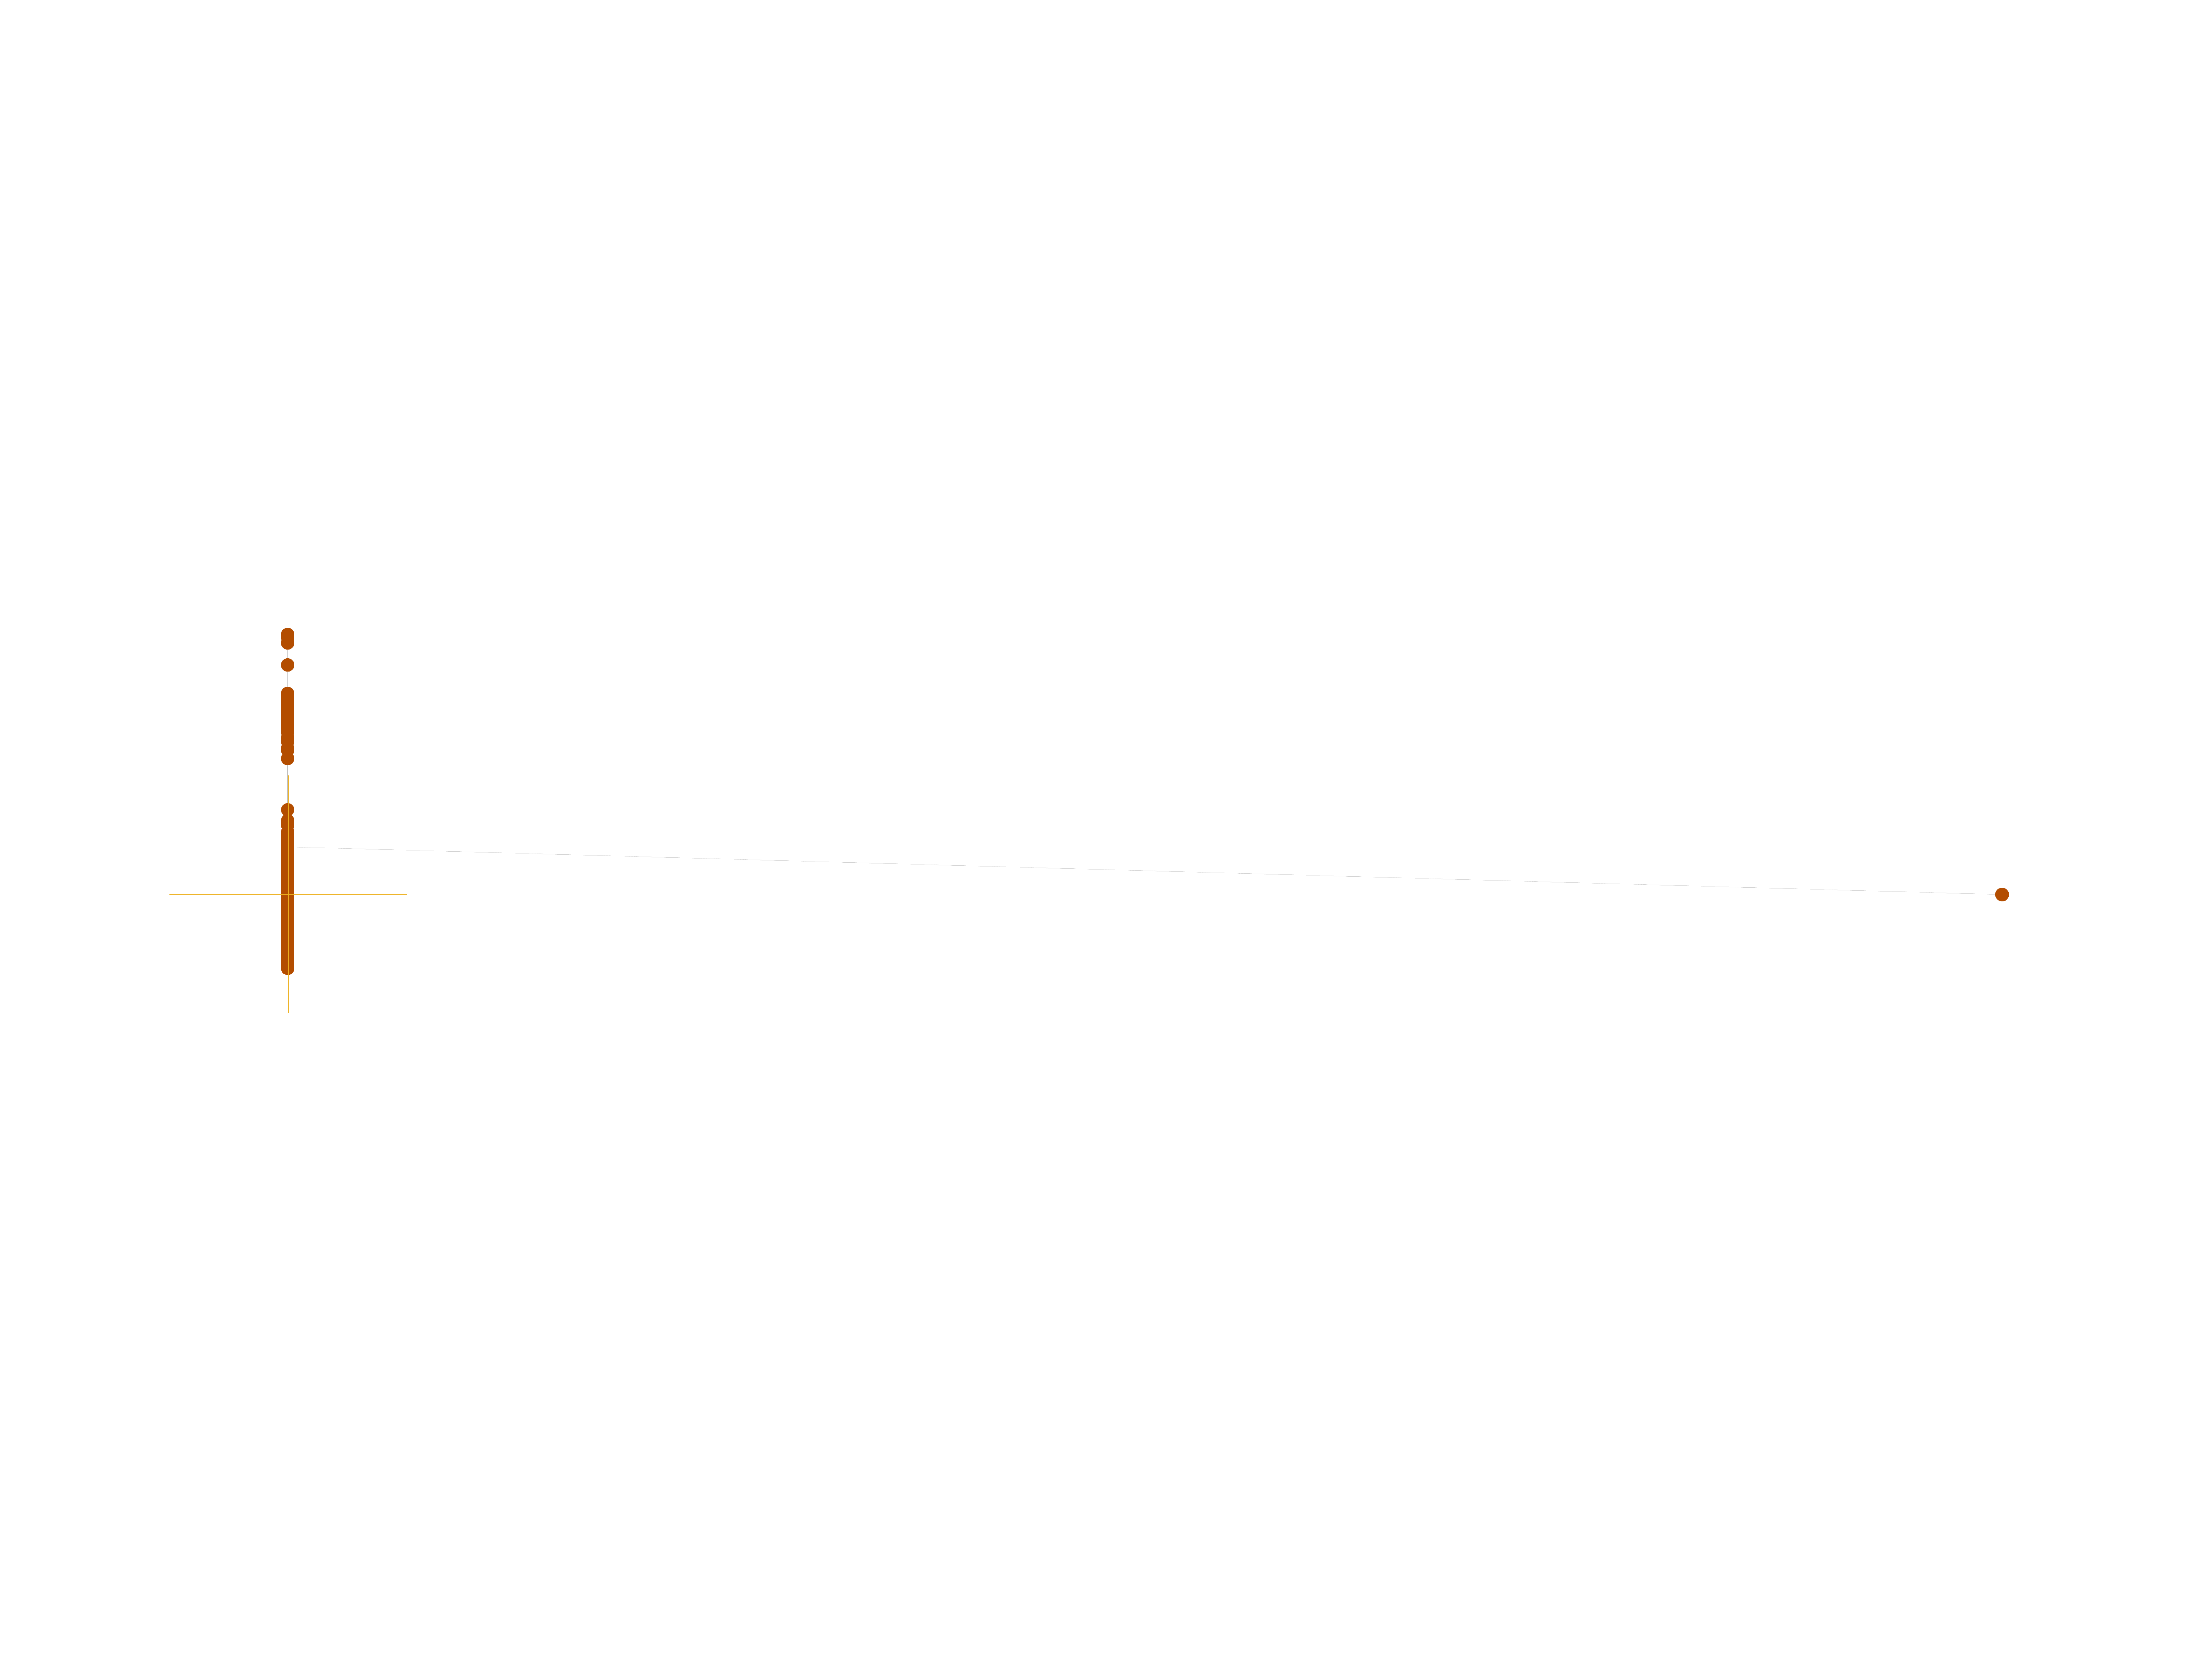
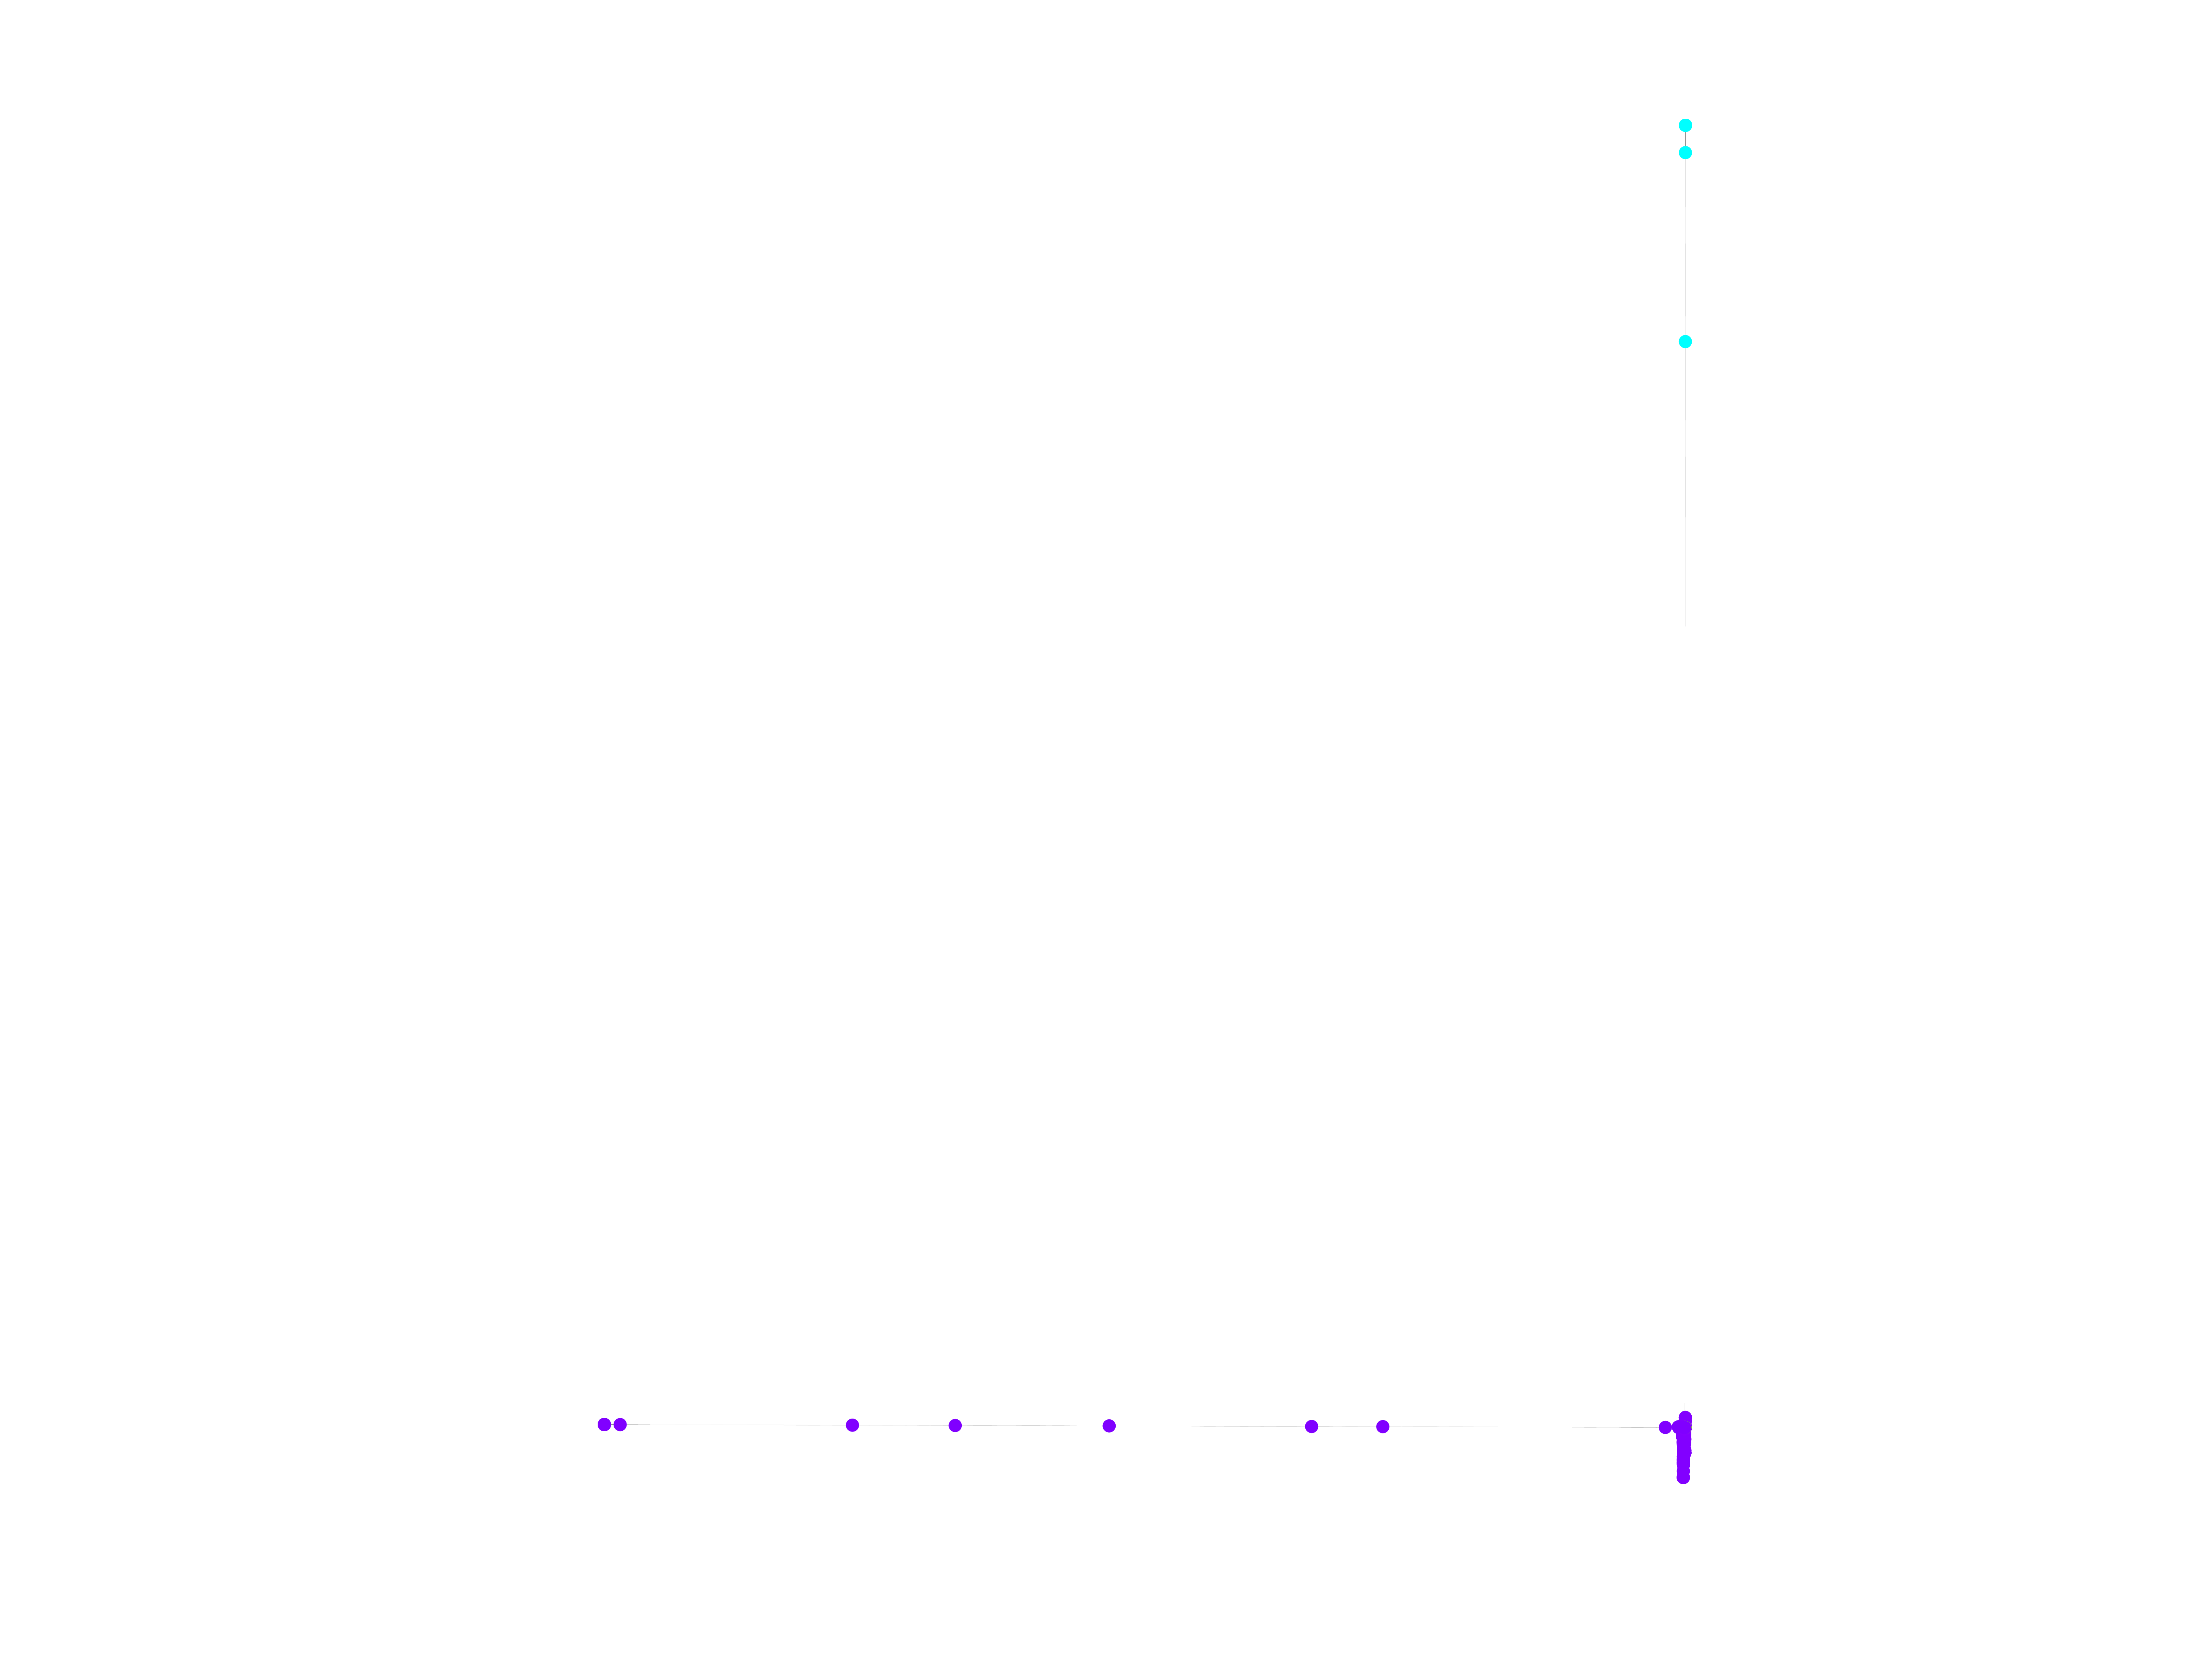
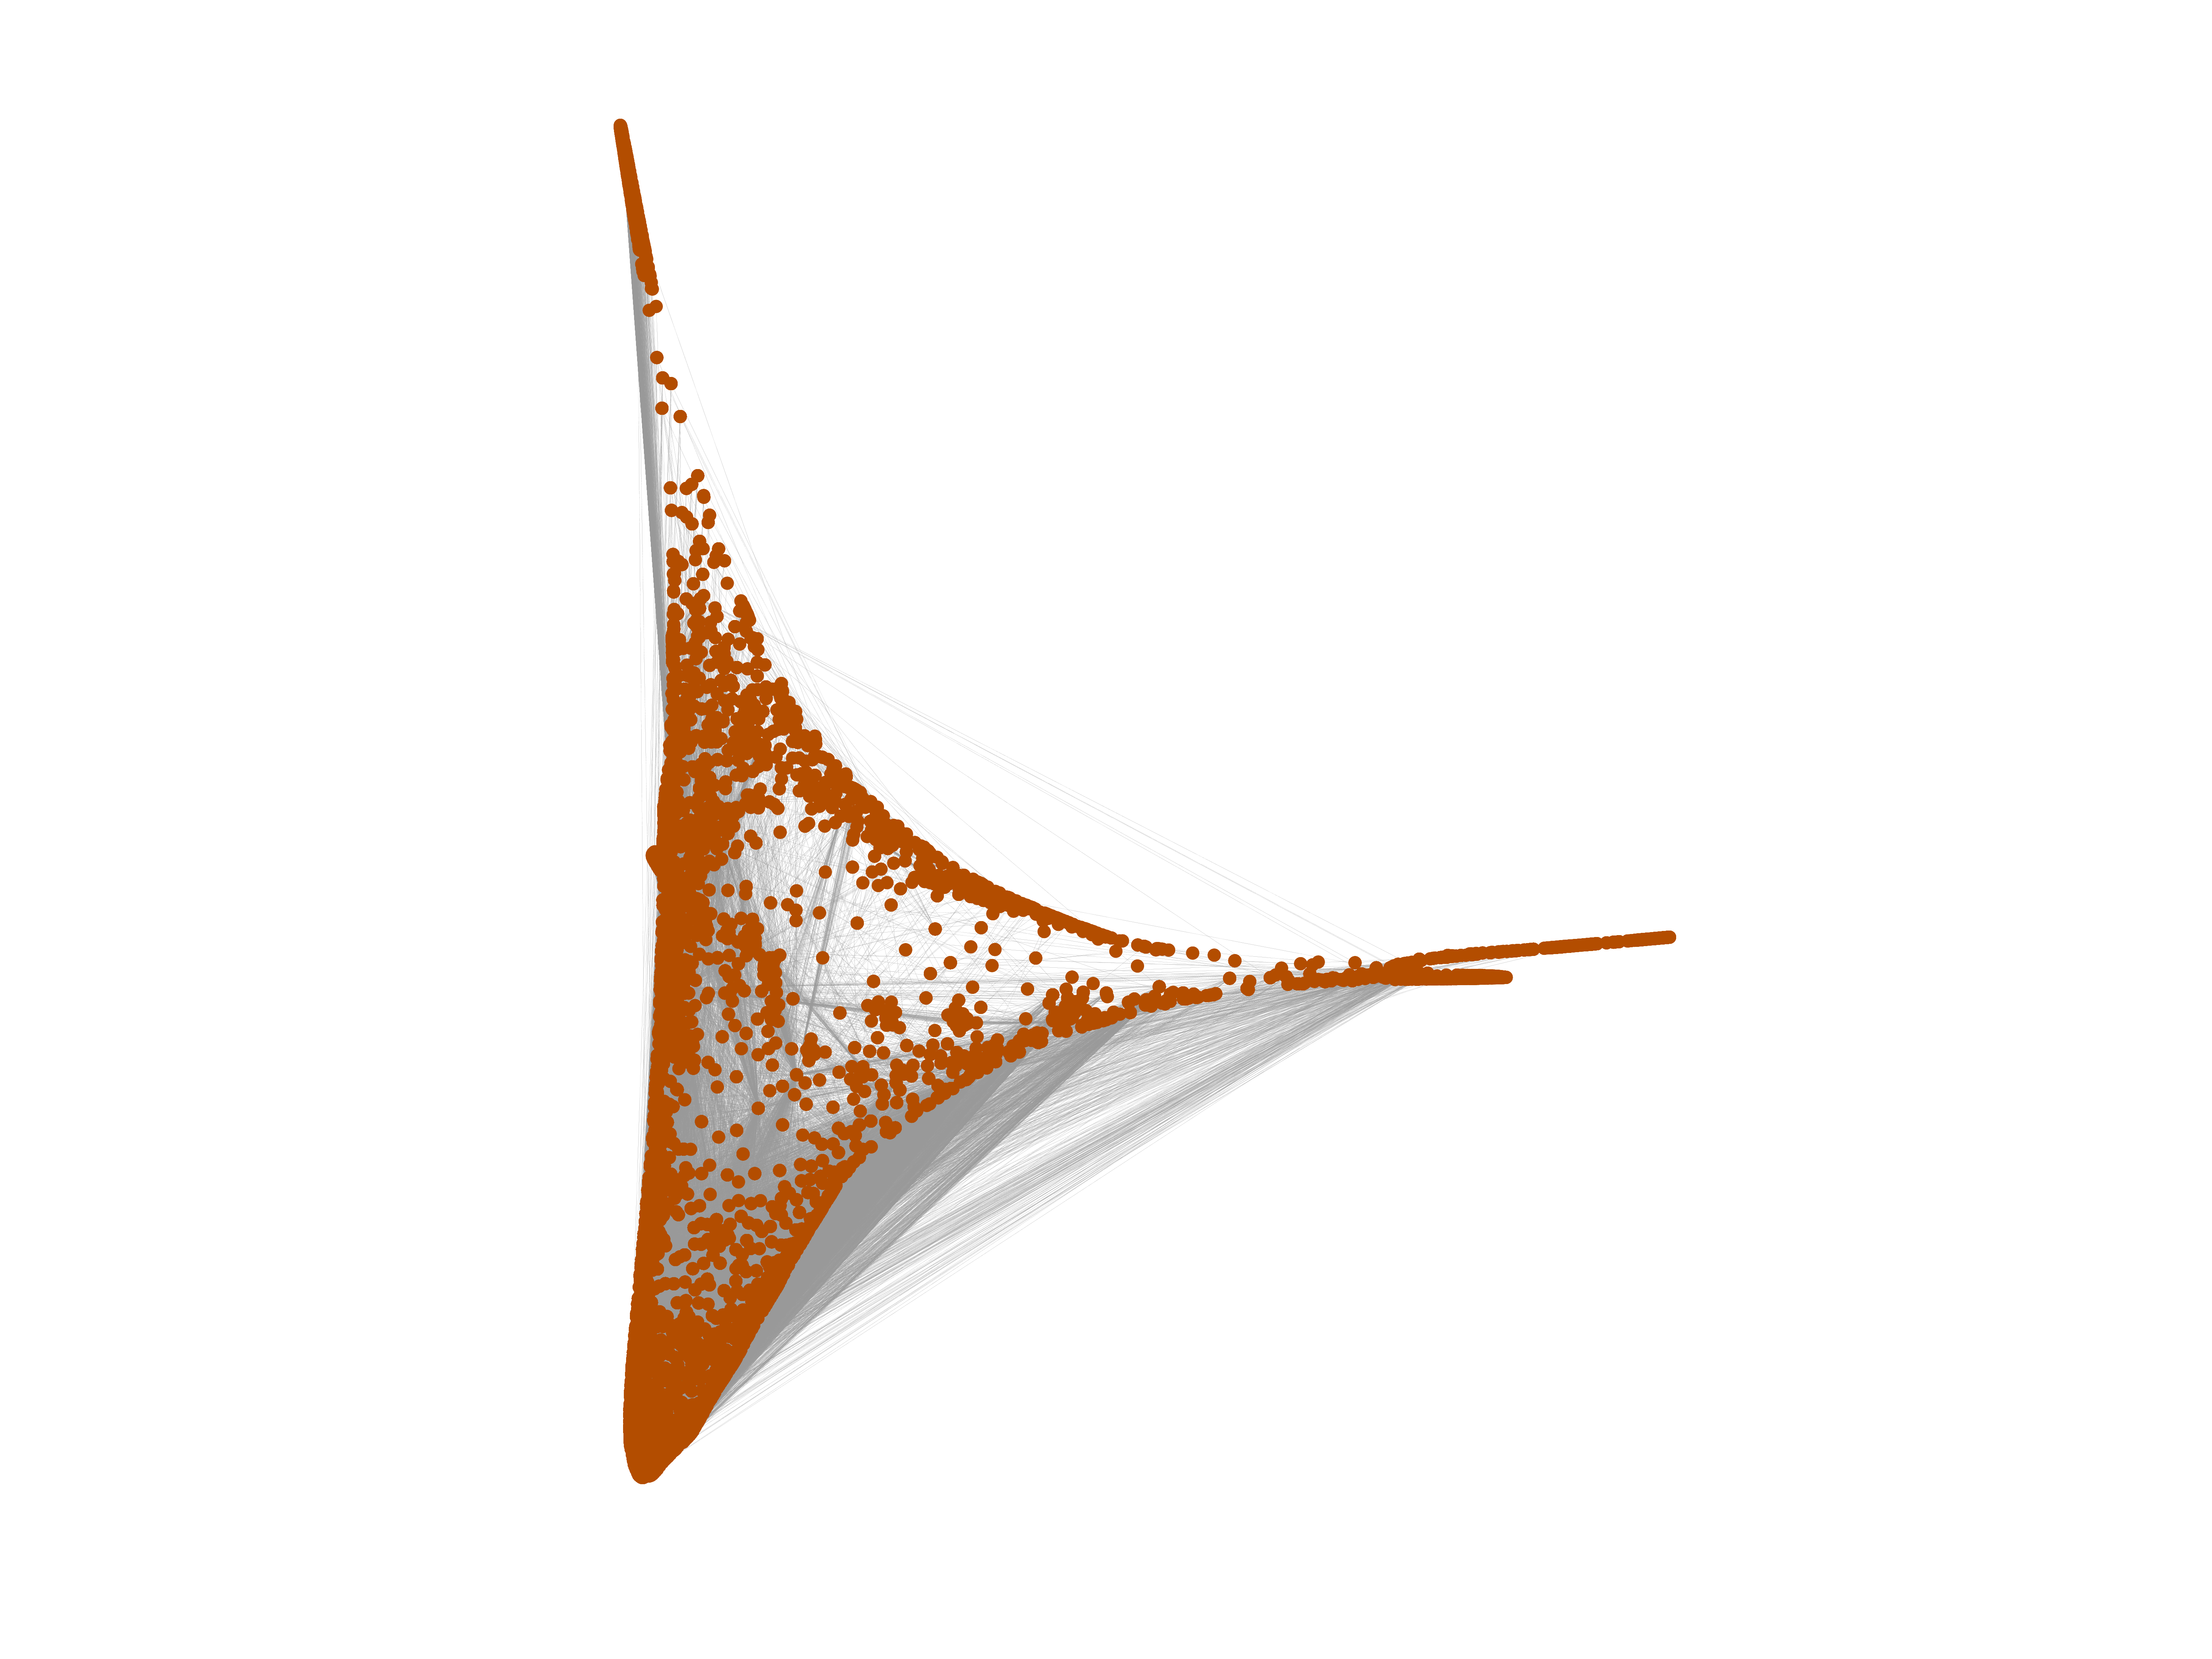
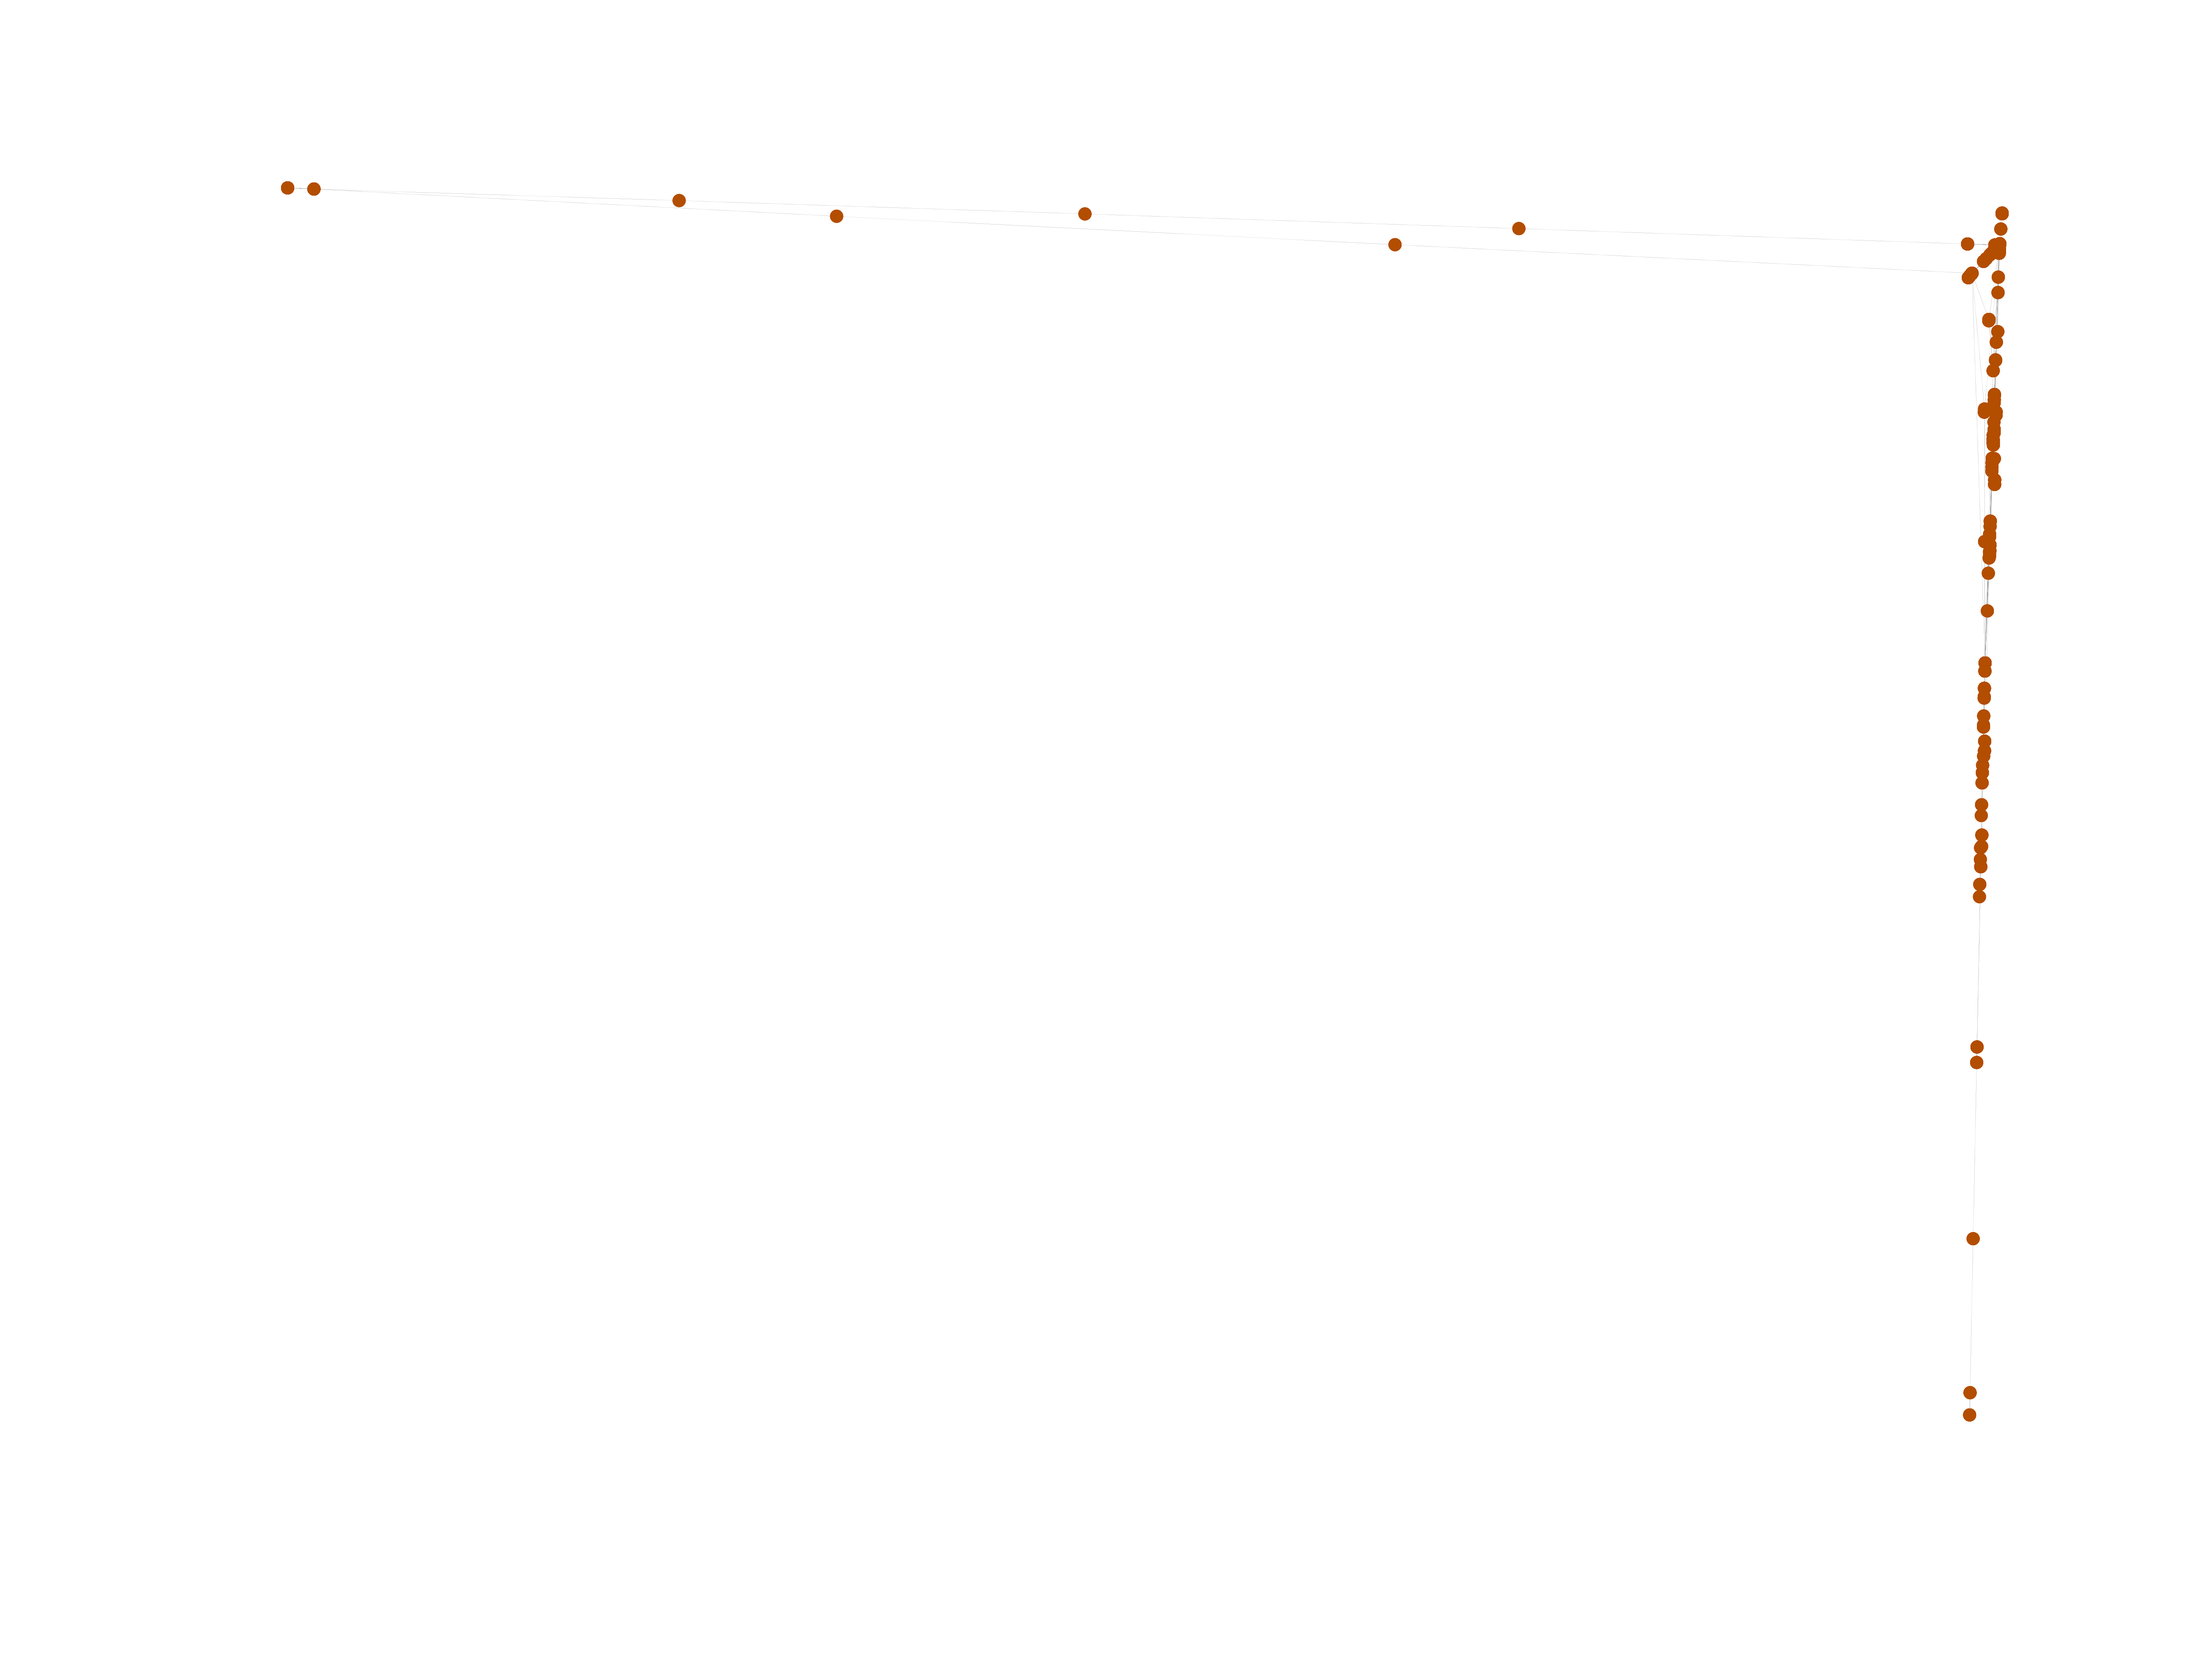
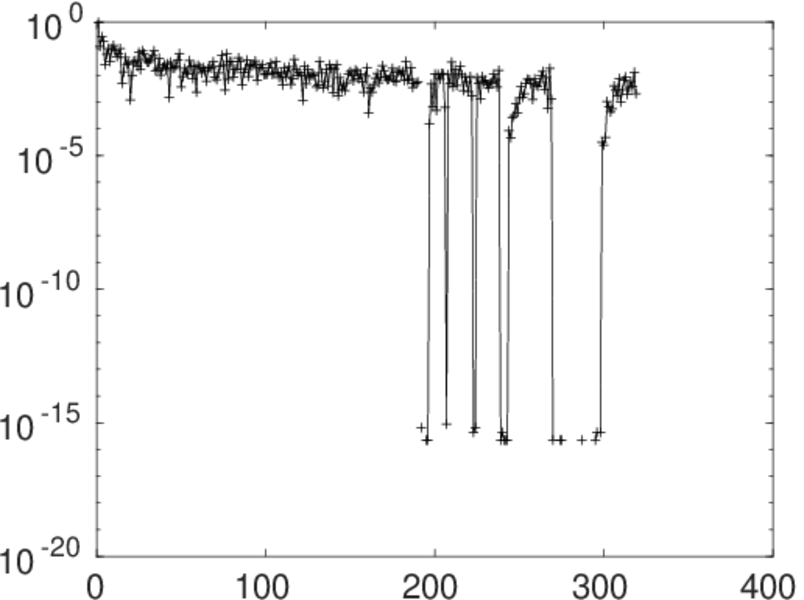
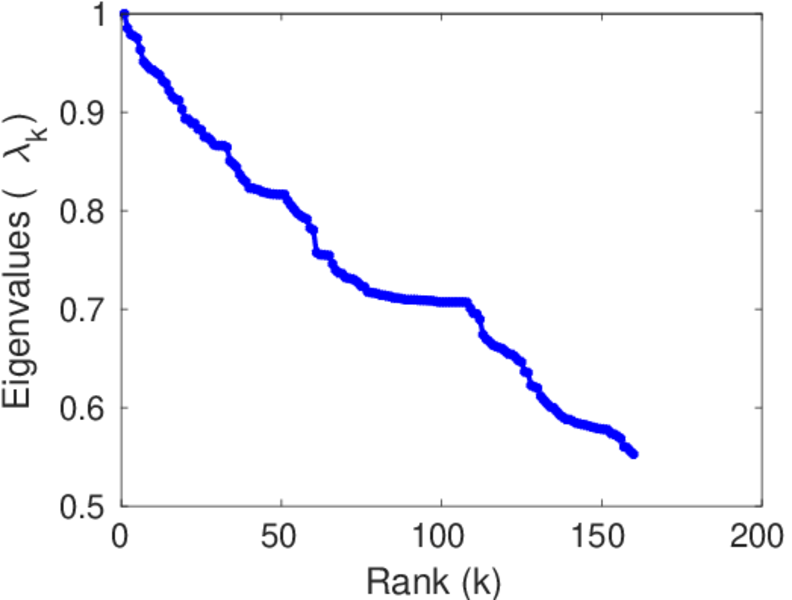
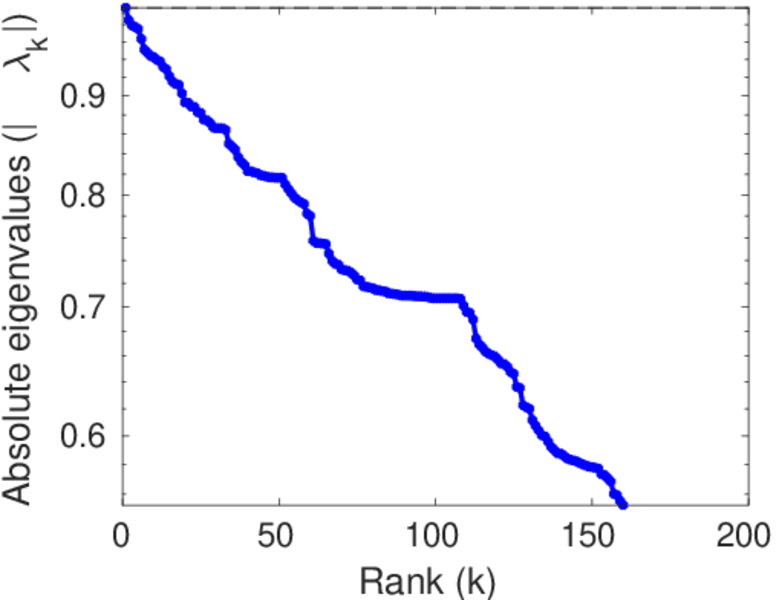
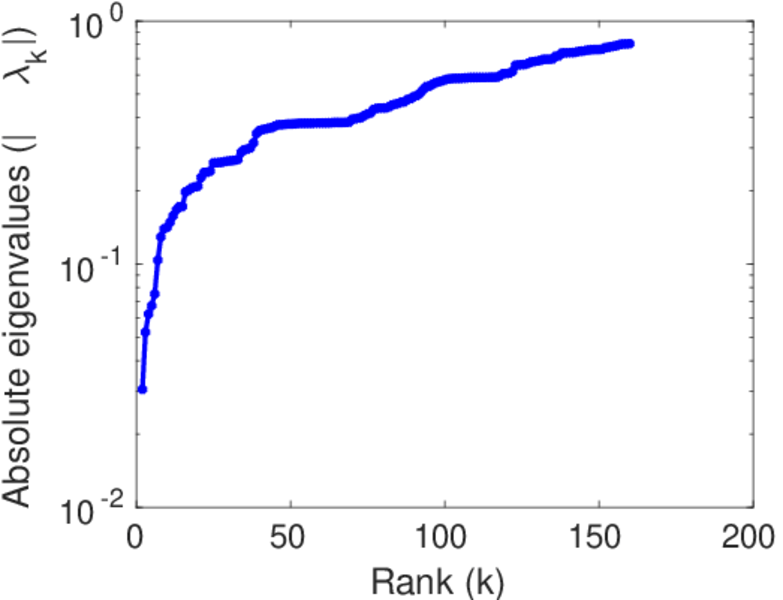
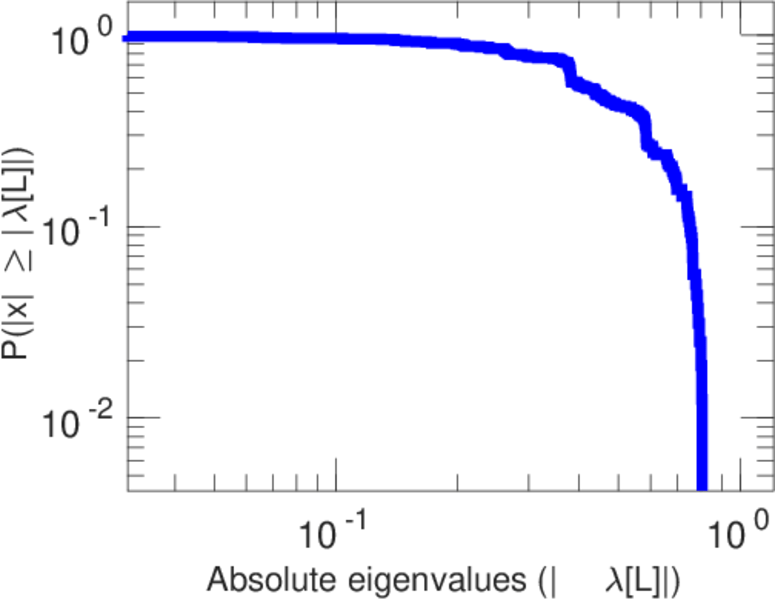
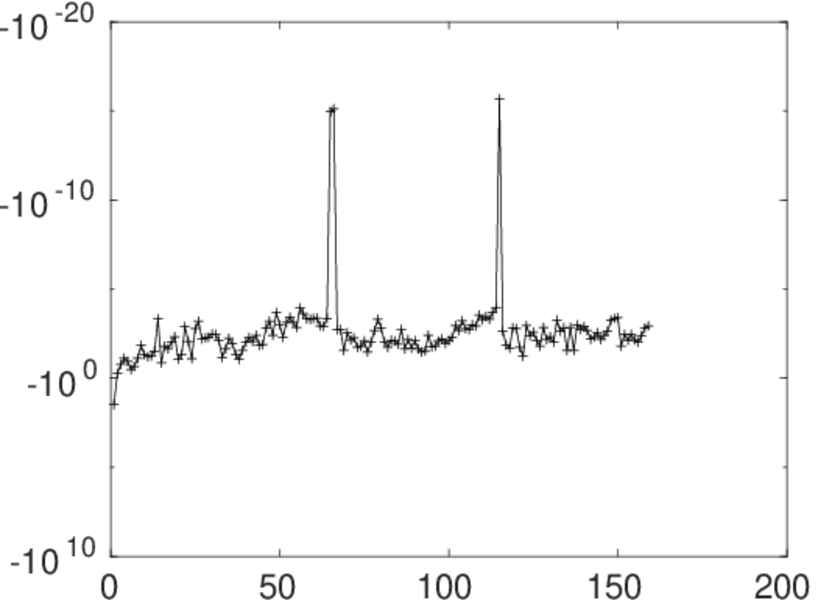
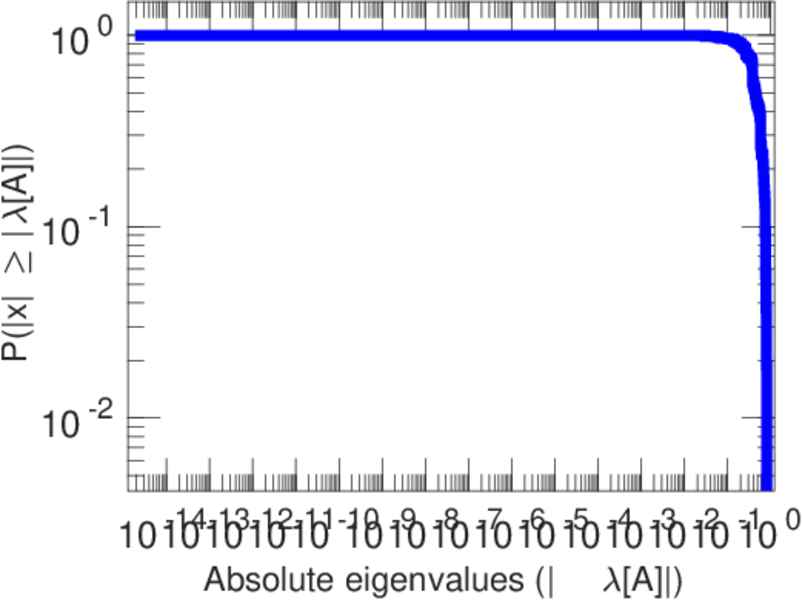
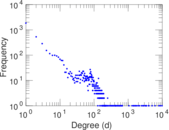
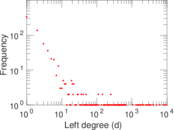
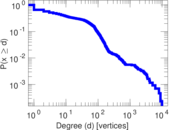
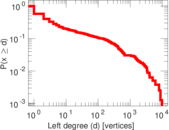
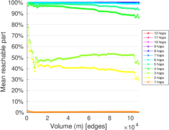
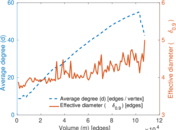
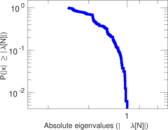
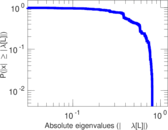
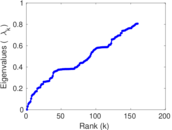
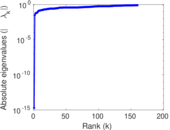
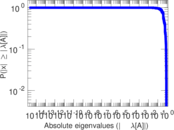
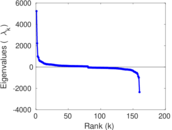
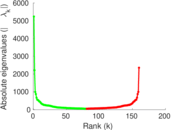
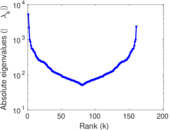
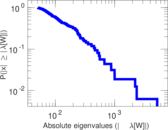
Plots


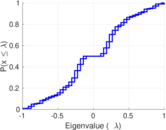
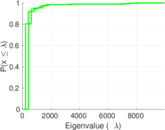
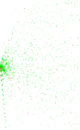
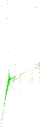


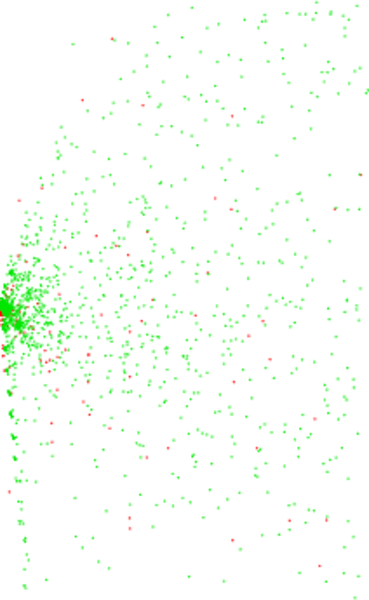
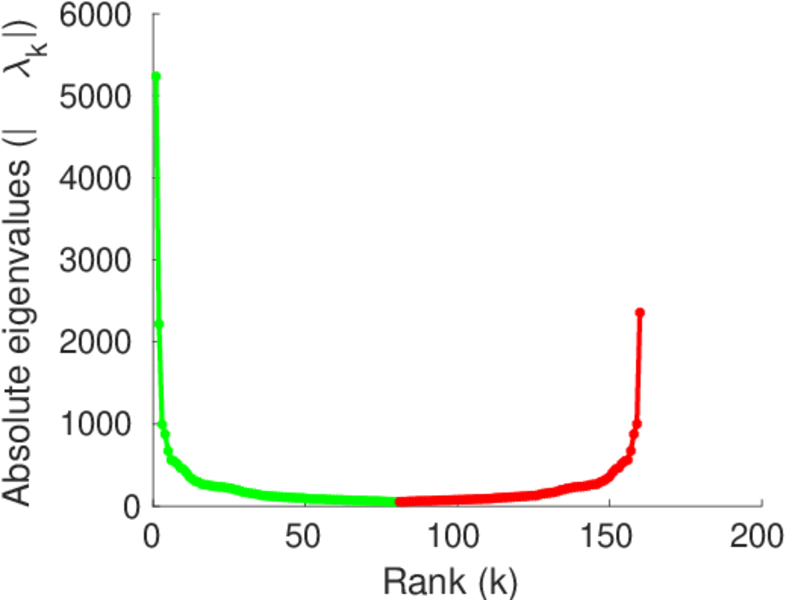
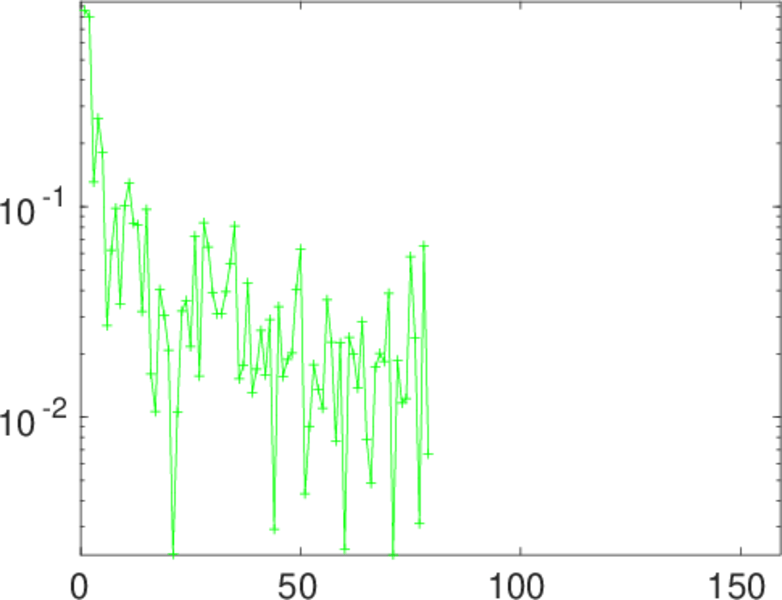
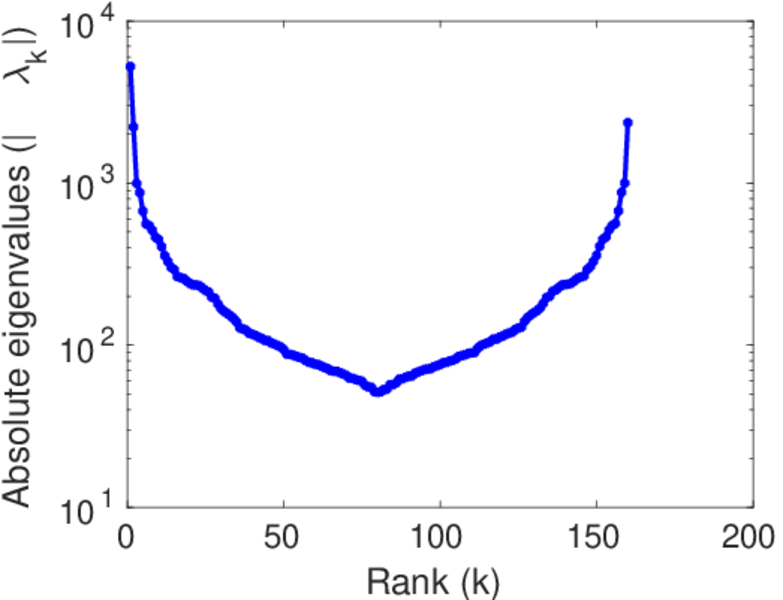
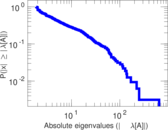
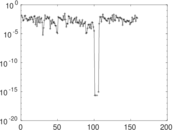
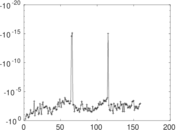
Matrix decompositions plots


Downloads
References
|
[1]
|
Jérôme Kunegis.
KONECT – The Koblenz Network Collection.
In Proc. Int. Conf. on World Wide Web Companion, pages
1343–1350, 2013.
[ http ]
|
|
[2]
|
Wikimedia Foundation.
Wikimedia downloads.
http://dumps.wikimedia.org/, January 2010.
|
 KONECT ‣ Networks ‣
Buy Me a Coffee
KONECT ‣ Networks ‣
Buy Me a Coffee