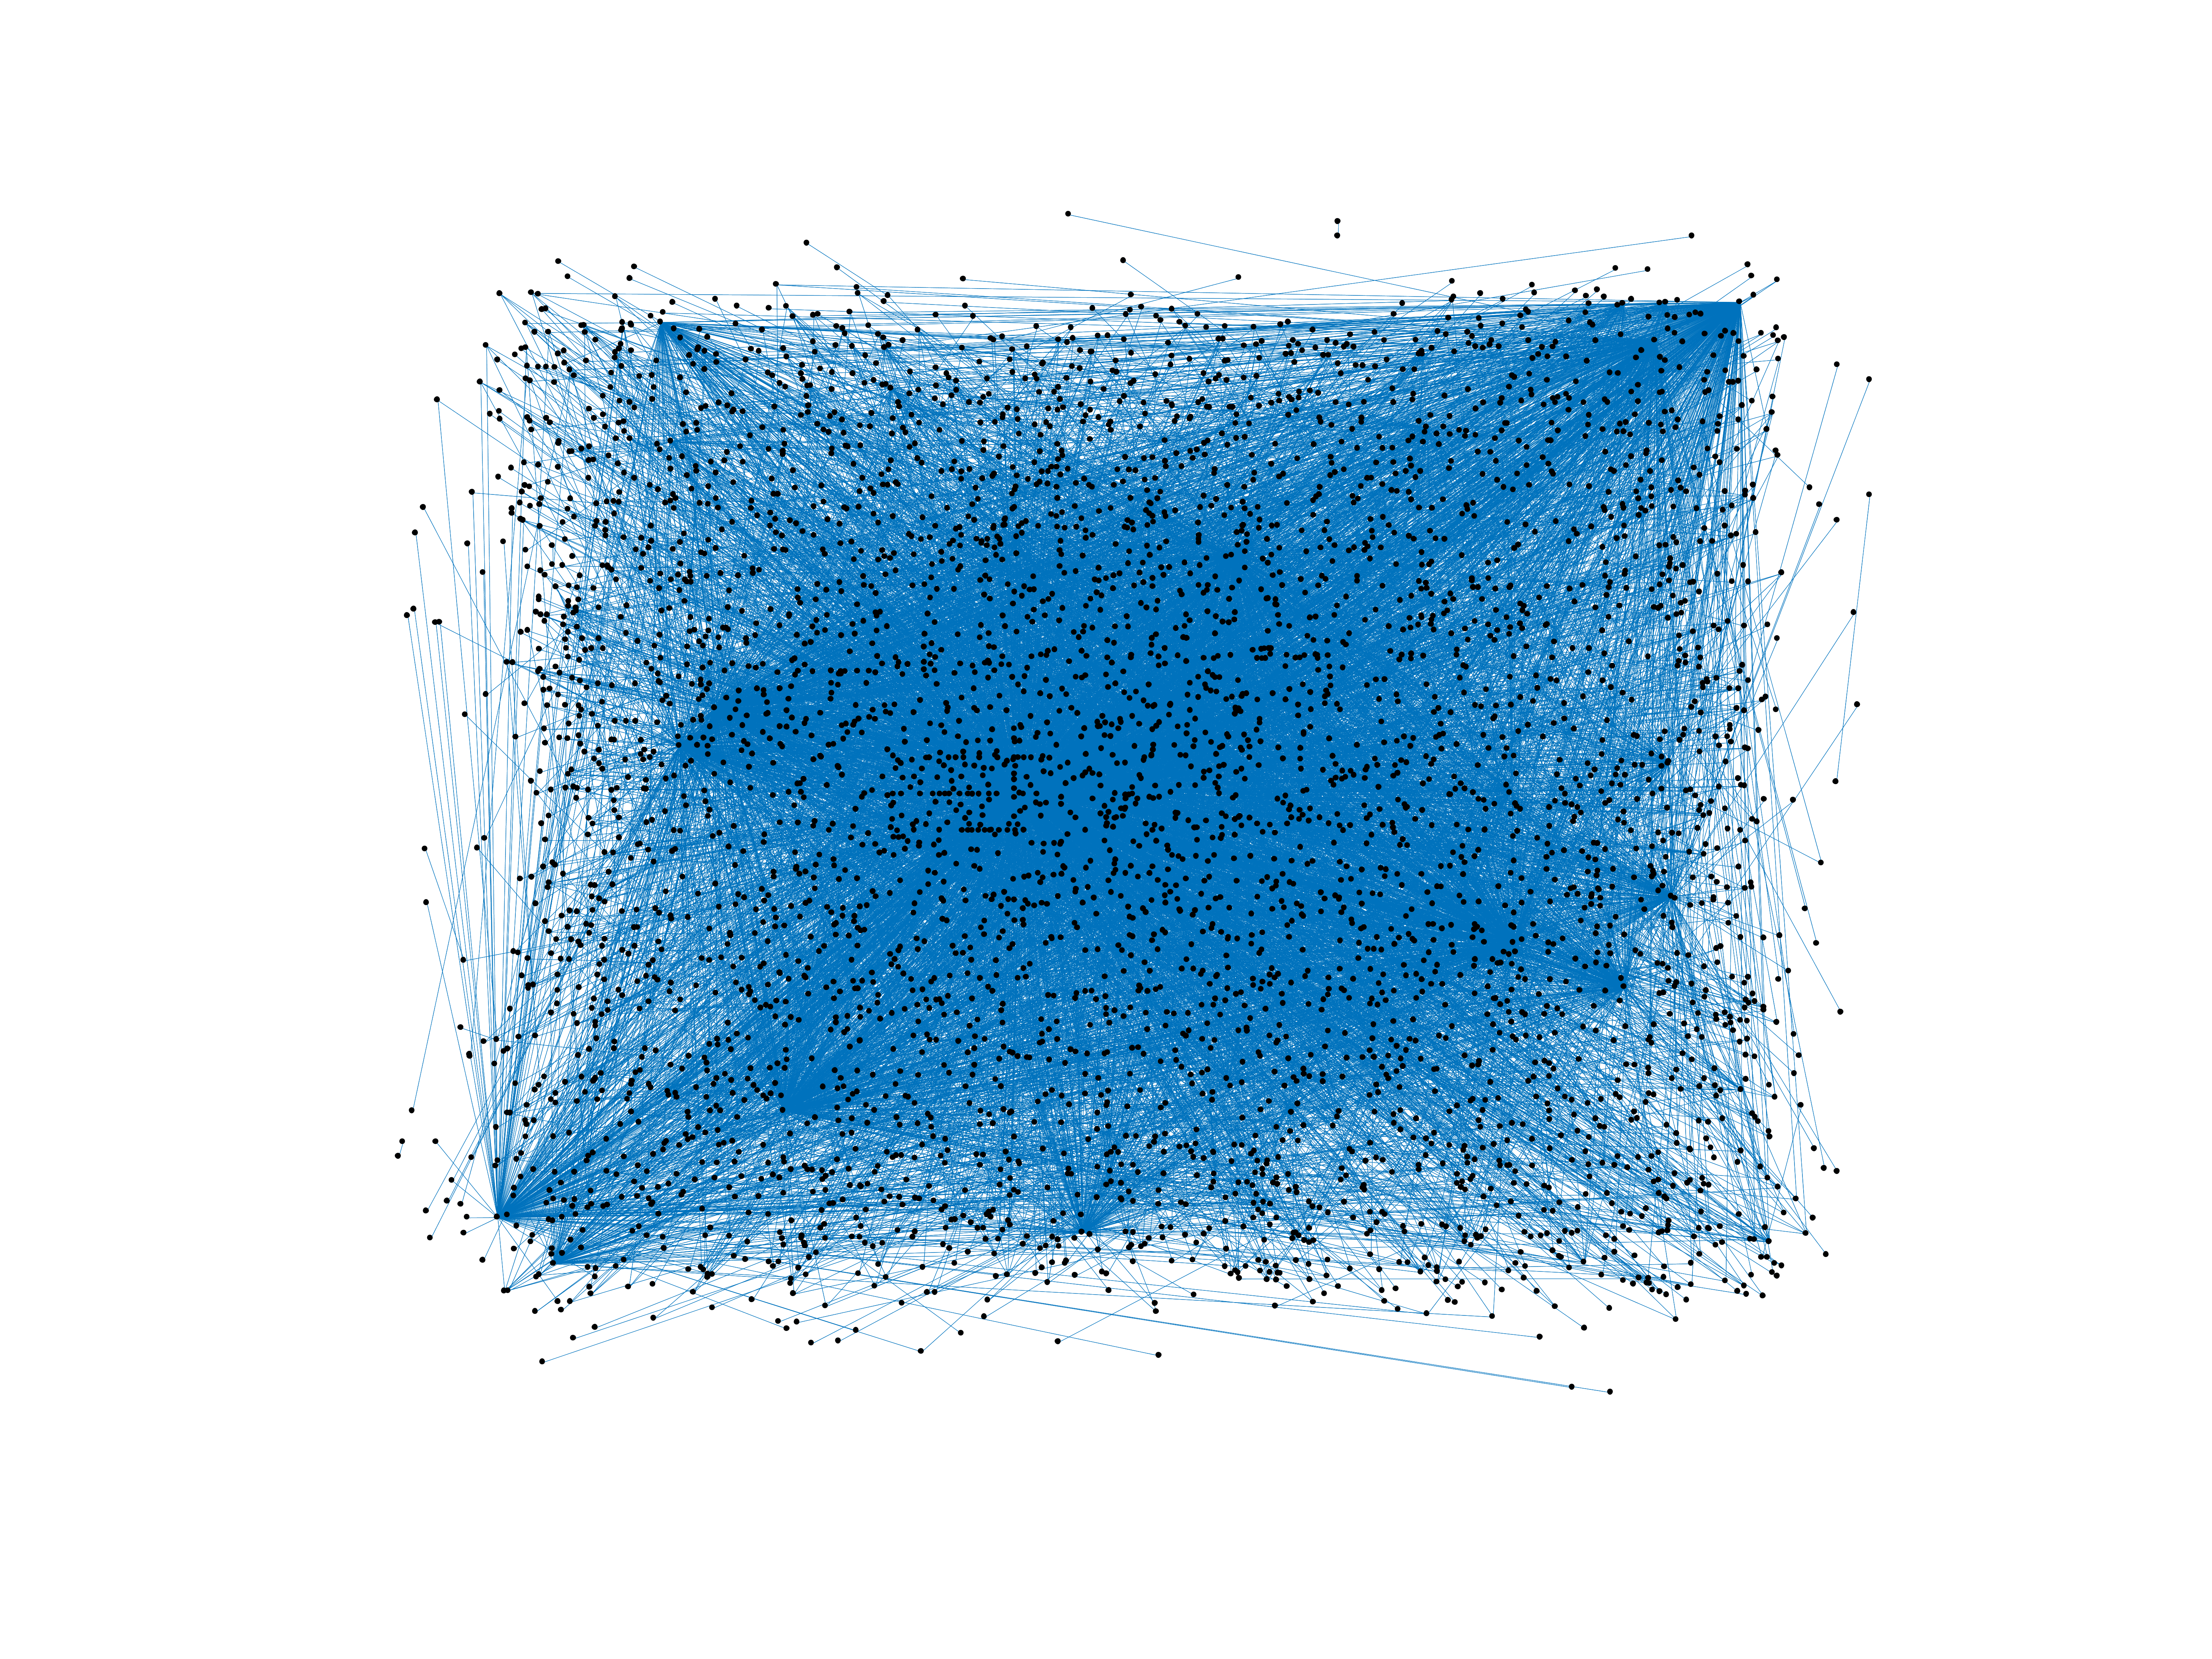
Wikinews edits (no)
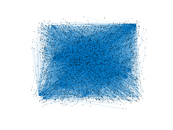
This is the bipartite edit network of the Norwegian Wikinews. It contains users
and pages from the Norwegian Wikinews, connected by edit events. Each edge
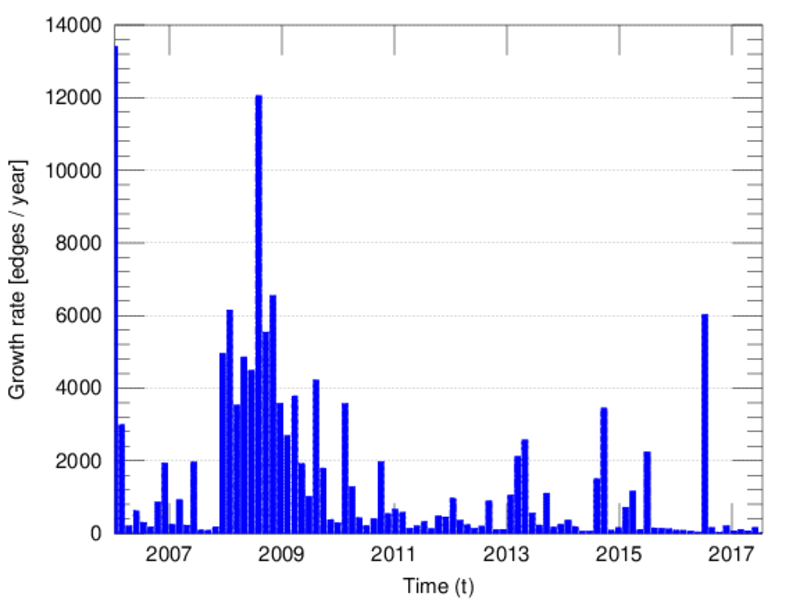
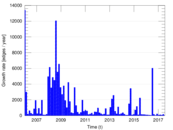
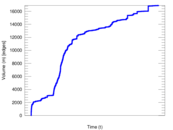
represents an edit. The dataset includes the timestamp of each edit.
Metadata
Statistics
| Size | n = | 4,523
|
| Left size | n1 = | 430
|
| Right size | n2 = | 4,093
|
| Volume | m = | 16,900
|
| Unique edge count | m̿ = | 8,891
|
| Wedge count | s = | 3,015,476
|
| Claw count | z = | 1,590,629,751
|
| Cross count | x = | 777,433,607,884
|
| Square count | q = | 604,782
|
| 4-Tour count | T4 = | 16,931,298
|
| Maximum degree | dmax = | 4,967
|
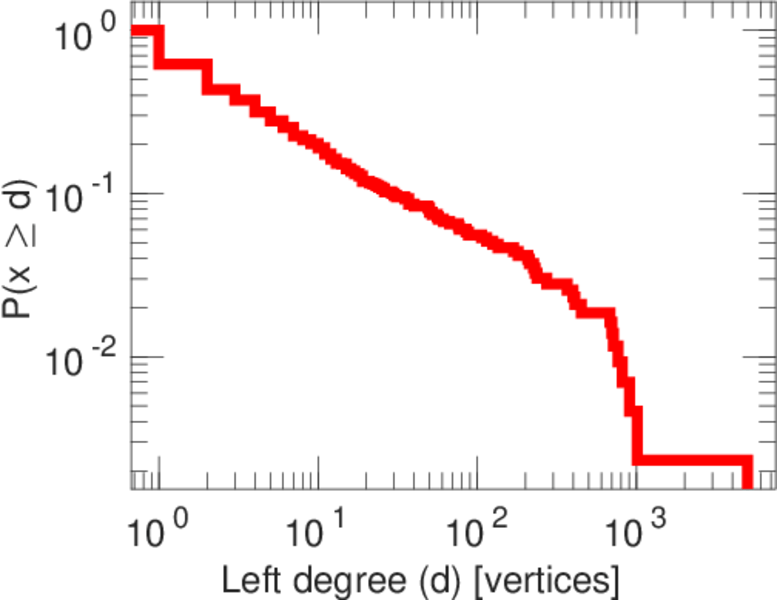
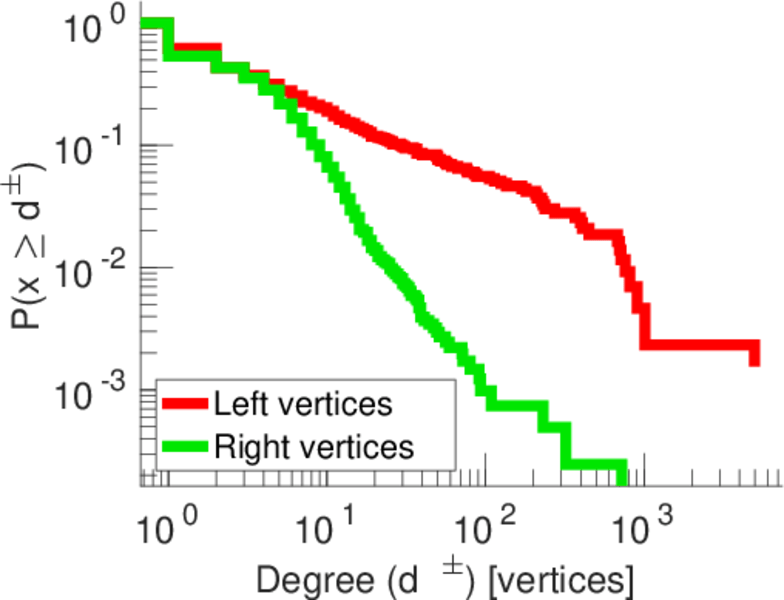
| Maximum left degree | d1max = | 4,967
|
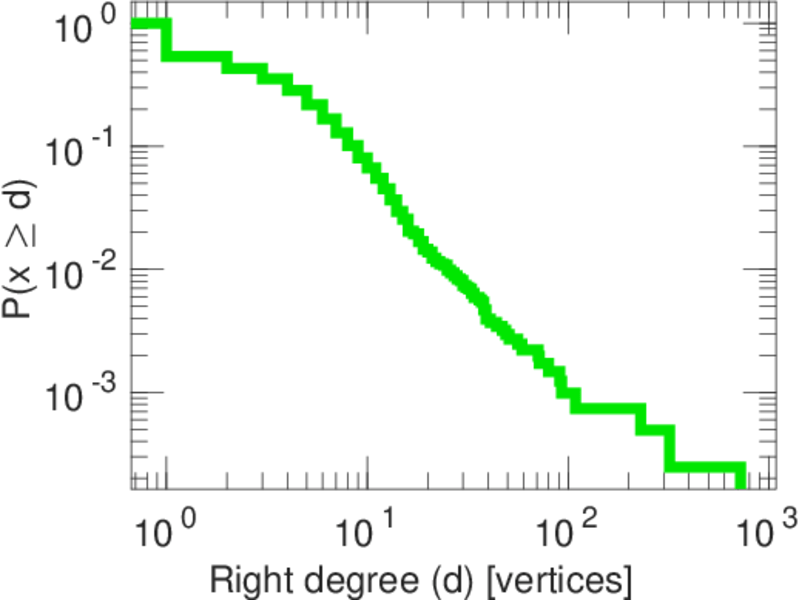
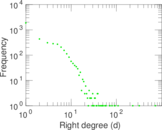
| Maximum right degree | d2max = | 722
|
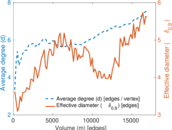
| Average degree | d = | 7.472 92
|
| Average left degree | d1 = | 39.302 3
|
| Average right degree | d2 = | 4.129 00
|
| Fill | p = | 0.005 051 73
|
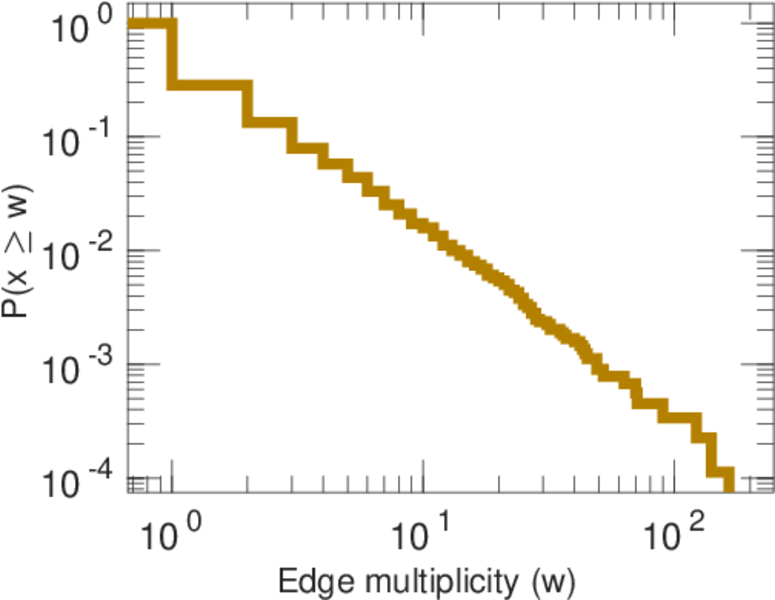
| Average edge multiplicity | m̃ = | 1.900 80
|
| Size of LCC | N = | 4,213
|
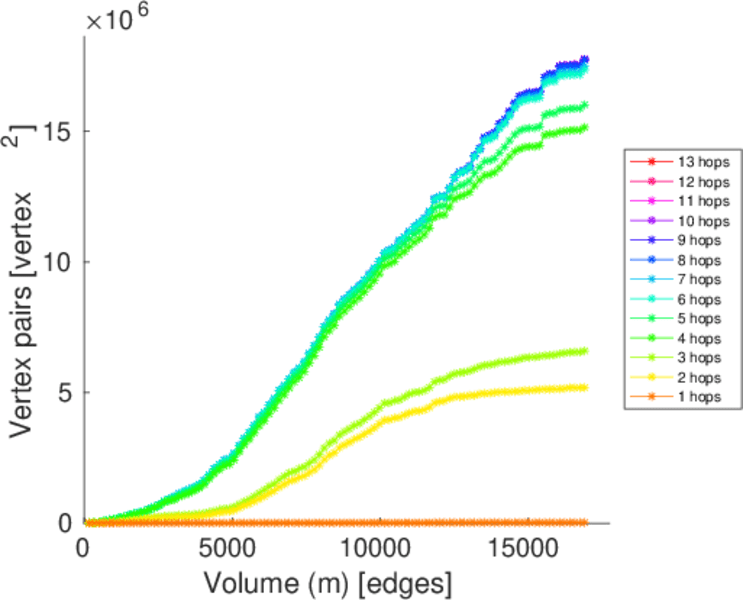
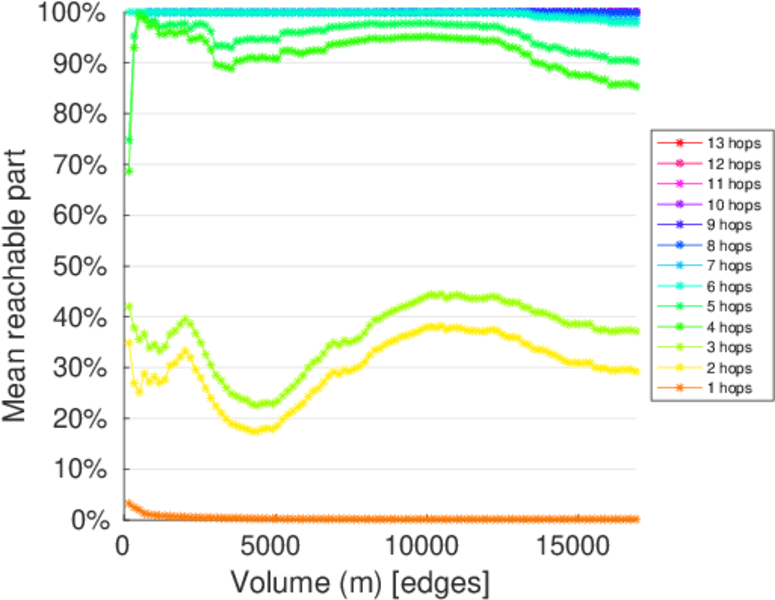
| Diameter | δ = | 13
|
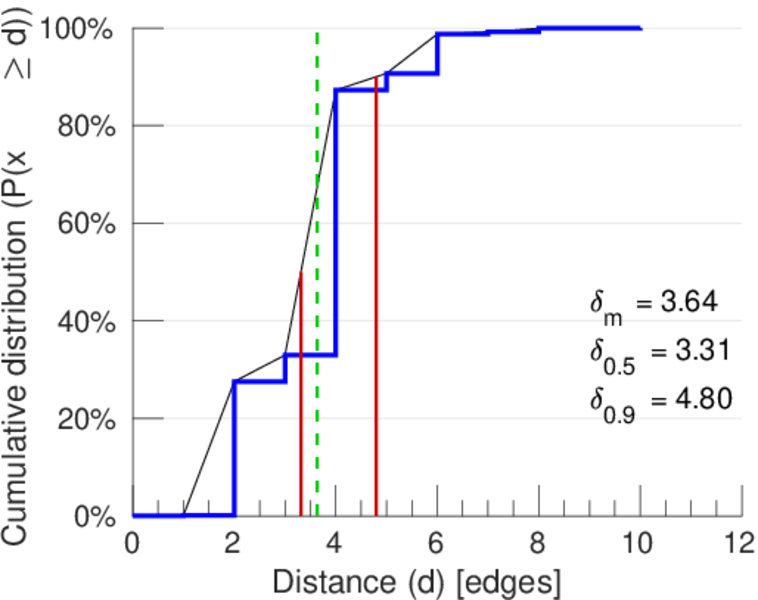
| 50-Percentile effective diameter | δ0.5 = | 3.313 75
|
| 90-Percentile effective diameter | δ0.9 = | 4.797 71
|
| Median distance | δM = | 4
|
| Mean distance | δm = | 3.635 68
|
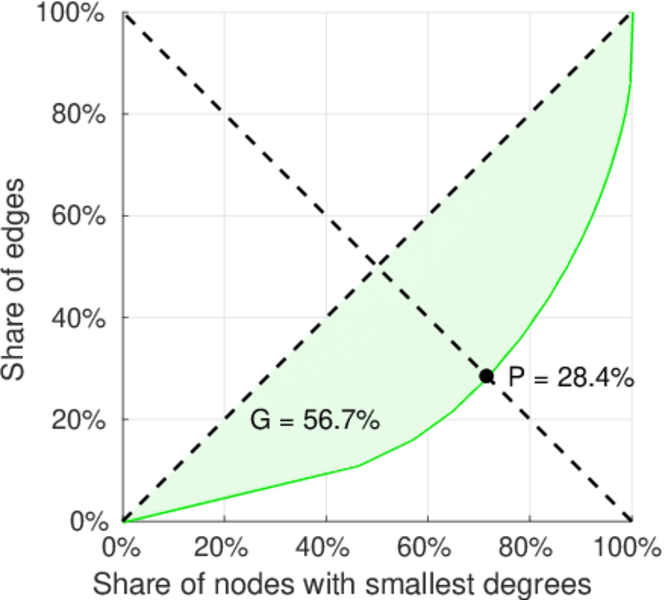
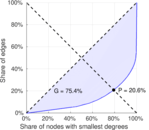
| Gini coefficient | G = | 0.758 305
|
| Balanced inequality ratio | P = | 0.209 763
|
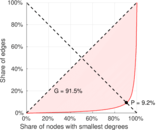
| Left balanced inequality ratio | P1 = | 0.092 426 0
|
| Right balanced inequality ratio | P2 = | 0.283 728
|
| Relative edge distribution entropy | Her = | 0.774 693
|
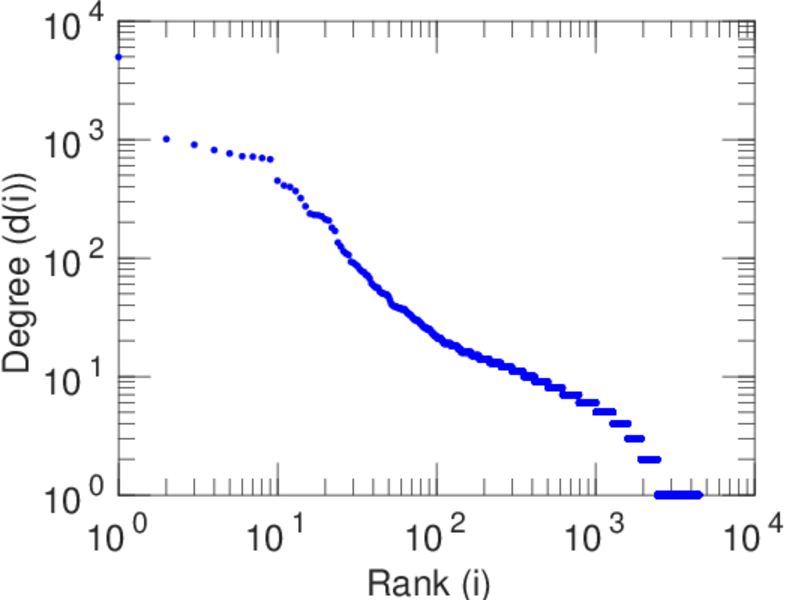
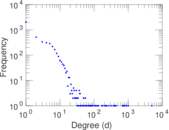
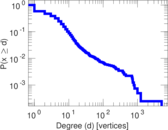
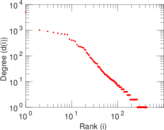
| Power law exponent | γ = | 2.753 00
|
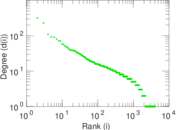
| Tail power law exponent | γt = | 2.001 00
|
| Tail power law exponent with p | γ3 = | 2.001 00
|
| p-value | p = | 0.000 00
|
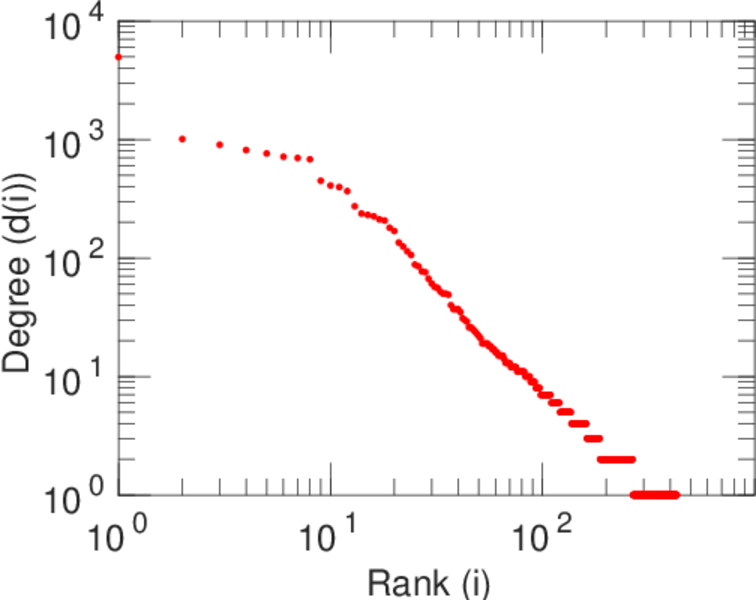
| Left tail power law exponent with p | γ3,1 = | 1.681 00
|
| Left p-value | p1 = | 0.358 000
|
| Right tail power law exponent with p | γ3,2 = | 4.631 00
|
| Right p-value | p2 = | 0.121 000
|
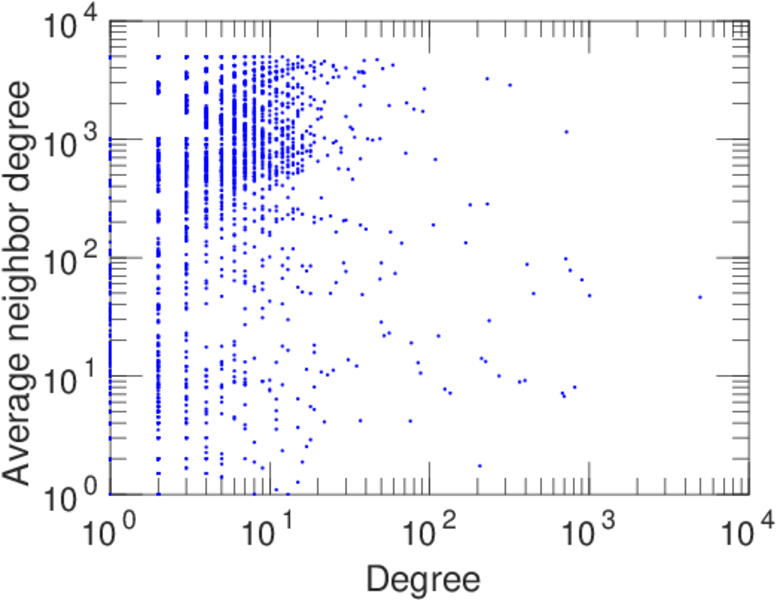
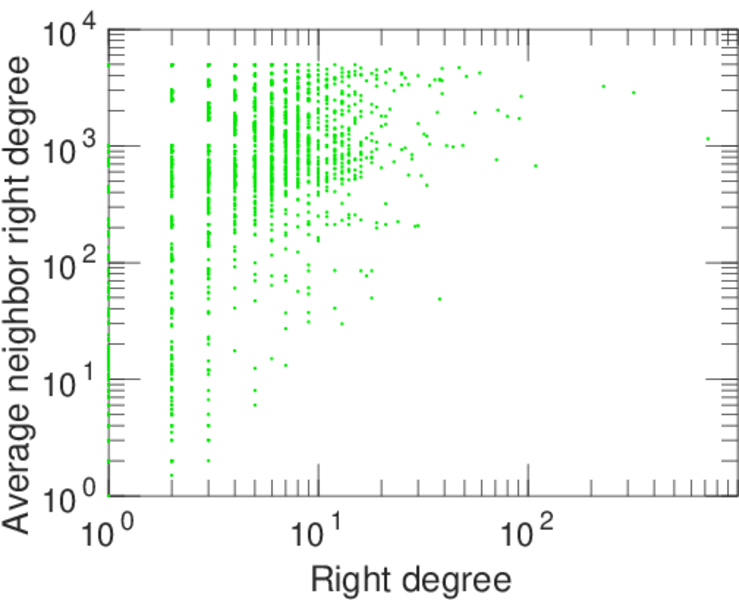
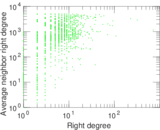
| Degree assortativity | ρ = | −0.163 462
|
| Degree assortativity p-value | pρ = | 2.726 01 × 10−54
|
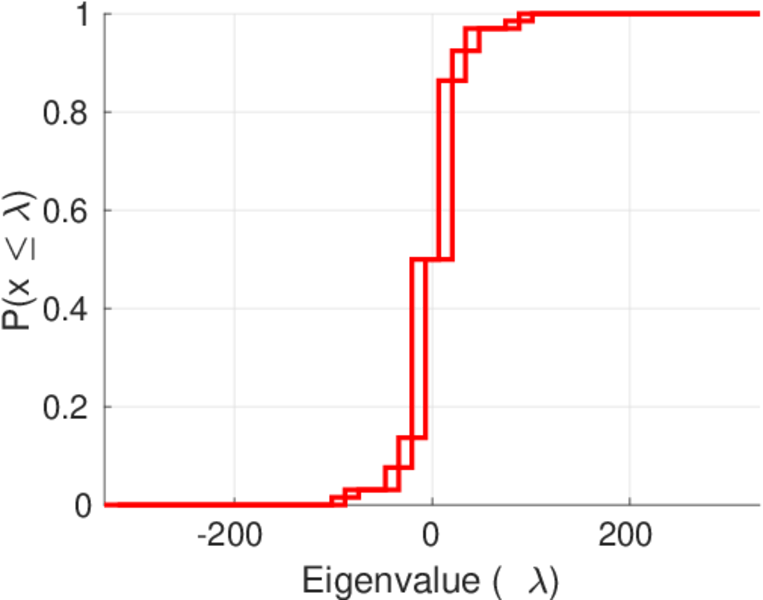
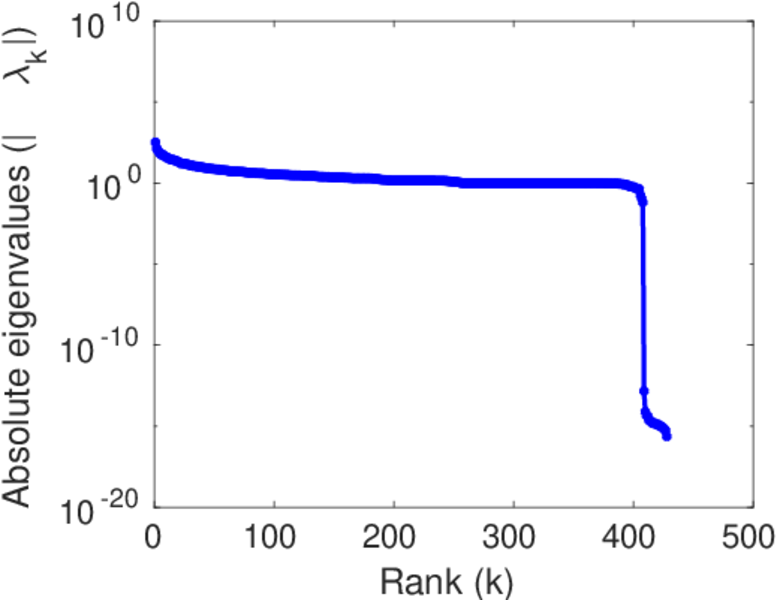
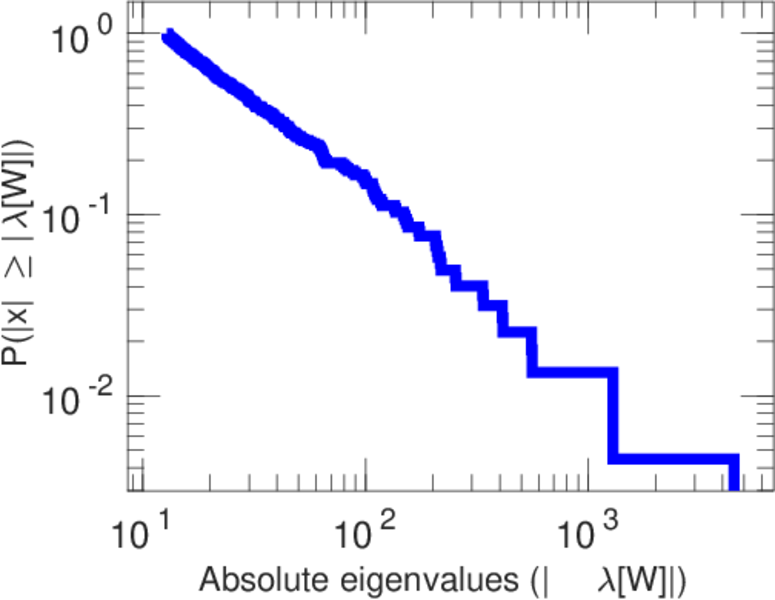
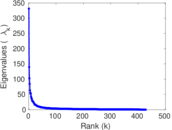
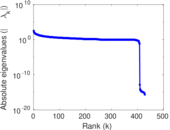
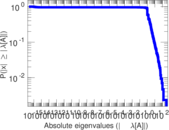
| Spectral norm | α = | 331.483
|
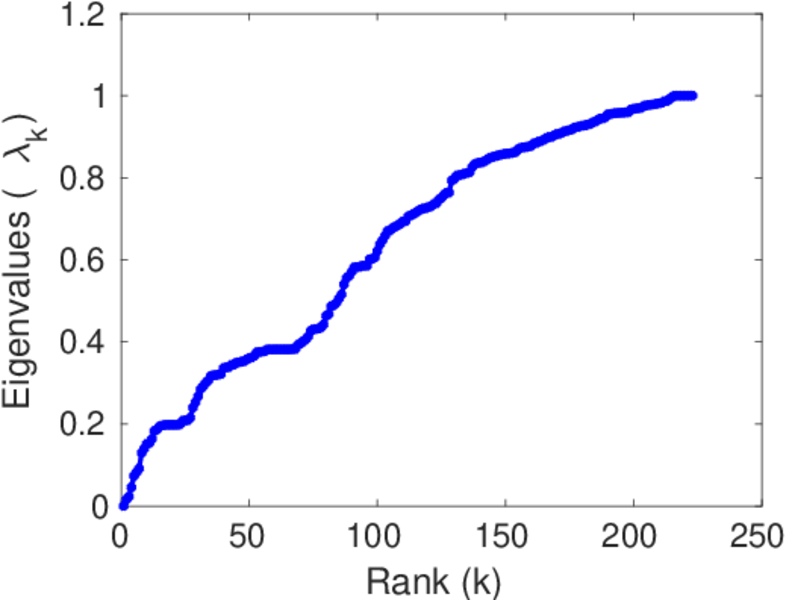
| Algebraic connectivity | a = | 0.015 525 8
|
| Spectral separation | |λ1[A] / λ2[A]| = | 2.370 76
|
| Controllability | C = | 3,674
|
| Relative controllability | Cr = | 0.818 263
|
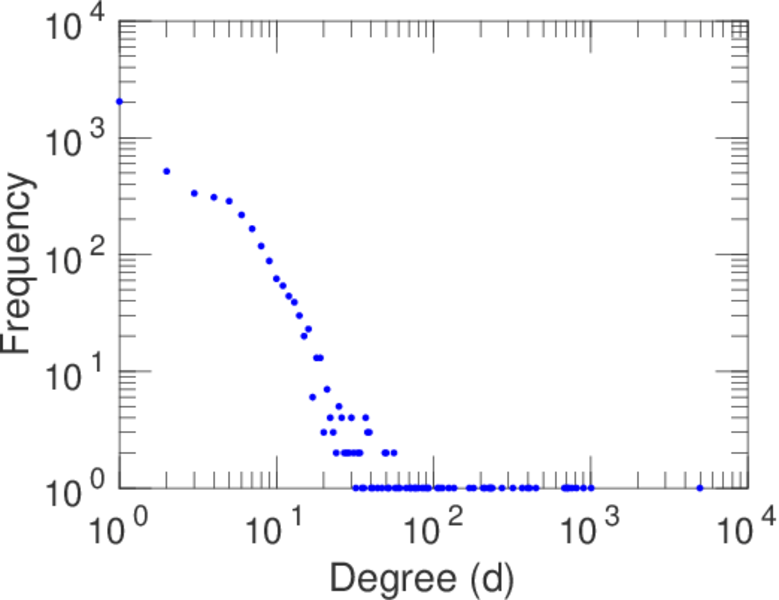
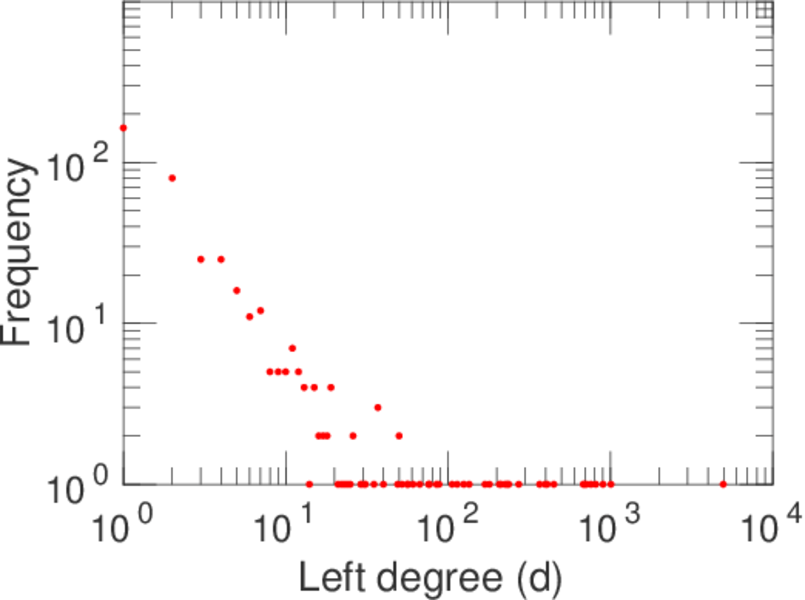
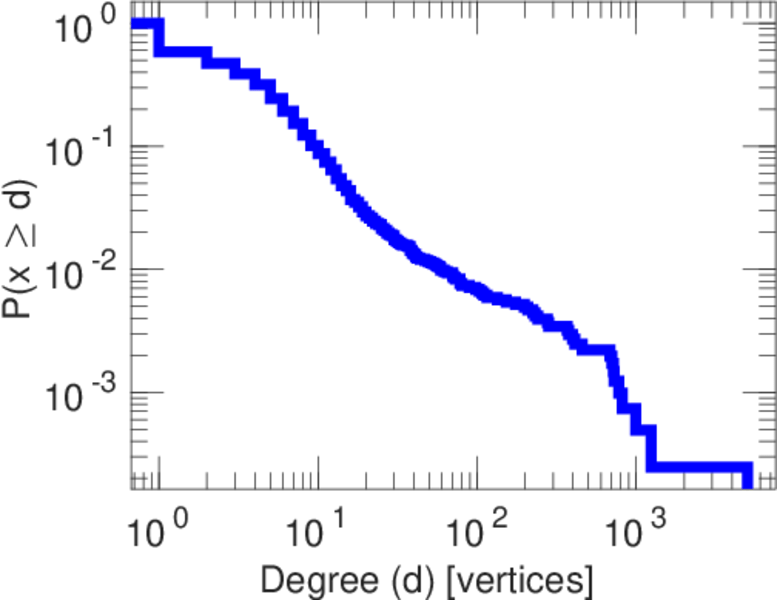
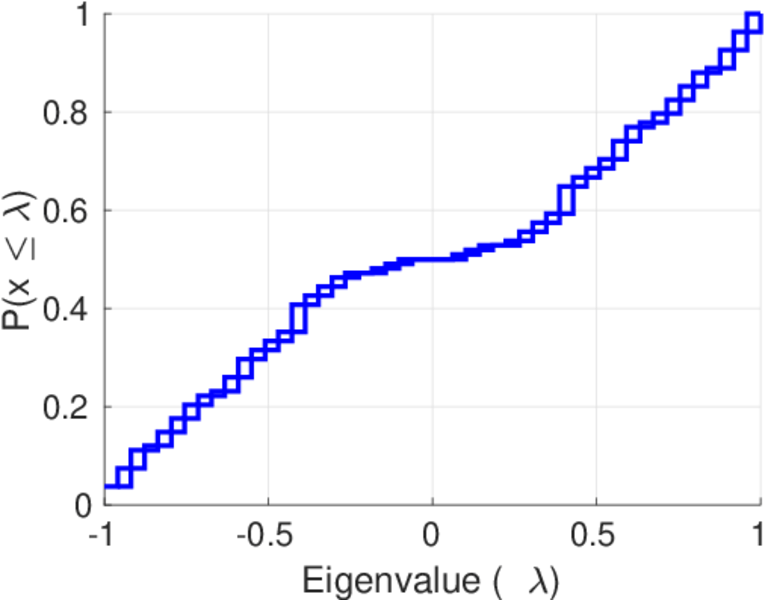
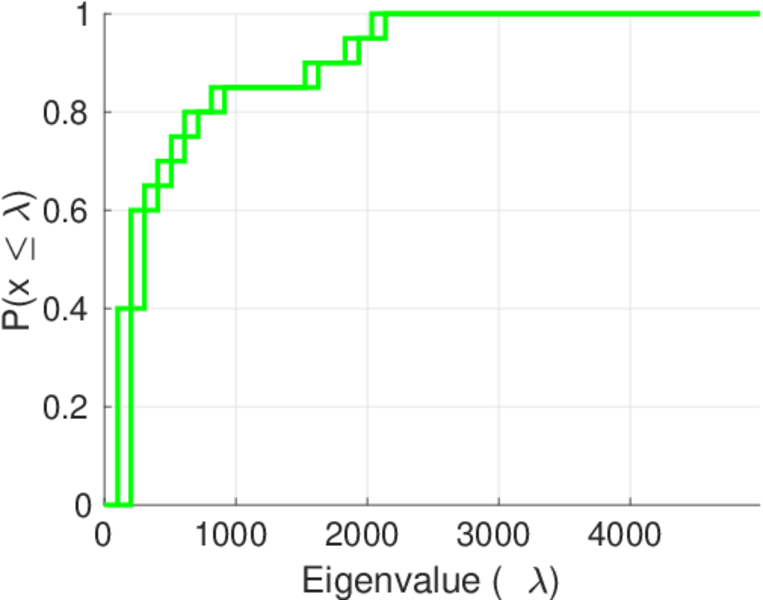
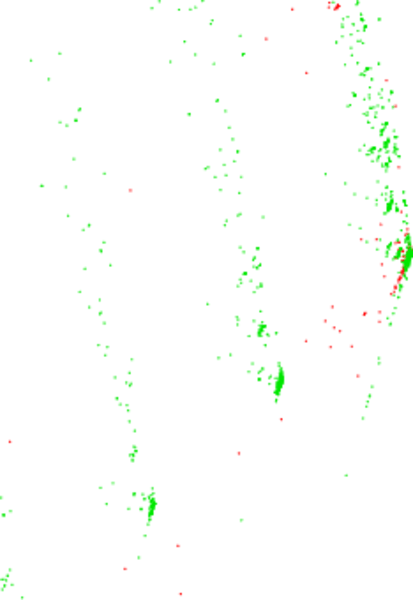
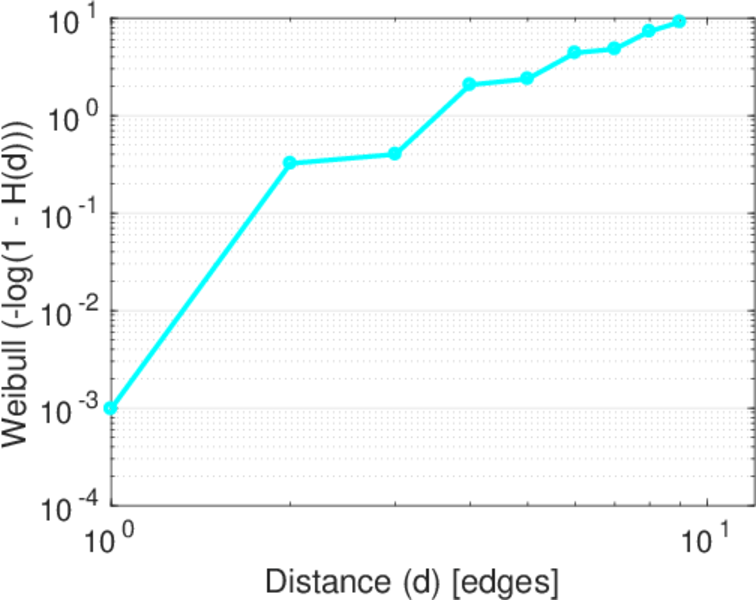
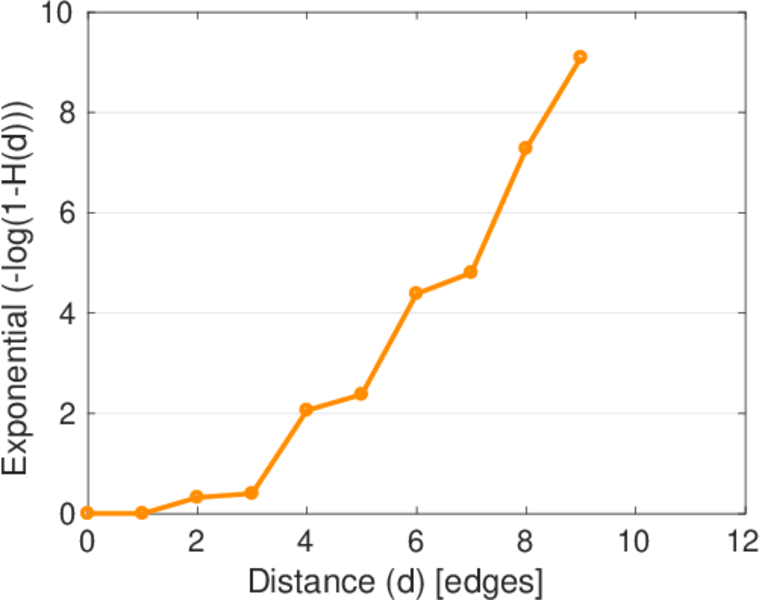
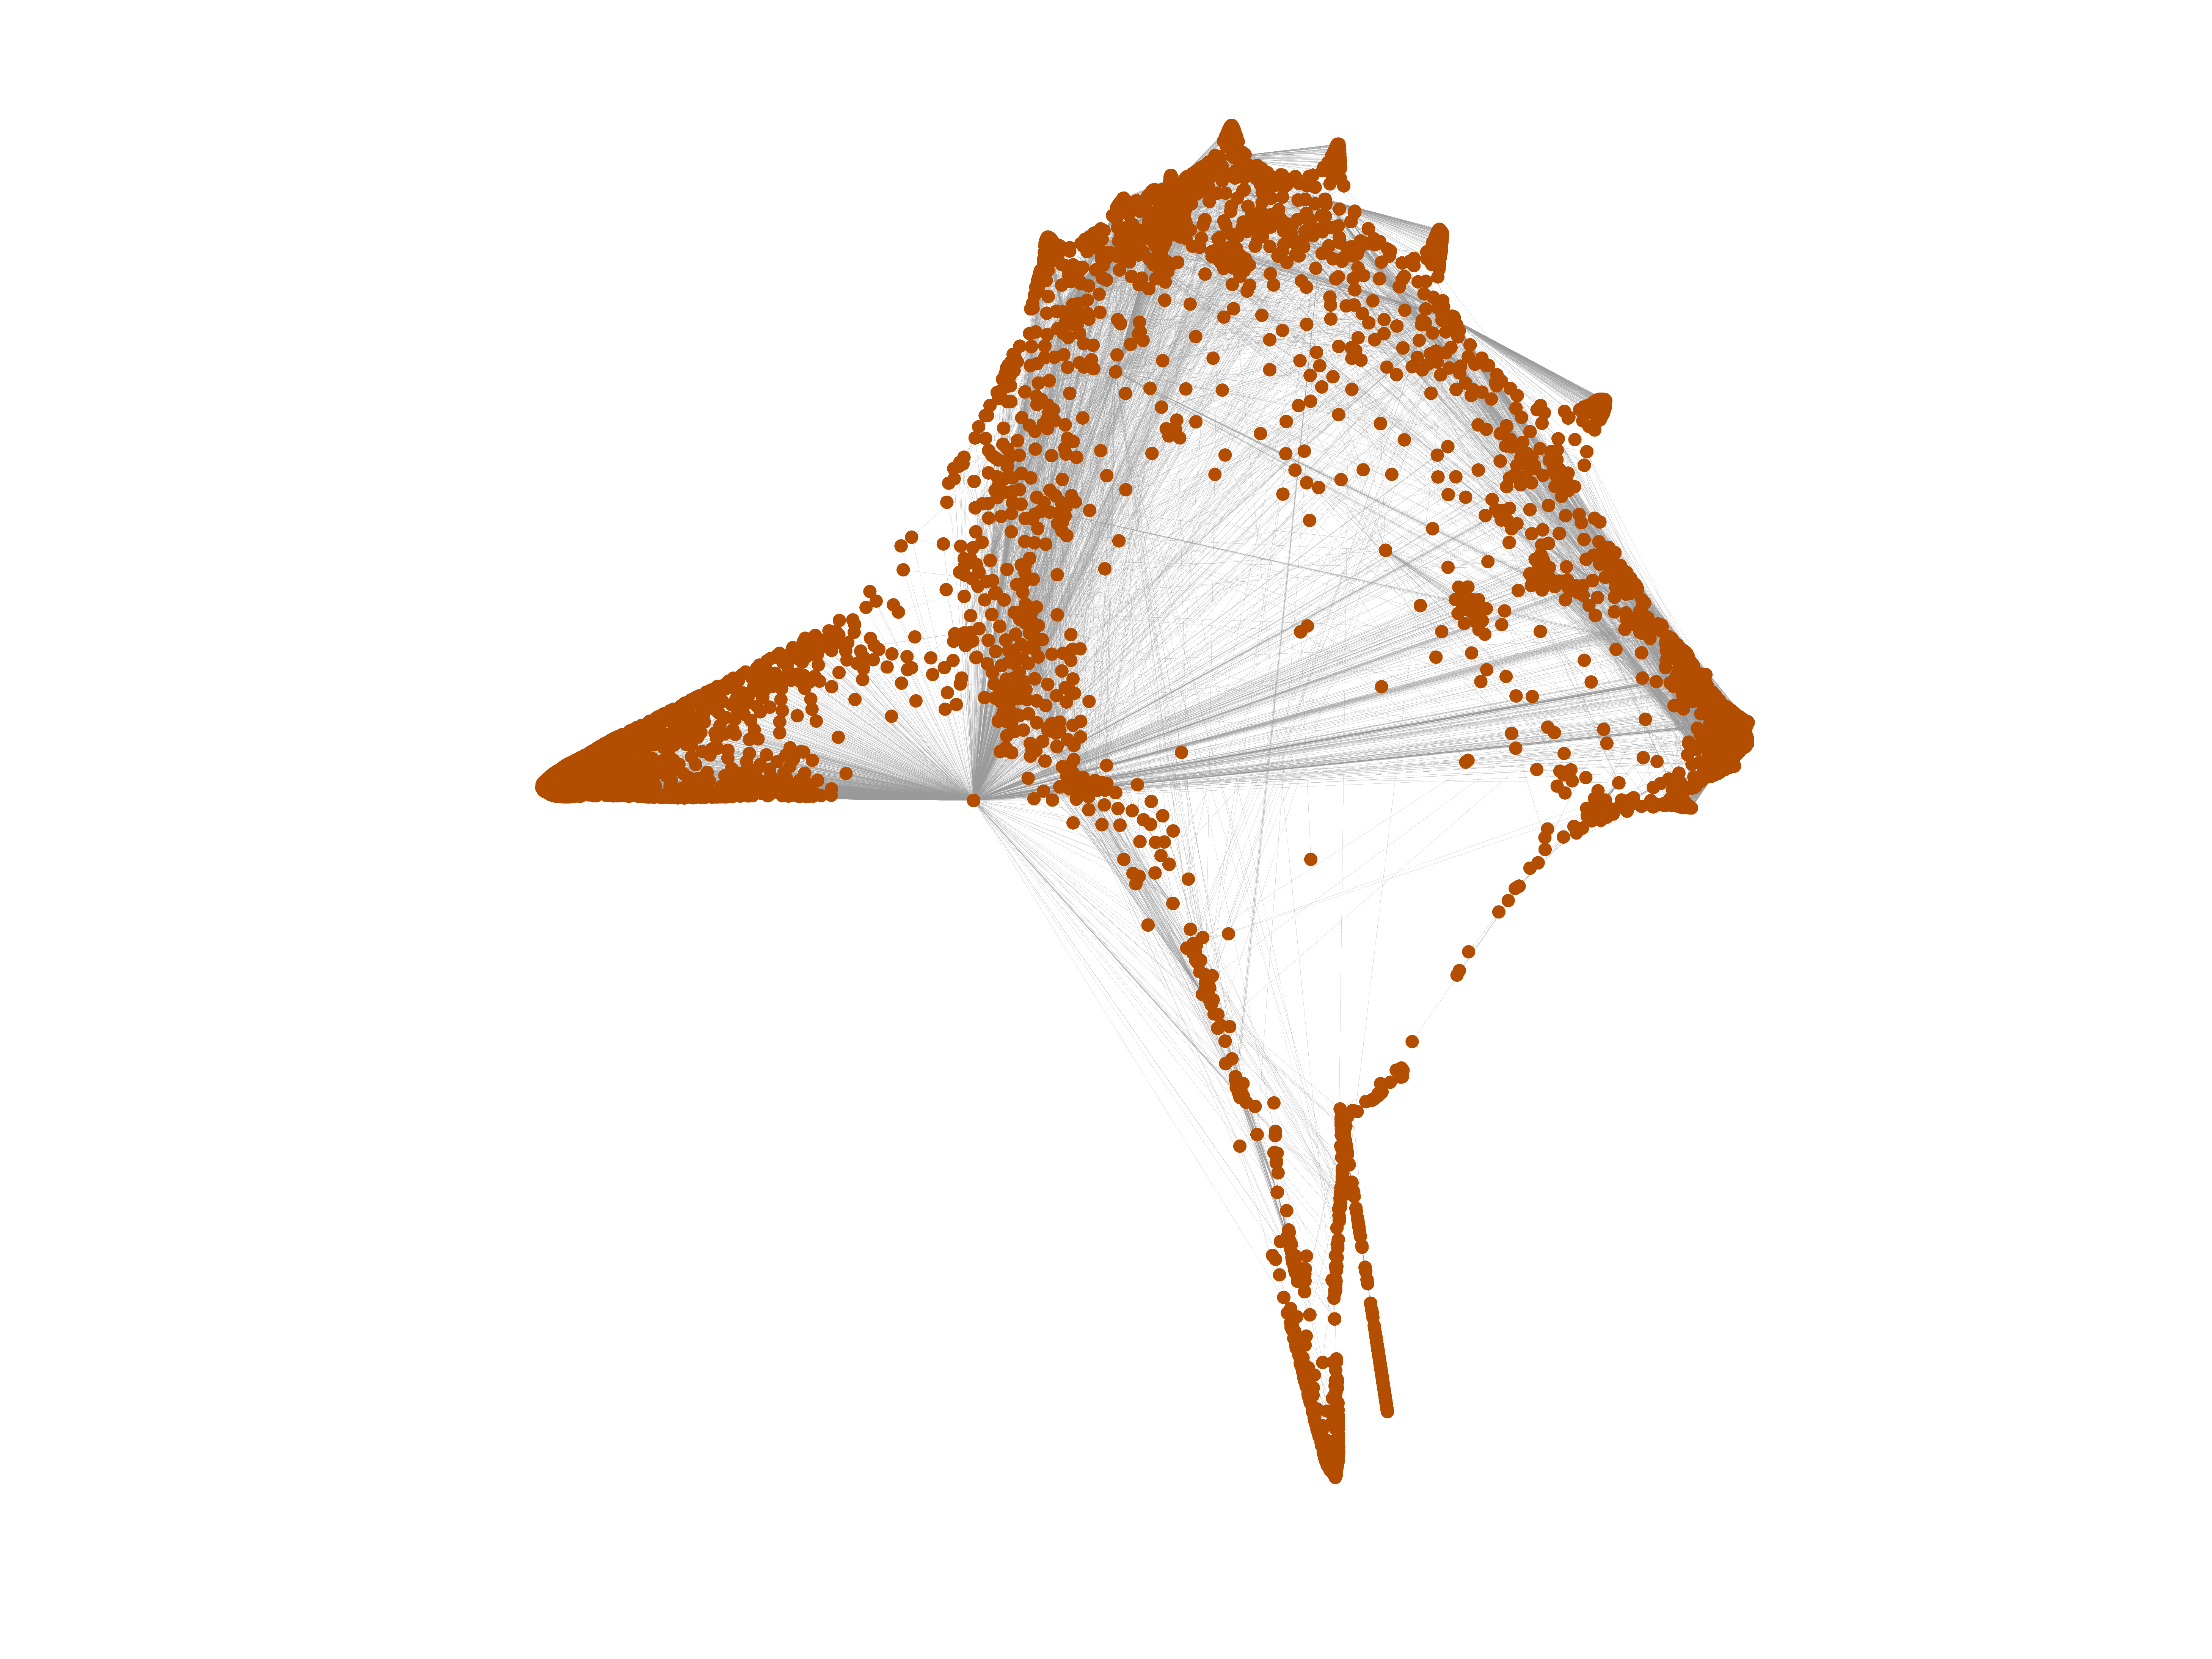
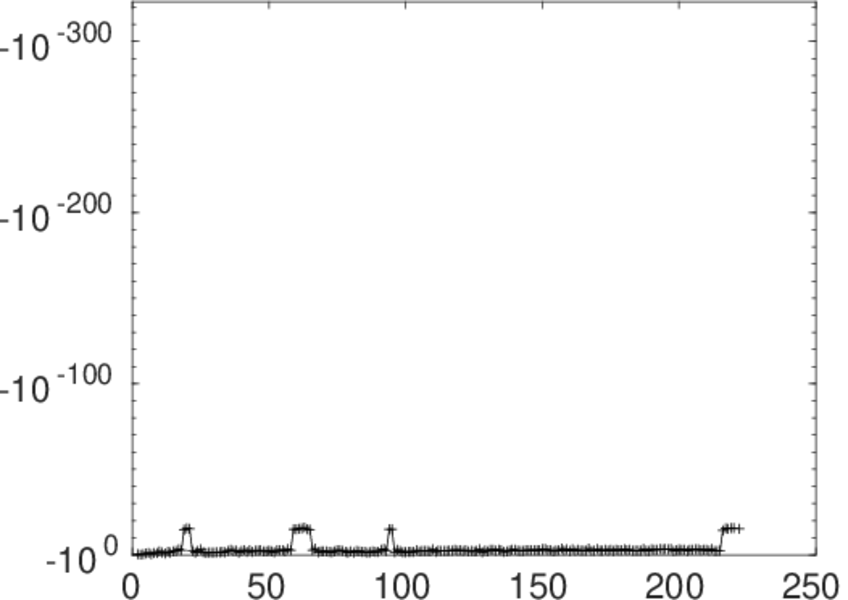
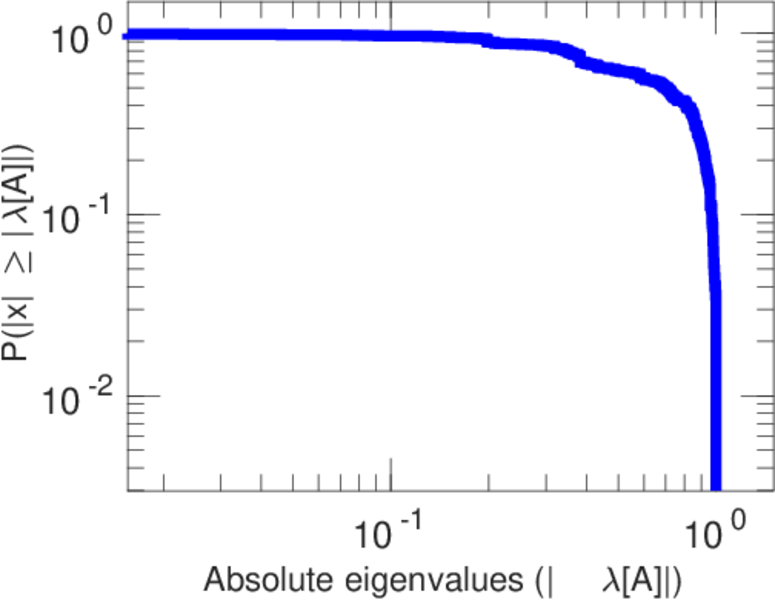
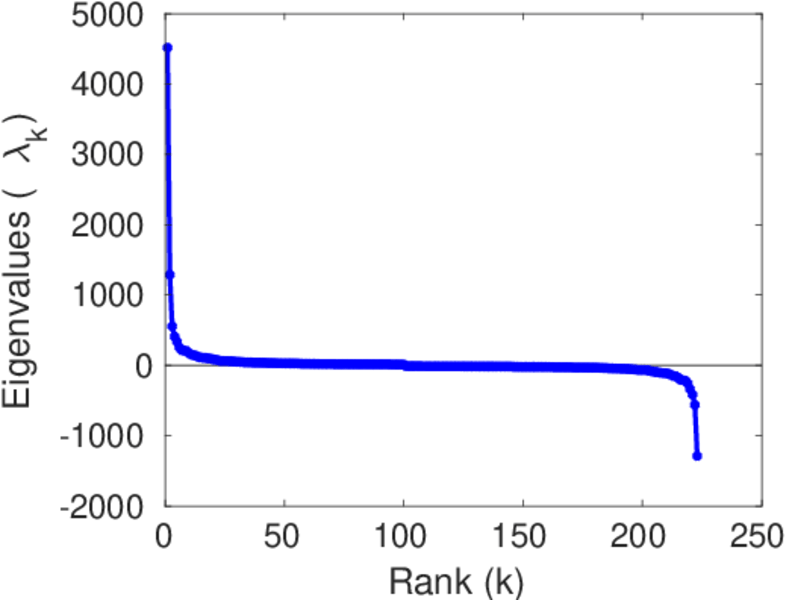
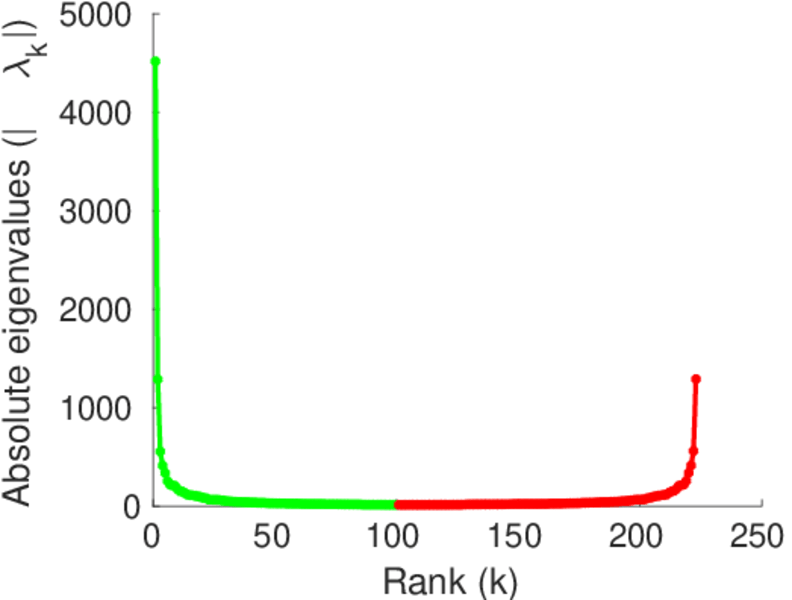
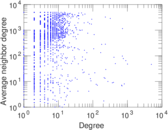
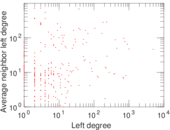
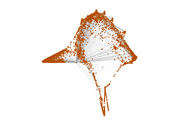
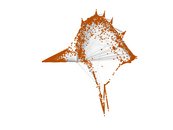
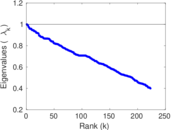
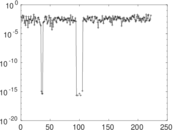
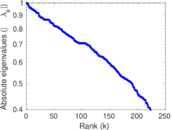
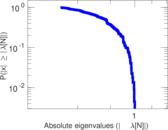
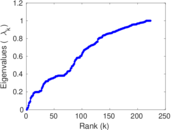
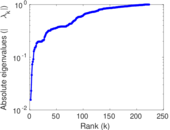
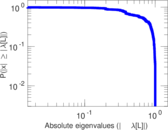
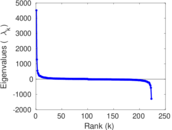
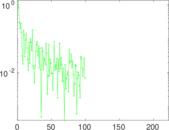
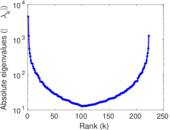
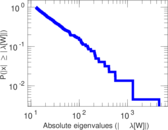
Plots


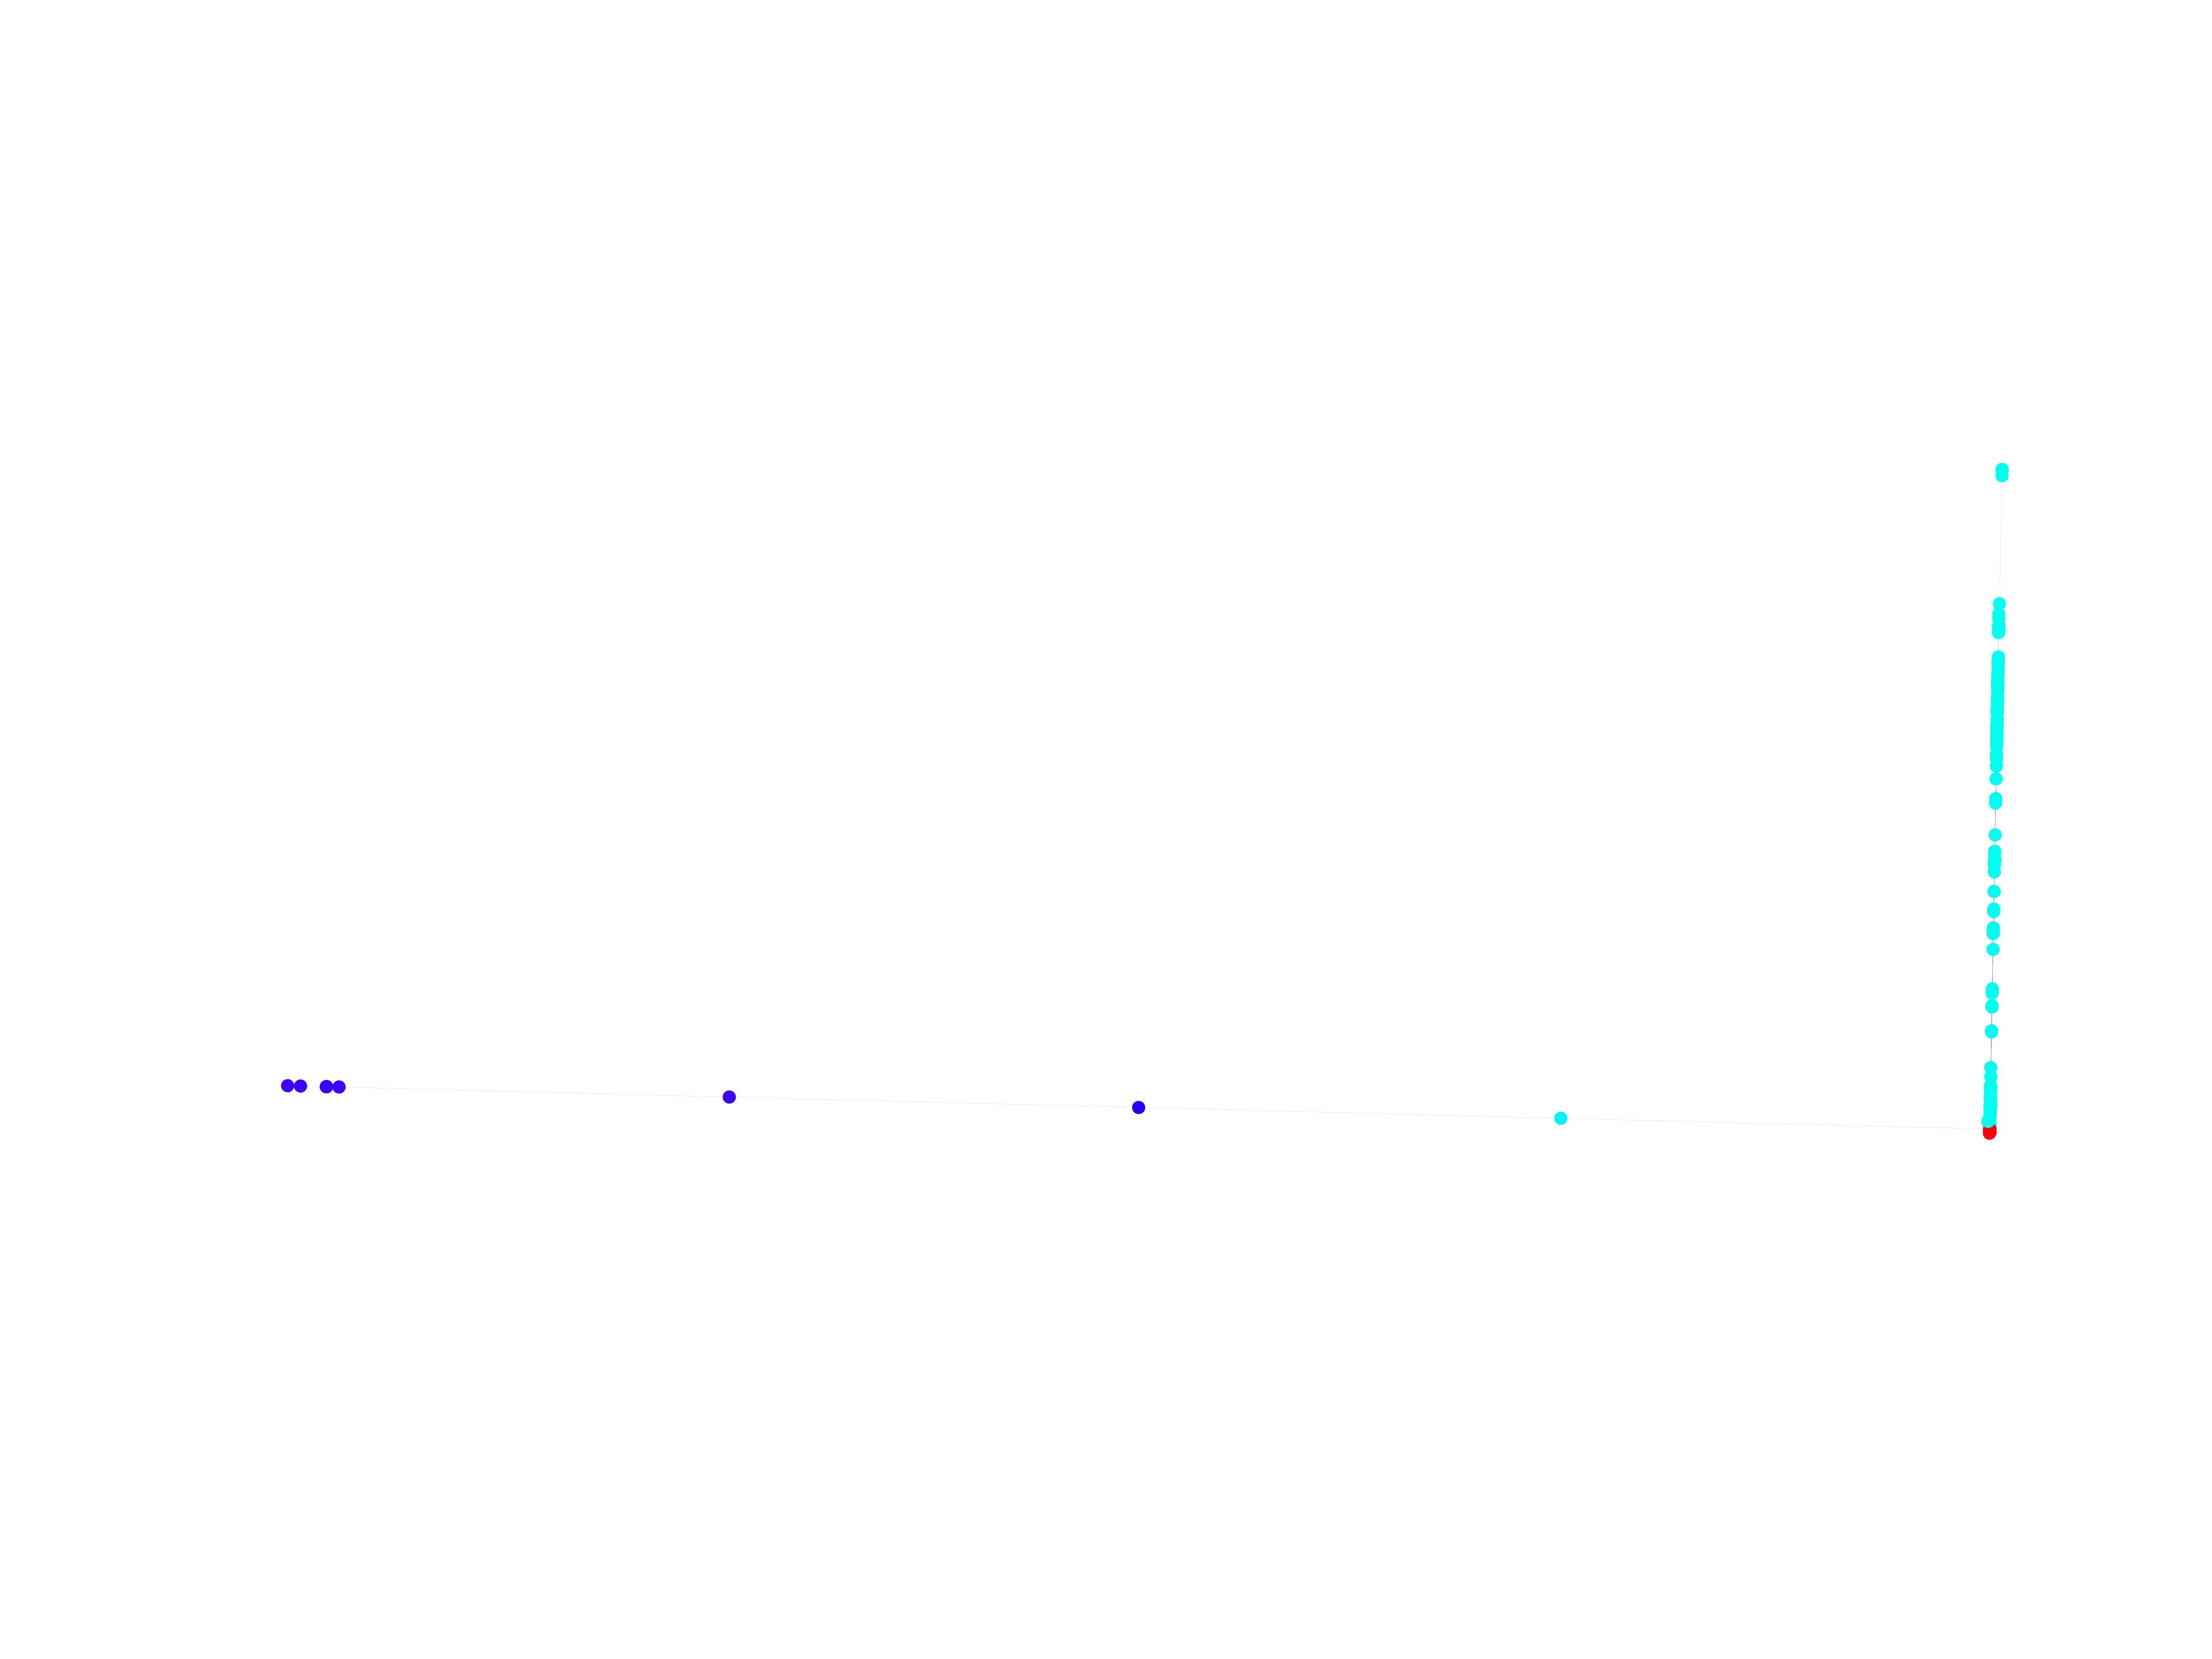
Matrix decompositions plots


Downloads
References
|
[1]
|
Jérôme Kunegis.
KONECT – The Koblenz Network Collection.
In Proc. Int. Conf. on World Wide Web Companion, pages
1343–1350, 2013.
[ http ]
|
|
[2]
|
Wikimedia Foundation.
Wikimedia downloads.
http://dumps.wikimedia.org/, January 2010.
|
 KONECT ‣ Networks ‣
Buy Me a Coffee
KONECT ‣ Networks ‣
Buy Me a Coffee