Wiktionary edits (no)
This is the bipartite edit network of the Norwegian Wiktionary. It contains
users and pages from the Norwegian Wiktionary, connected by edit events. Each
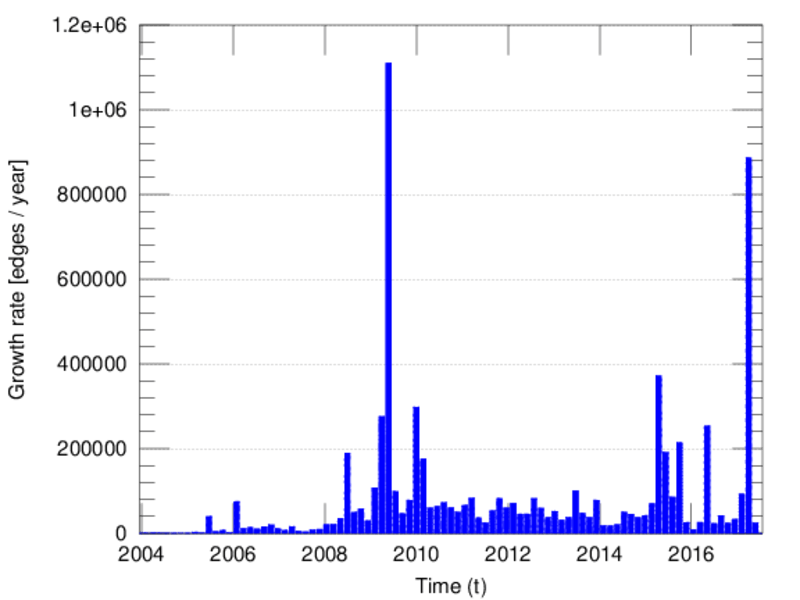
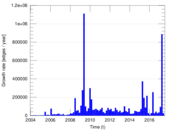
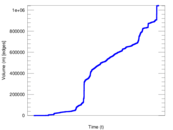
edge represents an edit. The dataset includes the timestamp of each edit.
Metadata
Statistics
| Size | n = | 153,199
|
| Left size | n1 = | 963
|
| Right size | n2 = | 152,236
|
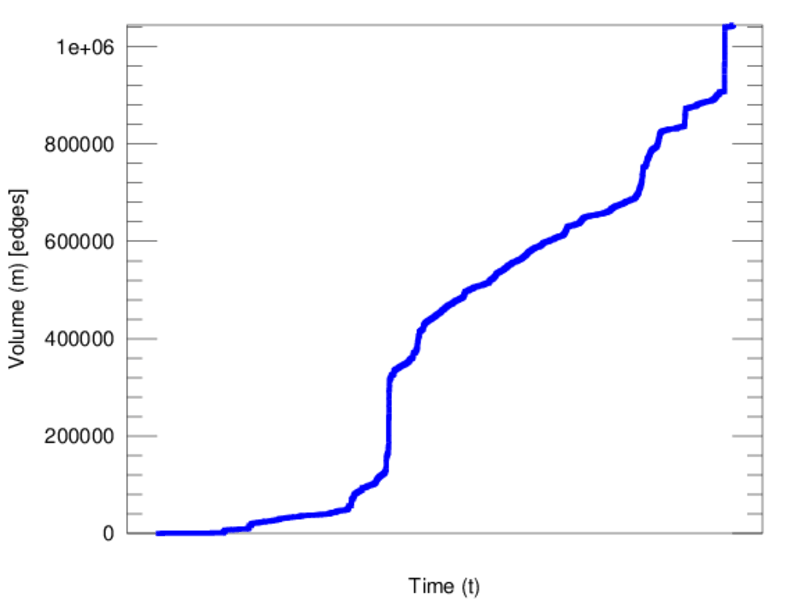
| Volume | m = | 1,044,919
|
| Unique edge count | m̿ = | 651,981
|
| Wedge count | s = | 21,786,612,355
|
| Claw count | z = | 745,270,854,732,477
|
| Cross count | x = | 2.110 55 × 1019
|
| Square count | q = | 18,694,609,962
|
| 4-Tour count | T4 = | 236,704,633,770
|
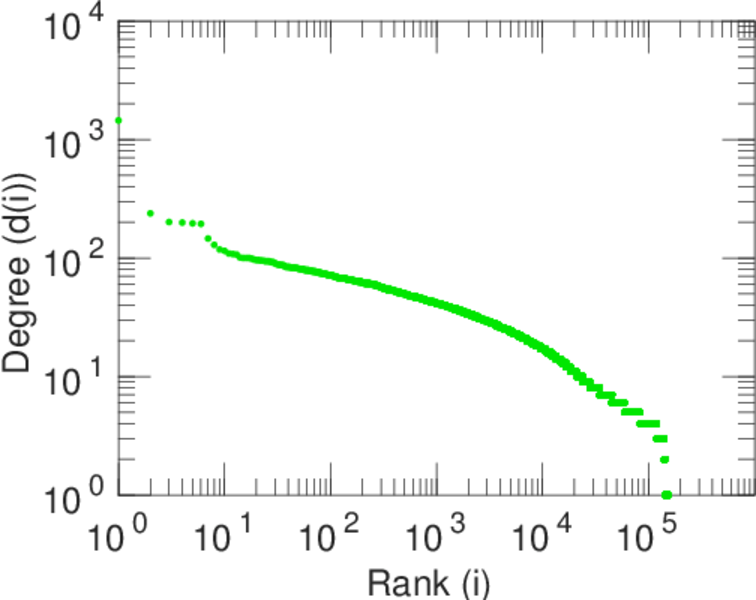
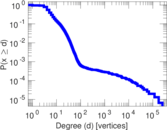
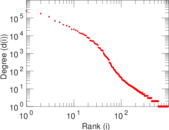
| Maximum degree | dmax = | 251,182
|
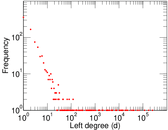
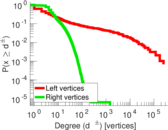
| Maximum left degree | d1max = | 251,182
|
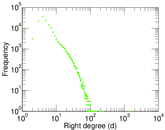
| Maximum right degree | d2max = | 1,448
|
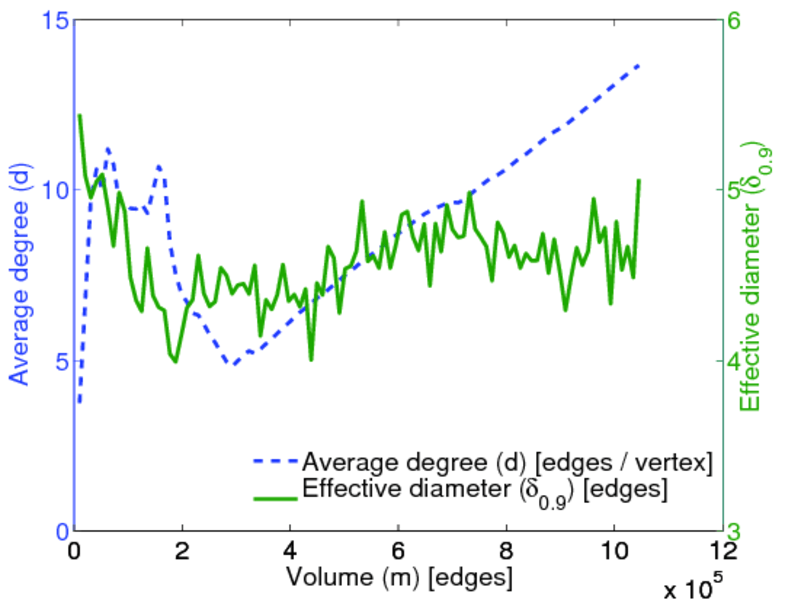
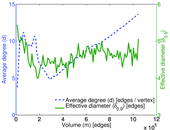
| Average degree | d = | 13.641 3
|
| Average left degree | d1 = | 1,085.07
|
| Average right degree | d2 = | 6.863 81
|
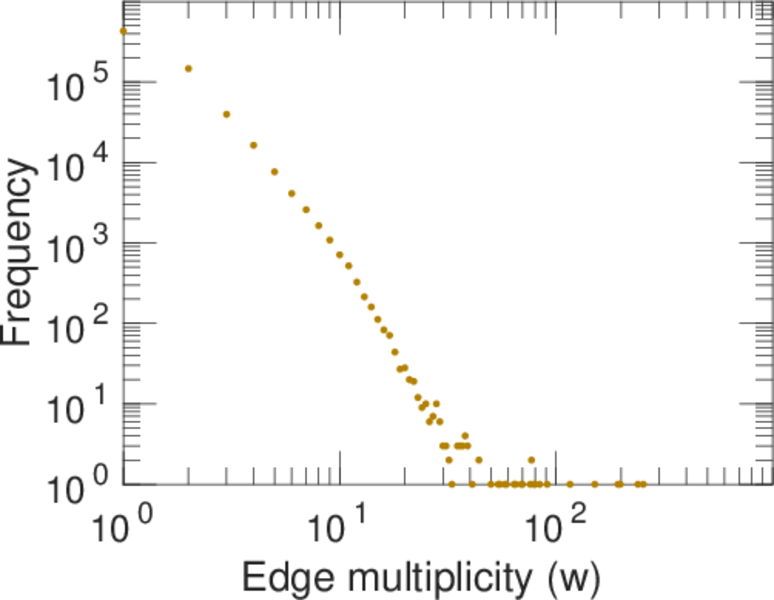
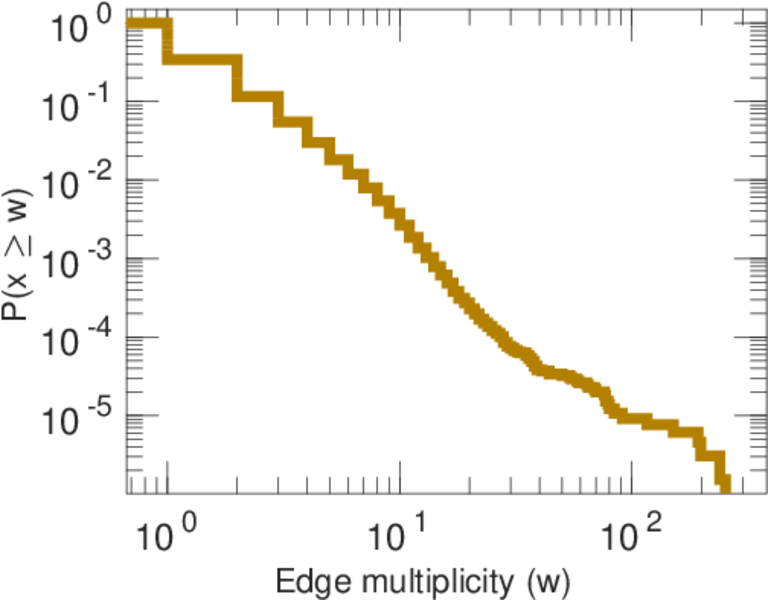
| Average edge multiplicity | m̃ = | 1.602 68
|
| Size of LCC | N = | 152,716
|
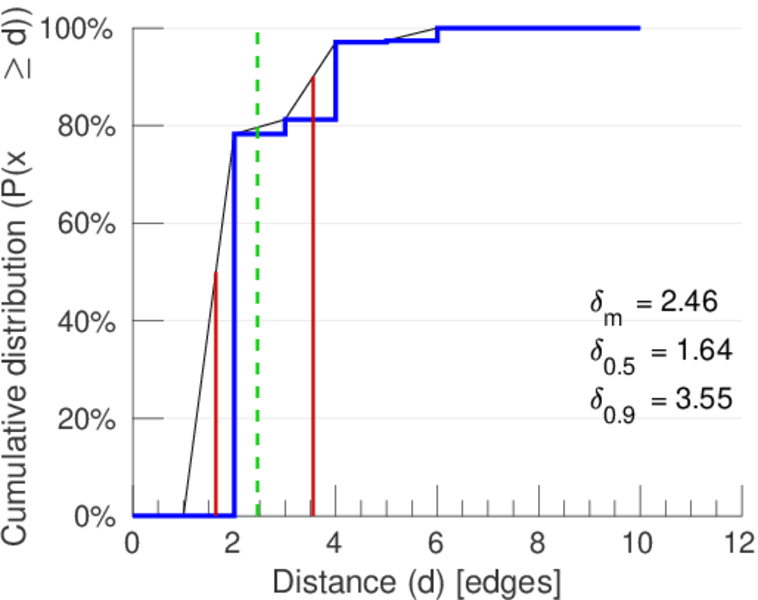
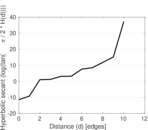
| Diameter | δ = | 12
|
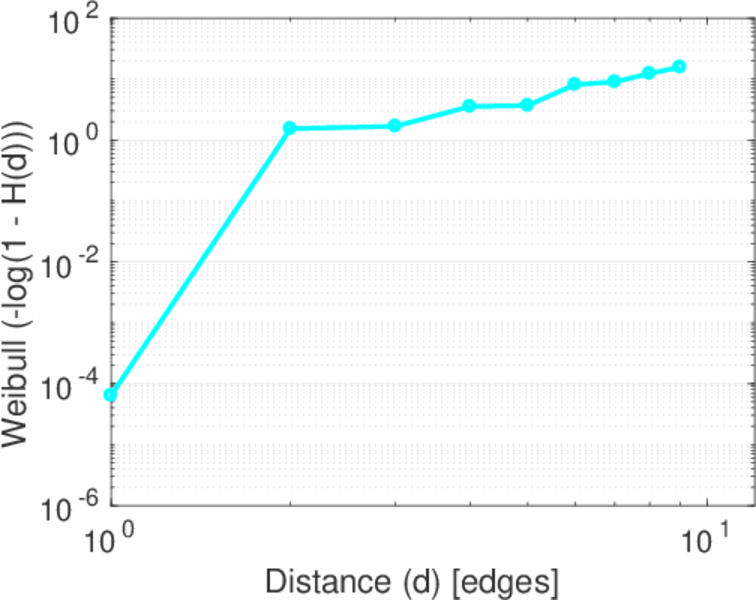
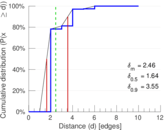
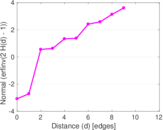
| 50-Percentile effective diameter | δ0.5 = | 1.638 90
|
| 90-Percentile effective diameter | δ0.9 = | 3.553 99
|
| Median distance | δM = | 2
|
| Mean distance | δm = | 2.460 66
|
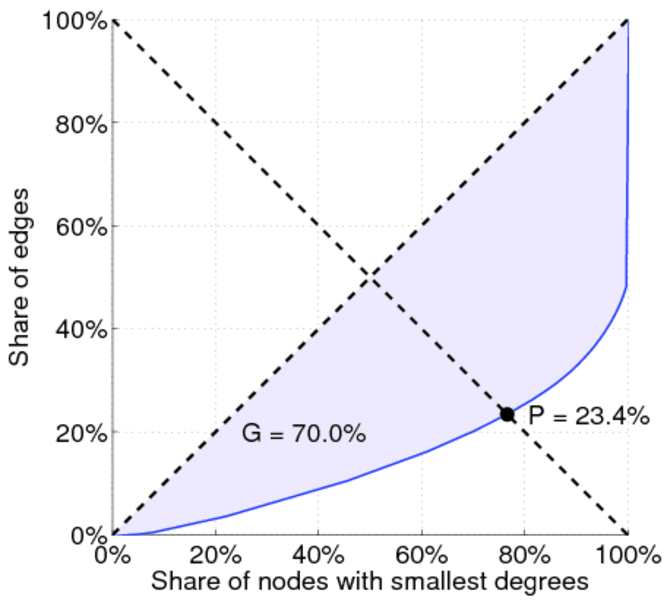
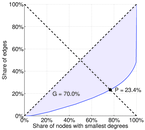
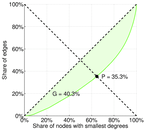
| Gini coefficient | G = | 0.700 349
|
| Balanced inequality ratio | P = | 0.233 710
|
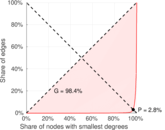
| Left balanced inequality ratio | P1 = | 0.028 256 7
|
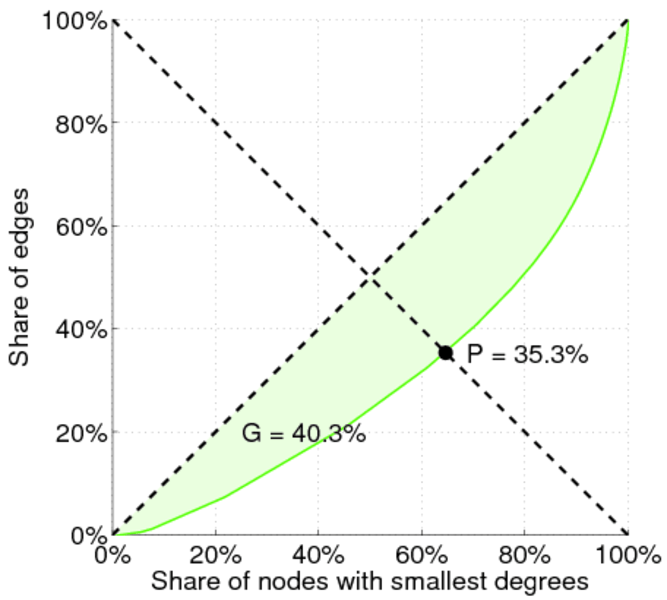
| Right balanced inequality ratio | P2 = | 0.353 336
|
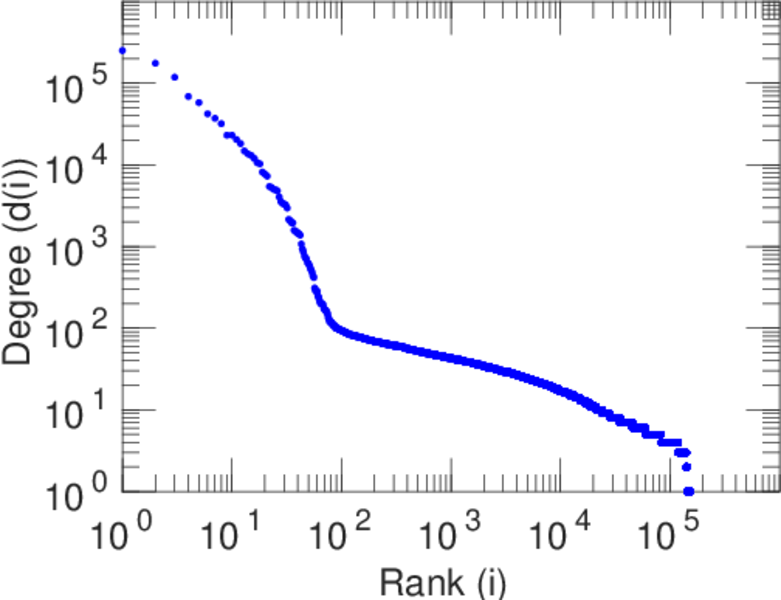
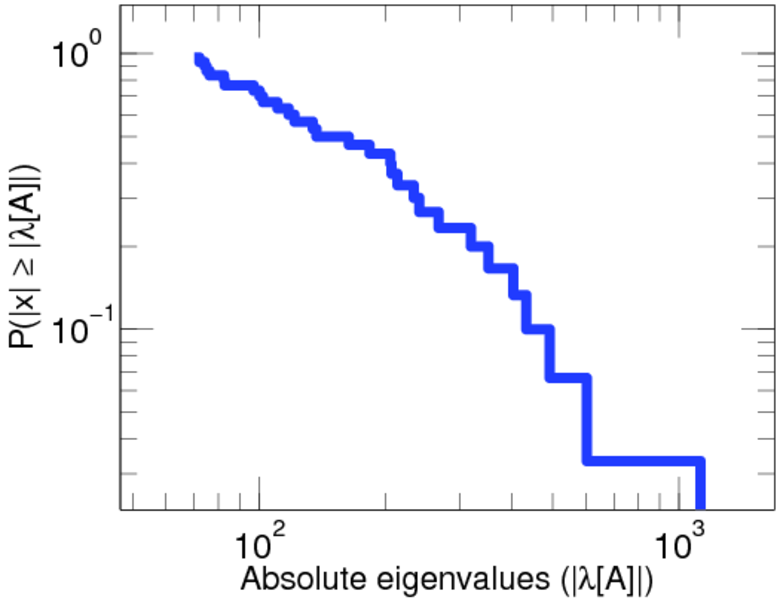
| Tail power law exponent | γt = | 3.461 00
|
| Tail power law exponent with p | γ3 = | 3.461 00
|
| p-value | p = | 0.000 00
|
| Left tail power law exponent with p | γ3,1 = | 1.581 00
|
| Left p-value | p1 = | 0.000 00
|
| Right tail power law exponent with p | γ3,2 = | 8.281 00
|
| Right p-value | p2 = | 0.289 000
|
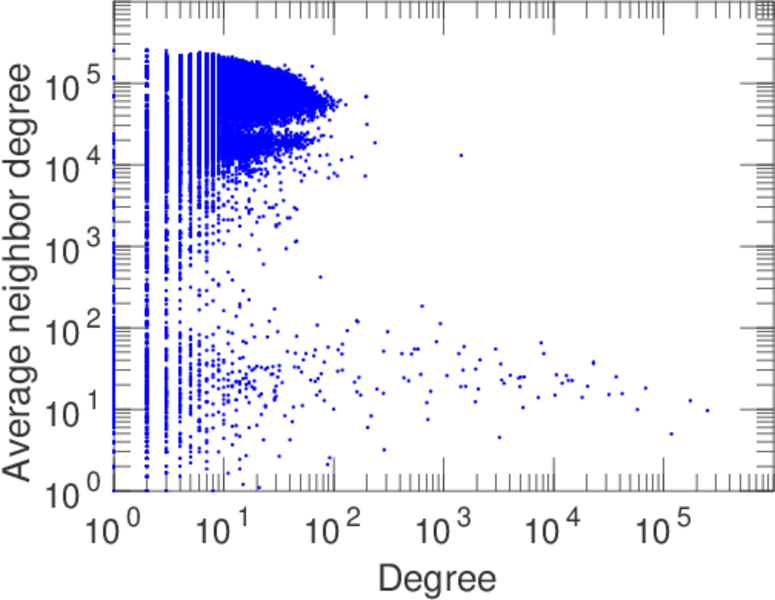
| Degree assortativity | ρ = | −0.427 913
|
| Degree assortativity p-value | pρ = | 0.000 00
|
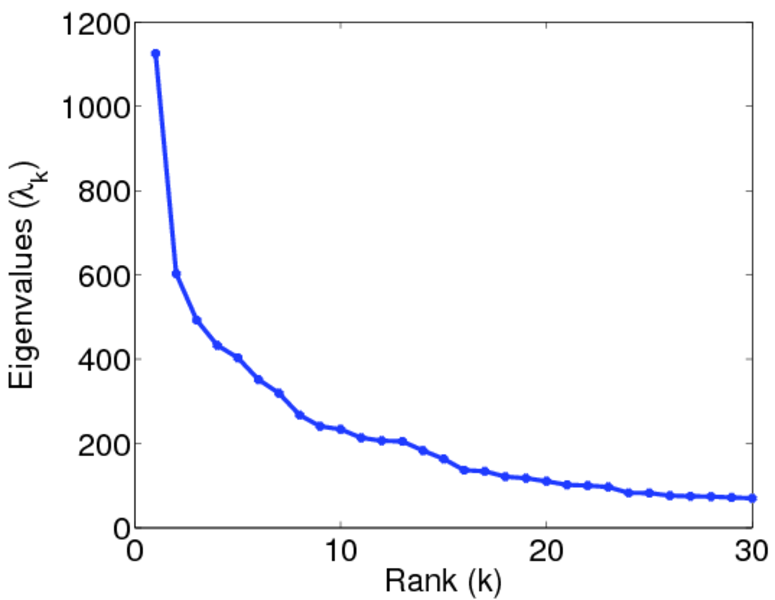
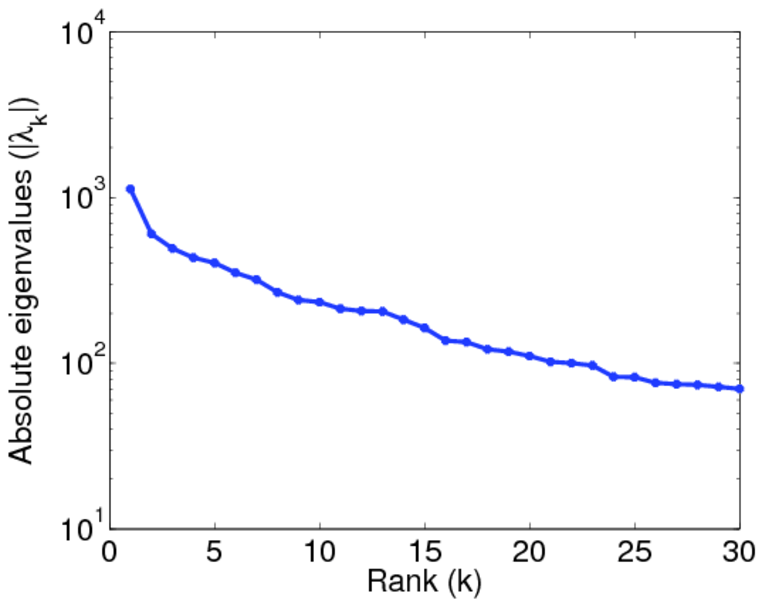
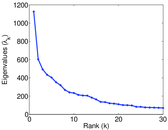
| Spectral norm | α = | 1,125.67
|
| Algebraic connectivity | a = | 0.046 323 3
|
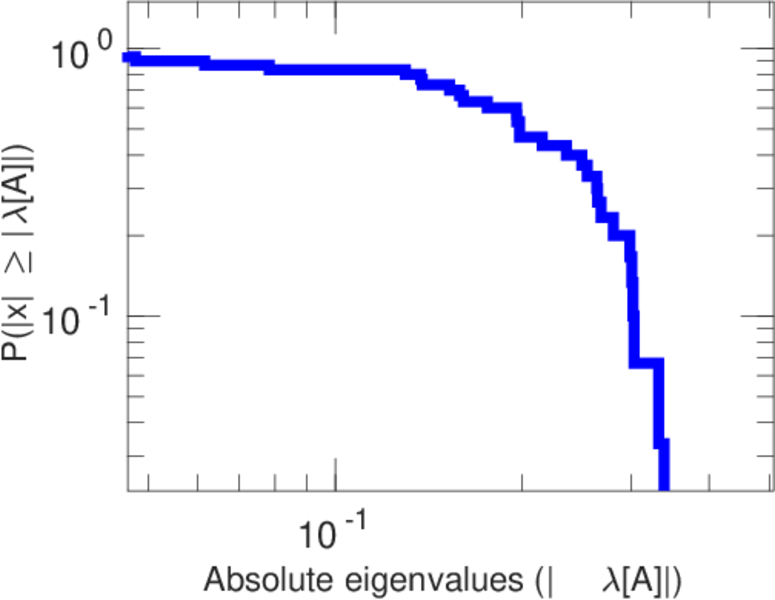
| Spectral separation | |λ1[A] / λ2[A]| = | 1.866 27
|
| Controllability | C = | 151,239
|
| Relative controllability | Cr = | 0.988 045
|
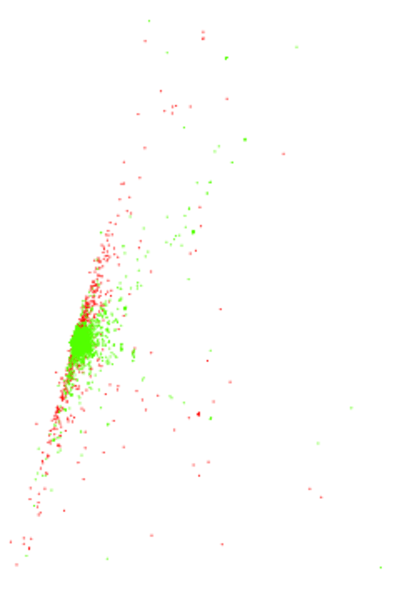
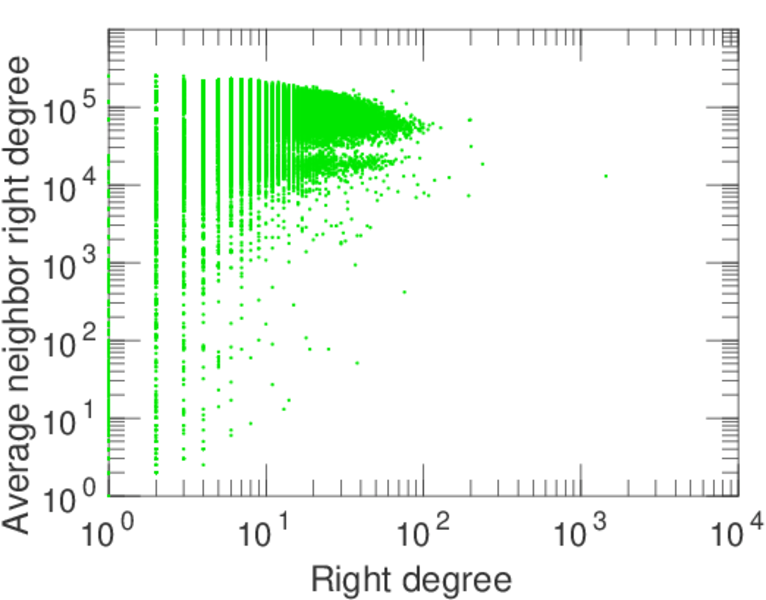
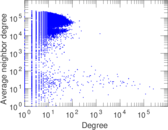
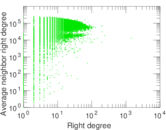
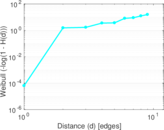
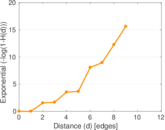
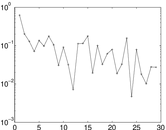
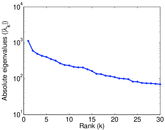
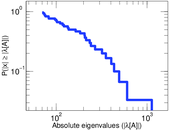
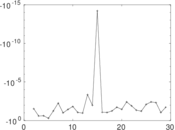
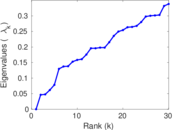
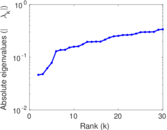
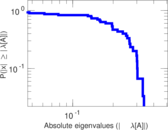
Plots


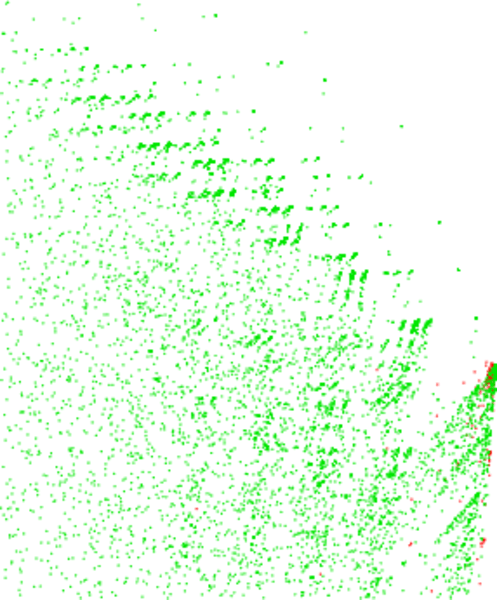
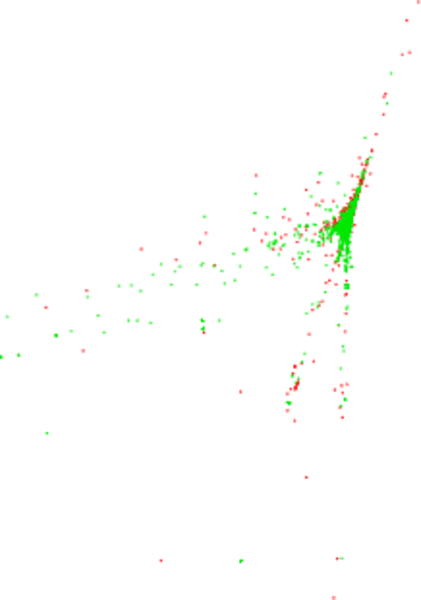
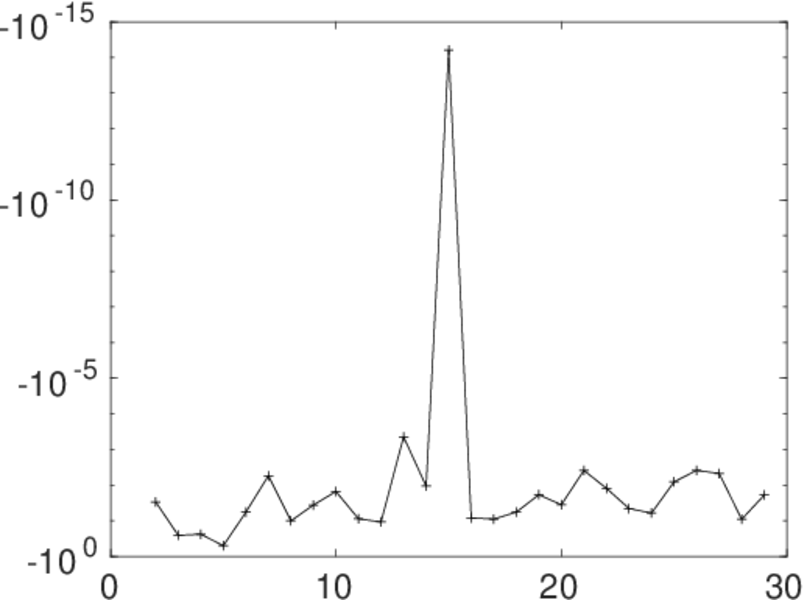
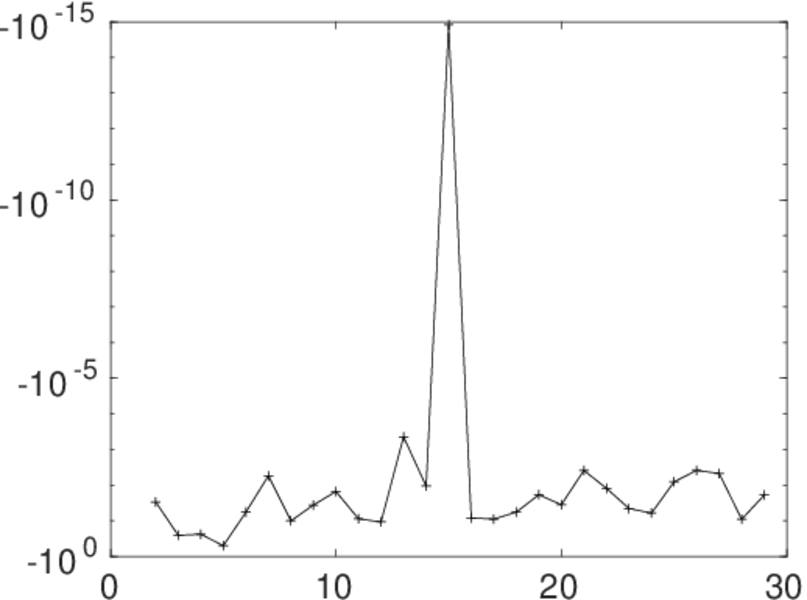
Matrix decompositions plots


Downloads
References
|
[1]
|
Jérôme Kunegis.
KONECT – The Koblenz Network Collection.
In Proc. Int. Conf. on World Wide Web Companion, pages
1343–1350, 2013.
[ http ]
|
|
[2]
|
Wikimedia Foundation.
Wikimedia downloads.
http://dumps.wikimedia.org/, January 2010.
|
 KONECT ‣ Networks ‣
Buy Me a Coffee
KONECT ‣ Networks ‣
Buy Me a Coffee