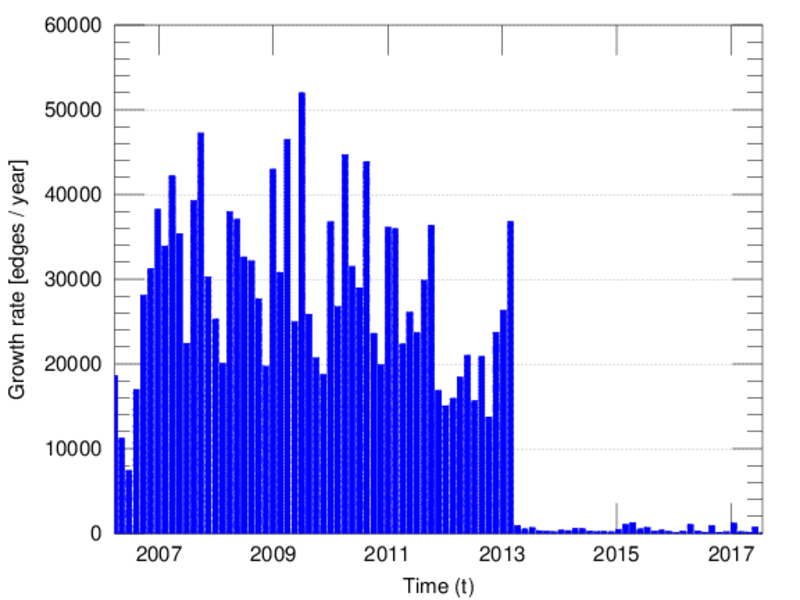
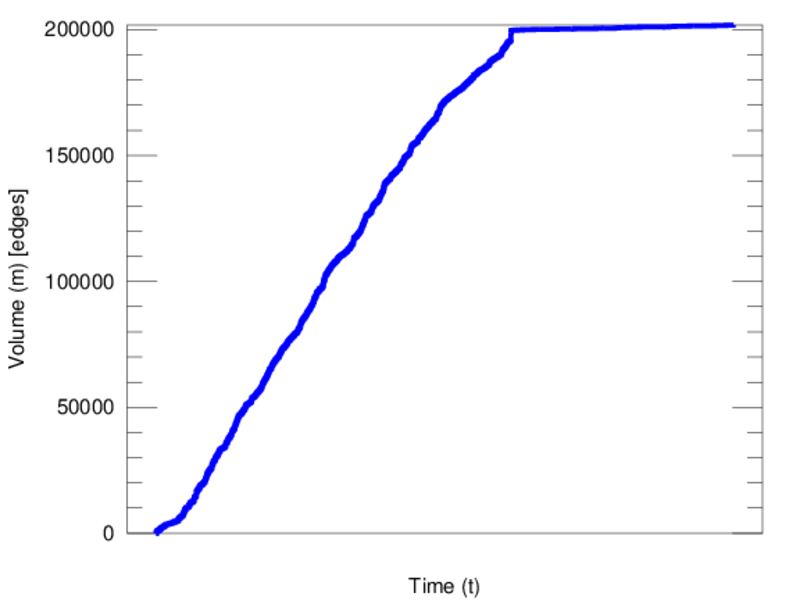
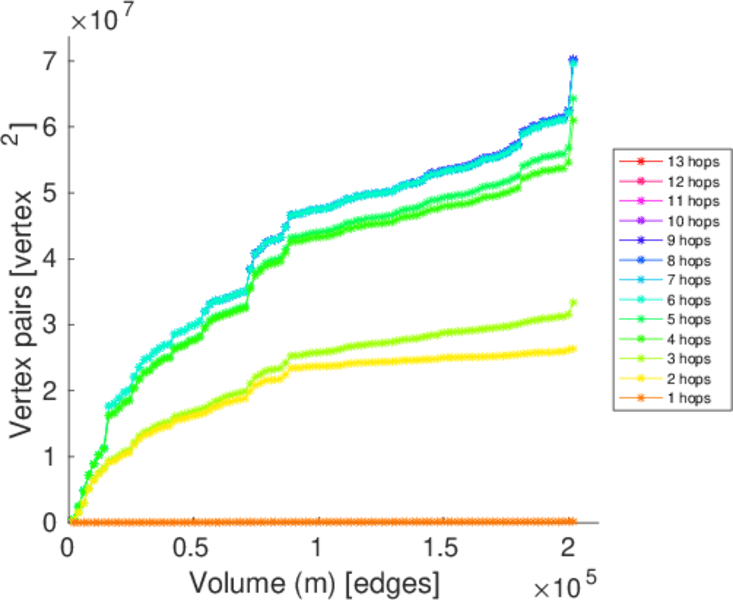
Wikipedia edits (nrm)
This is the bipartite edit network of the Nouormand Wikipedia. It contains
users and pages from the Nouormand Wikipedia, connected by edit events. Each
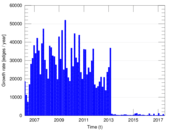
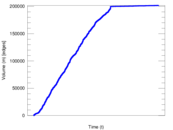
edge represents an edit. The dataset includes the timestamp of each edit.
Metadata
Statistics
| Size | n = | 8,944
|
| Left size | n1 = | 891
|
| Right size | n2 = | 8,053
|
| Volume | m = | 201,831
|
| Unique edge count | m̿ = | 83,068
|
| Wedge count | s = | 79,205,742
|
| Claw count | z = | 67,563,235,681
|
| Cross count | x = | 48,105,958,410,143
|
| Square count | q = | 464,288,828
|
| 4-Tour count | T4 = | 4,031,465,296
|
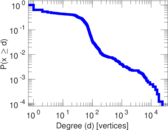
| Maximum degree | dmax = | 24,151
|
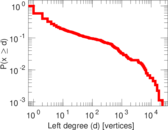
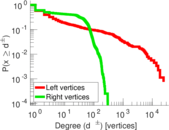
| Maximum left degree | d1max = | 24,151
|
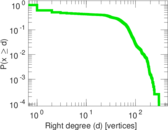
| Maximum right degree | d2max = | 299
|
| Average degree | d = | 45.132 2
|
| Average left degree | d1 = | 226.522
|
| Average right degree | d2 = | 25.062 8
|
| Fill | p = | 0.011 577 1
|
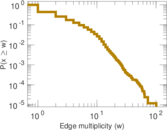
| Average edge multiplicity | m̃ = | 2.429 71
|
| Size of LCC | N = | 8,379
|
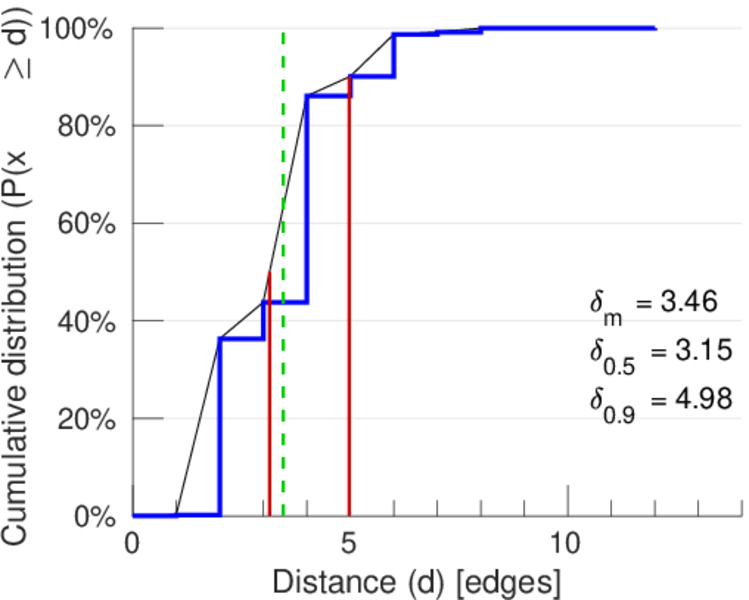
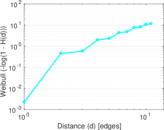
| Diameter | δ = | 12
|
| 50-Percentile effective diameter | δ0.5 = | 3.146 93
|
| 90-Percentile effective diameter | δ0.9 = | 4.981 11
|
| Median distance | δM = | 4
|
| Mean distance | δm = | 3.457 90
|
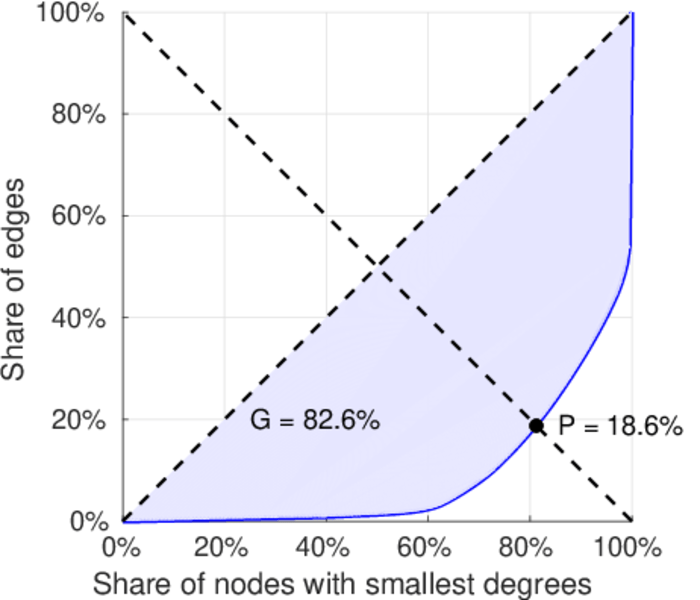
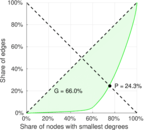
| Gini coefficient | G = | 0.819 137
|
| Balanced inequality ratio | P = | 0.192 352
|
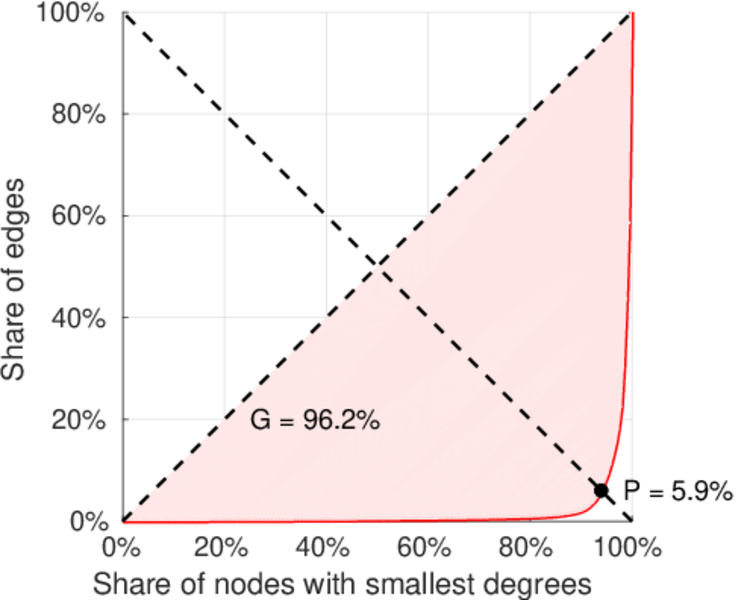
| Left balanced inequality ratio | P1 = | 0.058 667 9
|
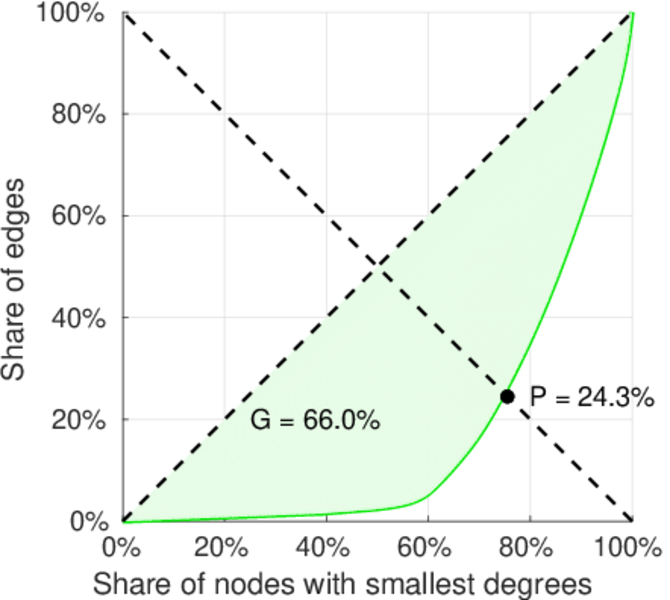
| Right balanced inequality ratio | P2 = | 0.243 382
|
| Relative edge distribution entropy | Her = | 0.766 947
|
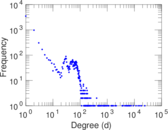
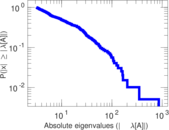
| Power law exponent | γ = | 1.717 79
|
| Tail power law exponent | γt = | 3.071 00
|
| Tail power law exponent with p | γ3 = | 3.071 00
|
| p-value | p = | 0.000 00
|
| Left tail power law exponent with p | γ3,1 = | 1.421 00
|
| Left p-value | p1 = | 0.000 00
|
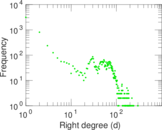
| Right tail power law exponent with p | γ3,2 = | 8.911 00
|
| Right p-value | p2 = | 0.013 000 0
|
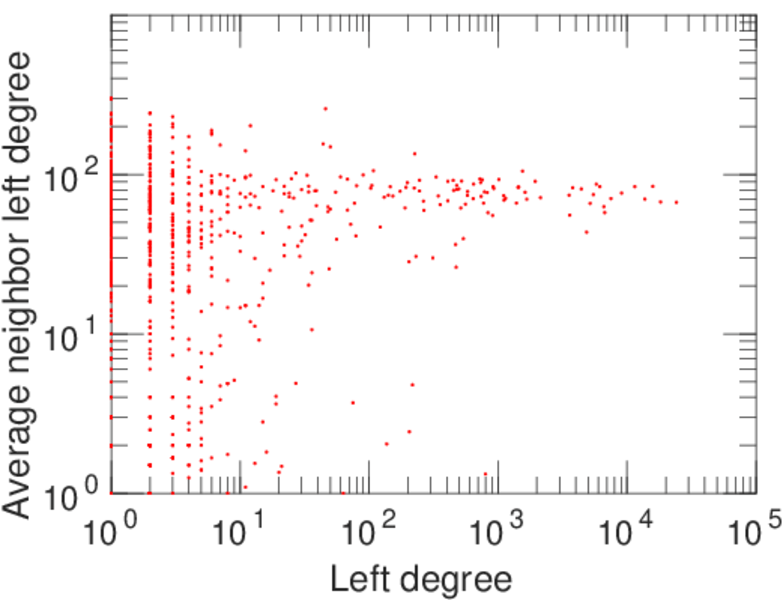
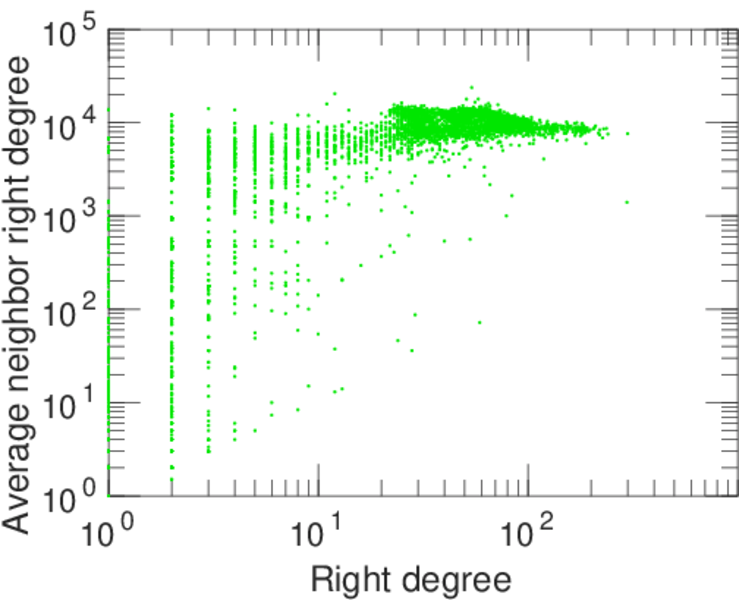
| Degree assortativity | ρ = | −0.107 643
|
| Degree assortativity p-value | pρ = | 1.543 26 × 10−212
|
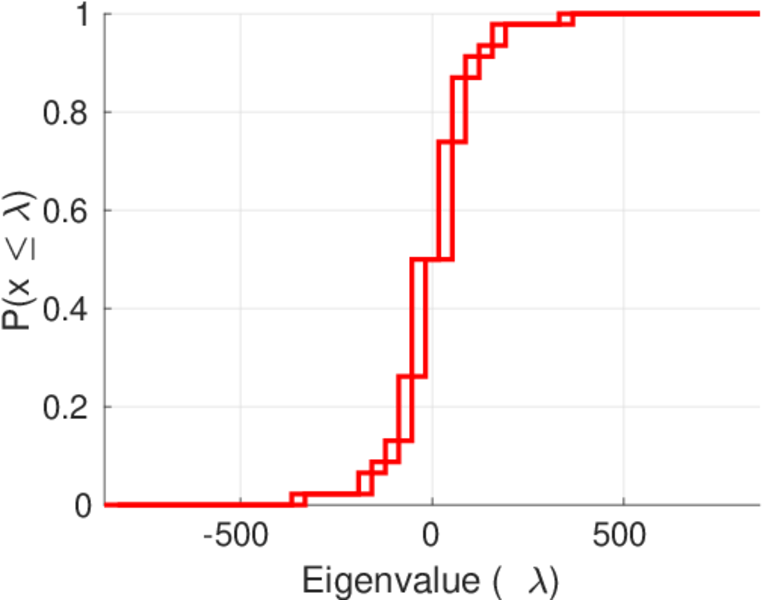
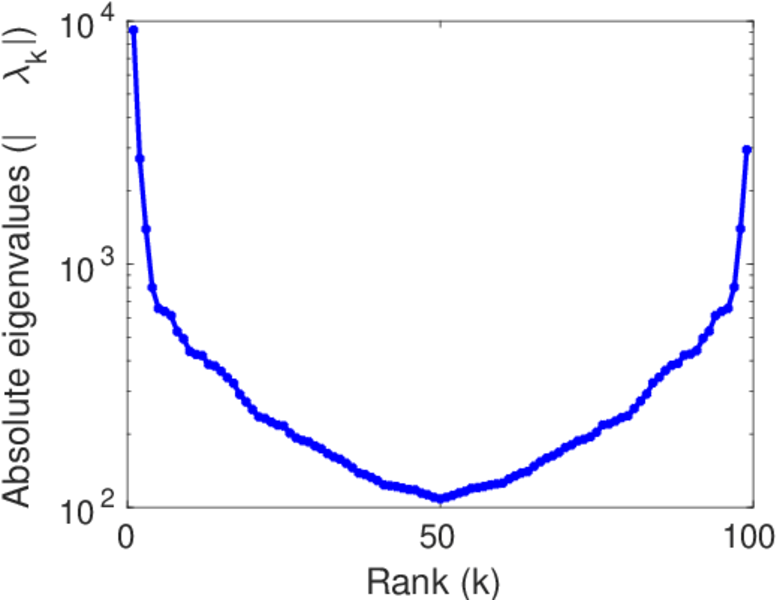
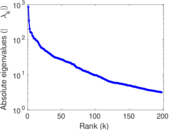
| Spectral norm | α = | 855.769
|
| Algebraic connectivity | a = | 0.039 474 8
|
| Spectral separation | |λ1[A] / λ2[A]| = | 2.451 02
|
| Controllability | C = | 7,193
|
| Relative controllability | Cr = | 0.811 119
|
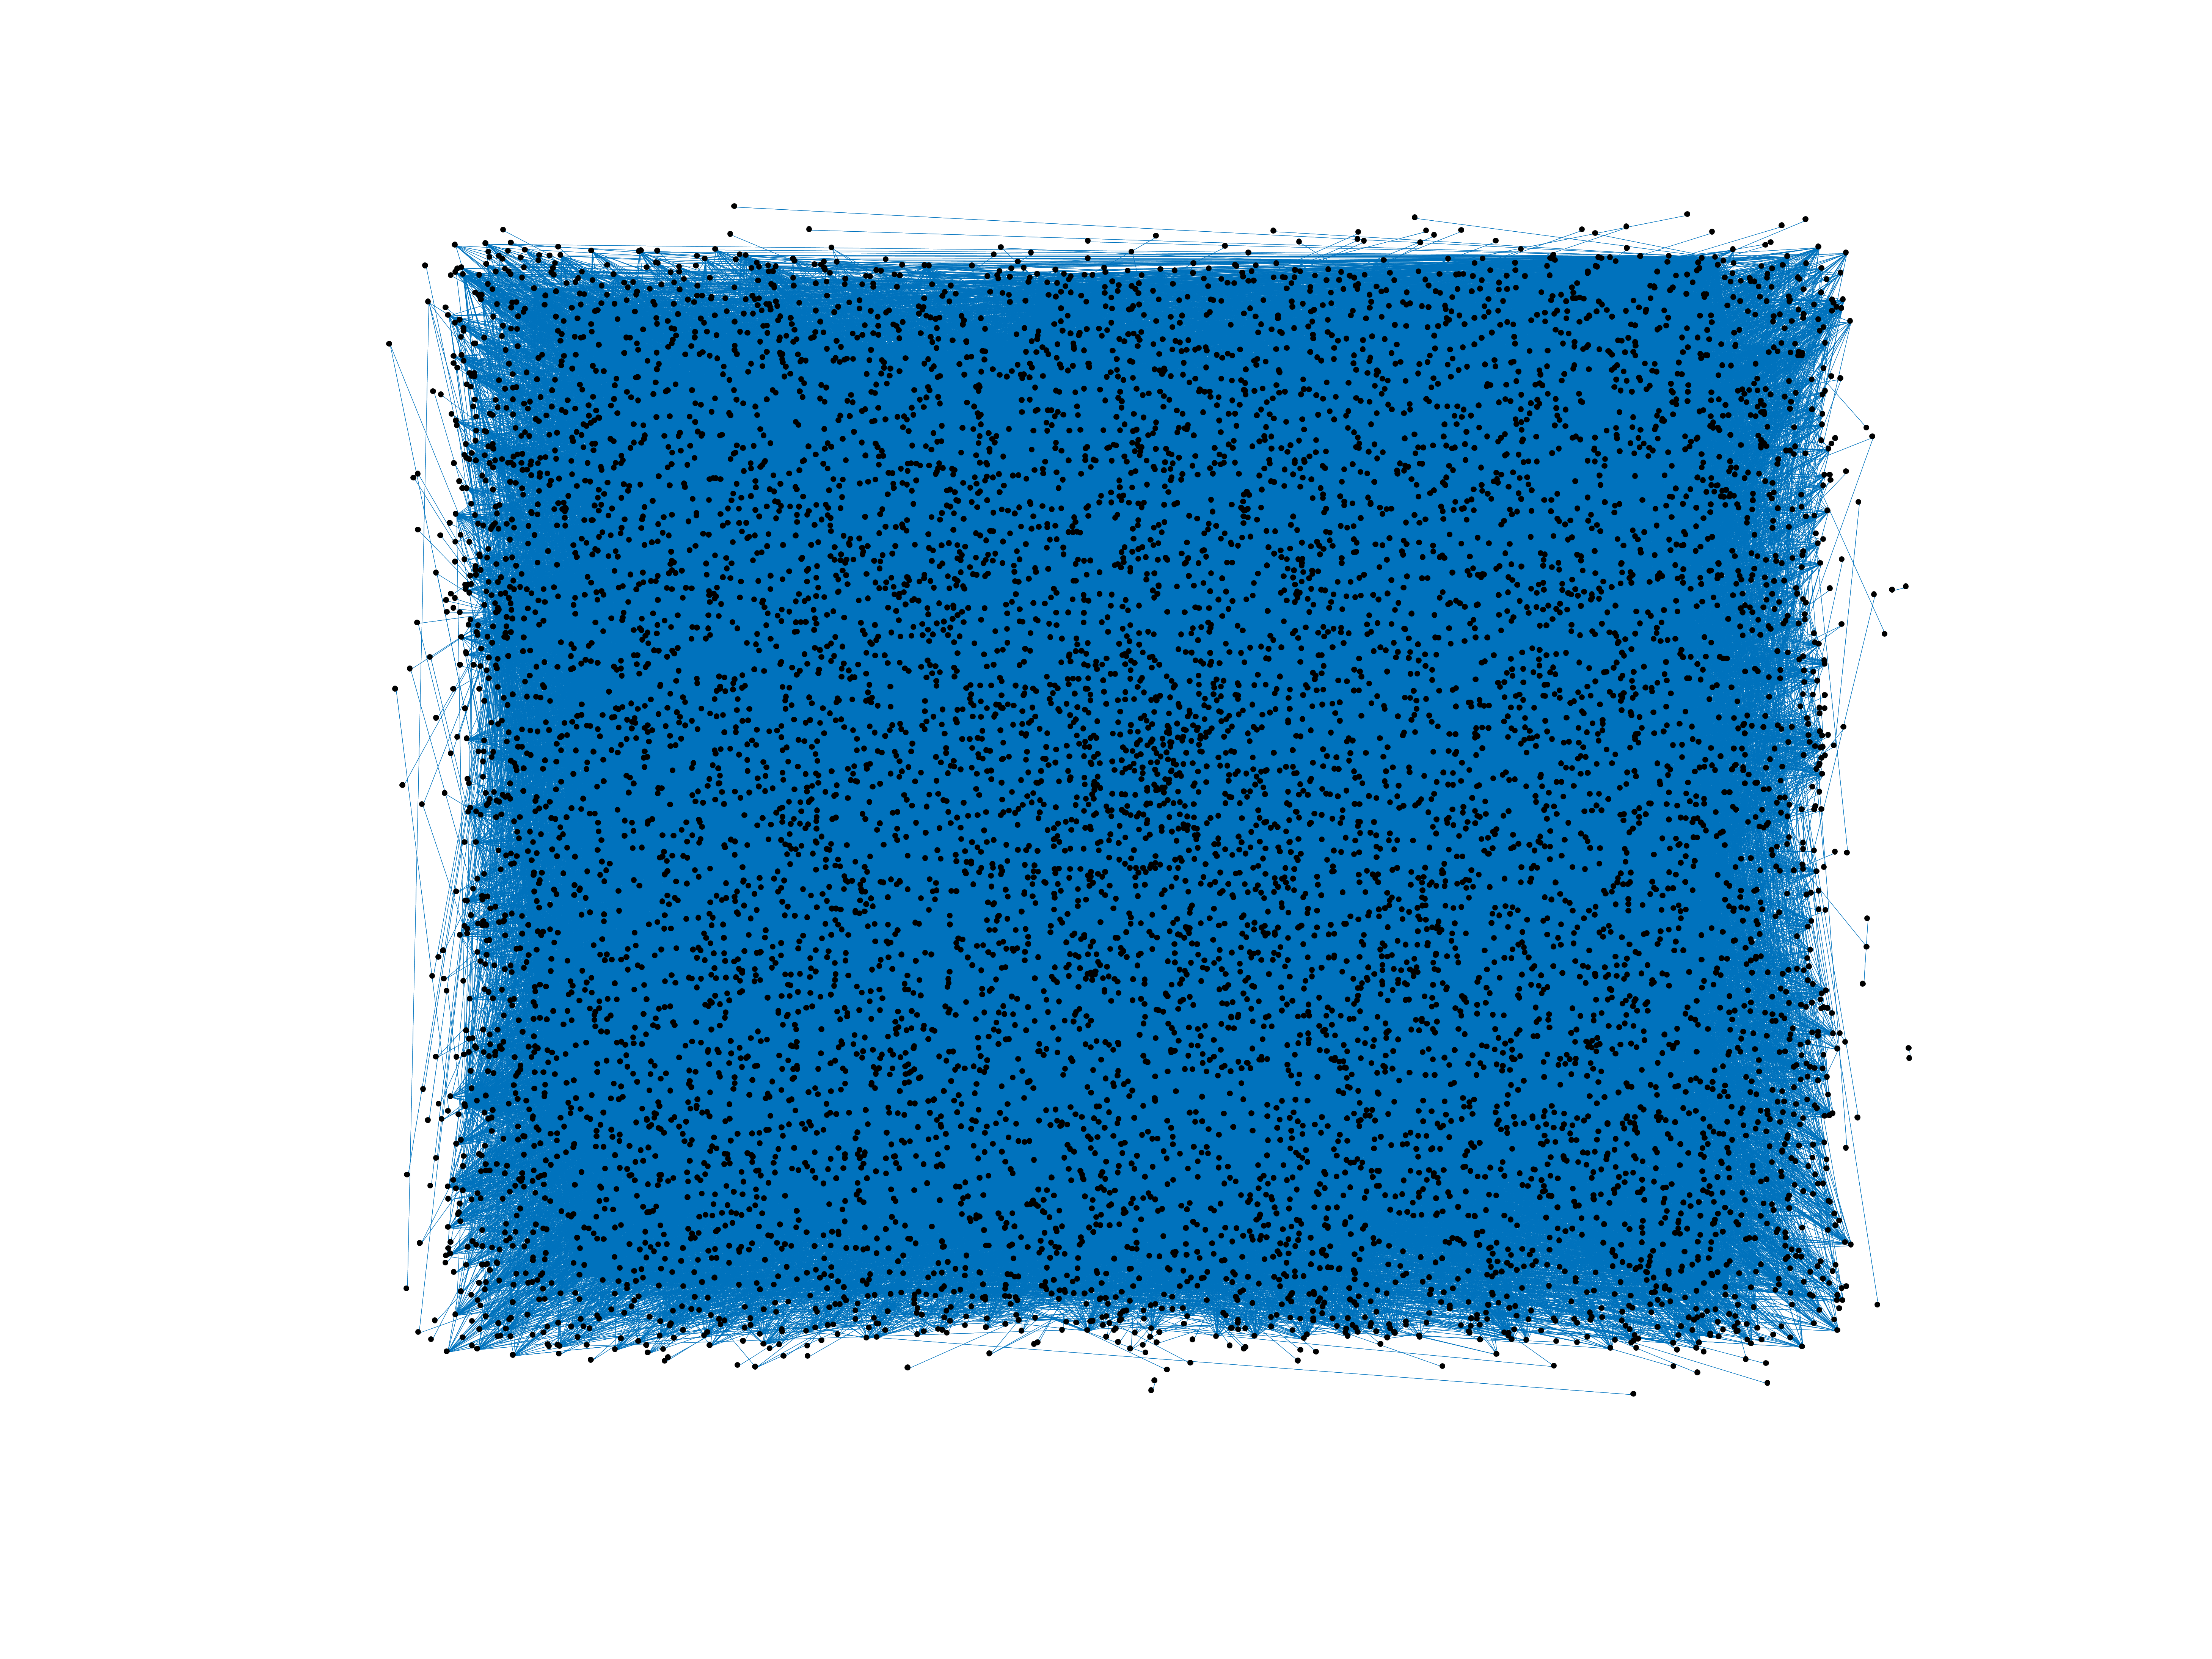
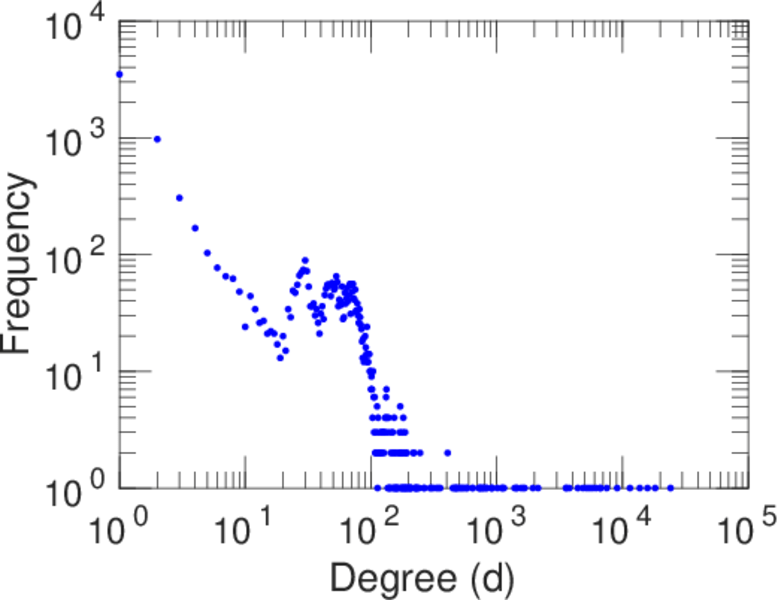
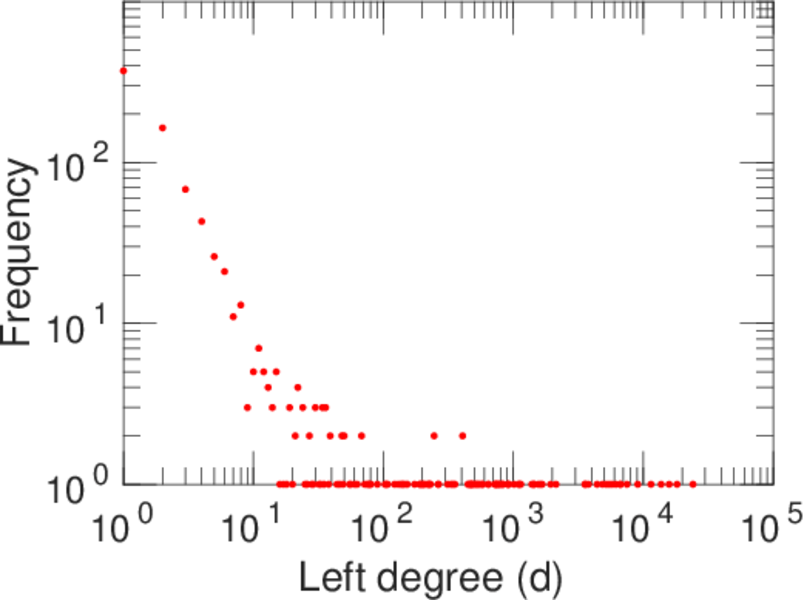
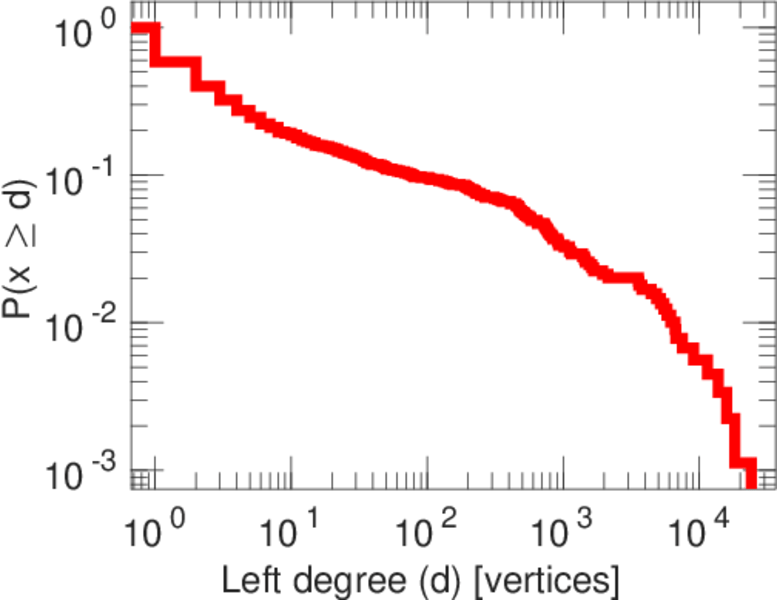
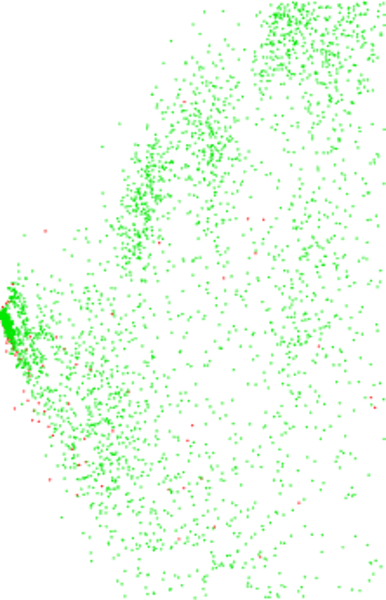
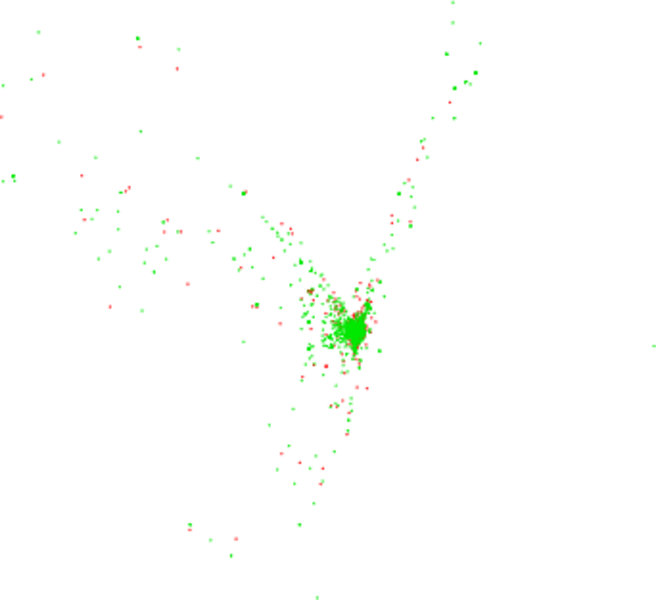
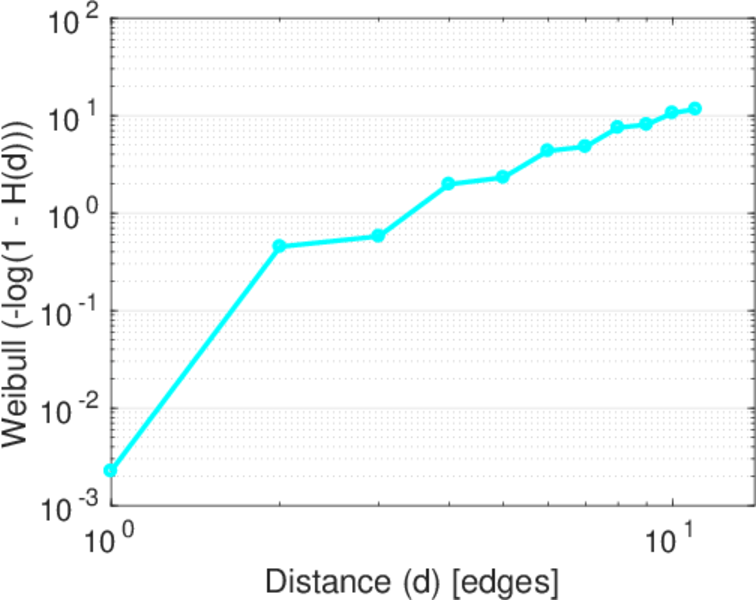
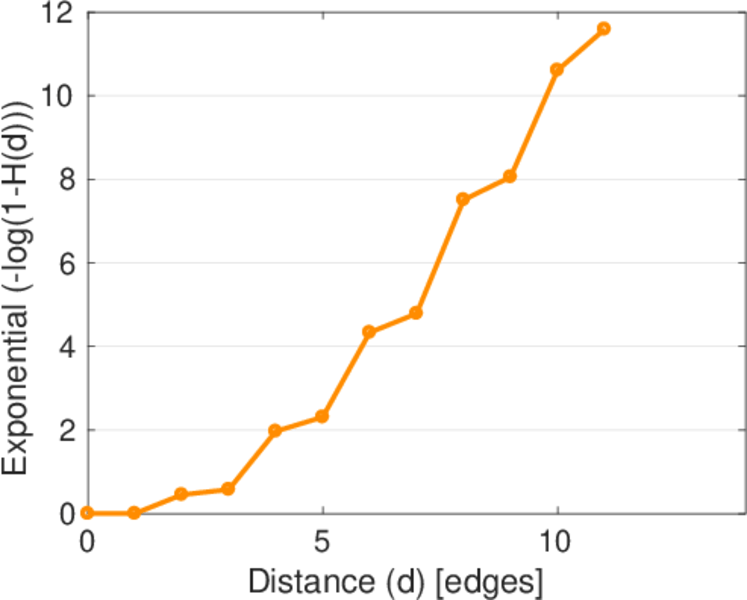
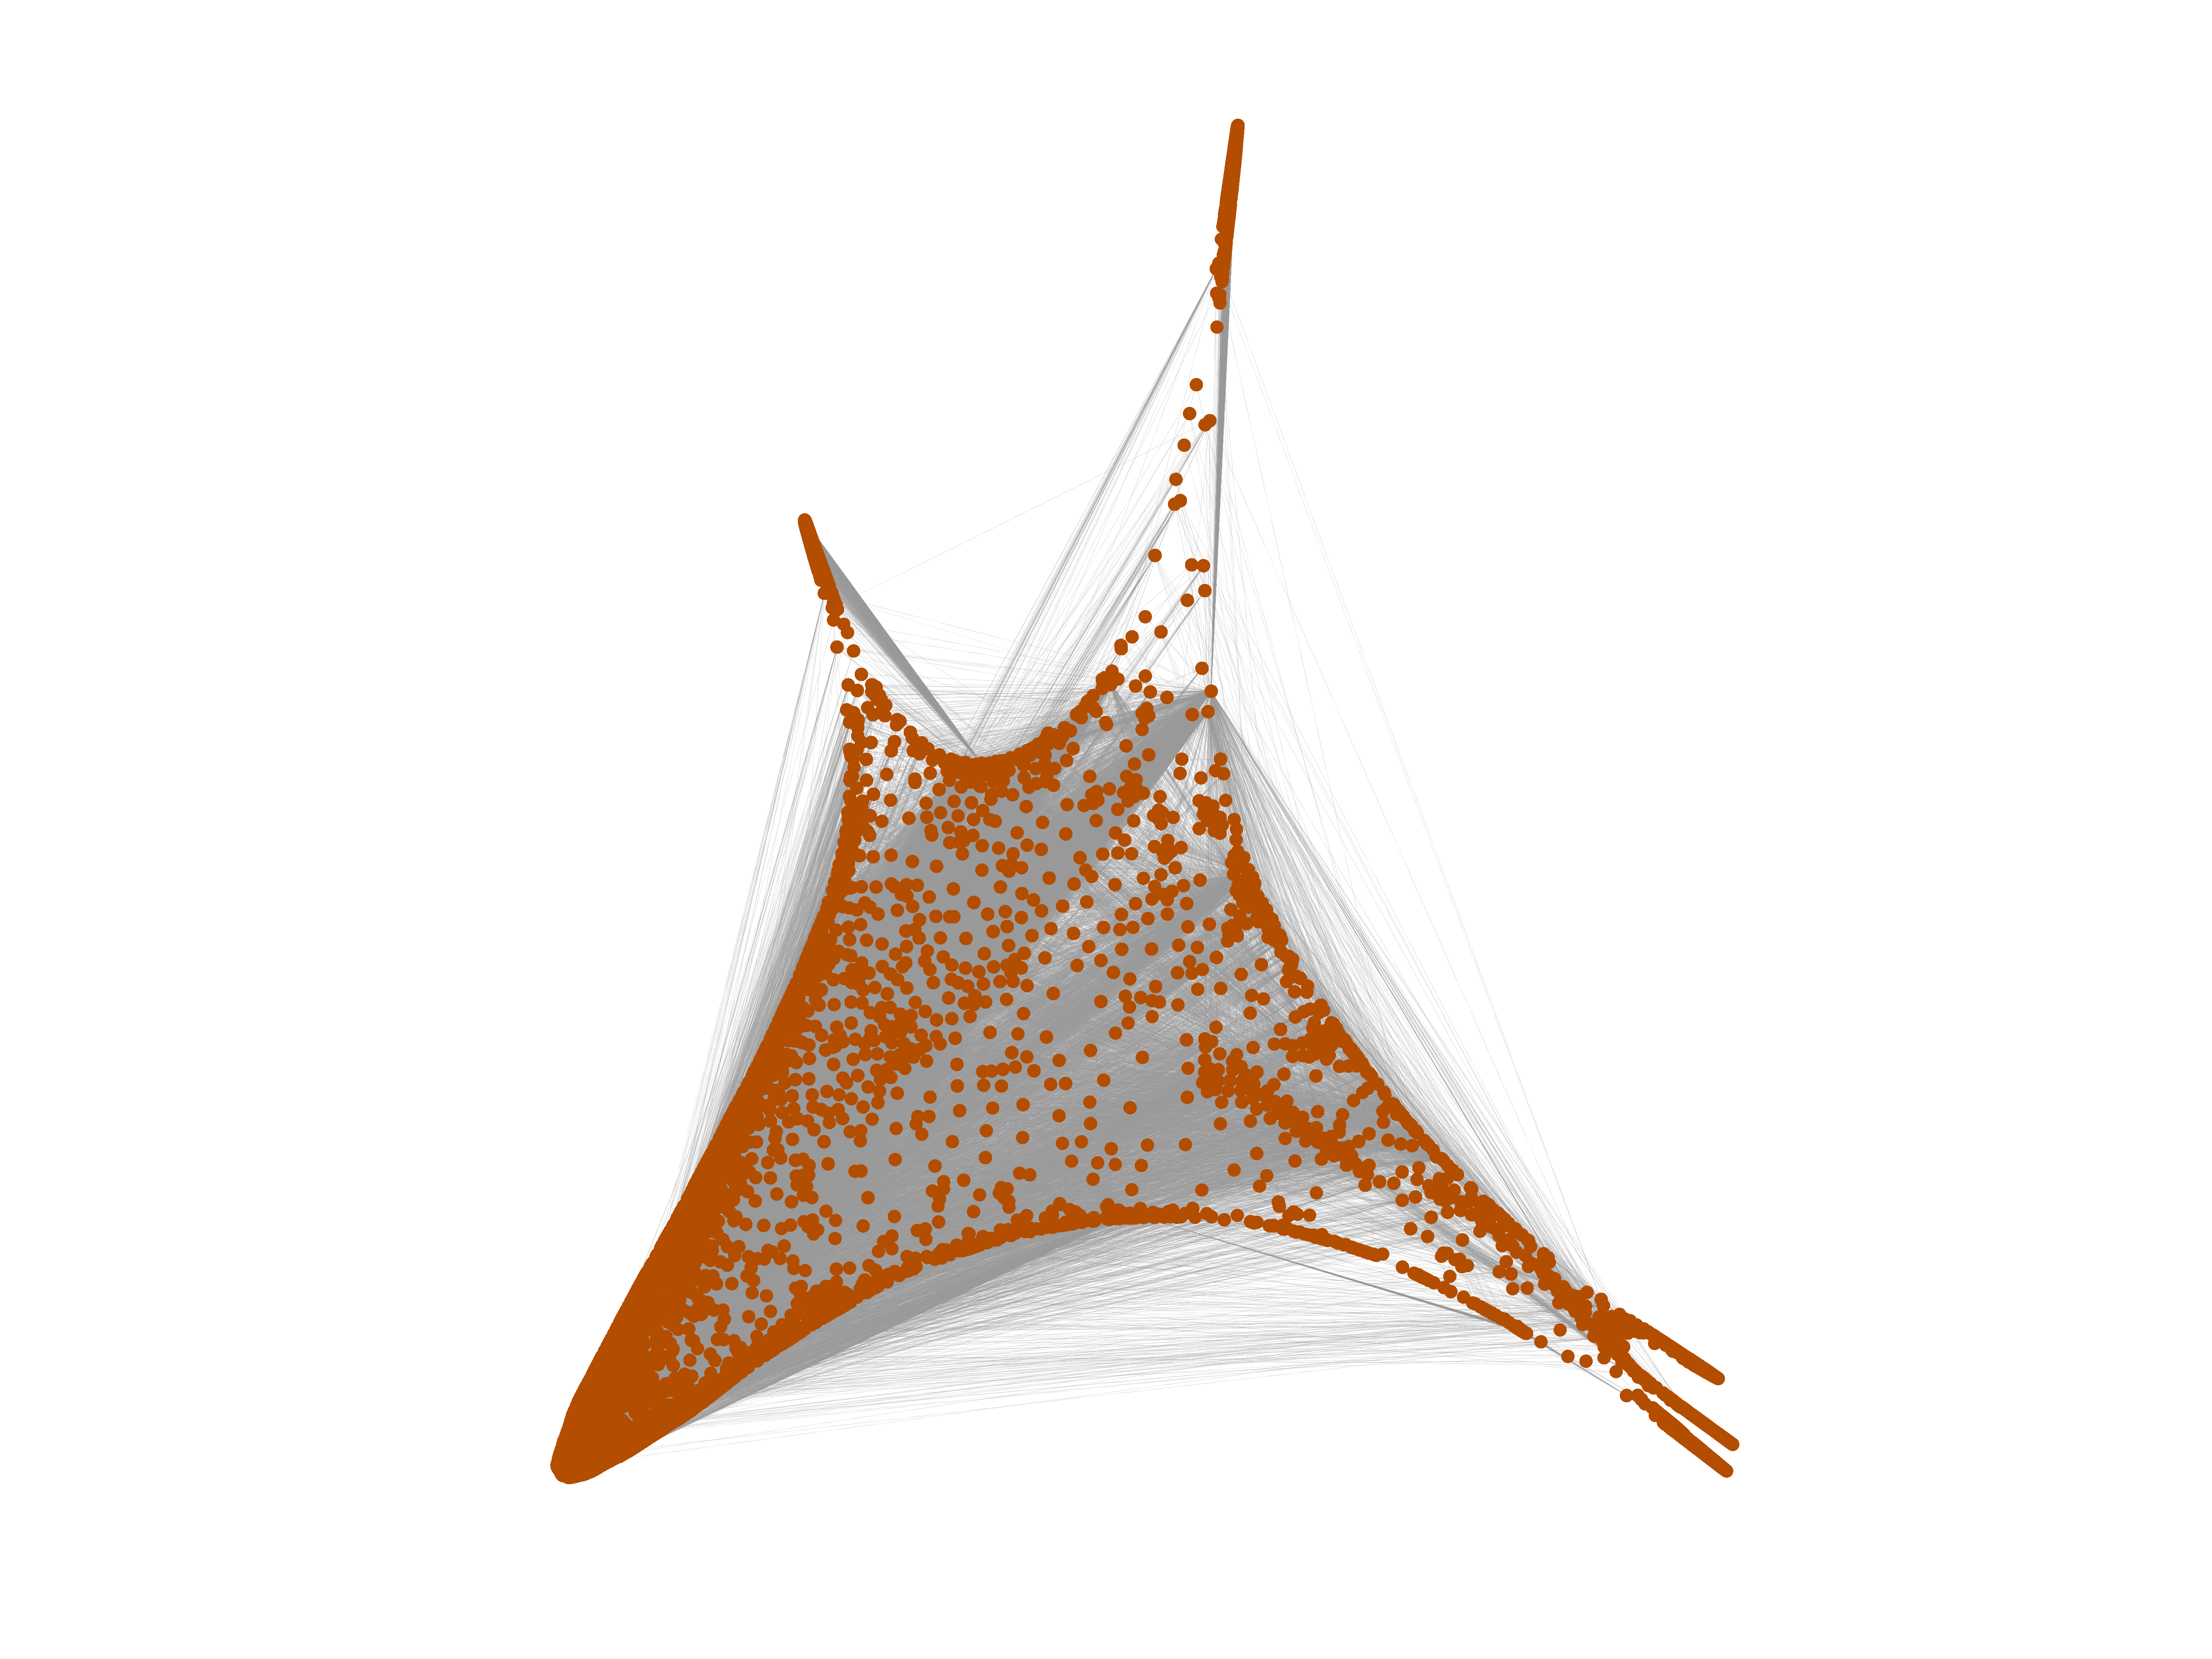
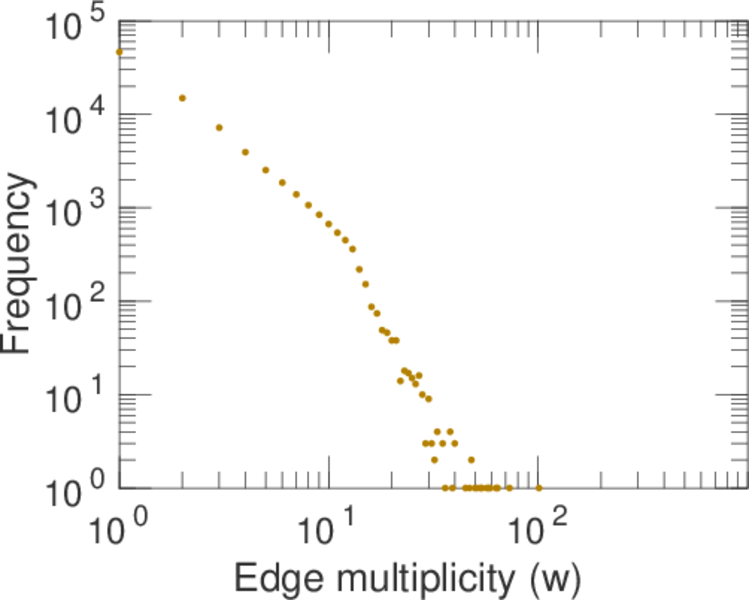
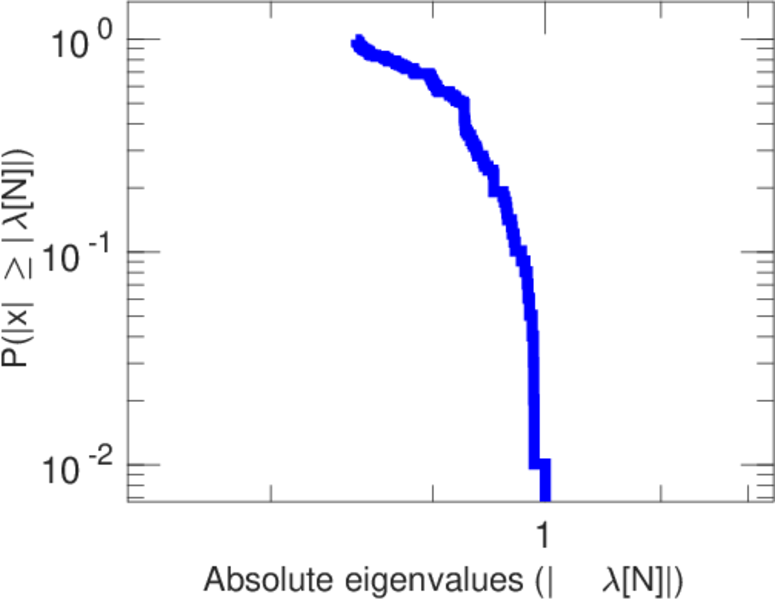
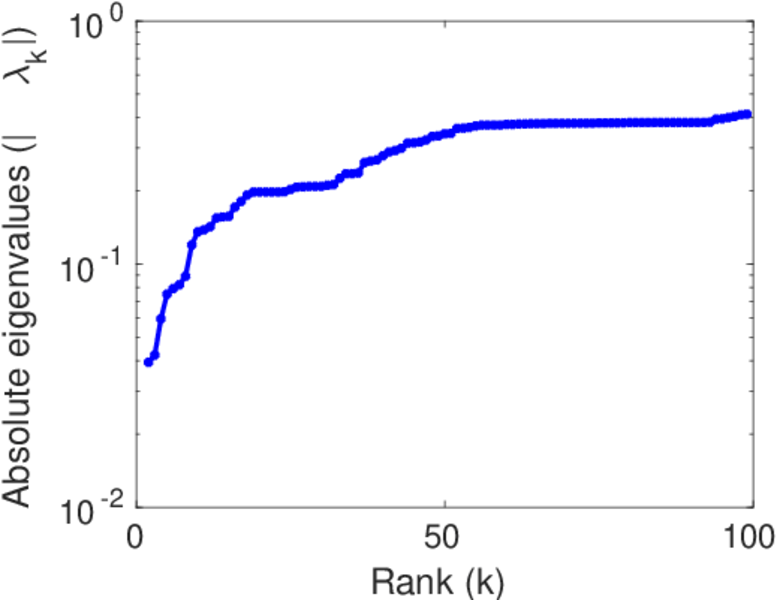
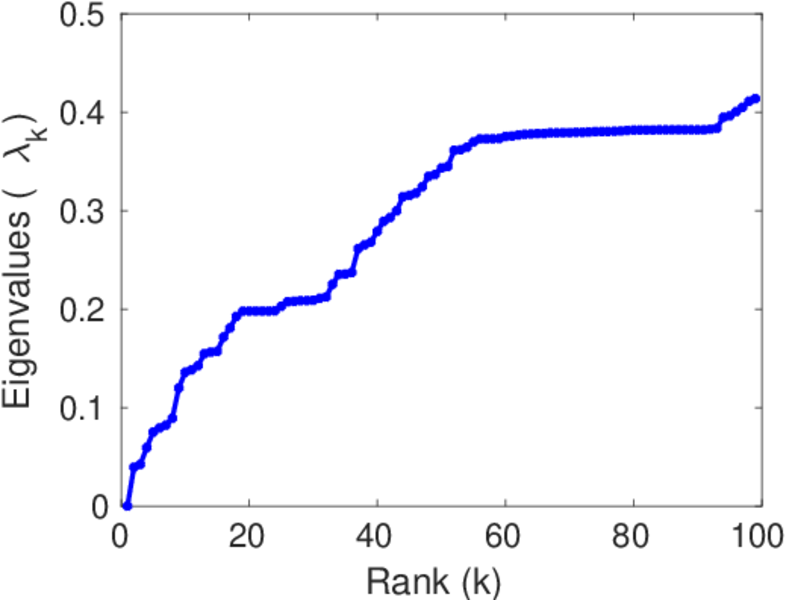
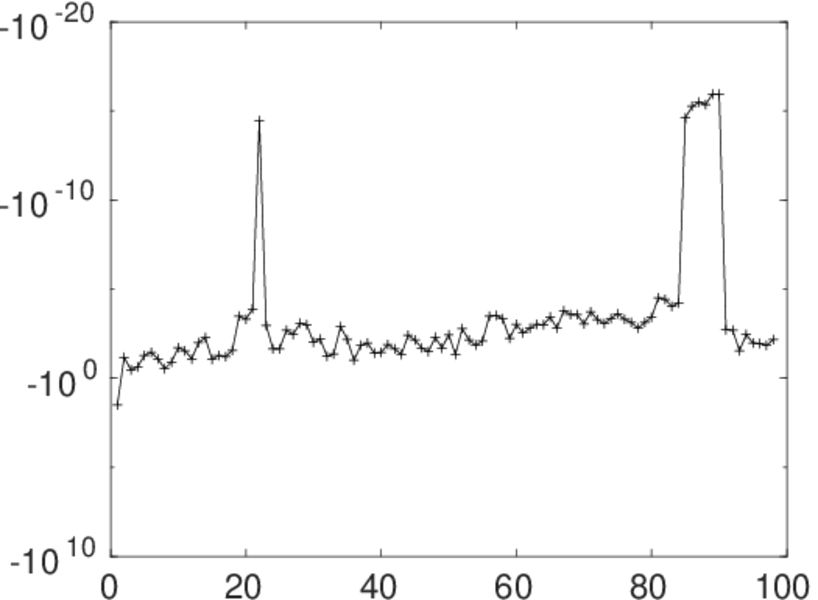
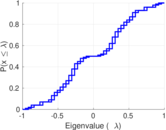
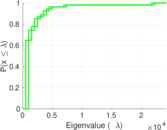
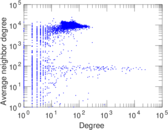
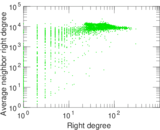
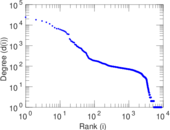
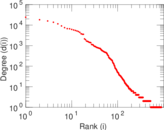
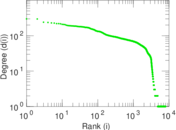
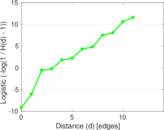
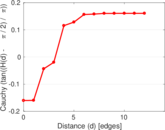
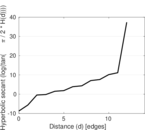
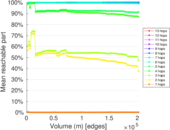
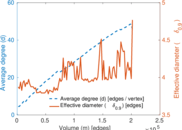
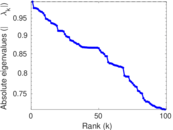
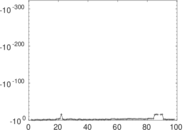
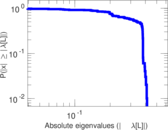
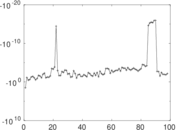
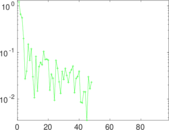
Plots


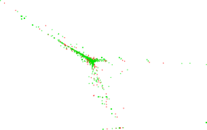
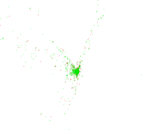


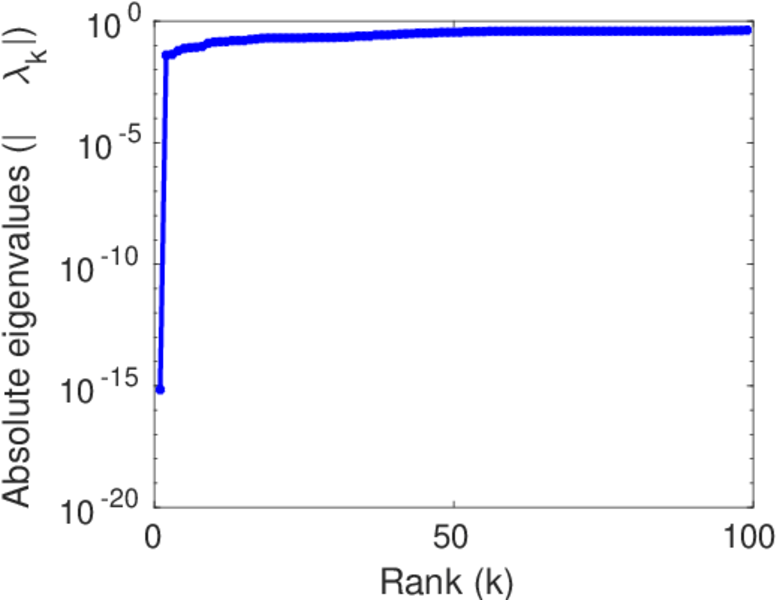
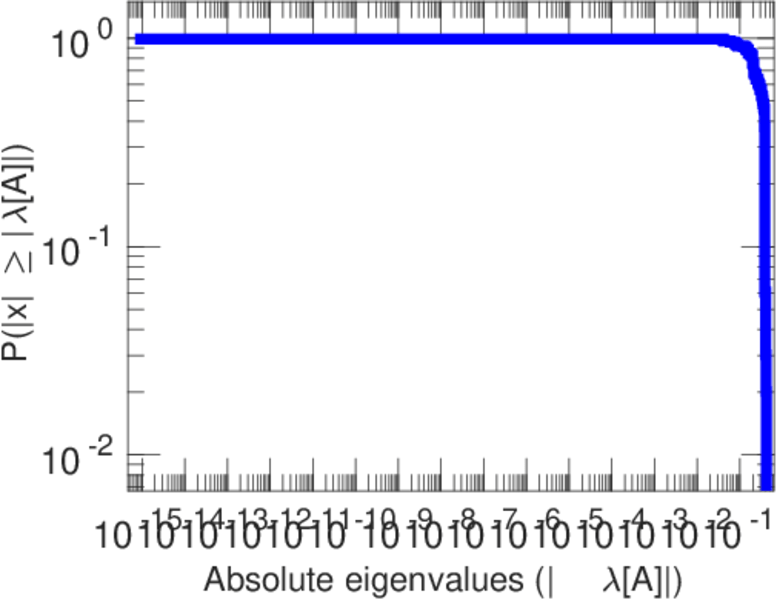
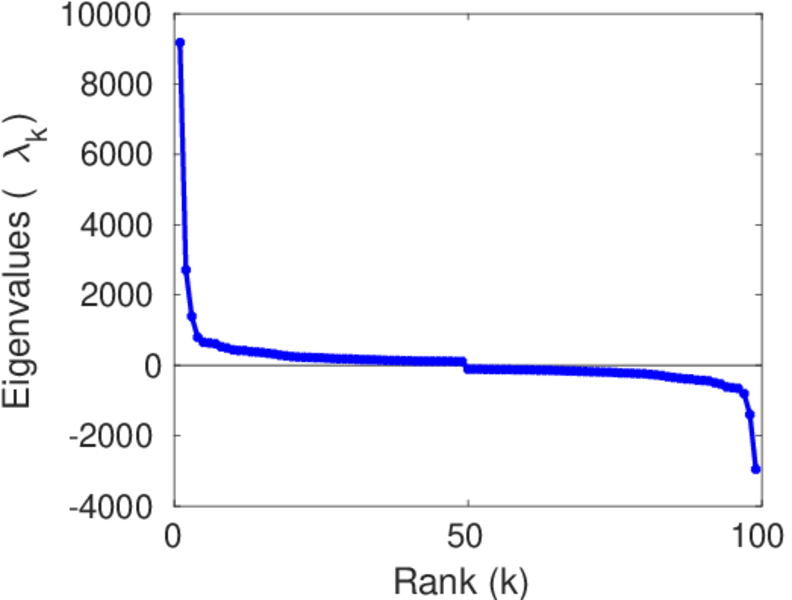
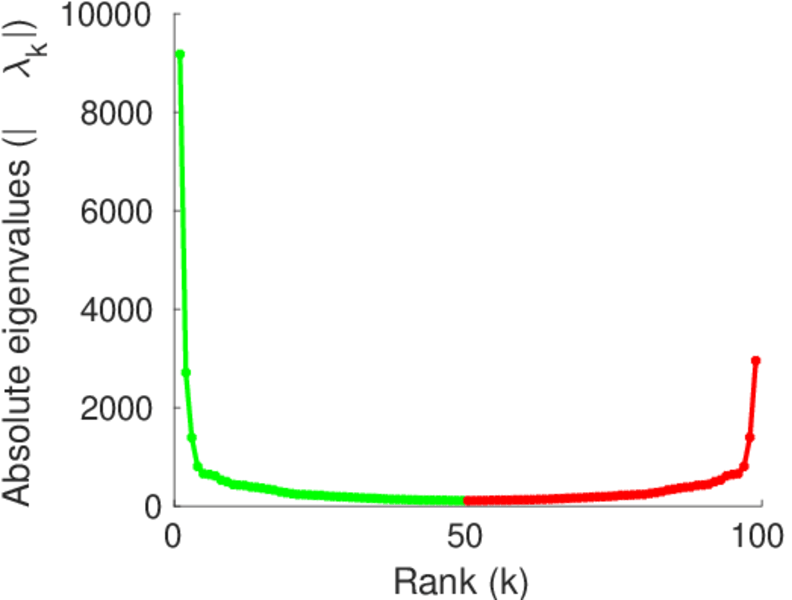
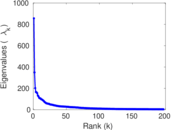
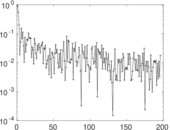
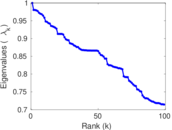
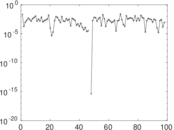
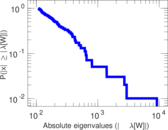
Matrix decompositions plots


Downloads
References
|
[1]
|
Jérôme Kunegis.
KONECT – The Koblenz Network Collection.
In Proc. Int. Conf. on World Wide Web Companion, pages
1343–1350, 2013.
[ http ]
|
|
[2]
|
Wikimedia Foundation.
Wikimedia downloads.
http://dumps.wikimedia.org/, January 2010.
|
 KONECT ‣ Networks ‣
Buy Me a Coffee
KONECT ‣ Networks ‣
Buy Me a Coffee