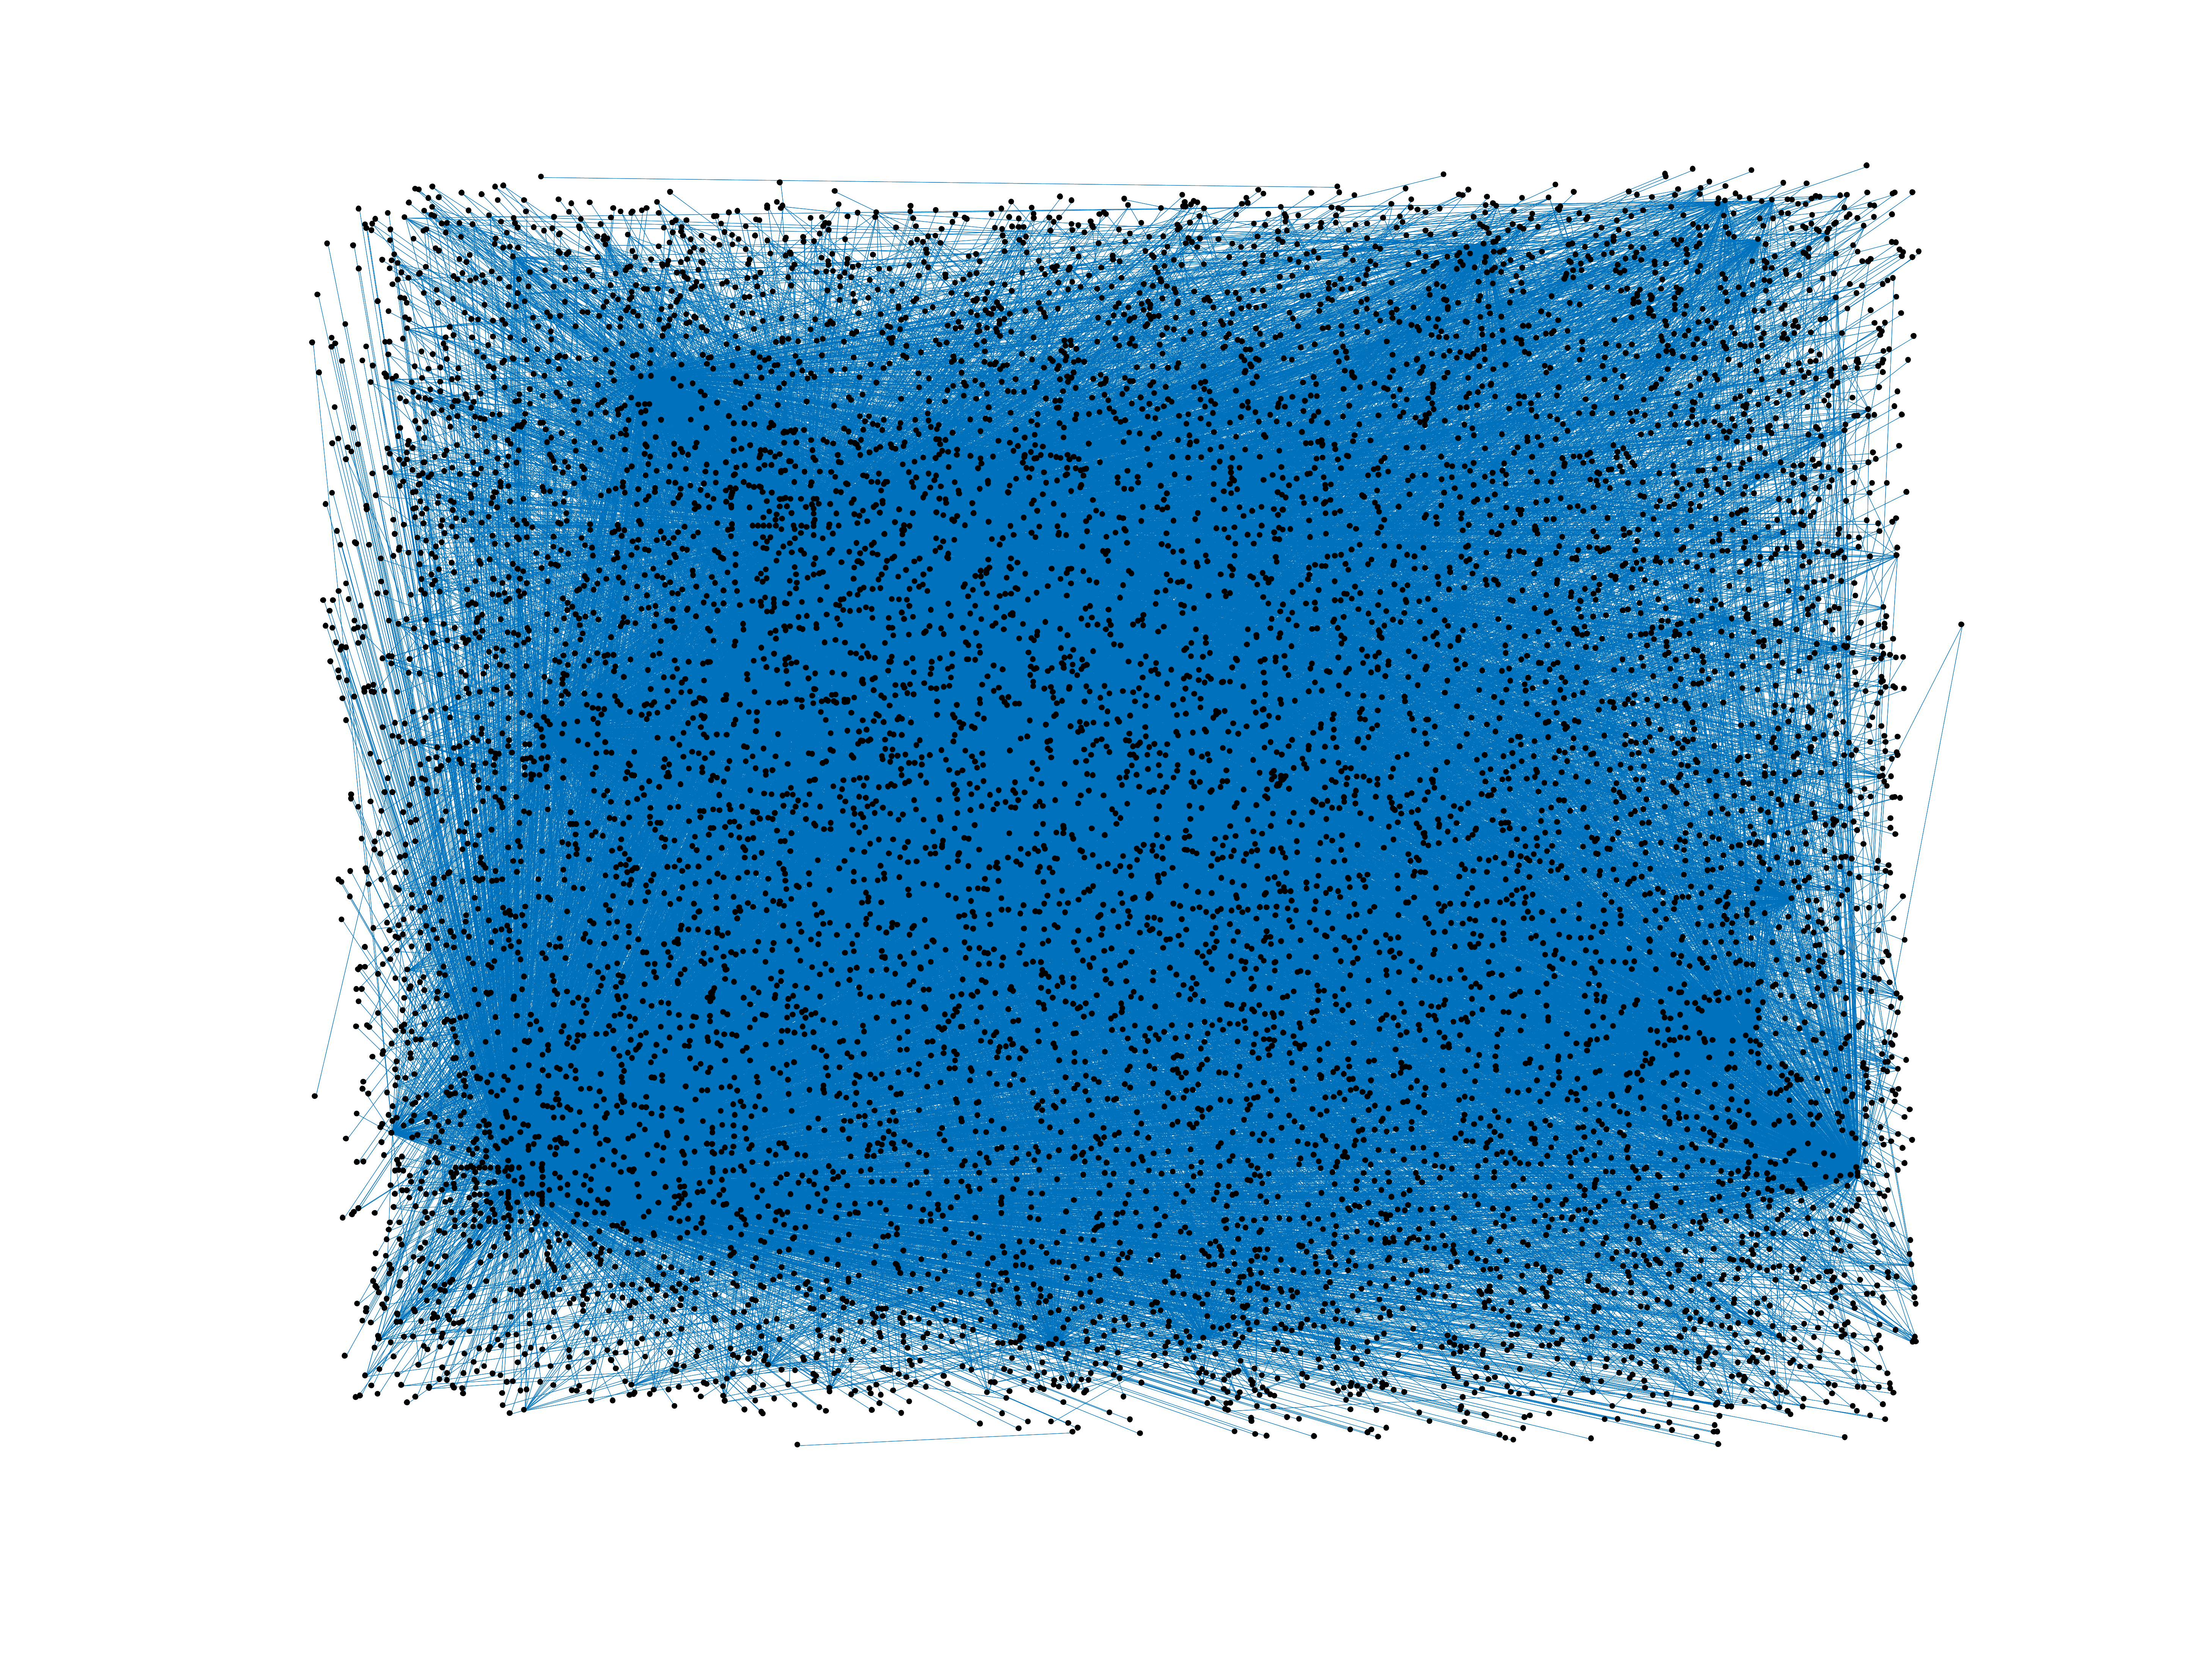
Wikipedia edits (nso)
This is the bipartite edit network of the Northern Sotho Wikipedia. It contains
users and pages from the Northern Sotho Wikipedia, connected by edit events.
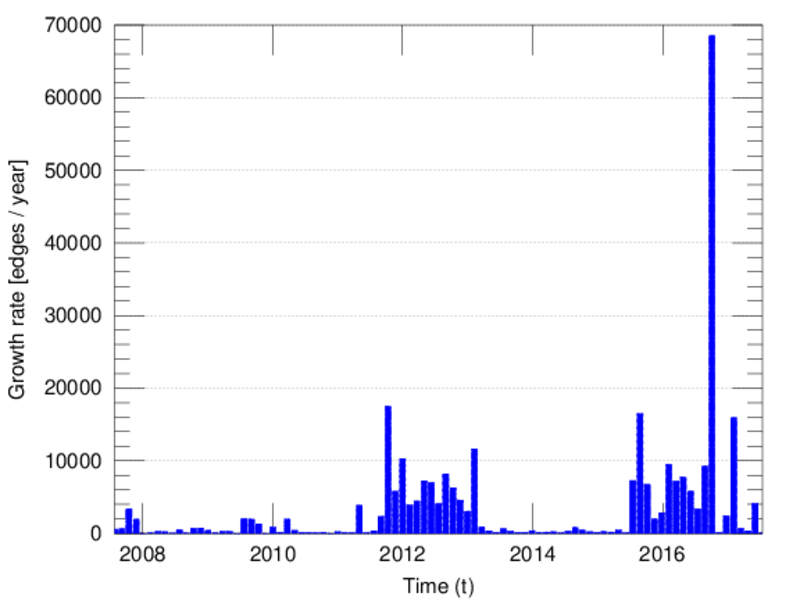
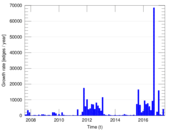
Each edge represents an edit. The dataset includes the timestamp of each edit.
Metadata
Statistics
| Size | n = | 9,785
|
| Left size | n1 = | 353
|
| Right size | n2 = | 9,432
|
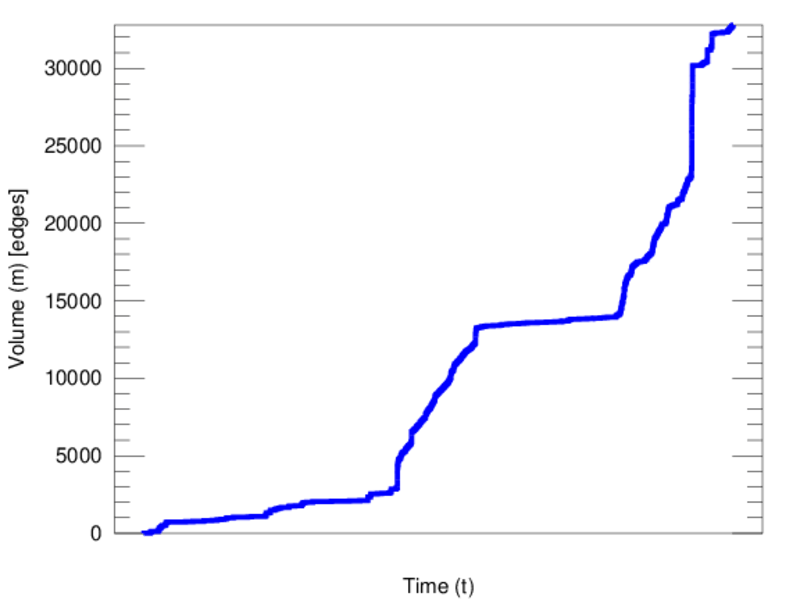
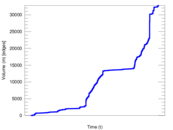
| Volume | m = | 32,788
|
| Unique edge count | m̿ = | 17,558
|
| Wedge count | s = | 22,032,043
|
| Claw count | z = | 30,810,449,653
|
| Cross count | x = | 36,105,351,527,815
|
| Square count | q = | 4,647,211
|
| 4-Tour count | T4 = | 125,381,444
|
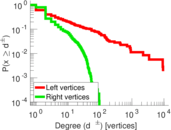
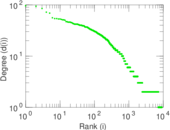
| Maximum degree | dmax = | 9,360
|
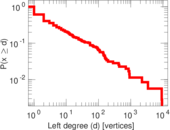
| Maximum left degree | d1max = | 9,360
|
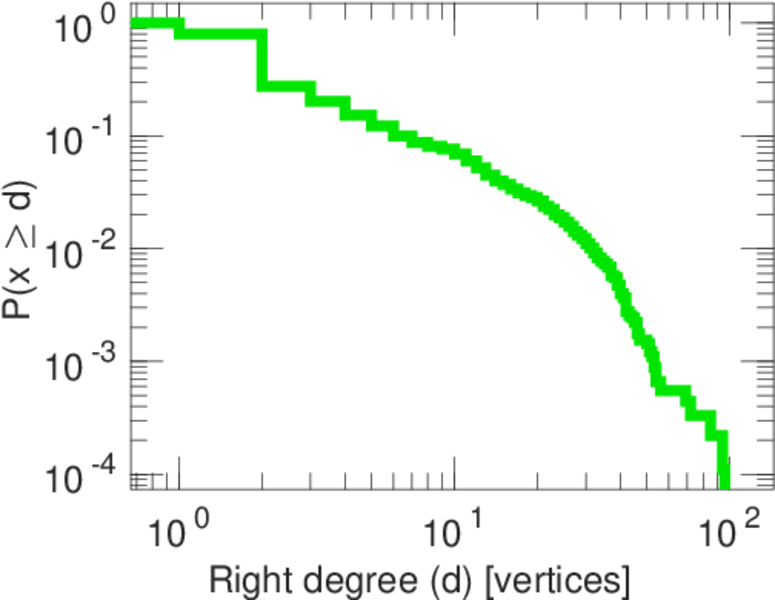
| Maximum right degree | d2max = | 96
|
| Average degree | d = | 6.701 69
|
| Average left degree | d1 = | 92.883 9
|
| Average right degree | d2 = | 3.476 25
|
| Fill | p = | 0.005 273 47
|
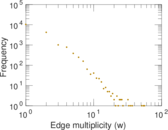
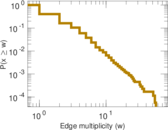
| Average edge multiplicity | m̃ = | 1.867 41
|
| Size of LCC | N = | 9,148
|
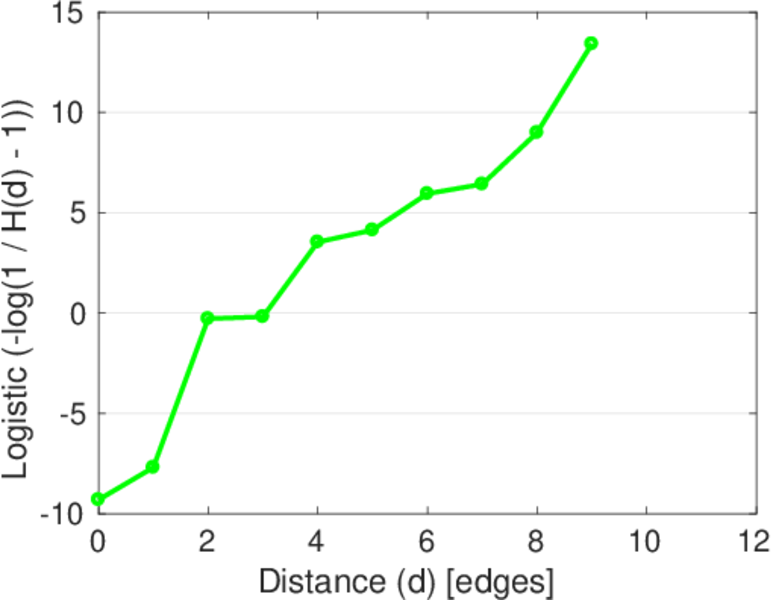
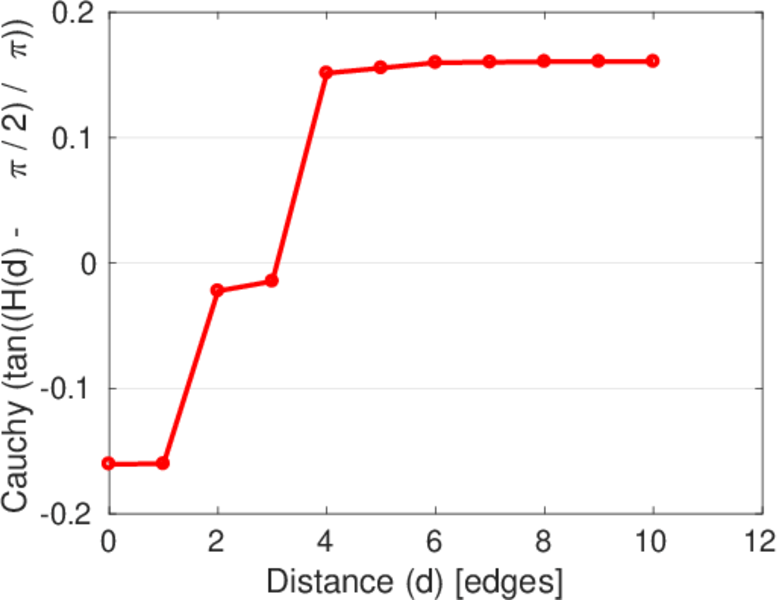
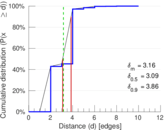
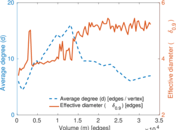
| Diameter | δ = | 13
|
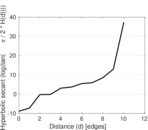
| 50-Percentile effective diameter | δ0.5 = | 3.089 32
|
| 90-Percentile effective diameter | δ0.9 = | 3.861 55
|
| Median distance | δM = | 4
|
| Mean distance | δm = | 3.164 64
|
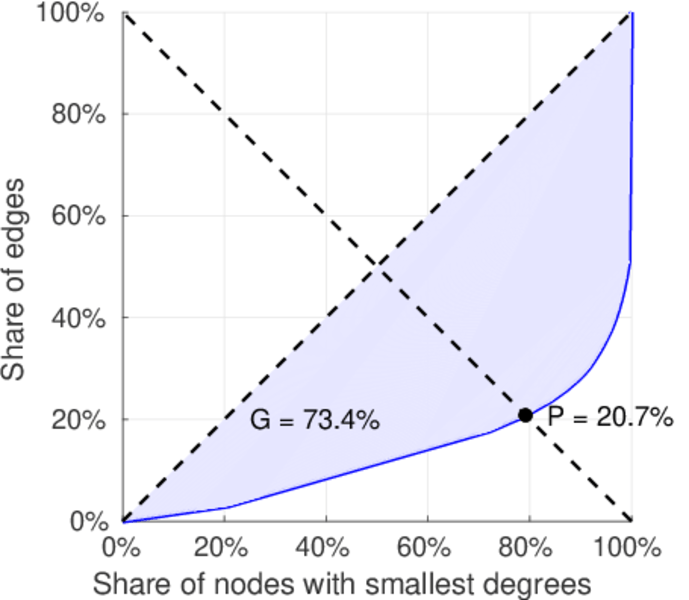
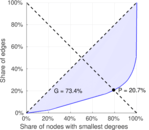
| Gini coefficient | G = | 0.742 478
|
| Balanced inequality ratio | P = | 0.201 278
|
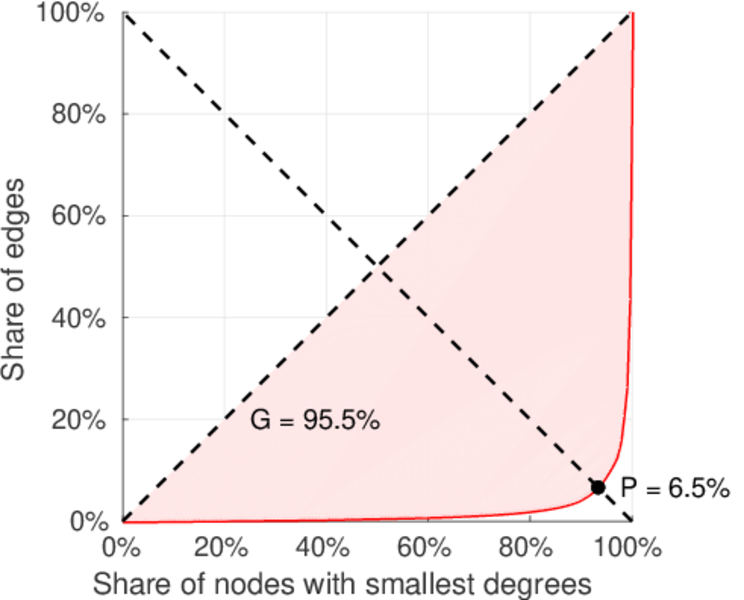
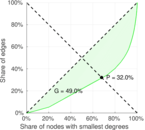
| Left balanced inequality ratio | P1 = | 0.064 840 8
|
| Right balanced inequality ratio | P2 = | 0.319 965
|
| Relative edge distribution entropy | Her = | 0.703 266
|
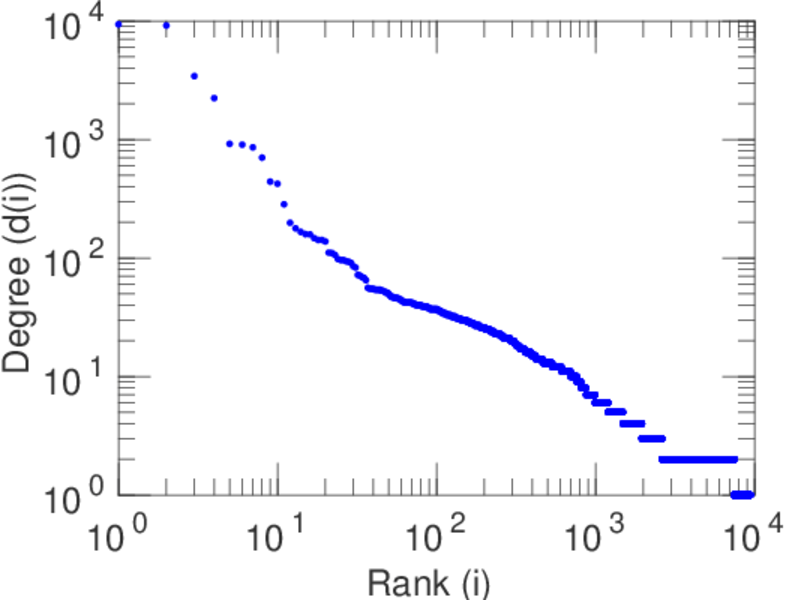
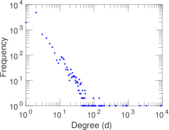
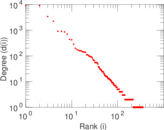
| Power law exponent | γ = | 3.613 30
|
| Tail power law exponent | γt = | 2.281 00
|
| Tail power law exponent with p | γ3 = | 2.281 00
|
| p-value | p = | 0.000 00
|
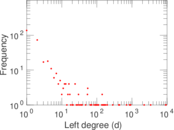
| Left tail power law exponent with p | γ3,1 = | 1.491 00
|
| Left p-value | p1 = | 0.110 000
|
| Right tail power law exponent with p | γ3,2 = | 2.331 00
|
| Right p-value | p2 = | 0.000 00
|
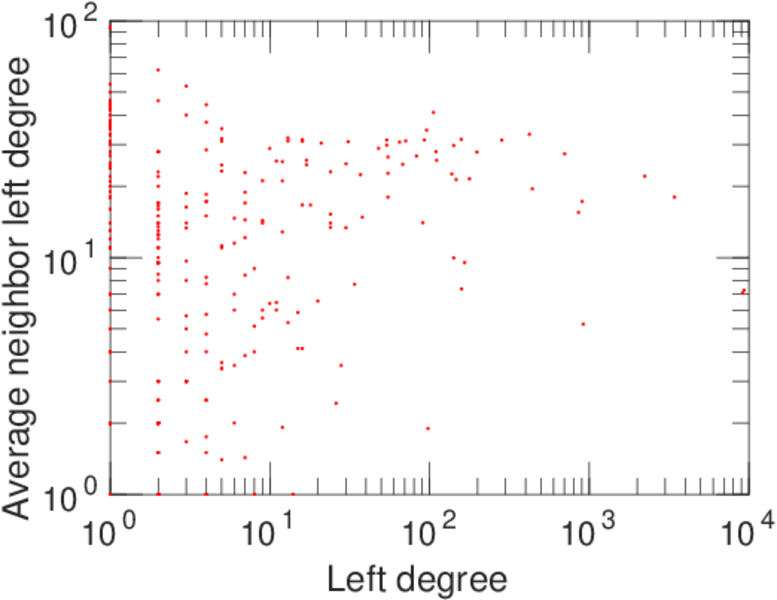
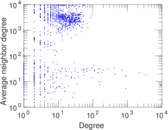
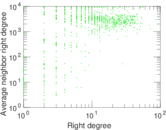
| Degree assortativity | ρ = | −0.530 394
|
| Degree assortativity p-value | pρ = | 0.000 00
|
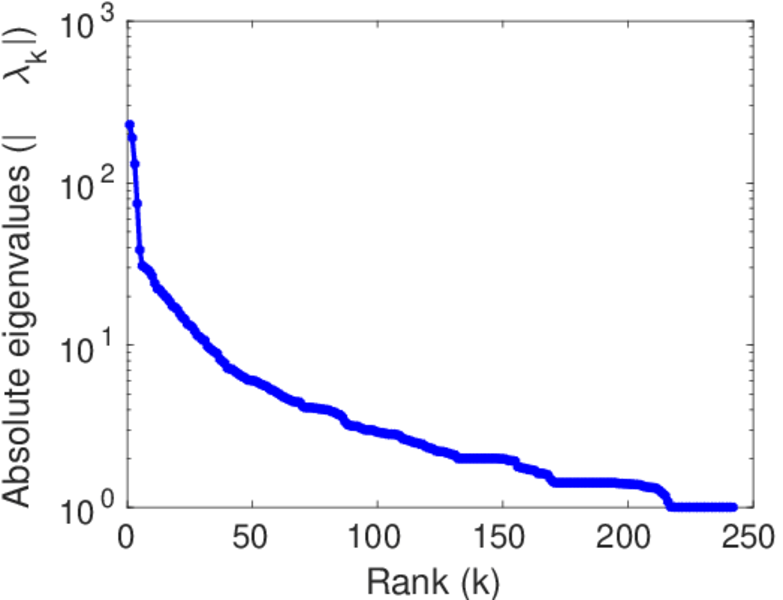
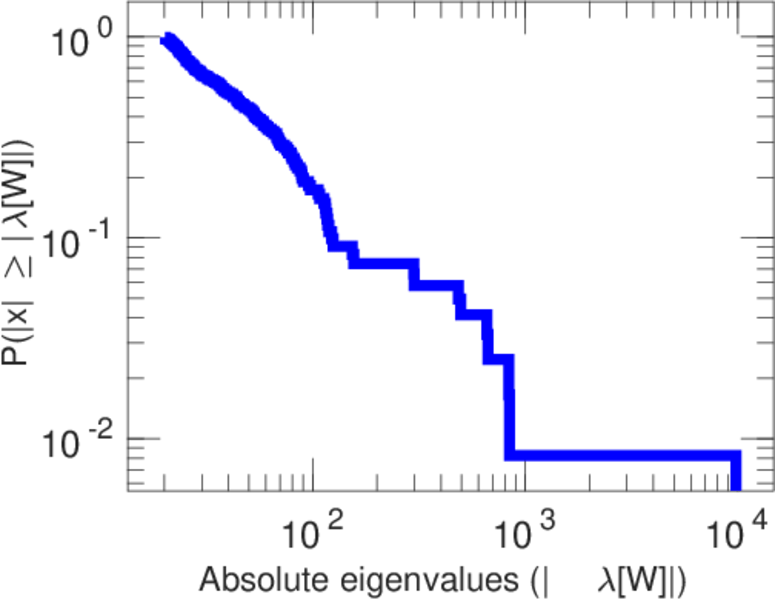
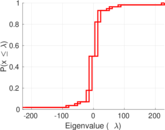
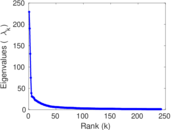
| Spectral norm | α = | 229.116
|
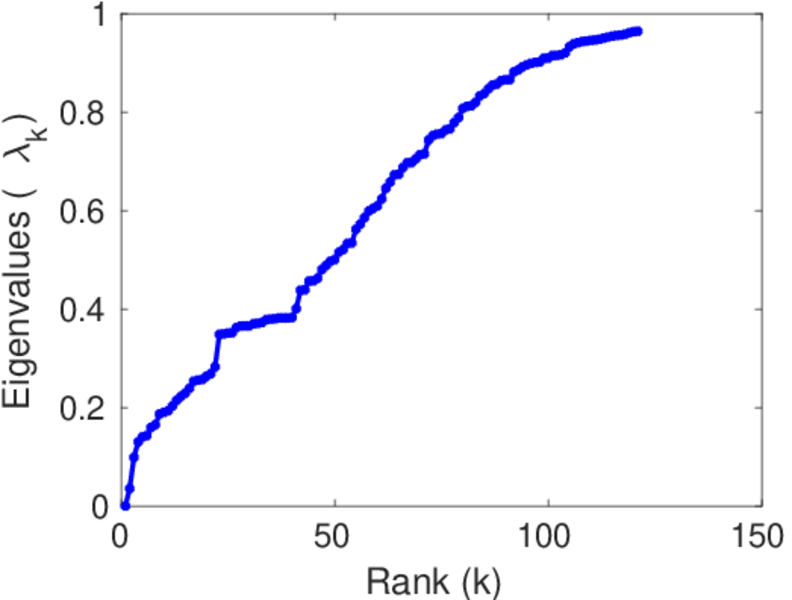
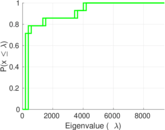
| Algebraic connectivity | a = | 0.035 750 7
|
| Spectral separation | |λ1[A] / λ2[A]| = | 1.204 95
|
| Controllability | C = | 8,748
|
| Relative controllability | Cr = | 0.930 242
|
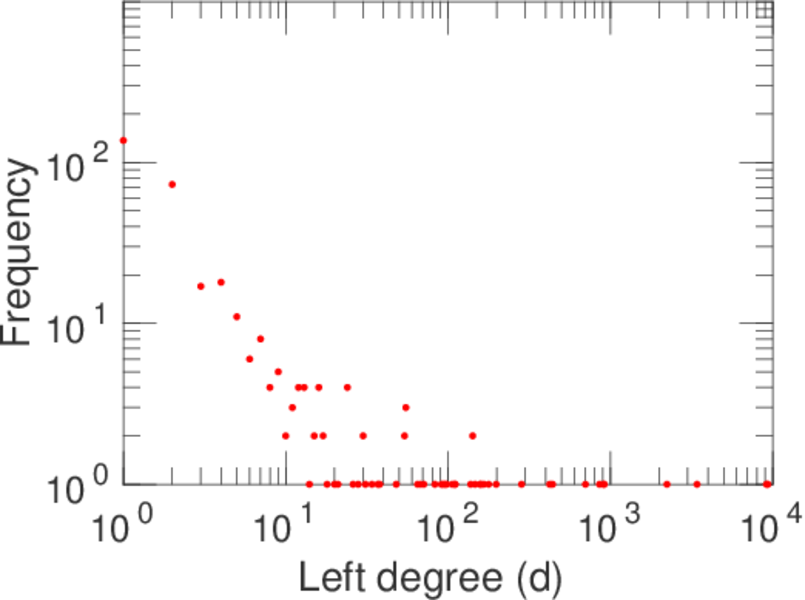
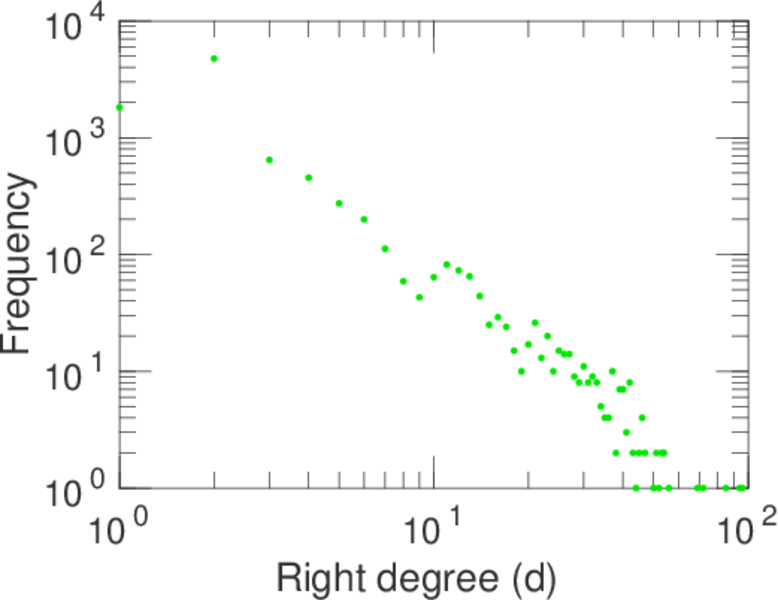
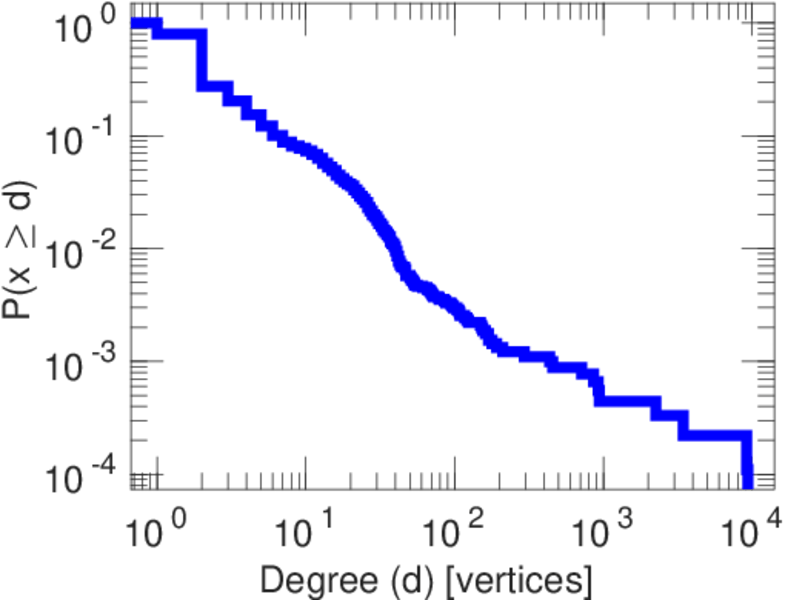
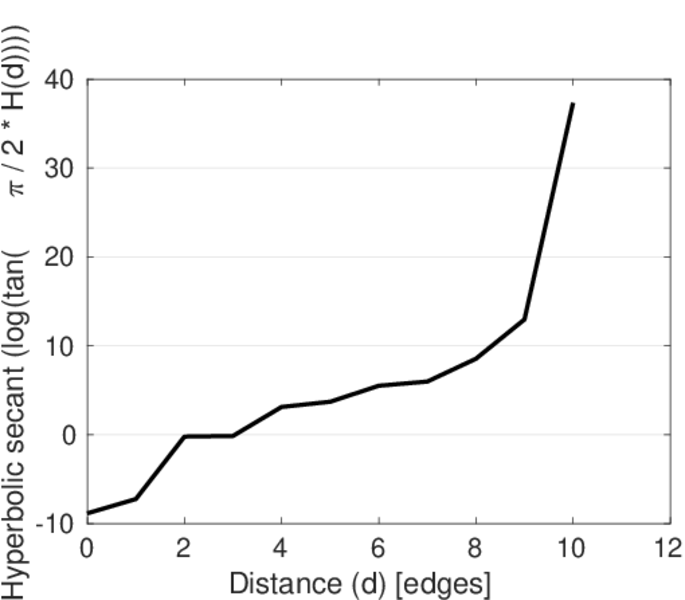
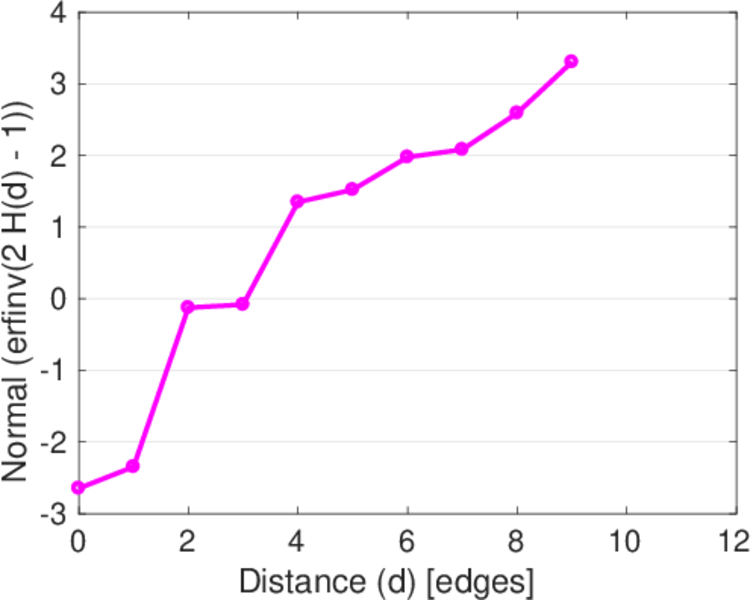
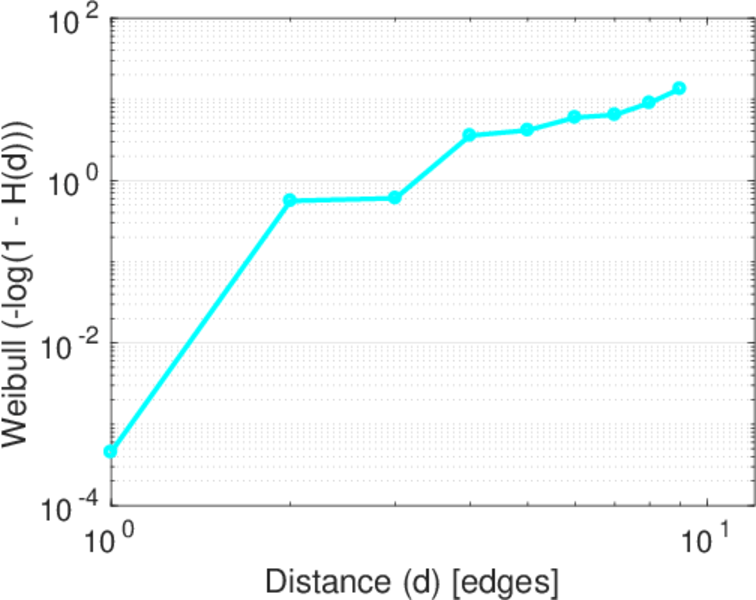
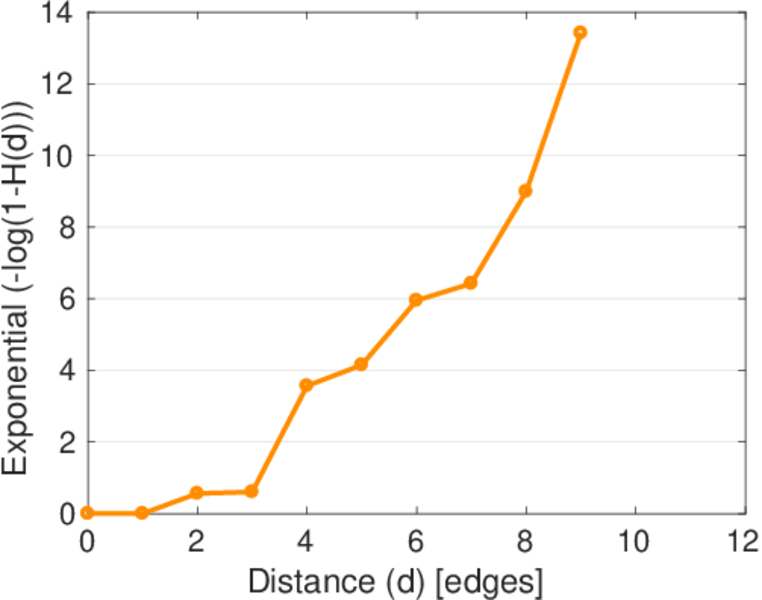
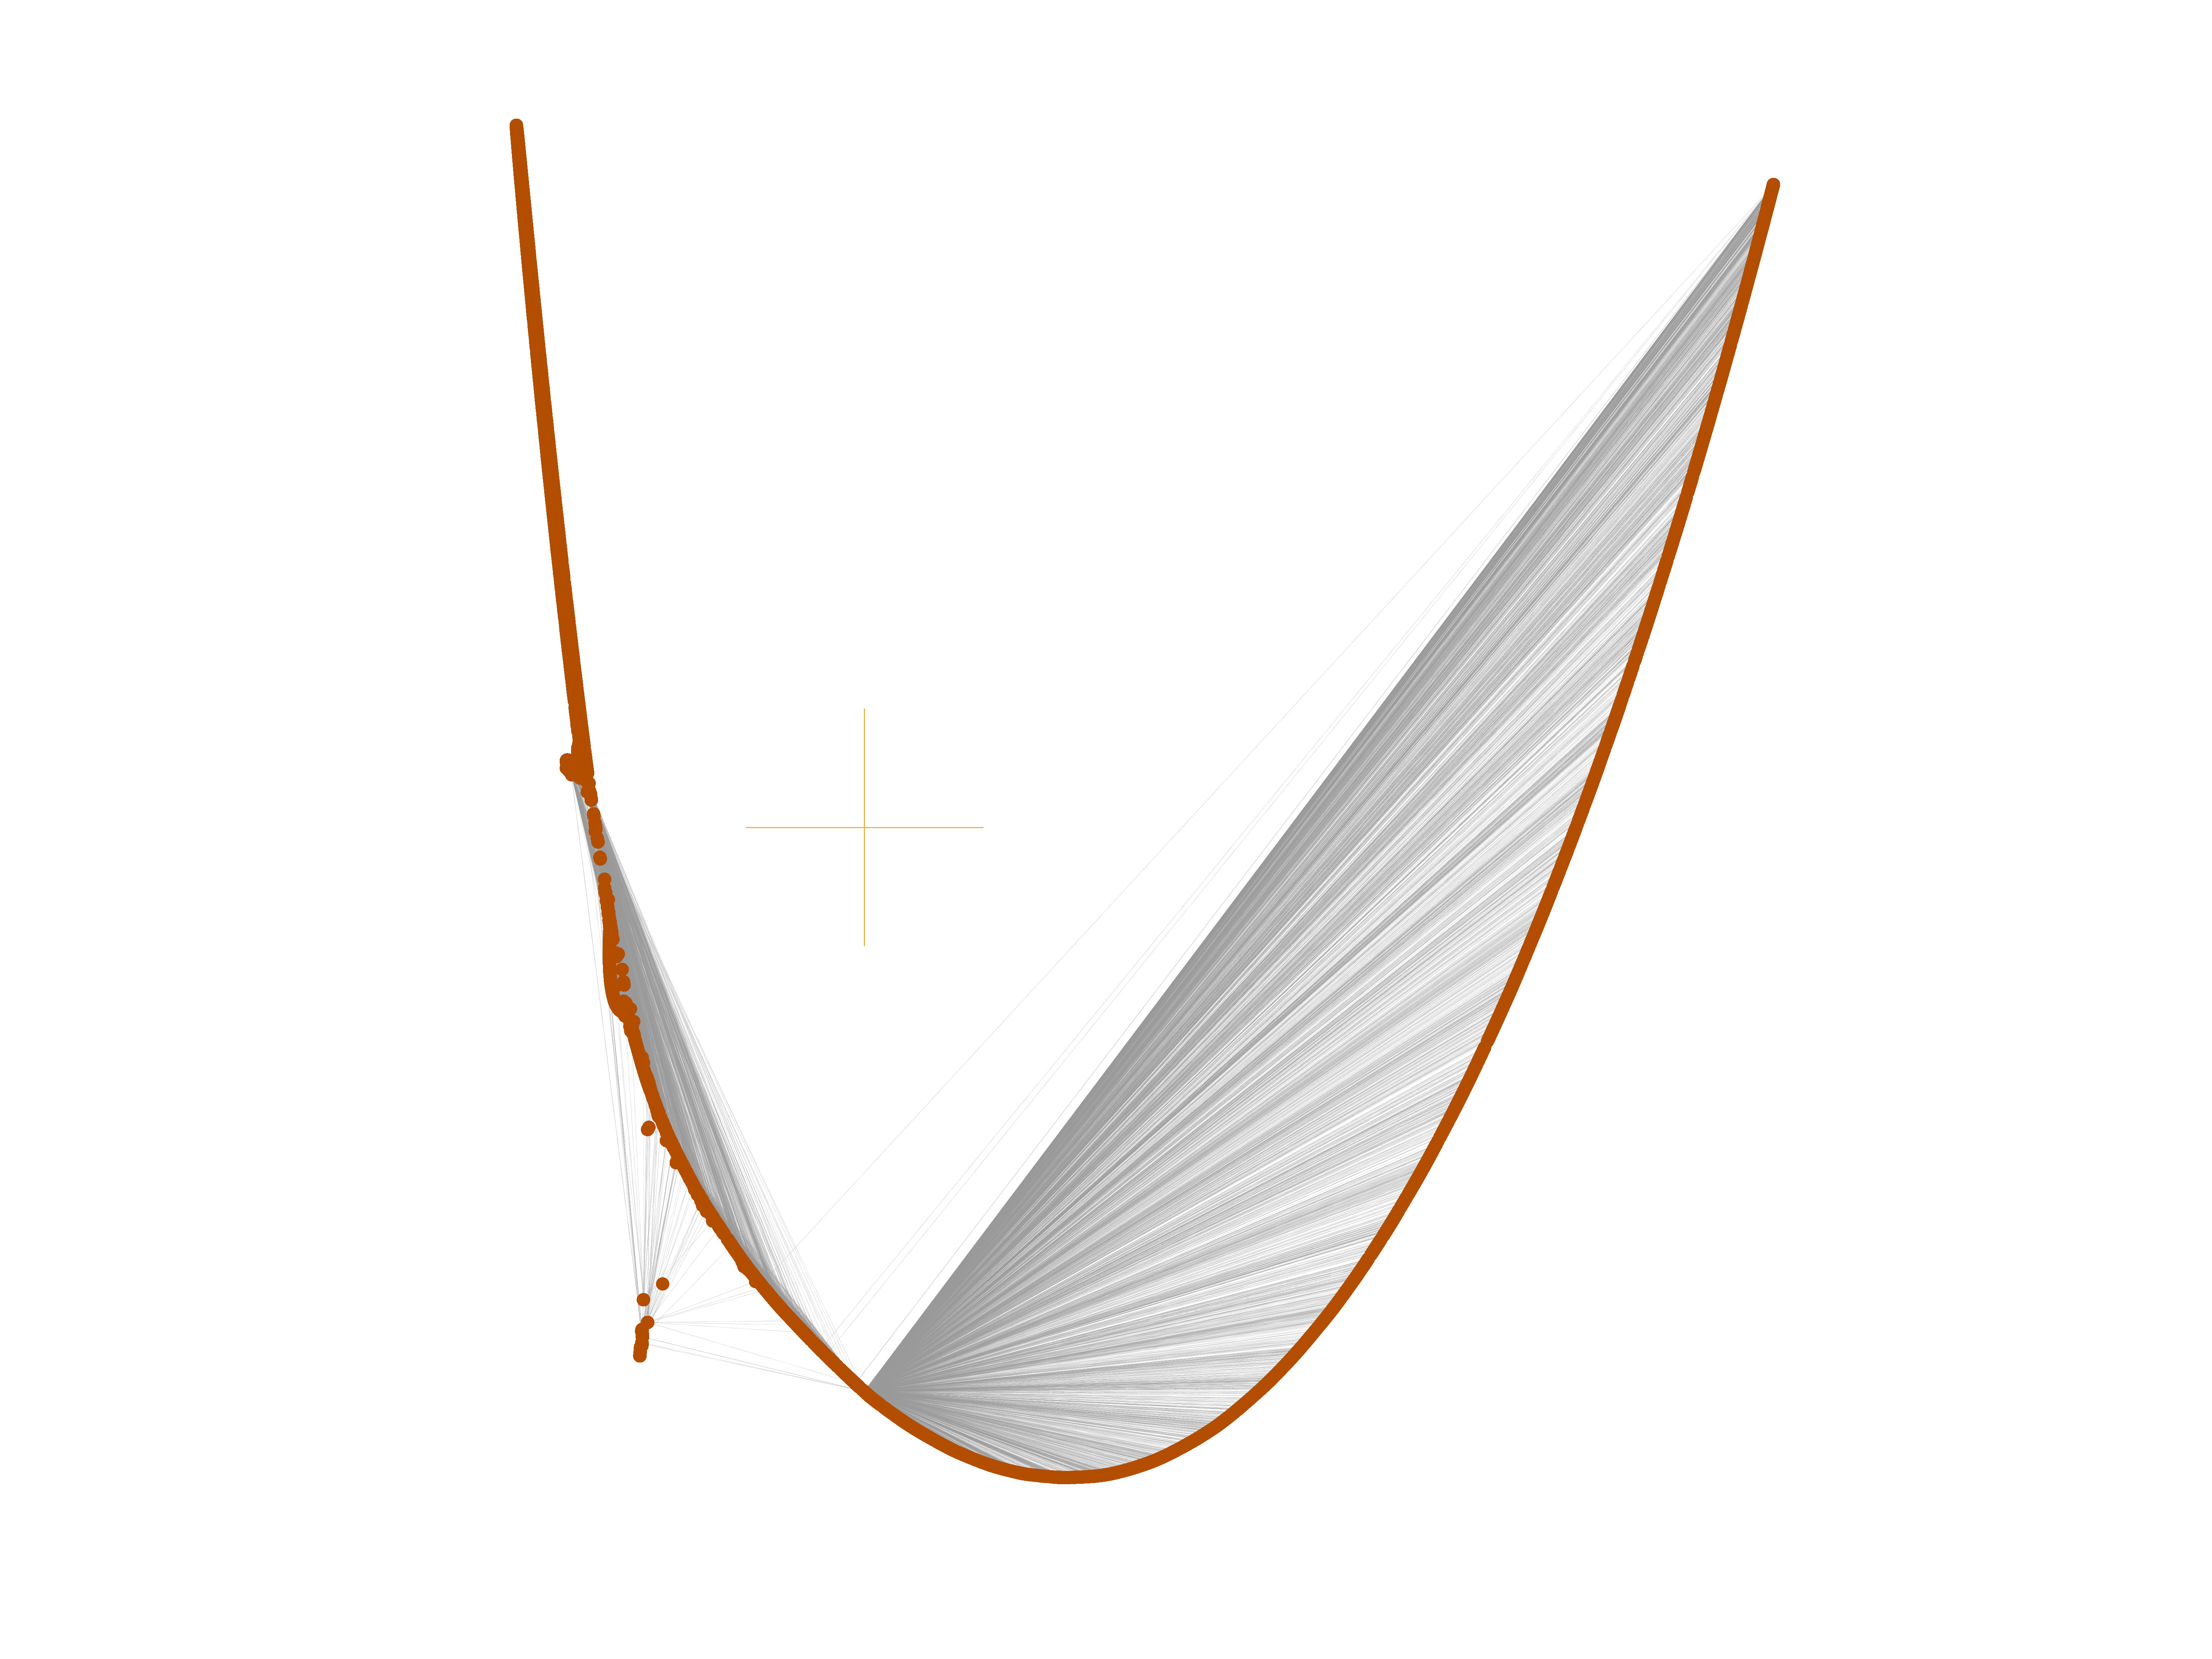
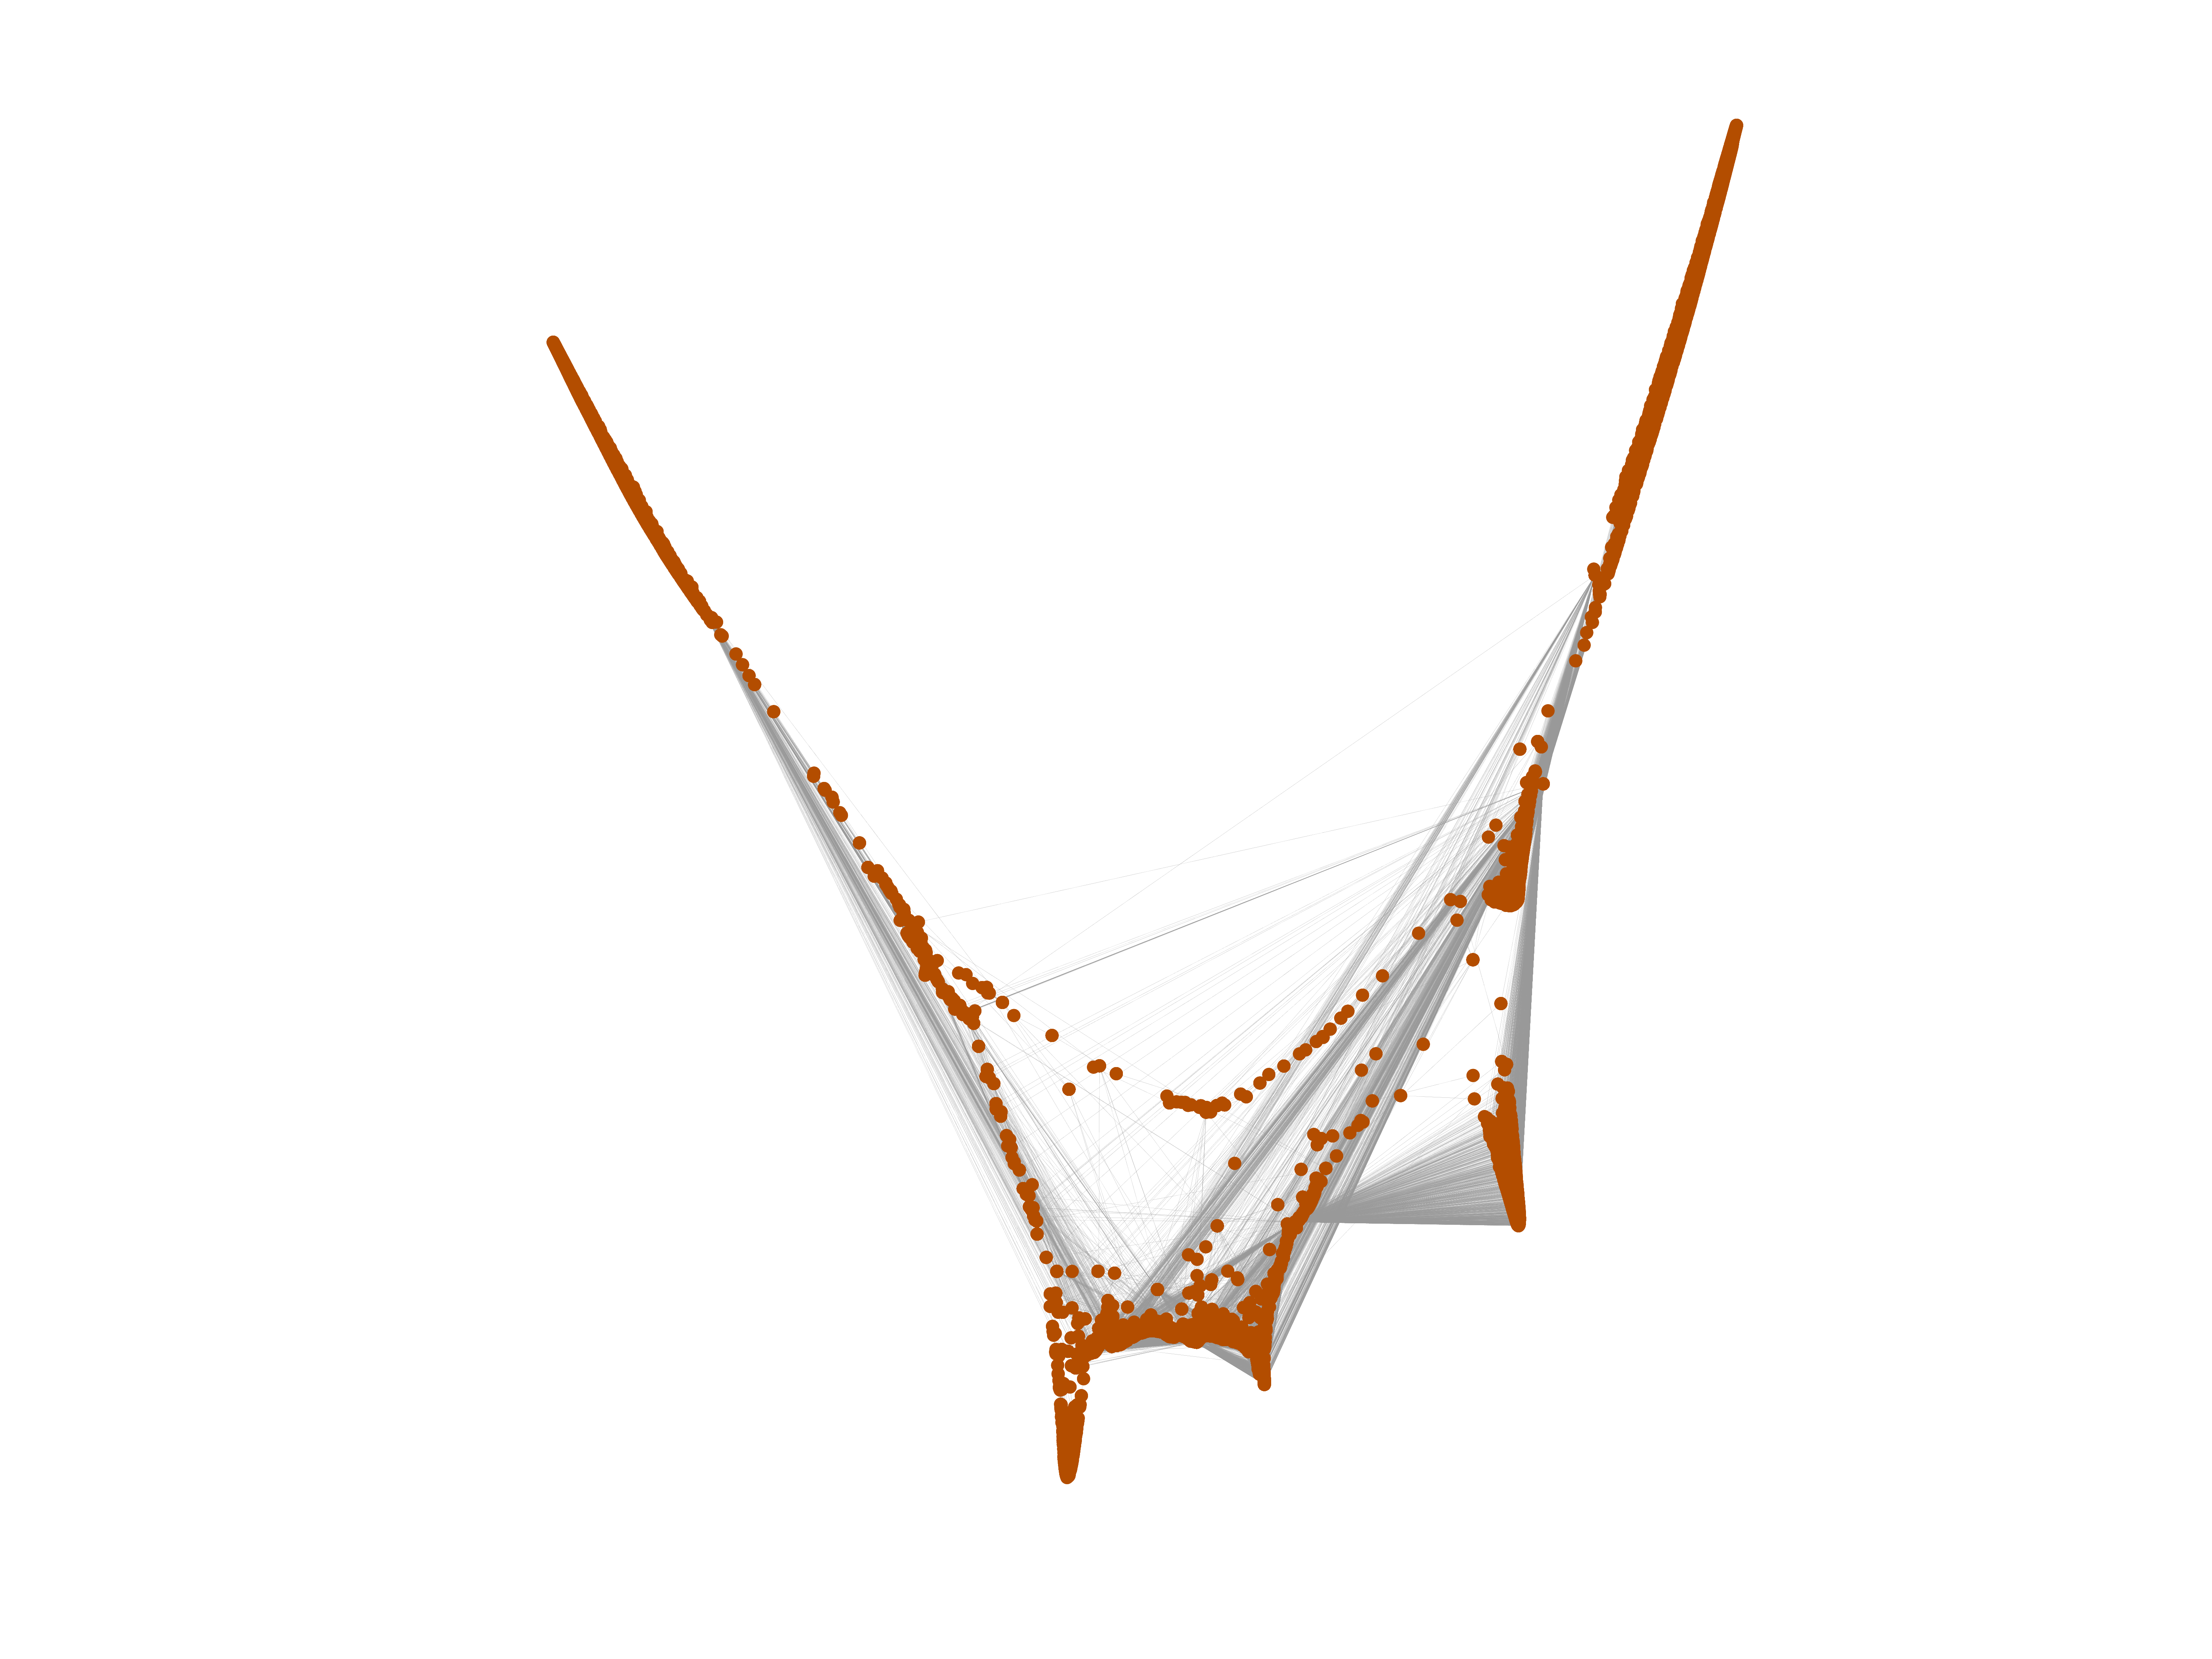
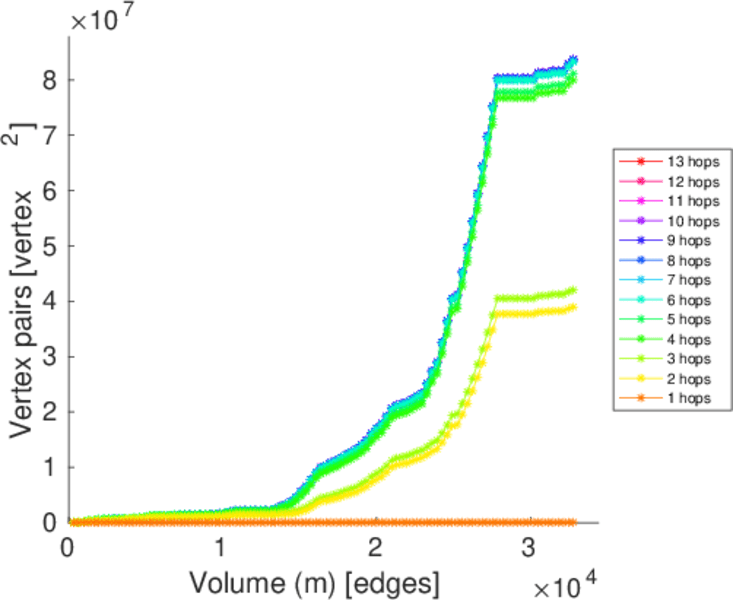
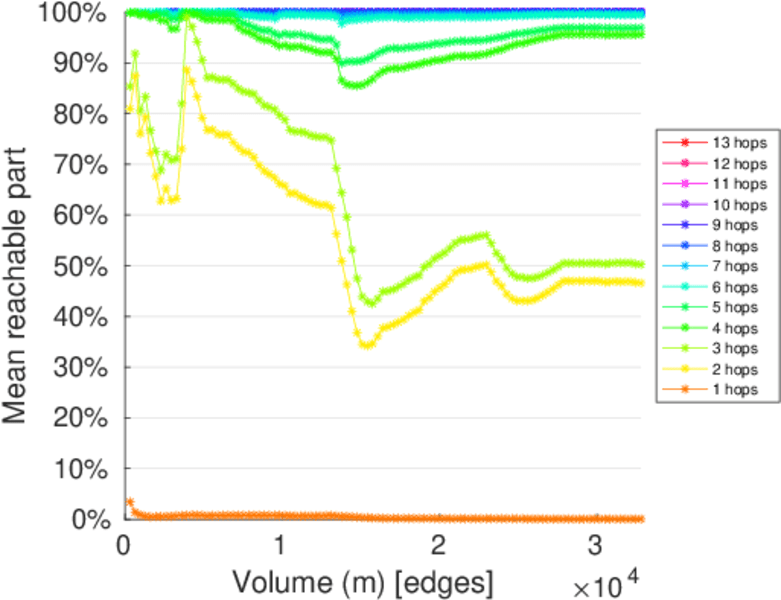
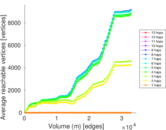
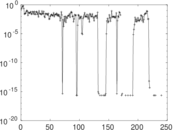
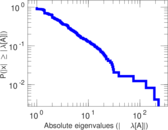
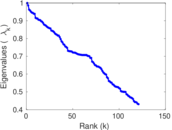
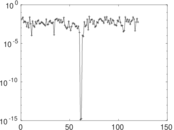
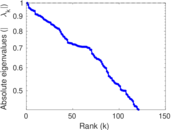
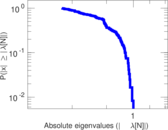
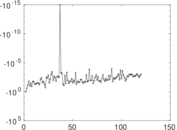
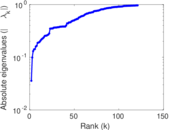
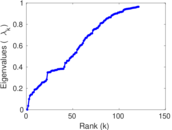
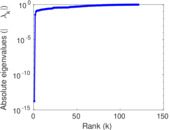
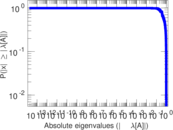
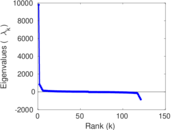
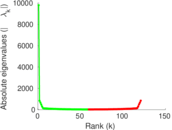
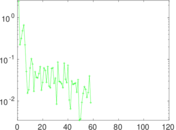
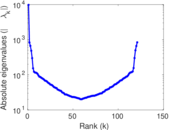
Plots


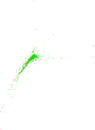


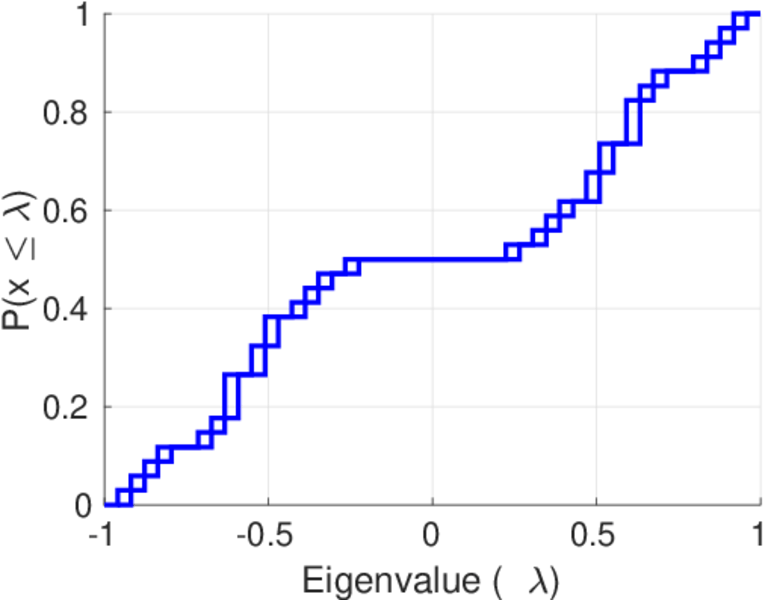
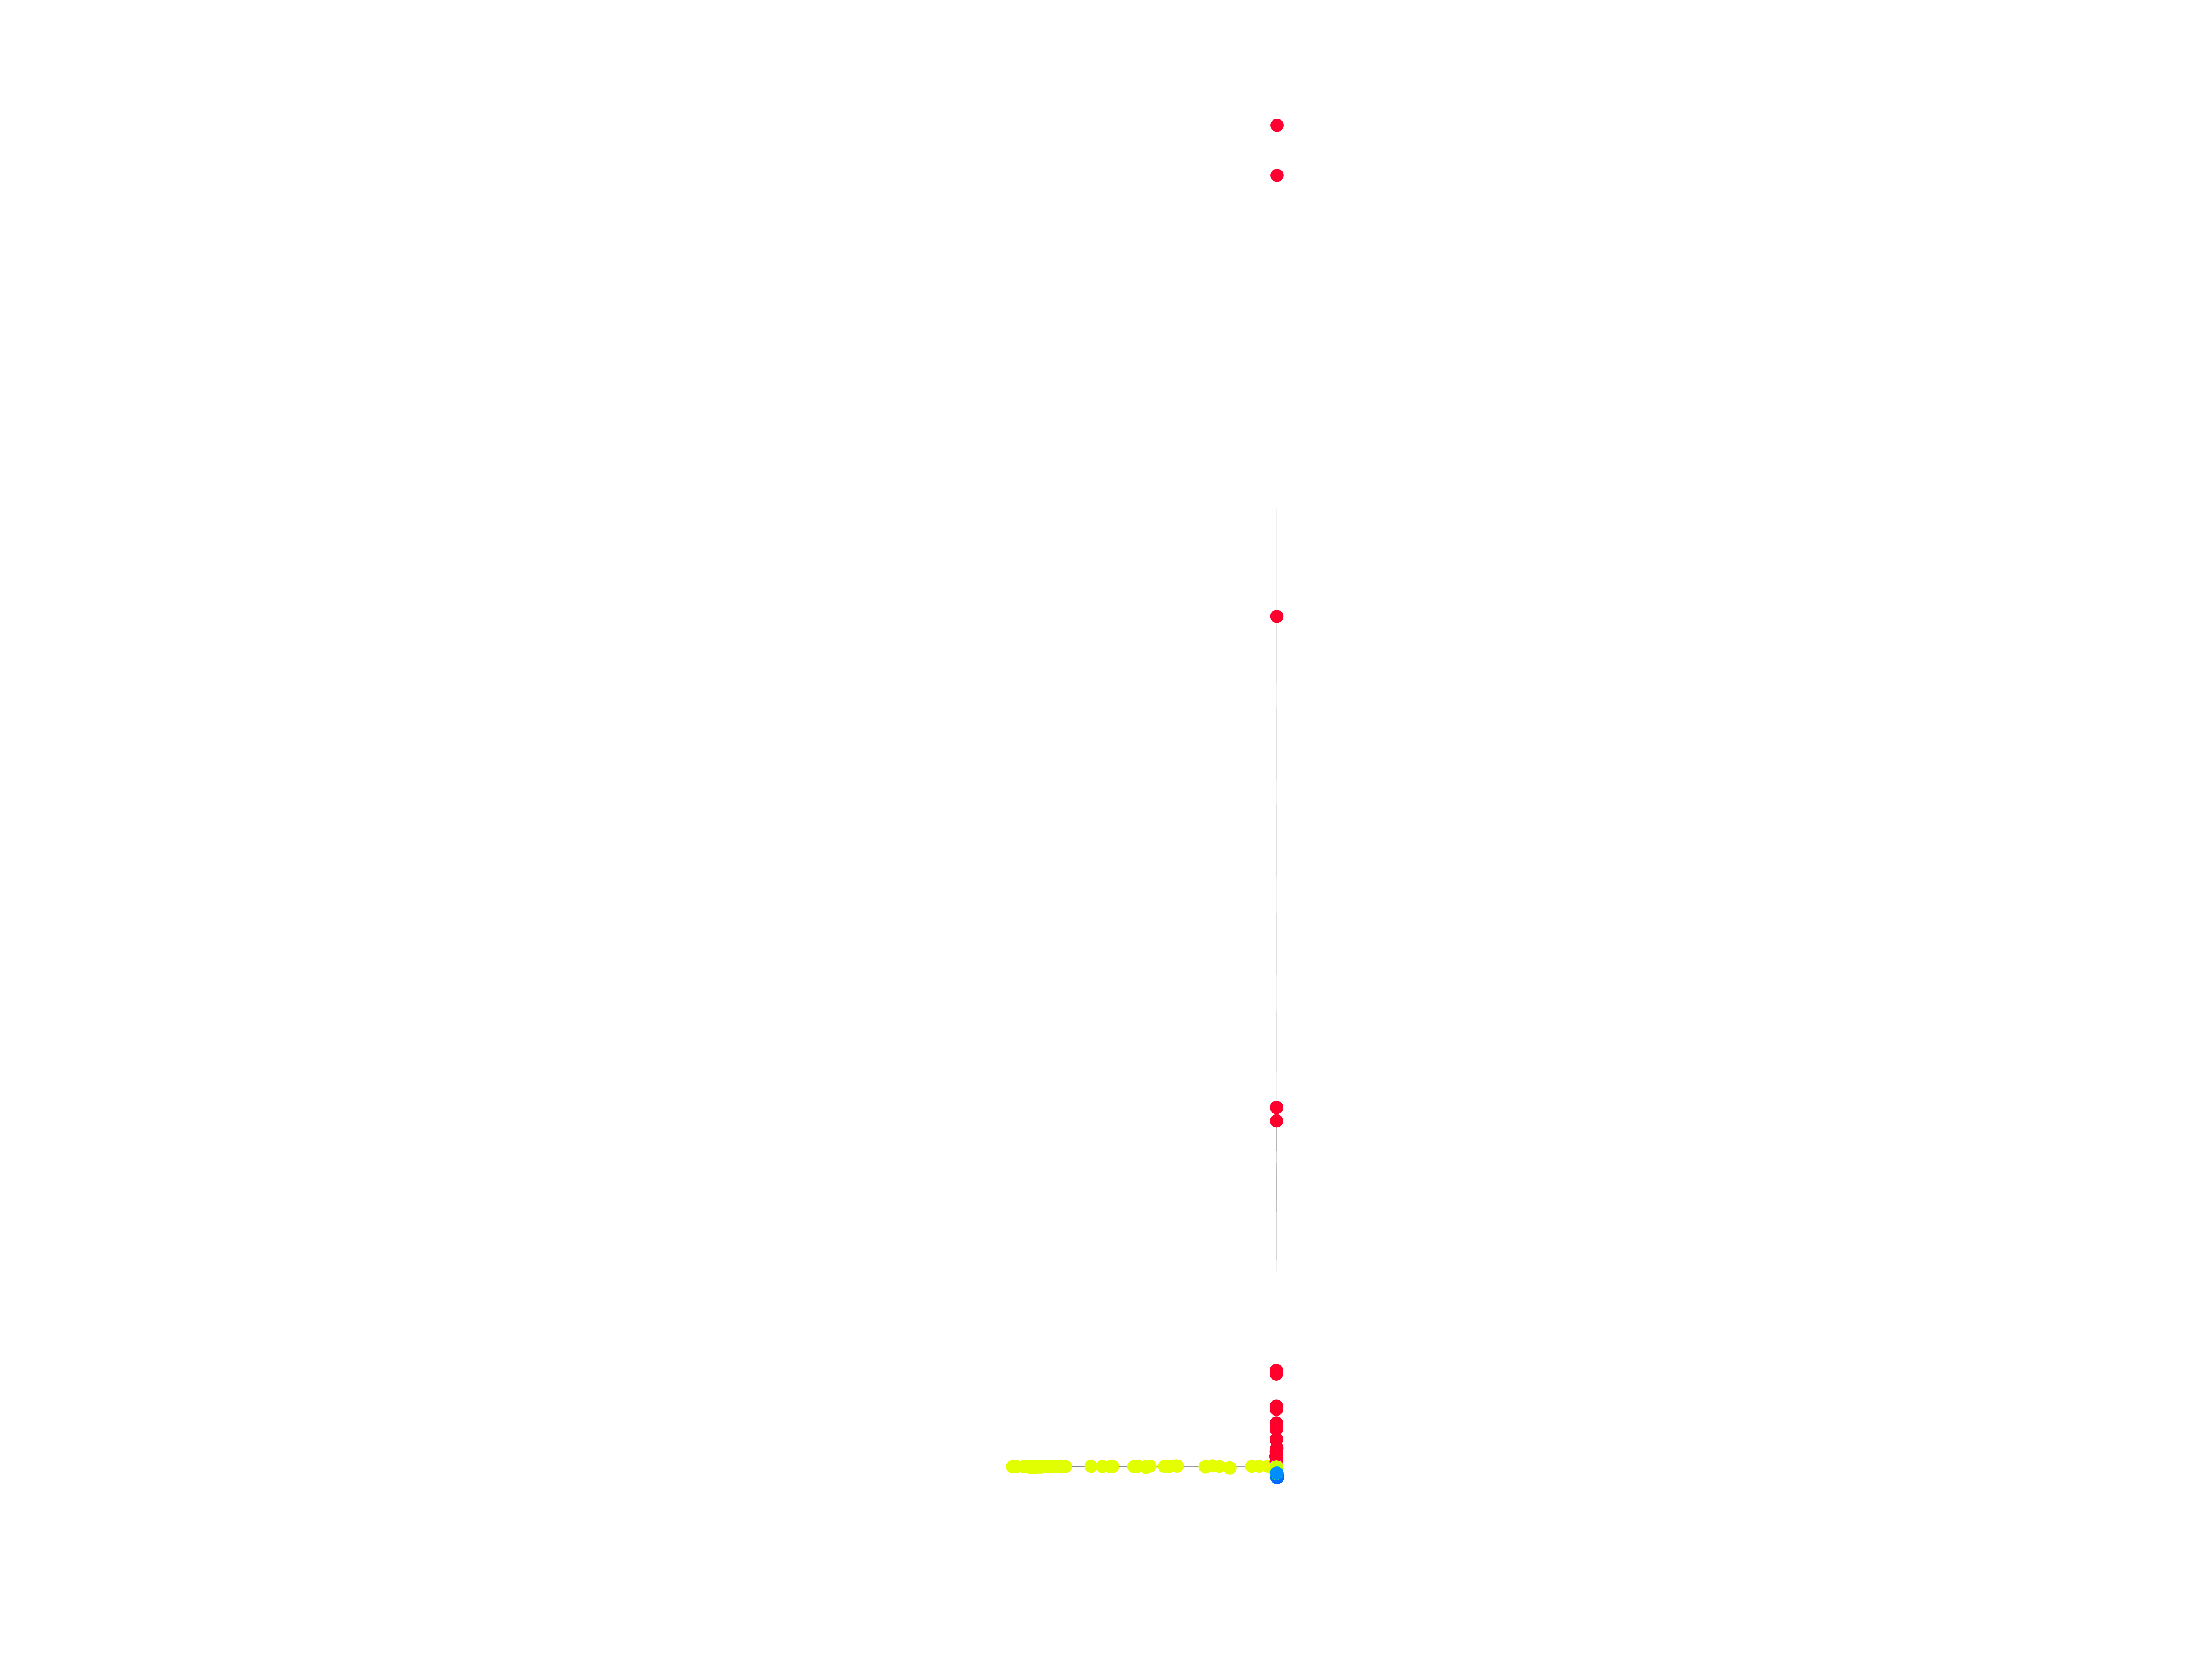
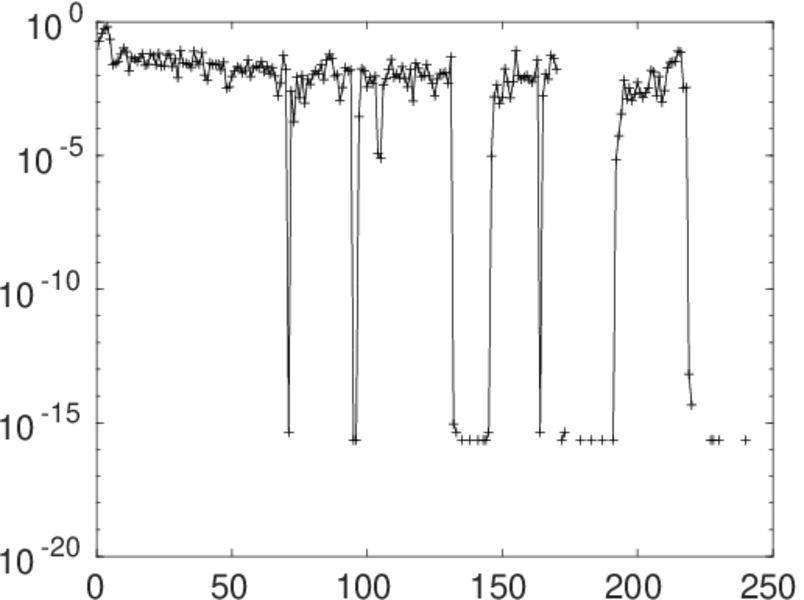
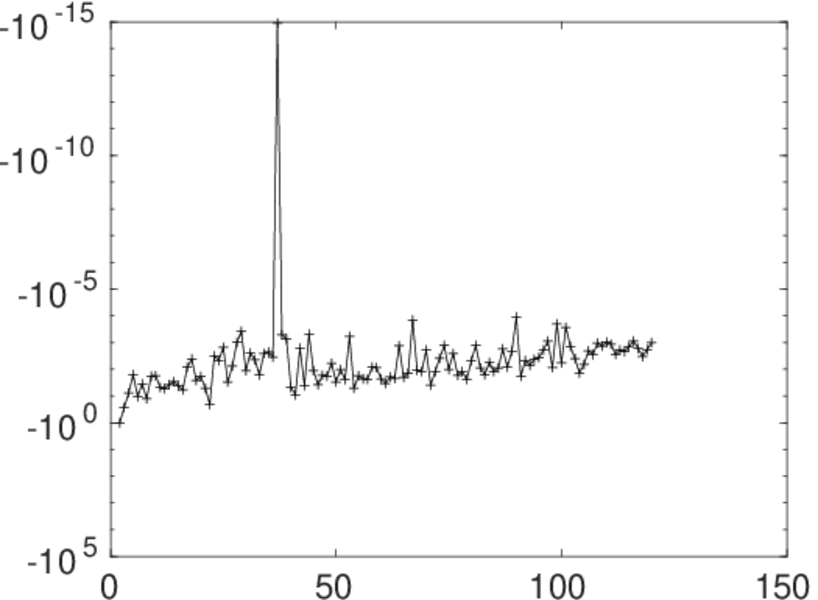
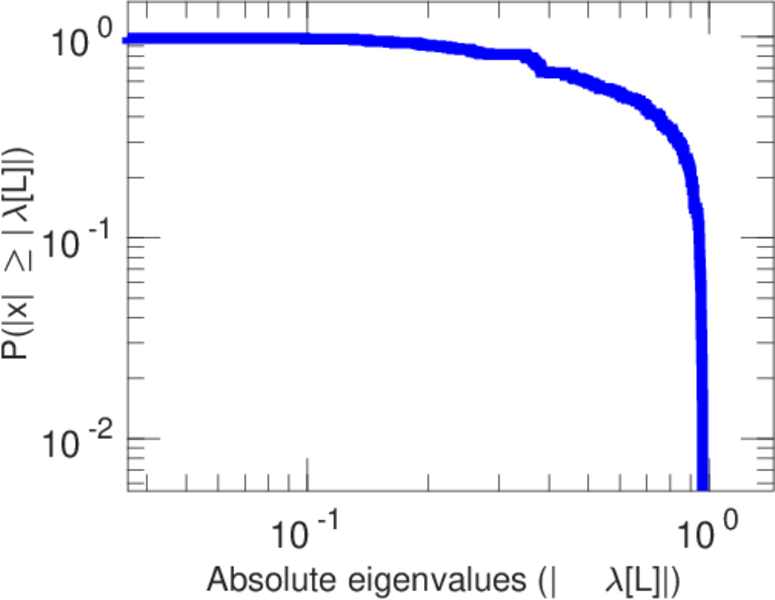
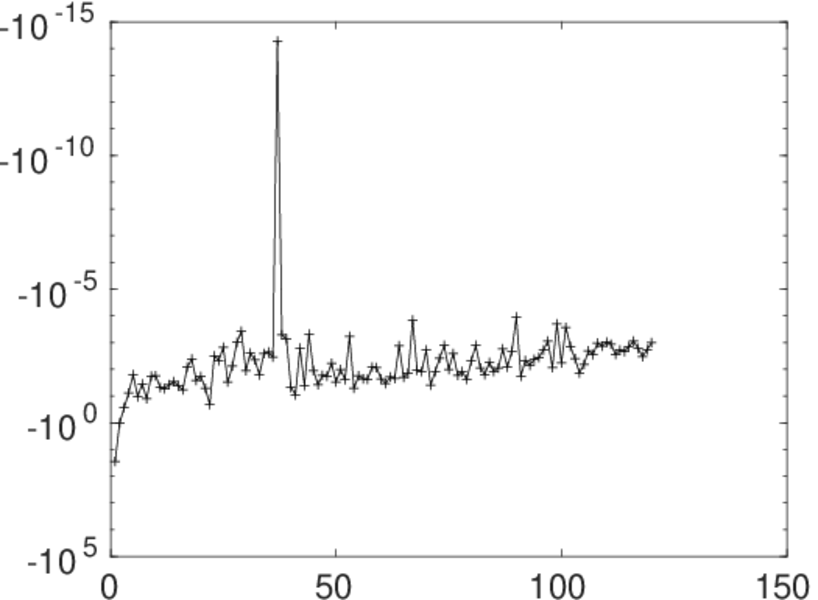
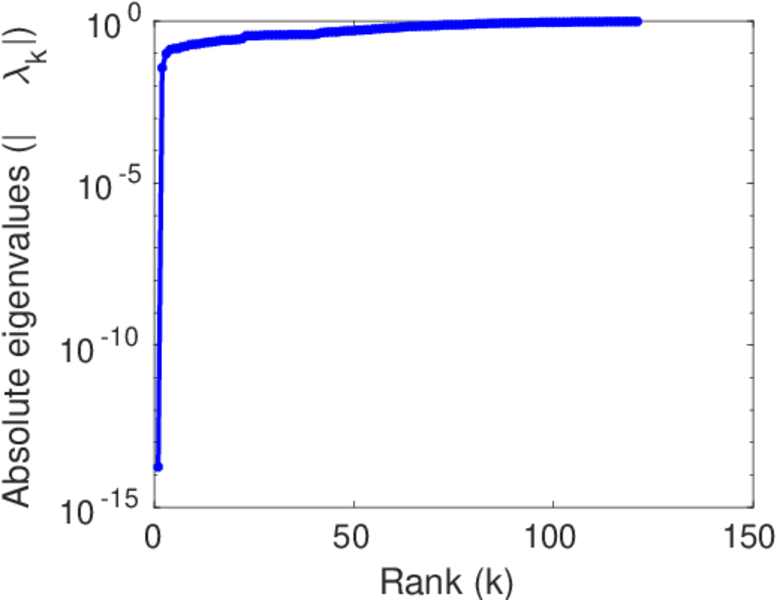
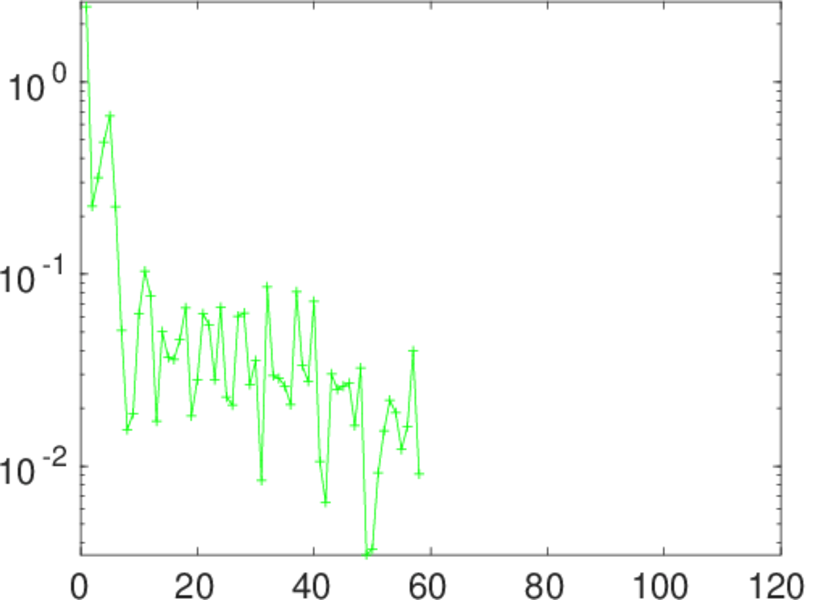
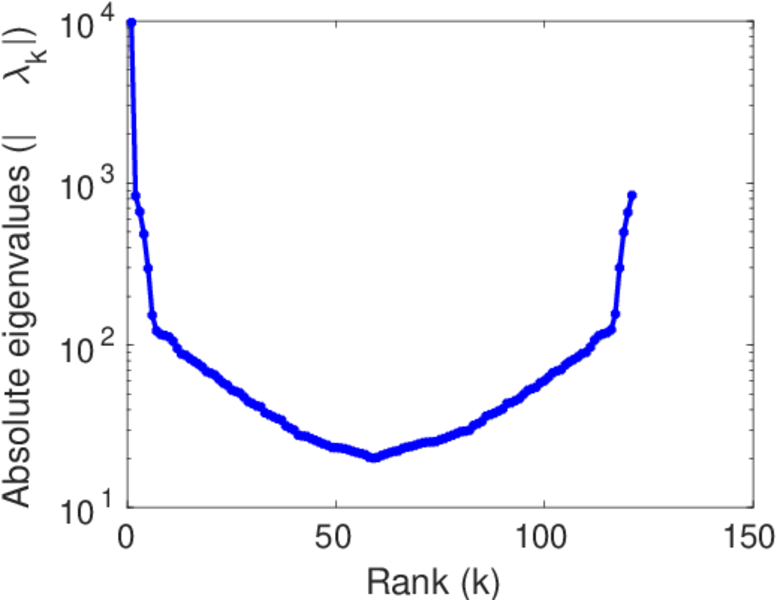
Matrix decompositions plots


Downloads
References
|
[1]
|
Jérôme Kunegis.
KONECT – The Koblenz Network Collection.
In Proc. Int. Conf. on World Wide Web Companion, pages
1343–1350, 2013.
[ http ]
|
|
[2]
|
Wikimedia Foundation.
Wikimedia downloads.
http://dumps.wikimedia.org/, January 2010.
|
 KONECT ‣ Networks ‣
Buy Me a Coffee
KONECT ‣ Networks ‣
Buy Me a Coffee