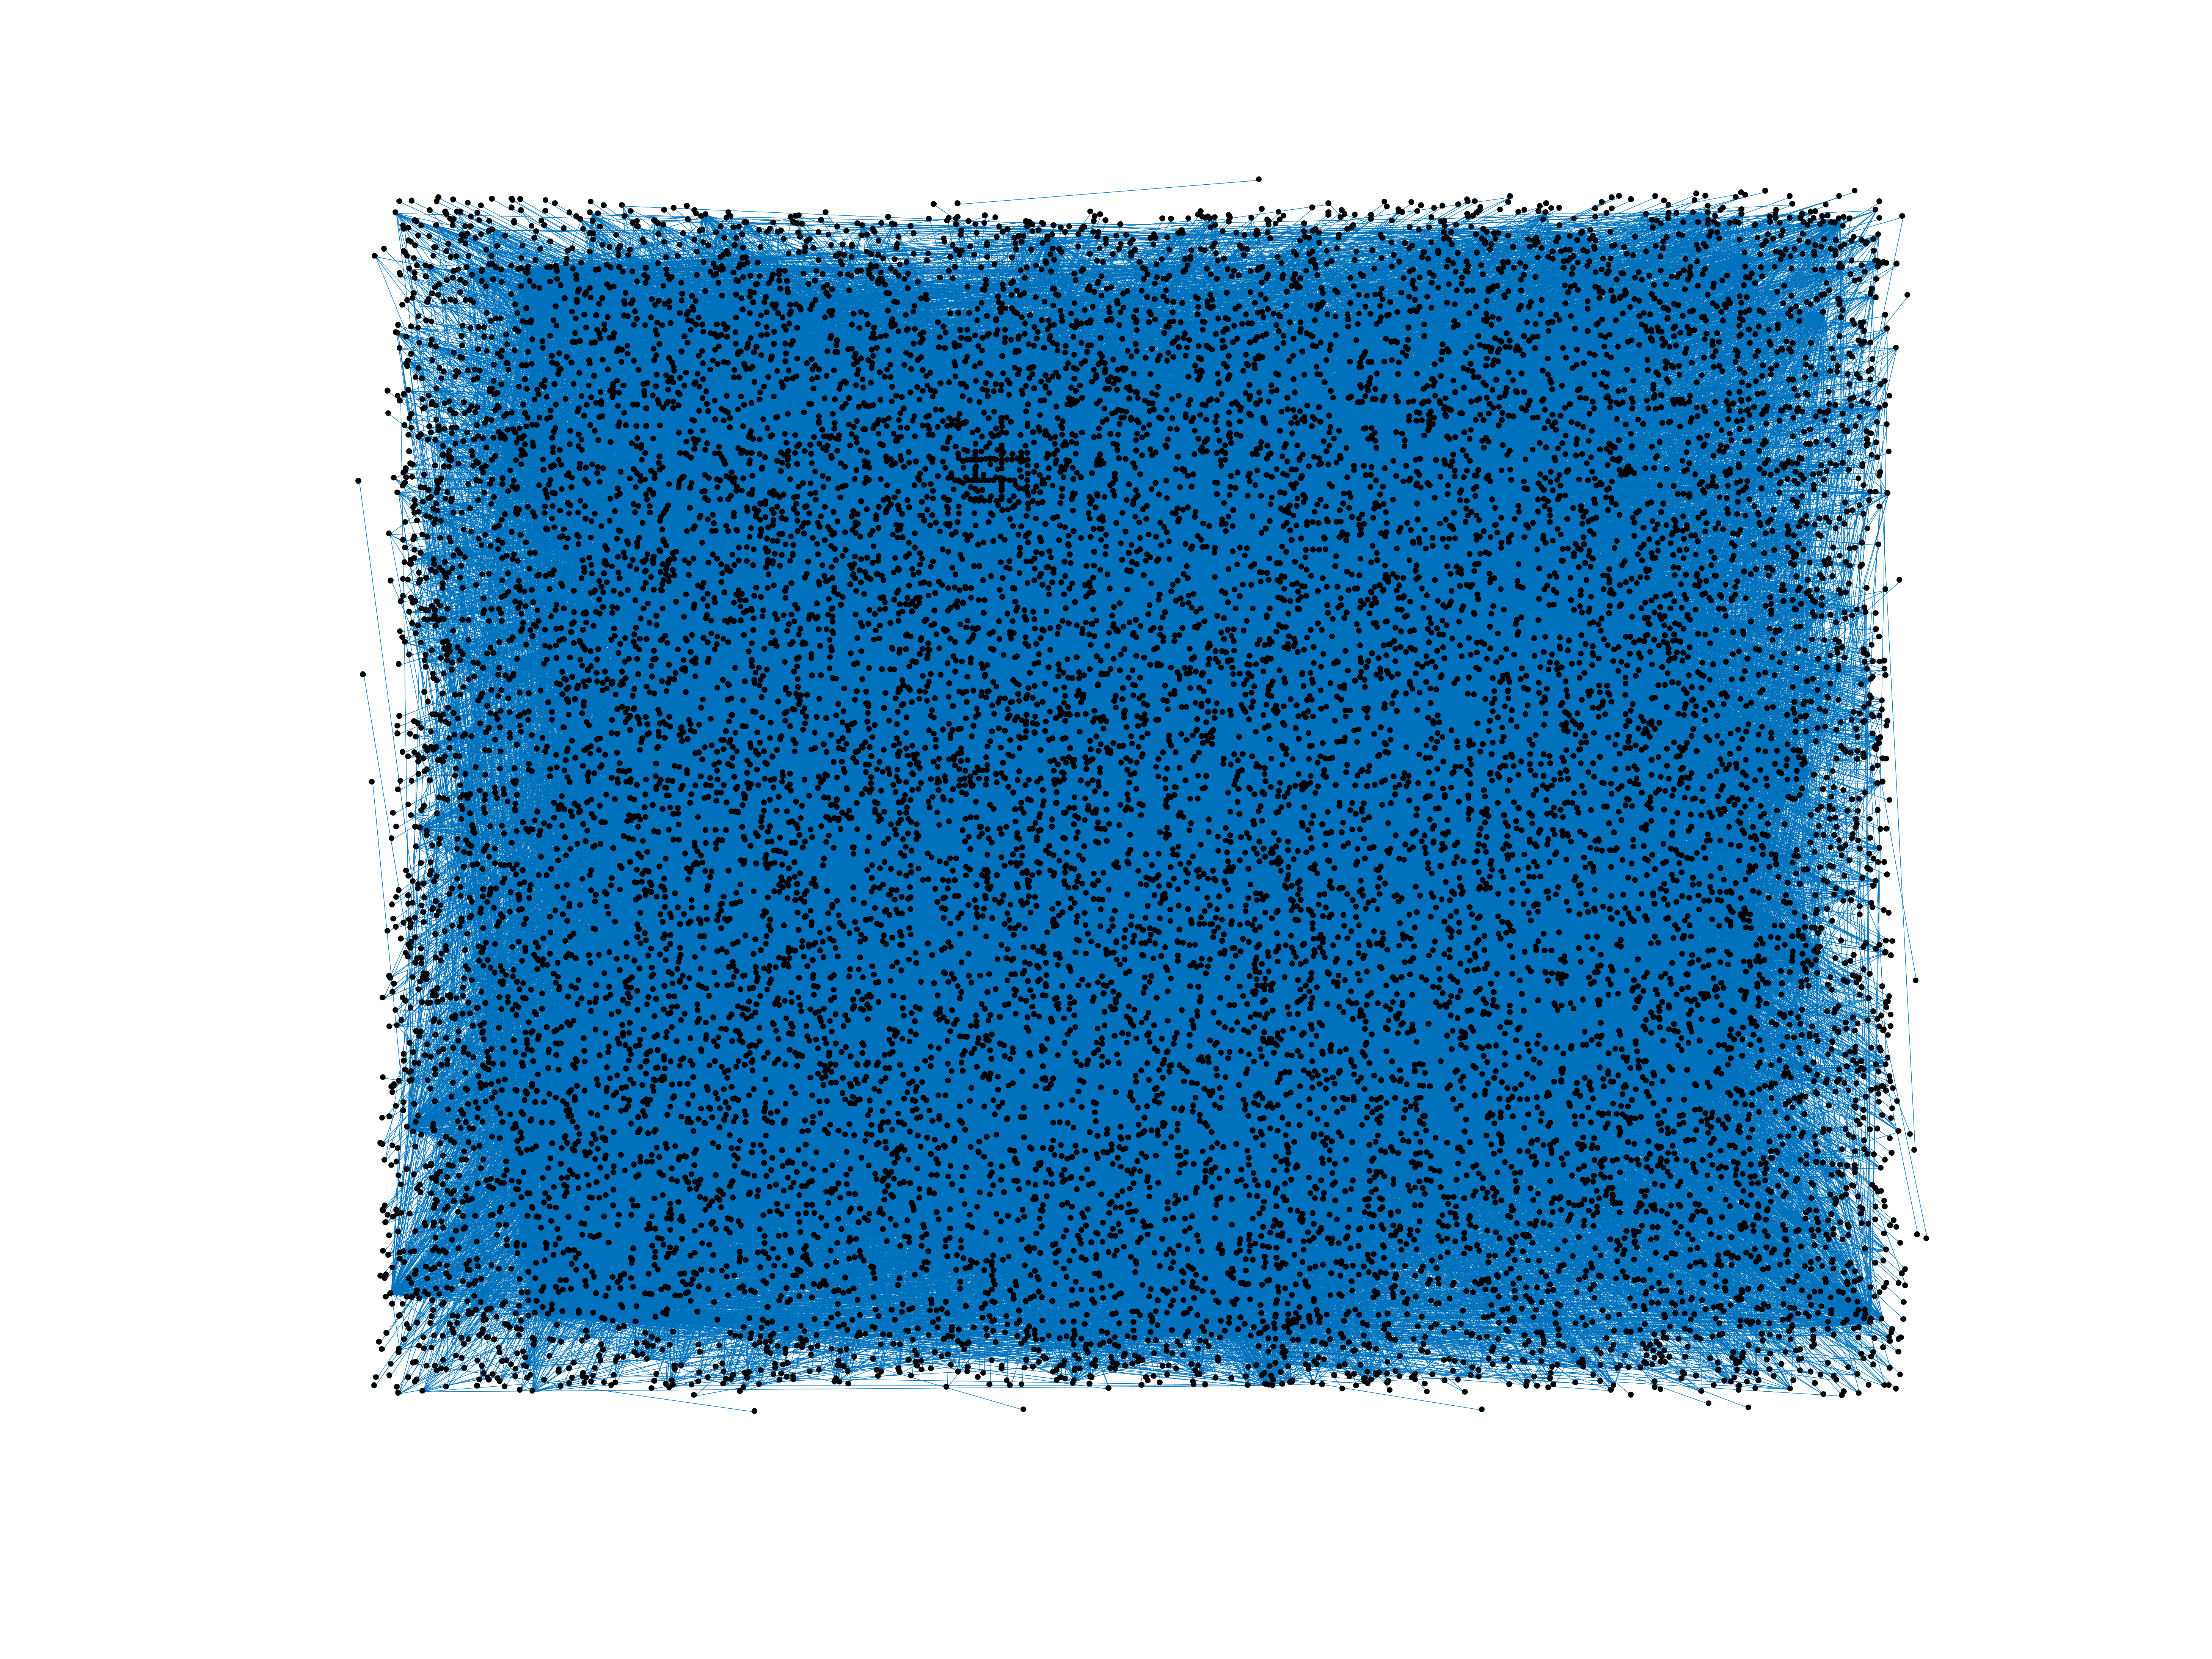
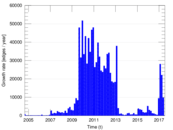
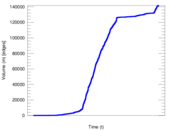
Wikipedia edits (nv)
This is the bipartite edit network of the Navajo Wikipedia. It contains users
and pages from the Navajo Wikipedia, connected by edit events. Each edge
represents an edit. The dataset includes the timestamp of each edit.
Metadata
Statistics
| Size | n = | 14,833
|
| Left size | n1 = | 939
|
| Right size | n2 = | 13,894
|
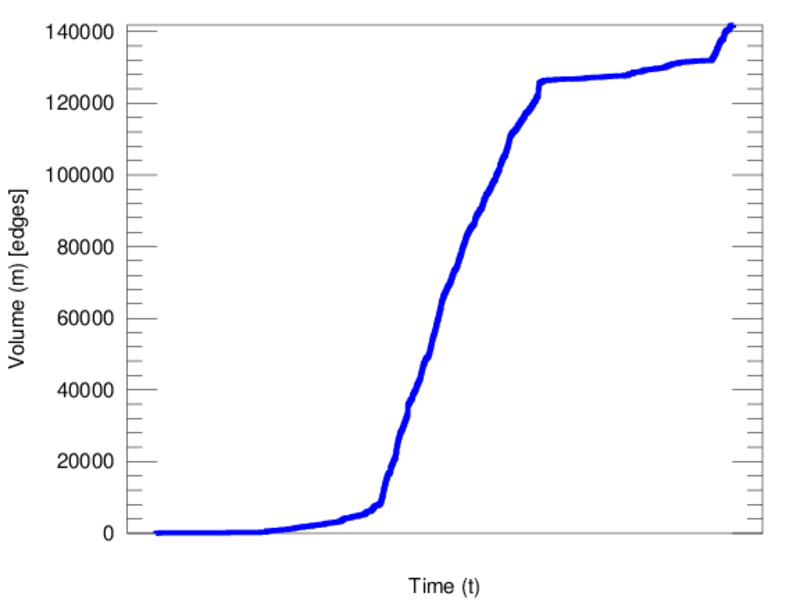
| Volume | m = | 141,787
|
| Unique edge count | m̿ = | 46,144
|
| Wedge count | s = | 81,020,354
|
| Claw count | z = | 235,943,211,058
|
| Cross count | x = | 614,310,799,150,053
|
| Square count | q = | 39,559,126
|
| 4-Tour count | T4 = | 640,724,740
|
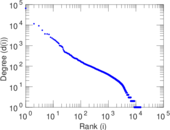
| Maximum degree | dmax = | 65,573
|
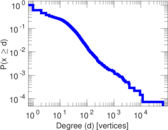
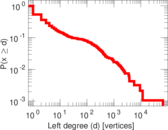
| Maximum left degree | d1max = | 65,573
|
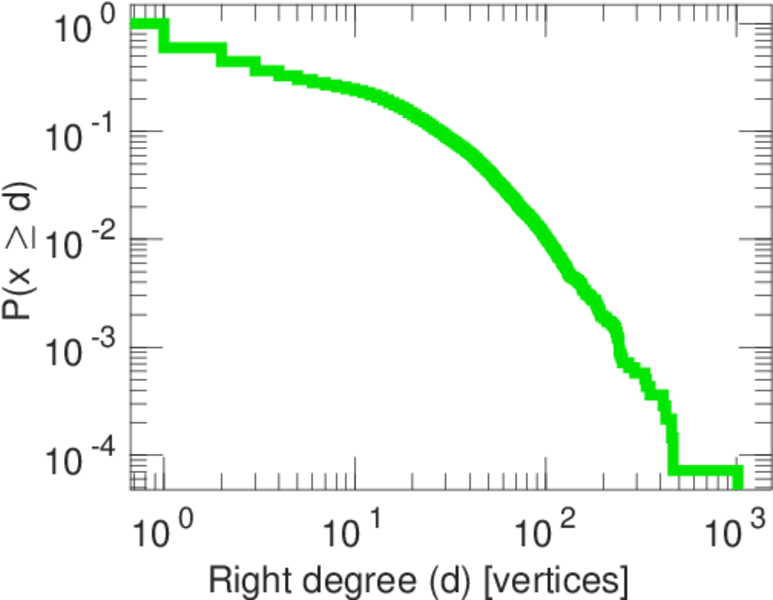
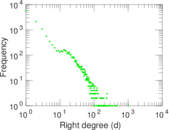
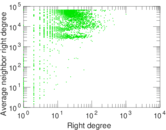
| Maximum right degree | d2max = | 1,016
|
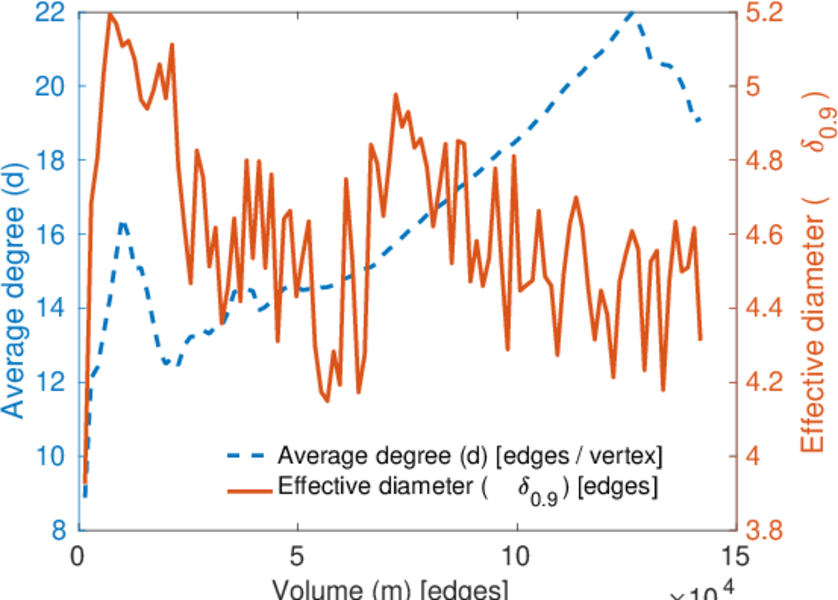
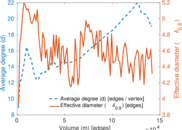
| Average degree | d = | 19.117 8
|
| Average left degree | d1 = | 150.998
|
| Average right degree | d2 = | 10.204 9
|
| Fill | p = | 0.003 536 90
|
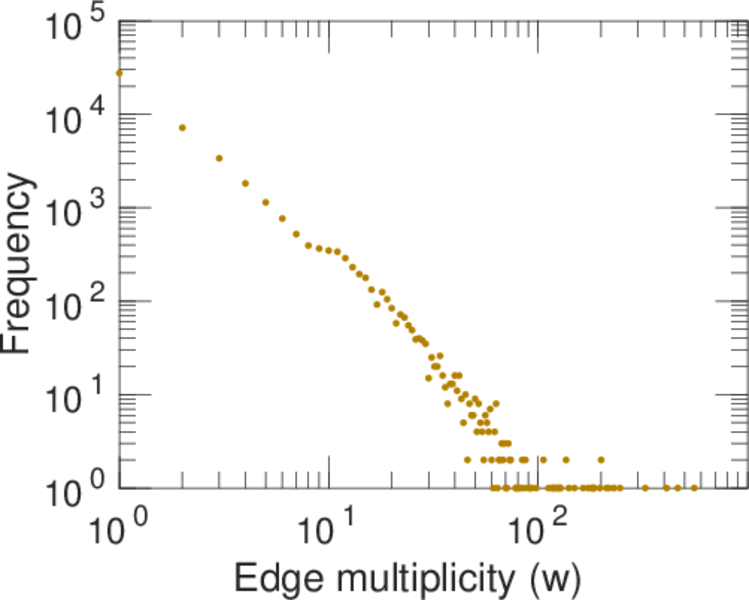
| Average edge multiplicity | m̃ = | 3.072 71
|
| Size of LCC | N = | 14,362
|
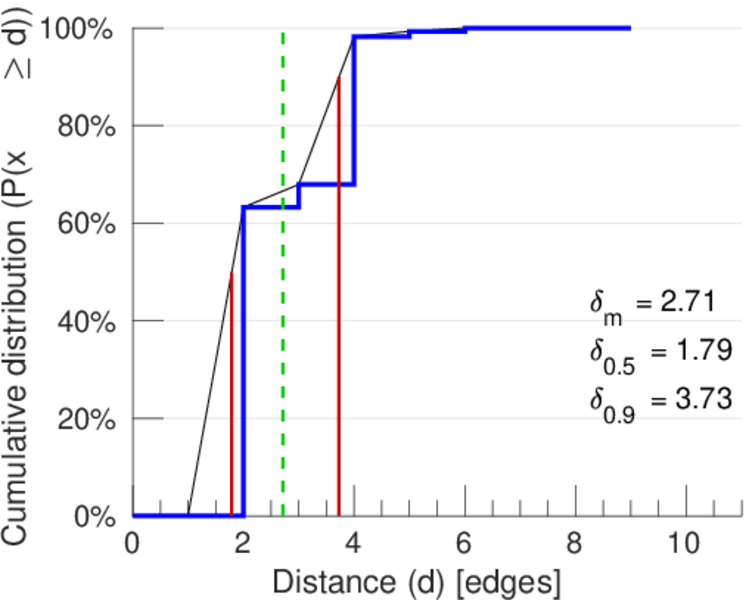
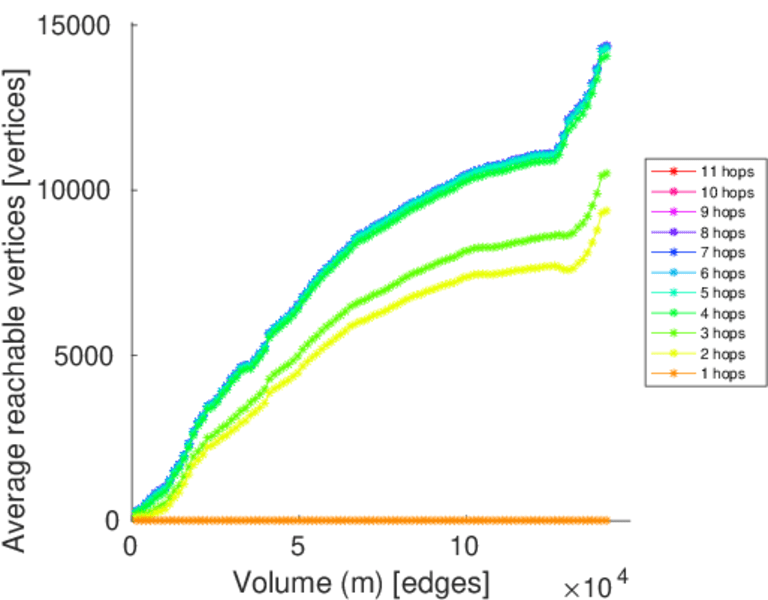
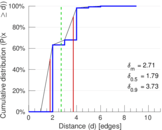
| Diameter | δ = | 10
|
| 50-Percentile effective diameter | δ0.5 = | 1.790 25
|
| 90-Percentile effective diameter | δ0.9 = | 3.727 94
|
| Median distance | δM = | 2
|
| Mean distance | δm = | 2.712 34
|
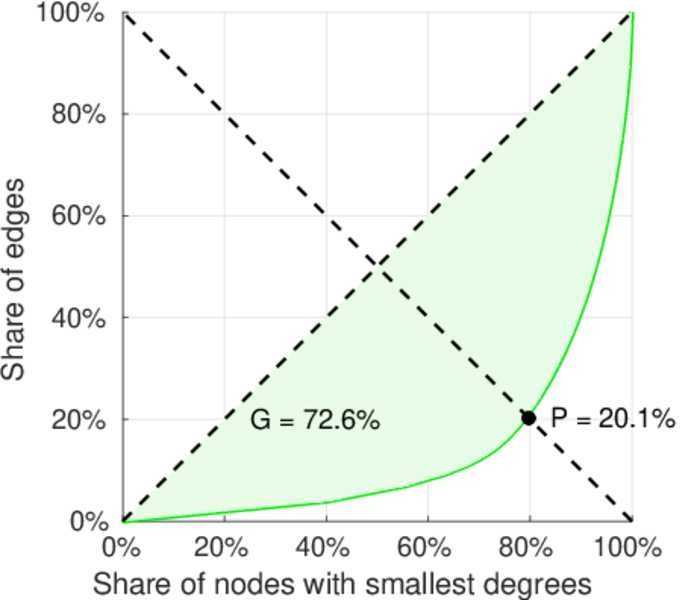
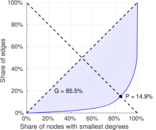
| Gini coefficient | G = | 0.856 363
|
| Balanced inequality ratio | P = | 0.150 081
|
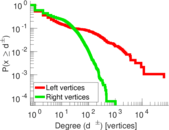
| Left balanced inequality ratio | P1 = | 0.048 311 9
|
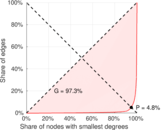
| Right balanced inequality ratio | P2 = | 0.201 147
|
| Relative edge distribution entropy | Her = | 0.723 416
|
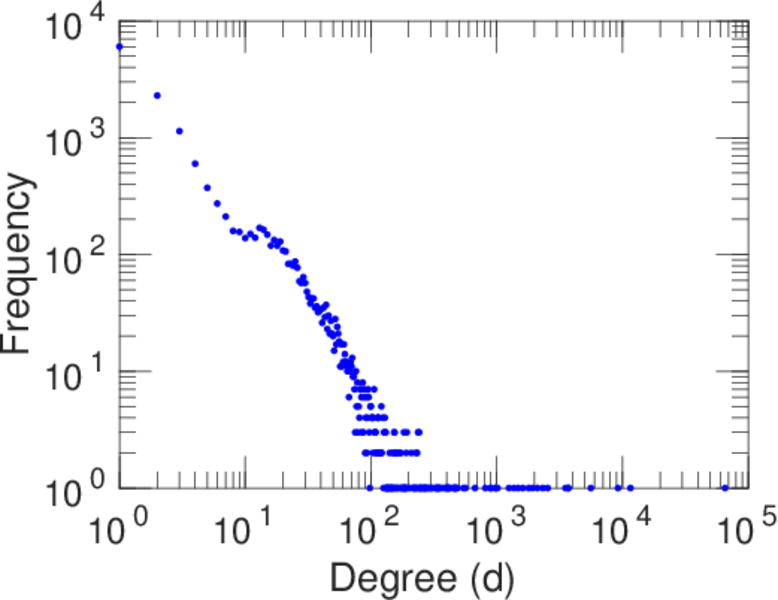
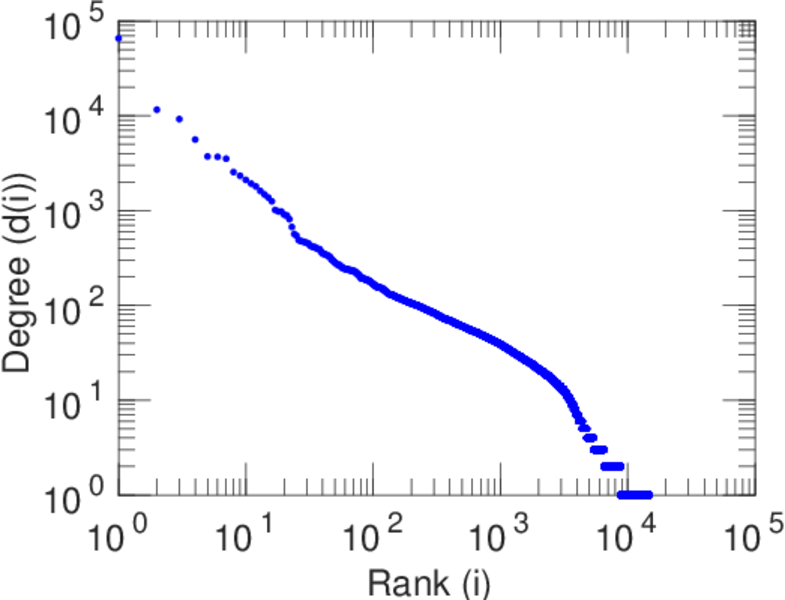
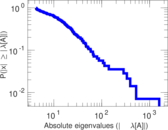
| Power law exponent | γ = | 2.669 59
|
| Tail power law exponent | γt = | 1.971 00
|
| Tail power law exponent with p | γ3 = | 1.971 00
|
| p-value | p = | 0.000 00
|
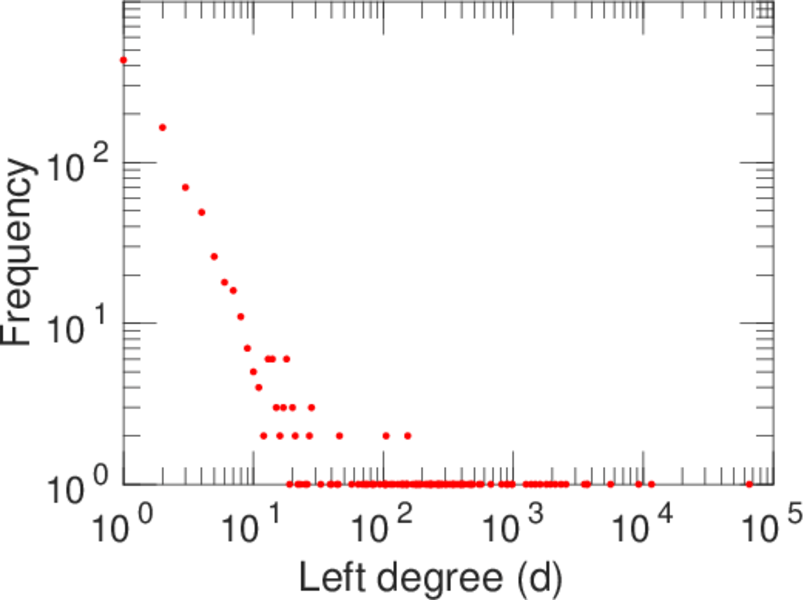
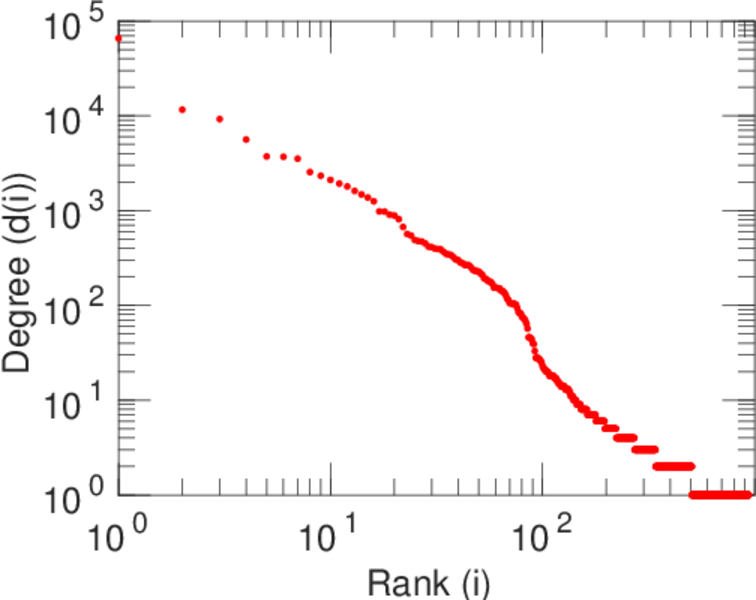
| Left tail power law exponent with p | γ3,1 = | 1.721 00
|
| Left p-value | p1 = | 0.000 00
|
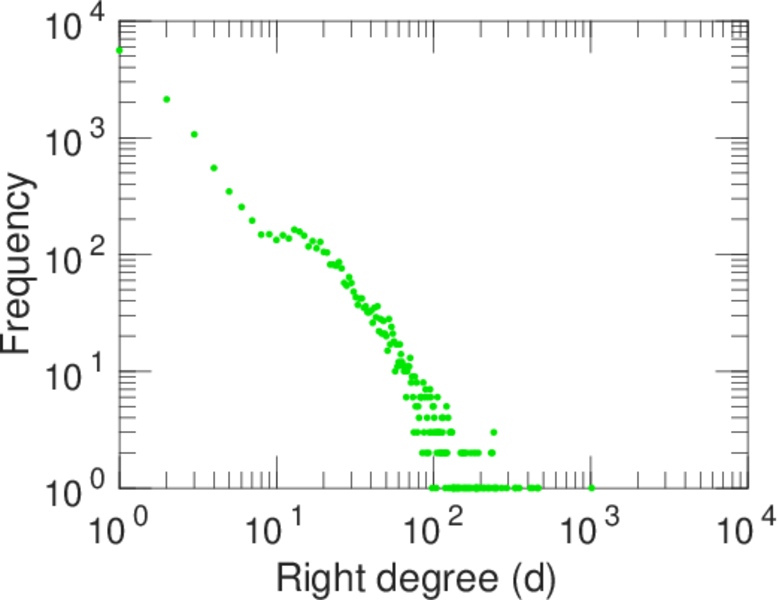
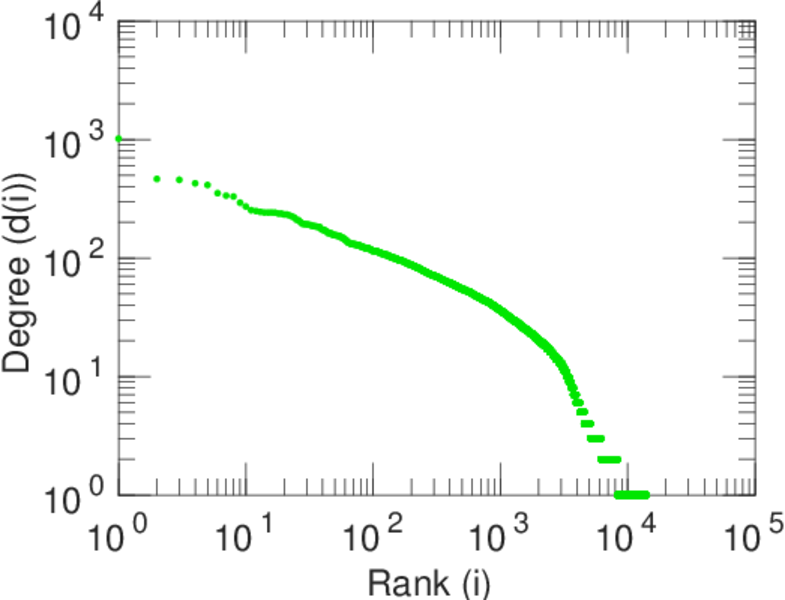
| Right tail power law exponent with p | γ3,2 = | 1.991 00
|
| Right p-value | p2 = | 0.000 00
|
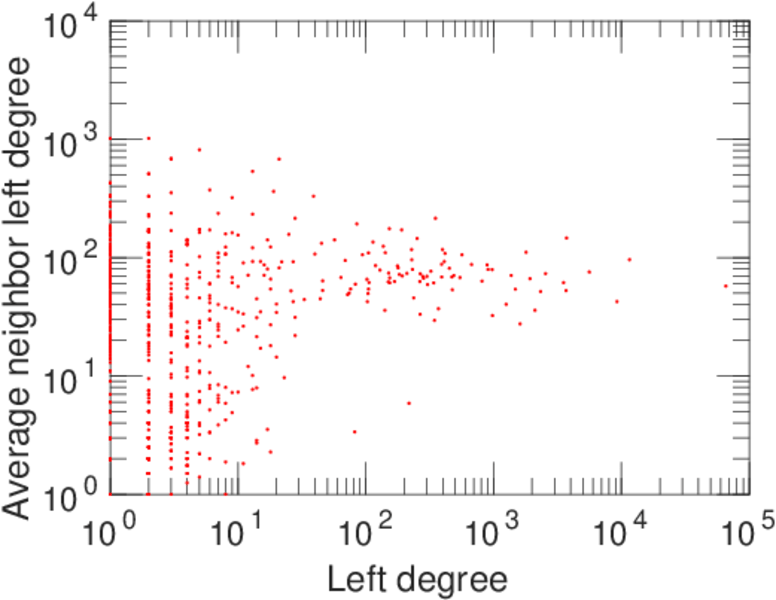
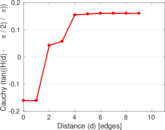
| Degree assortativity | ρ = | −0.489 404
|
| Degree assortativity p-value | pρ = | 0.000 00
|
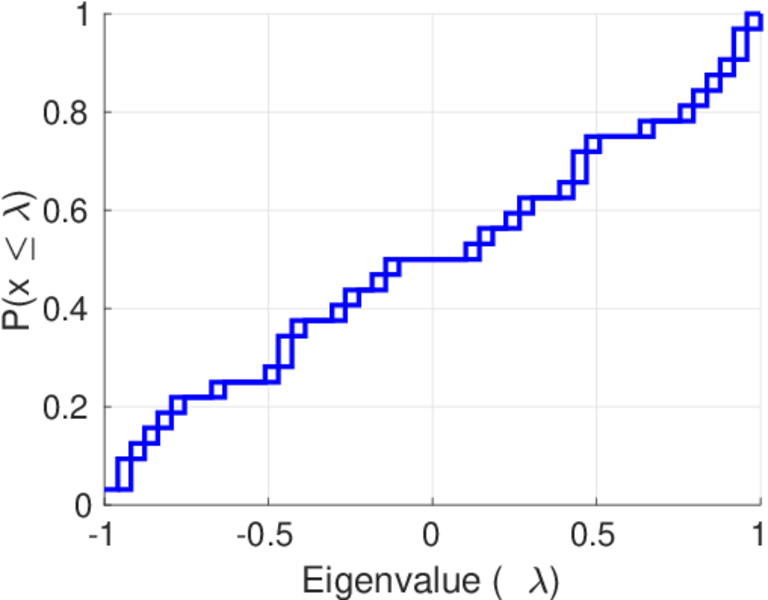
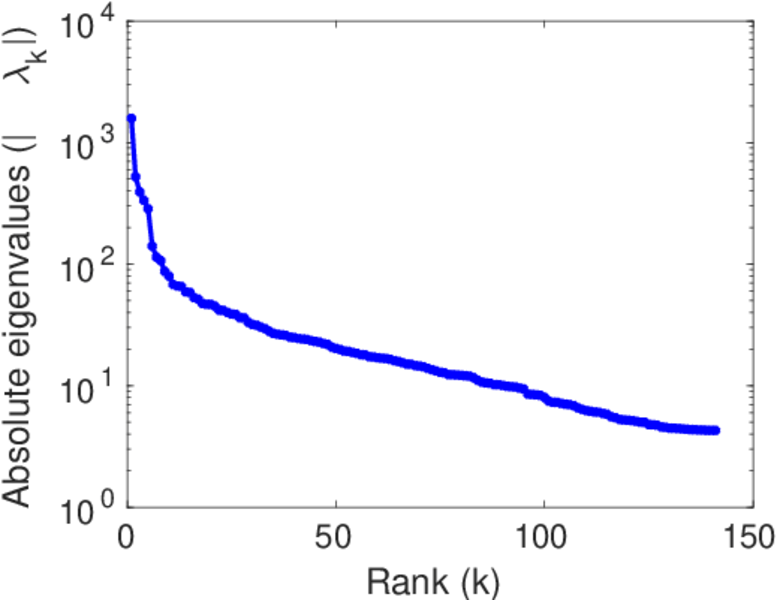
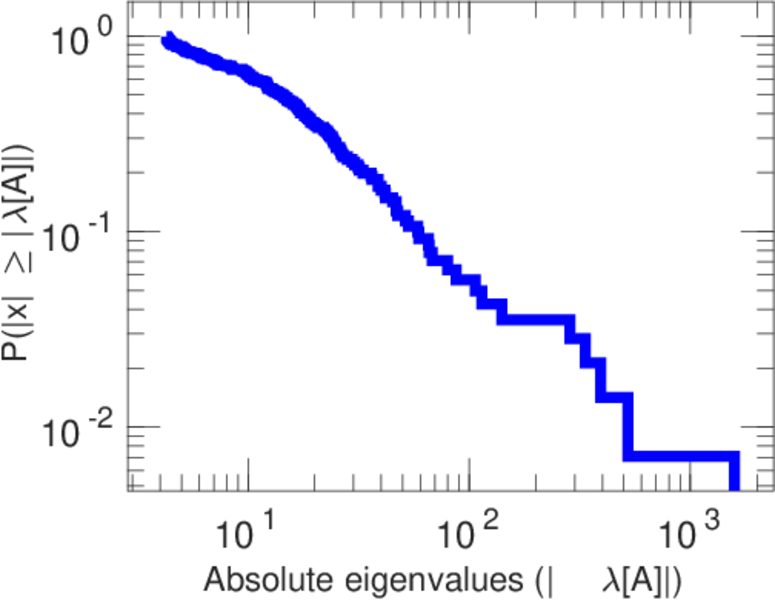
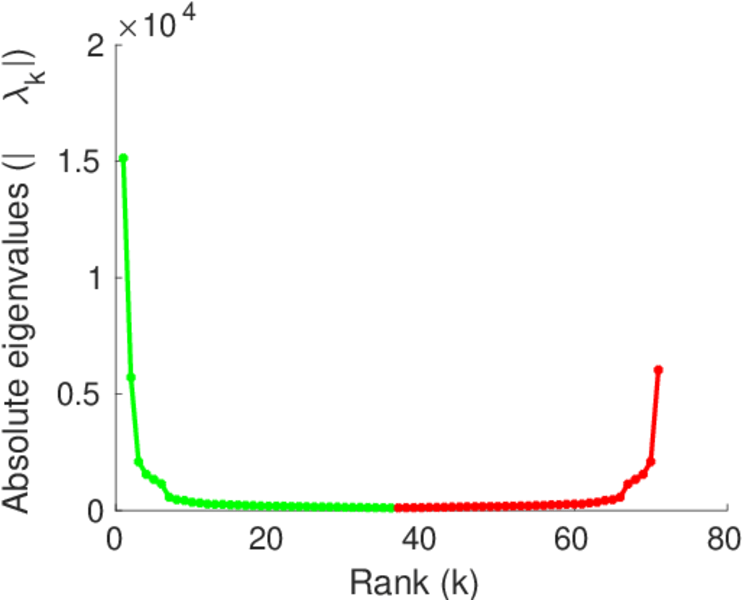
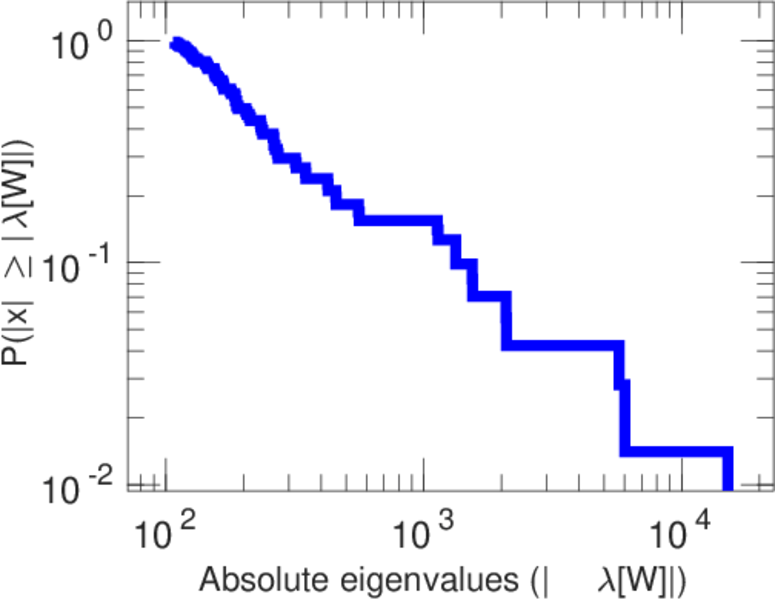
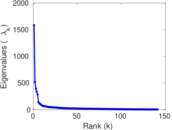
| Spectral norm | α = | 1,583.24
|
| Algebraic connectivity | a = | 0.083 669 3
|
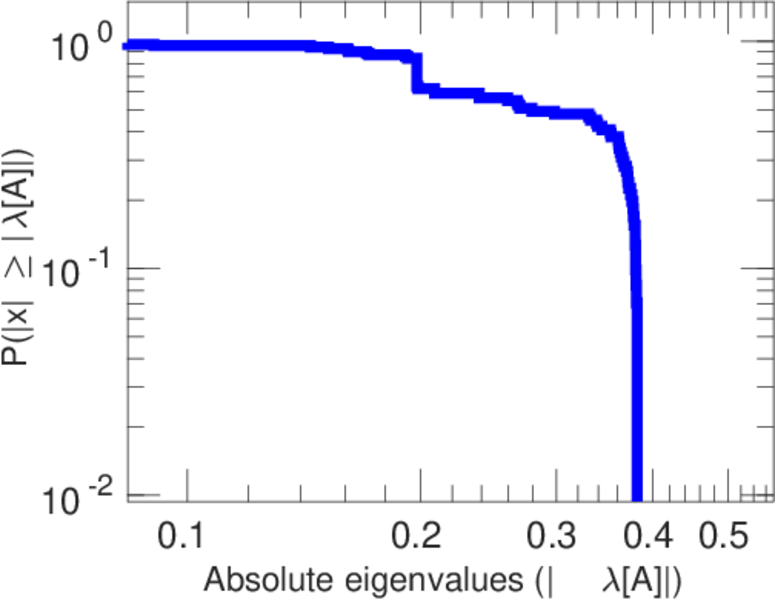
| Spectral separation | |λ1[A] / λ2[A]| = | 3.030 08
|
| Controllability | C = | 13,050
|
| Relative controllability | Cr = | 0.880 210
|
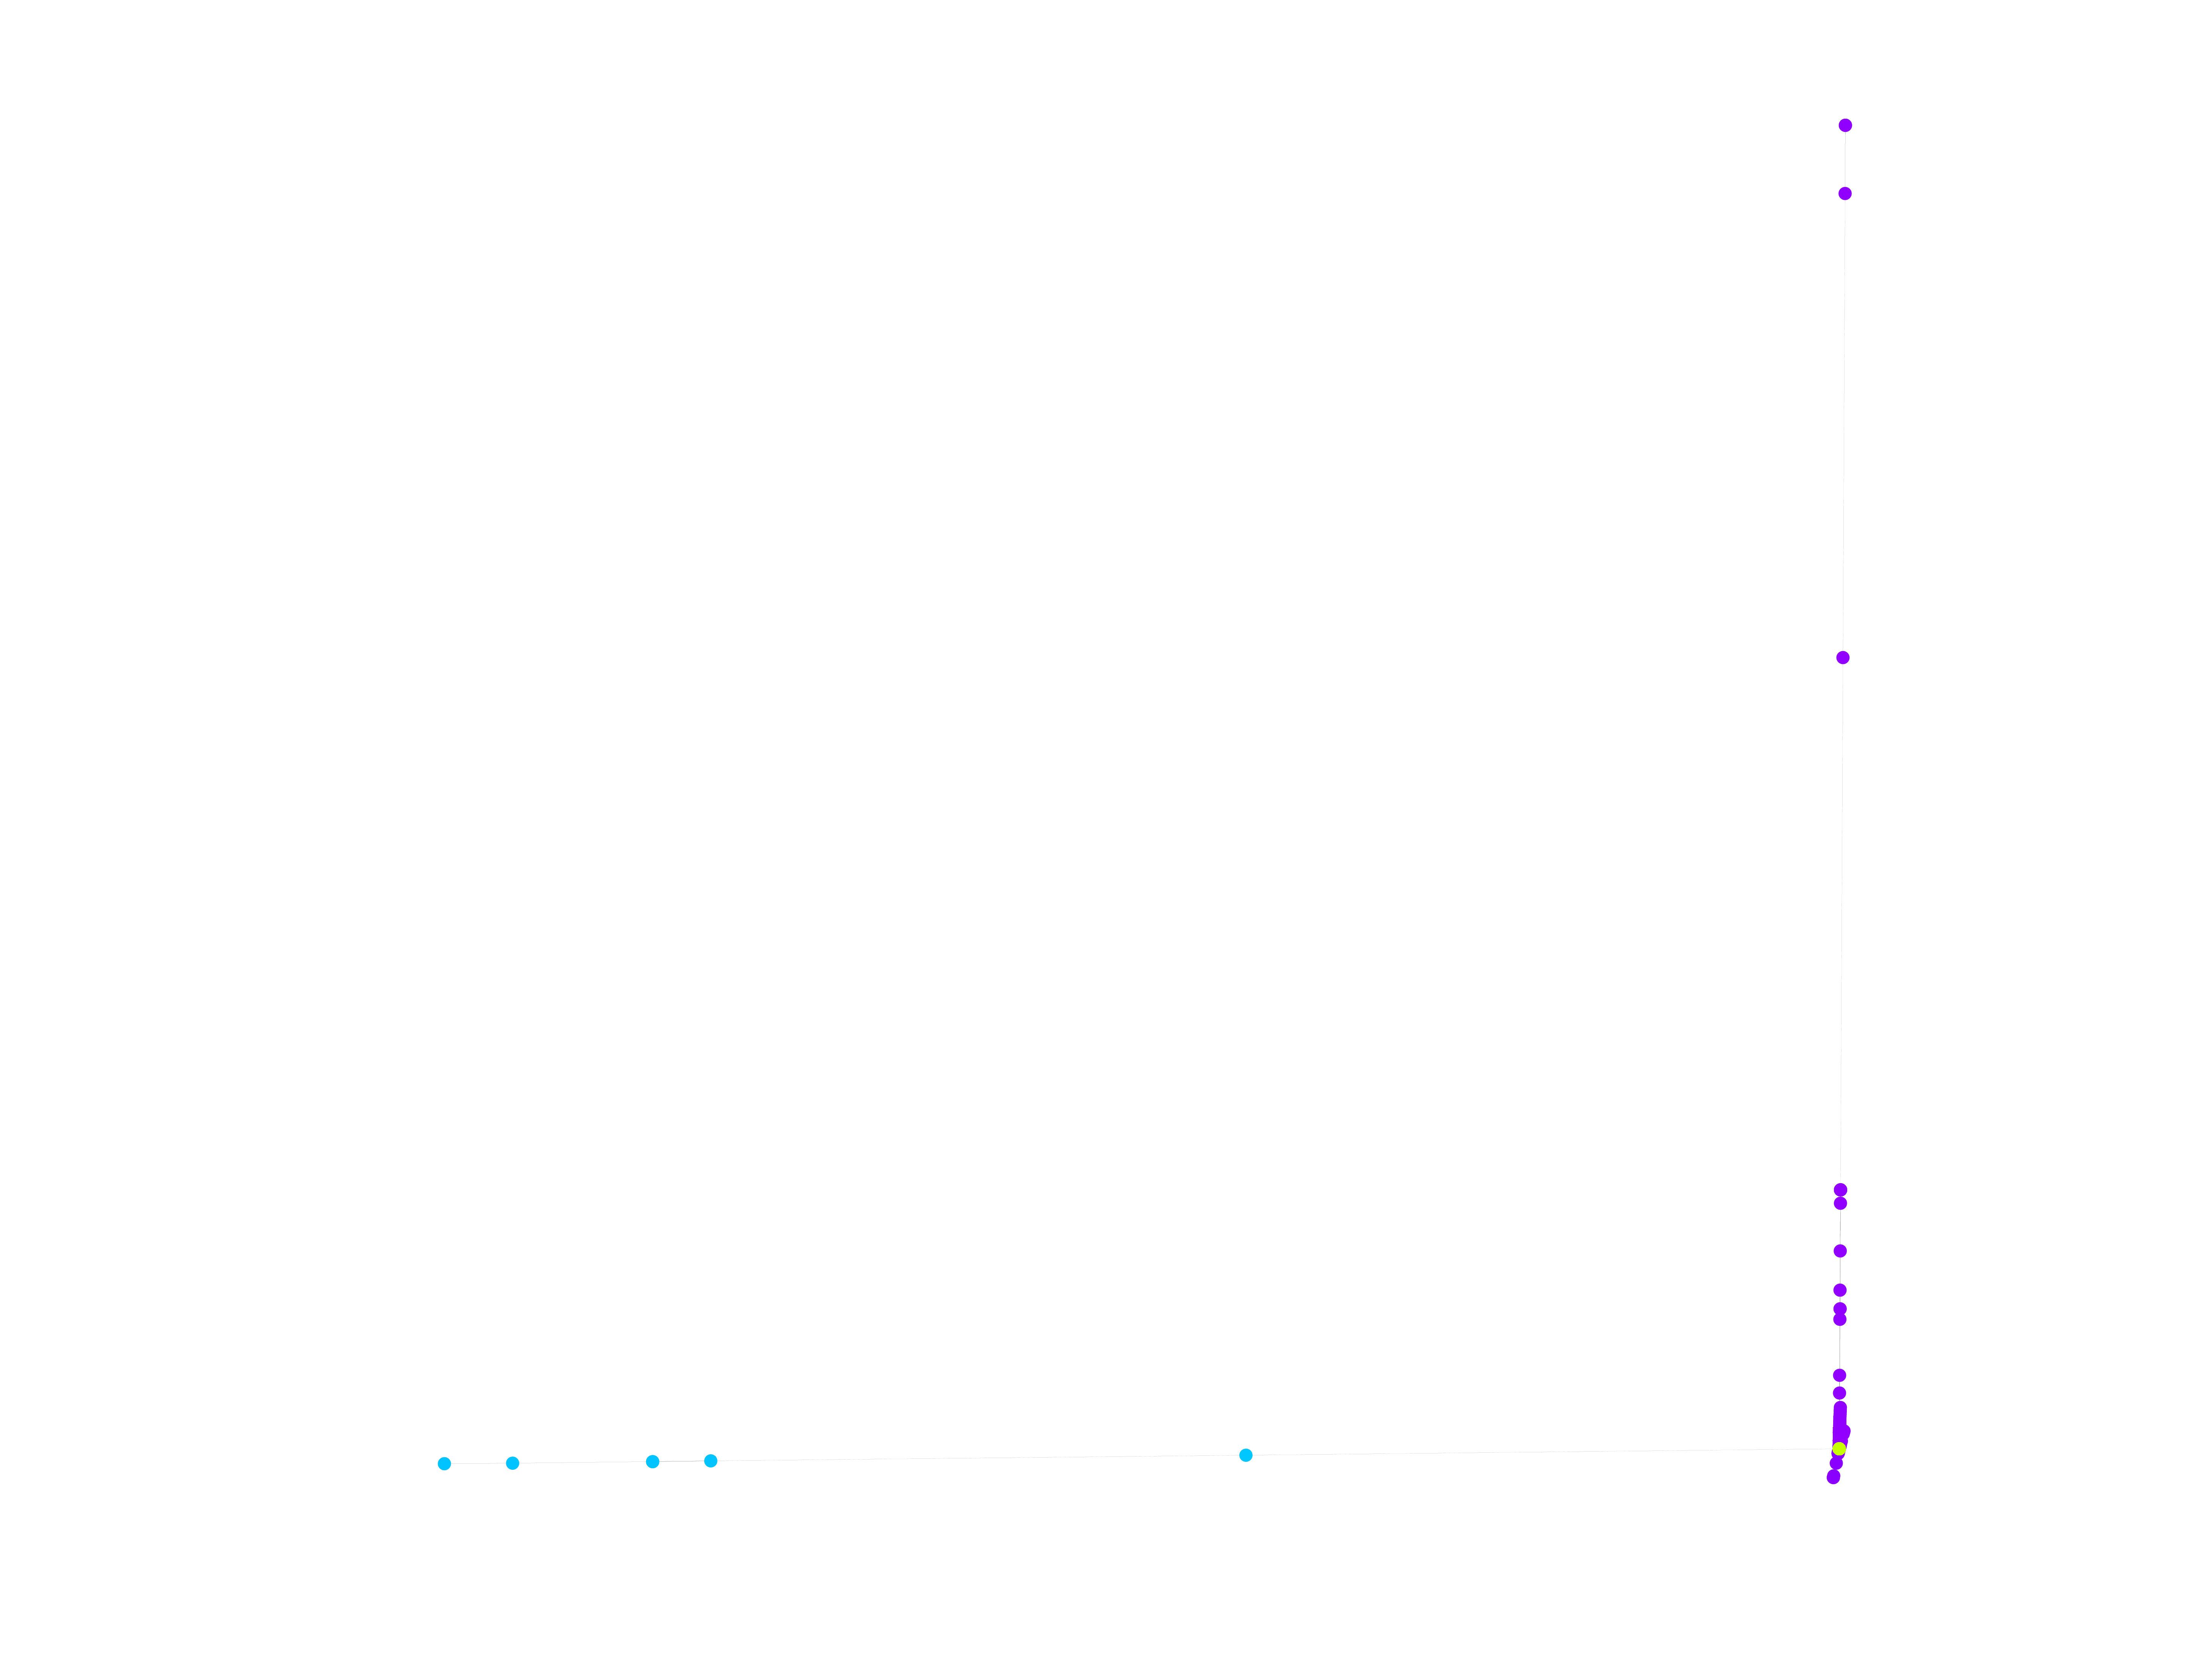
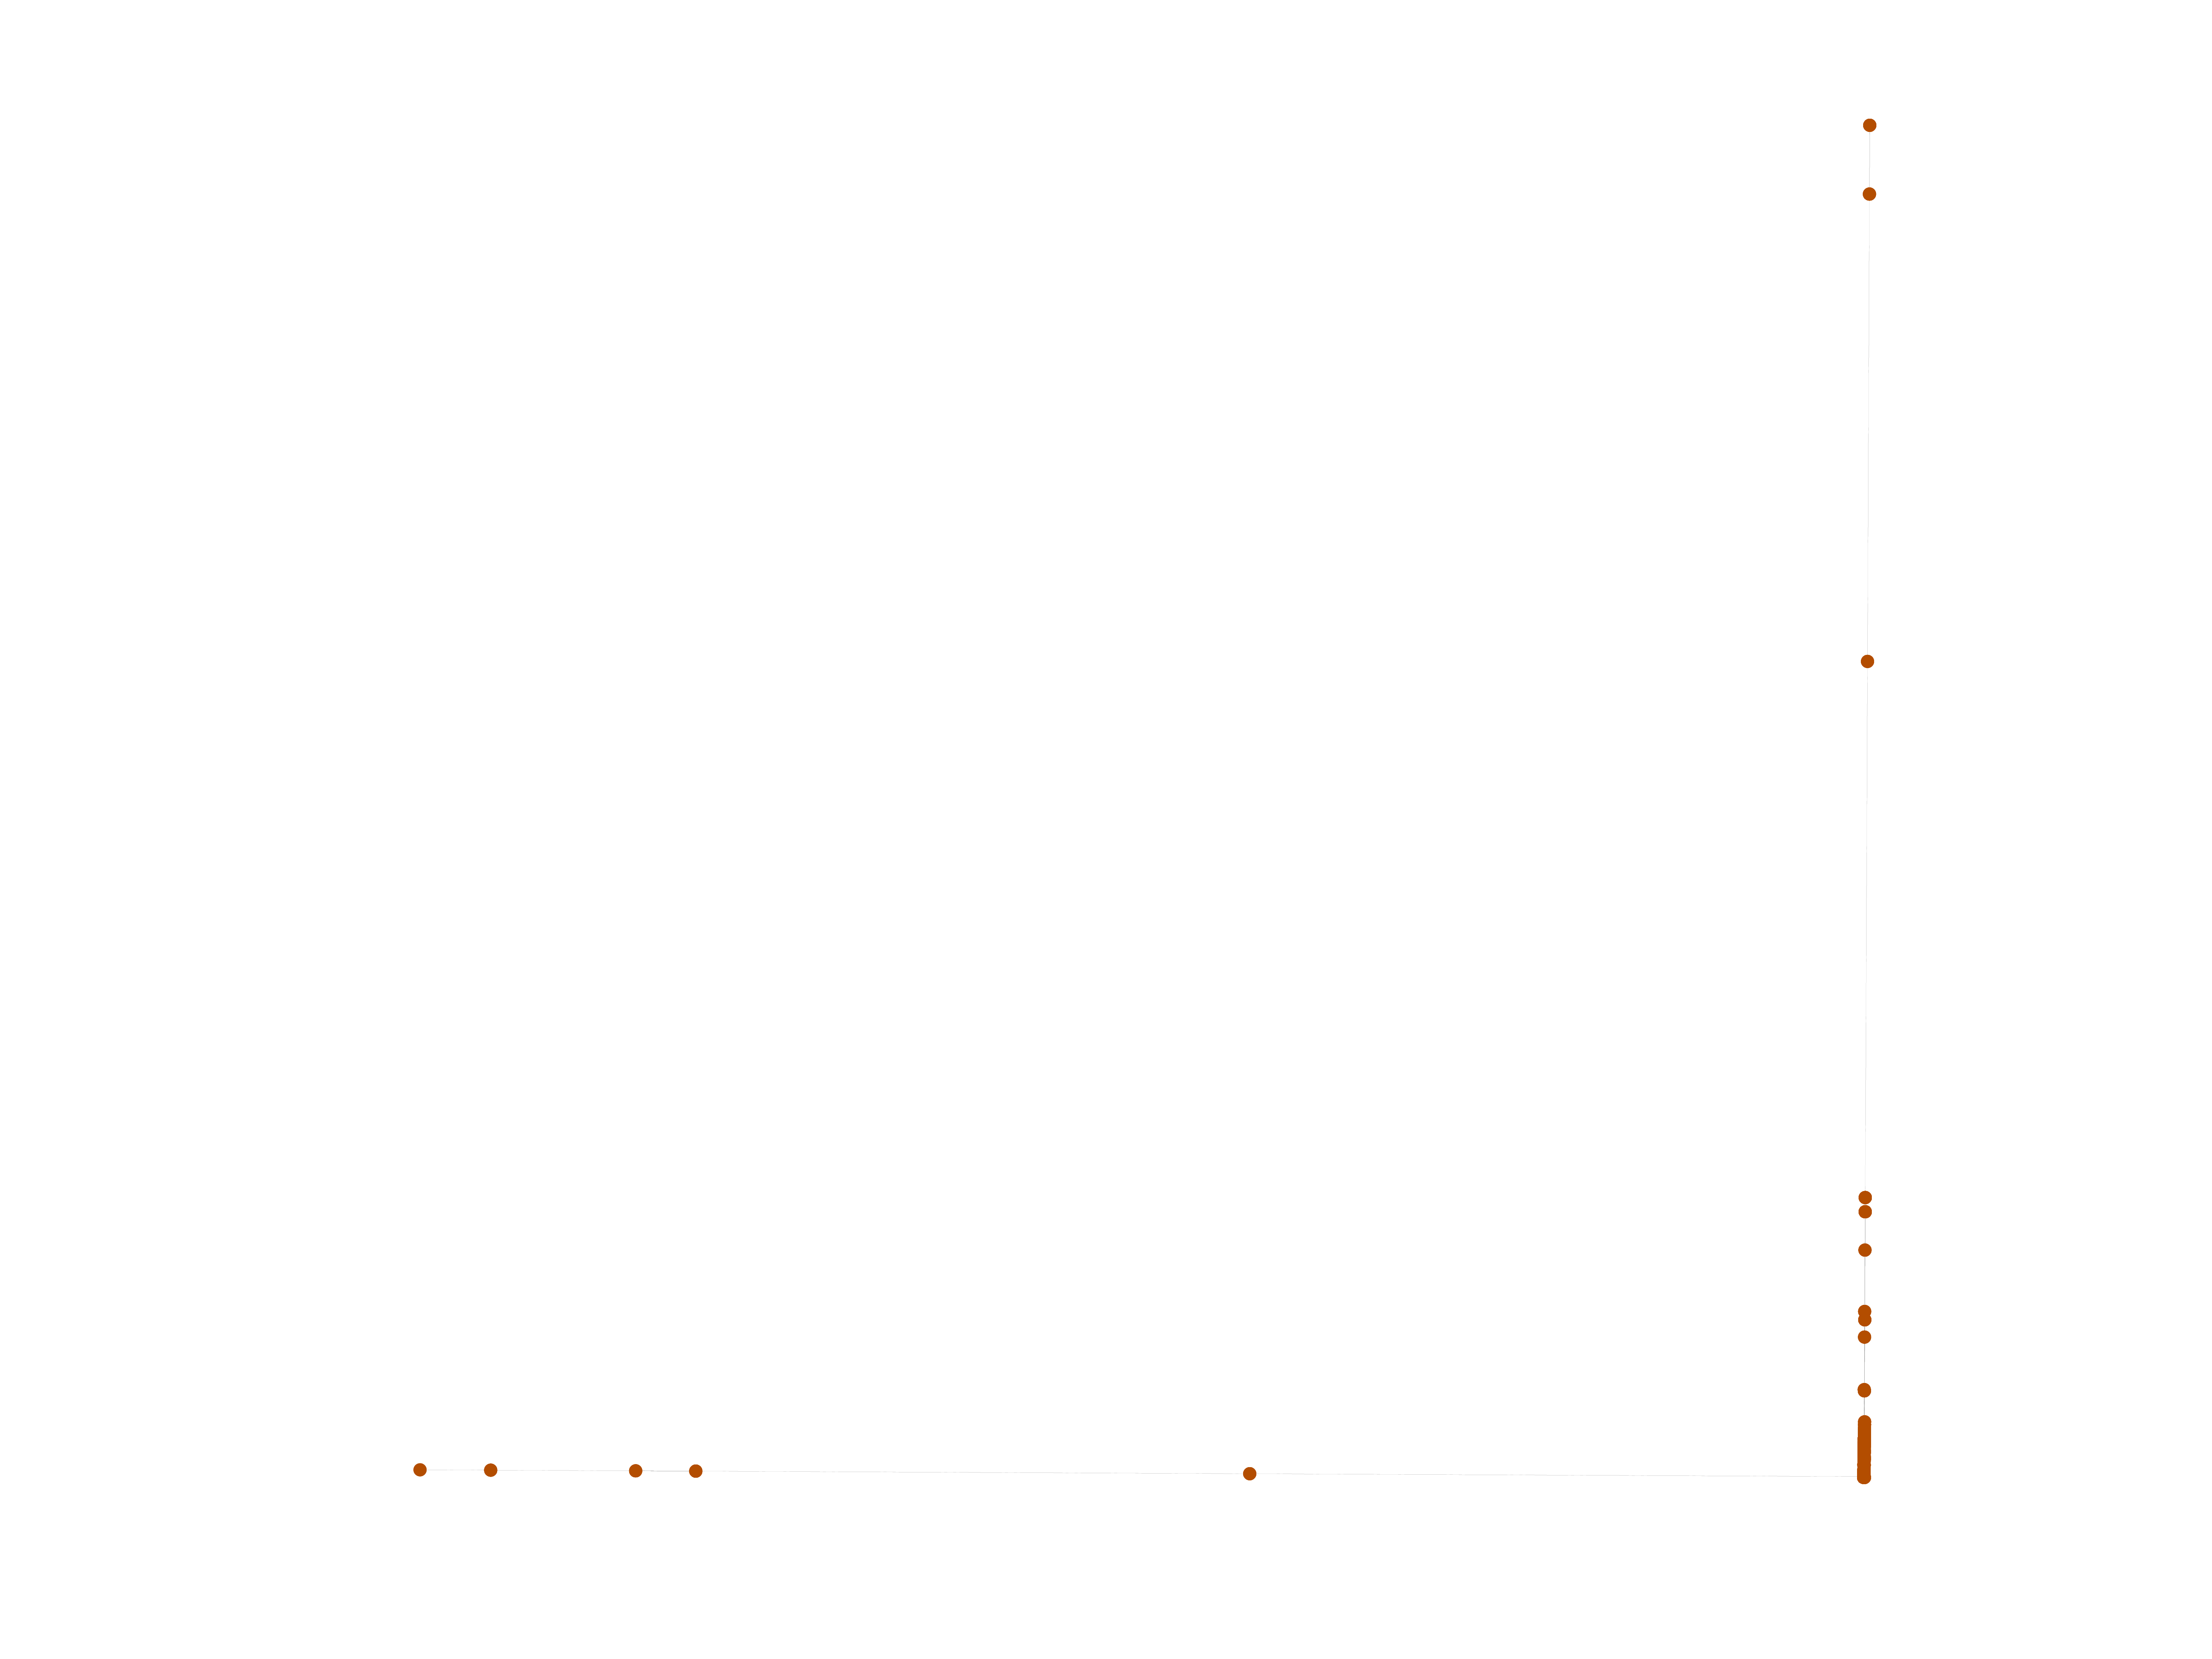
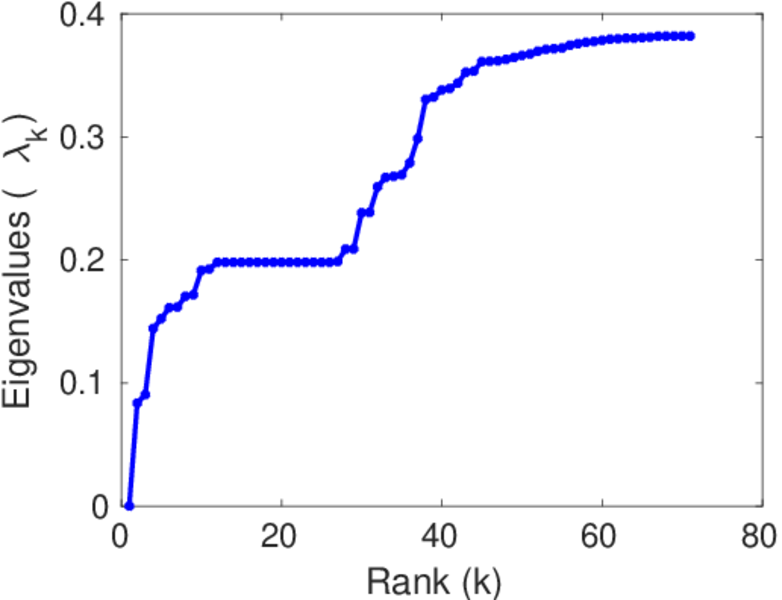
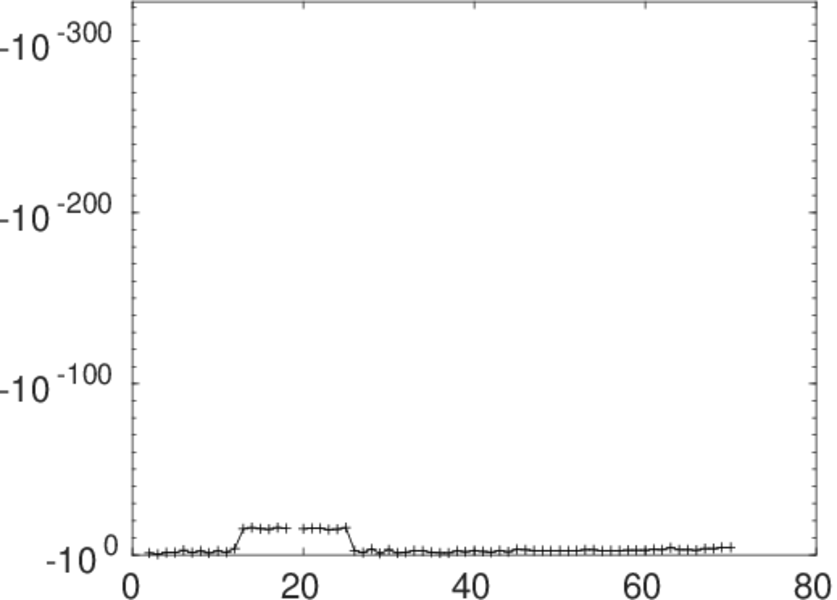
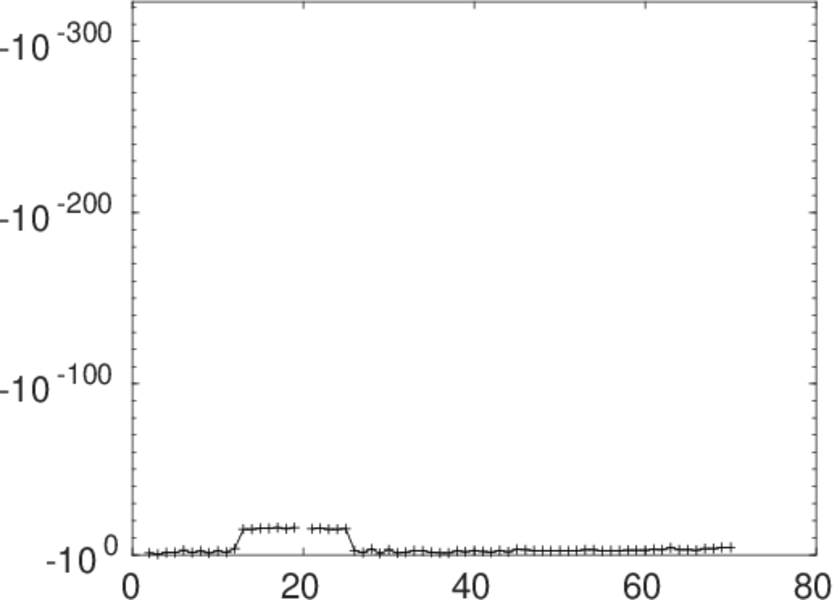
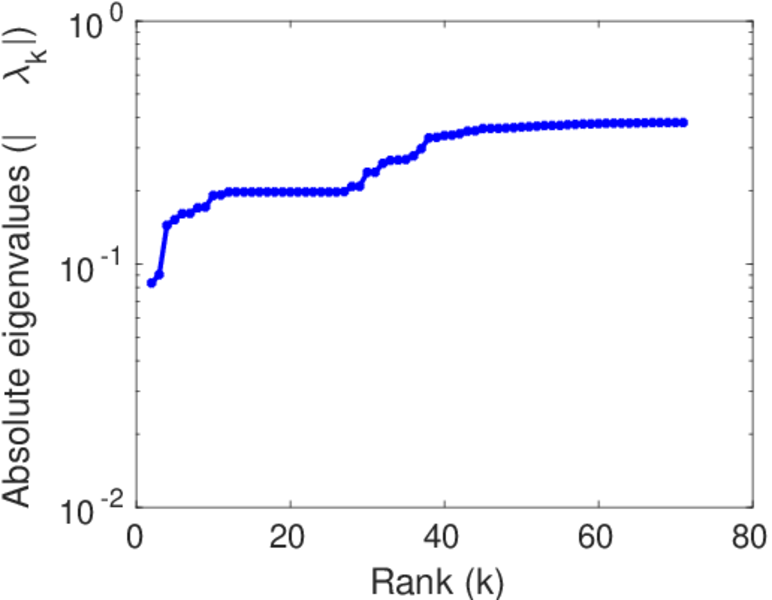
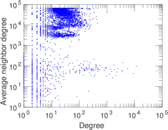
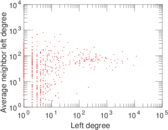
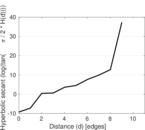
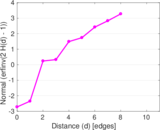
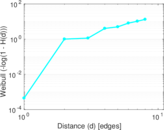
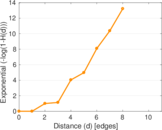
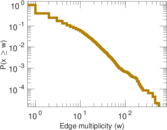
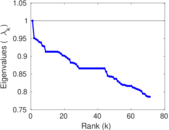
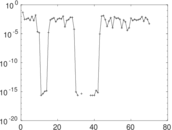
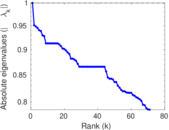
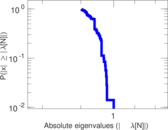
Plots


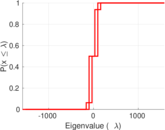

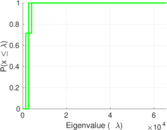


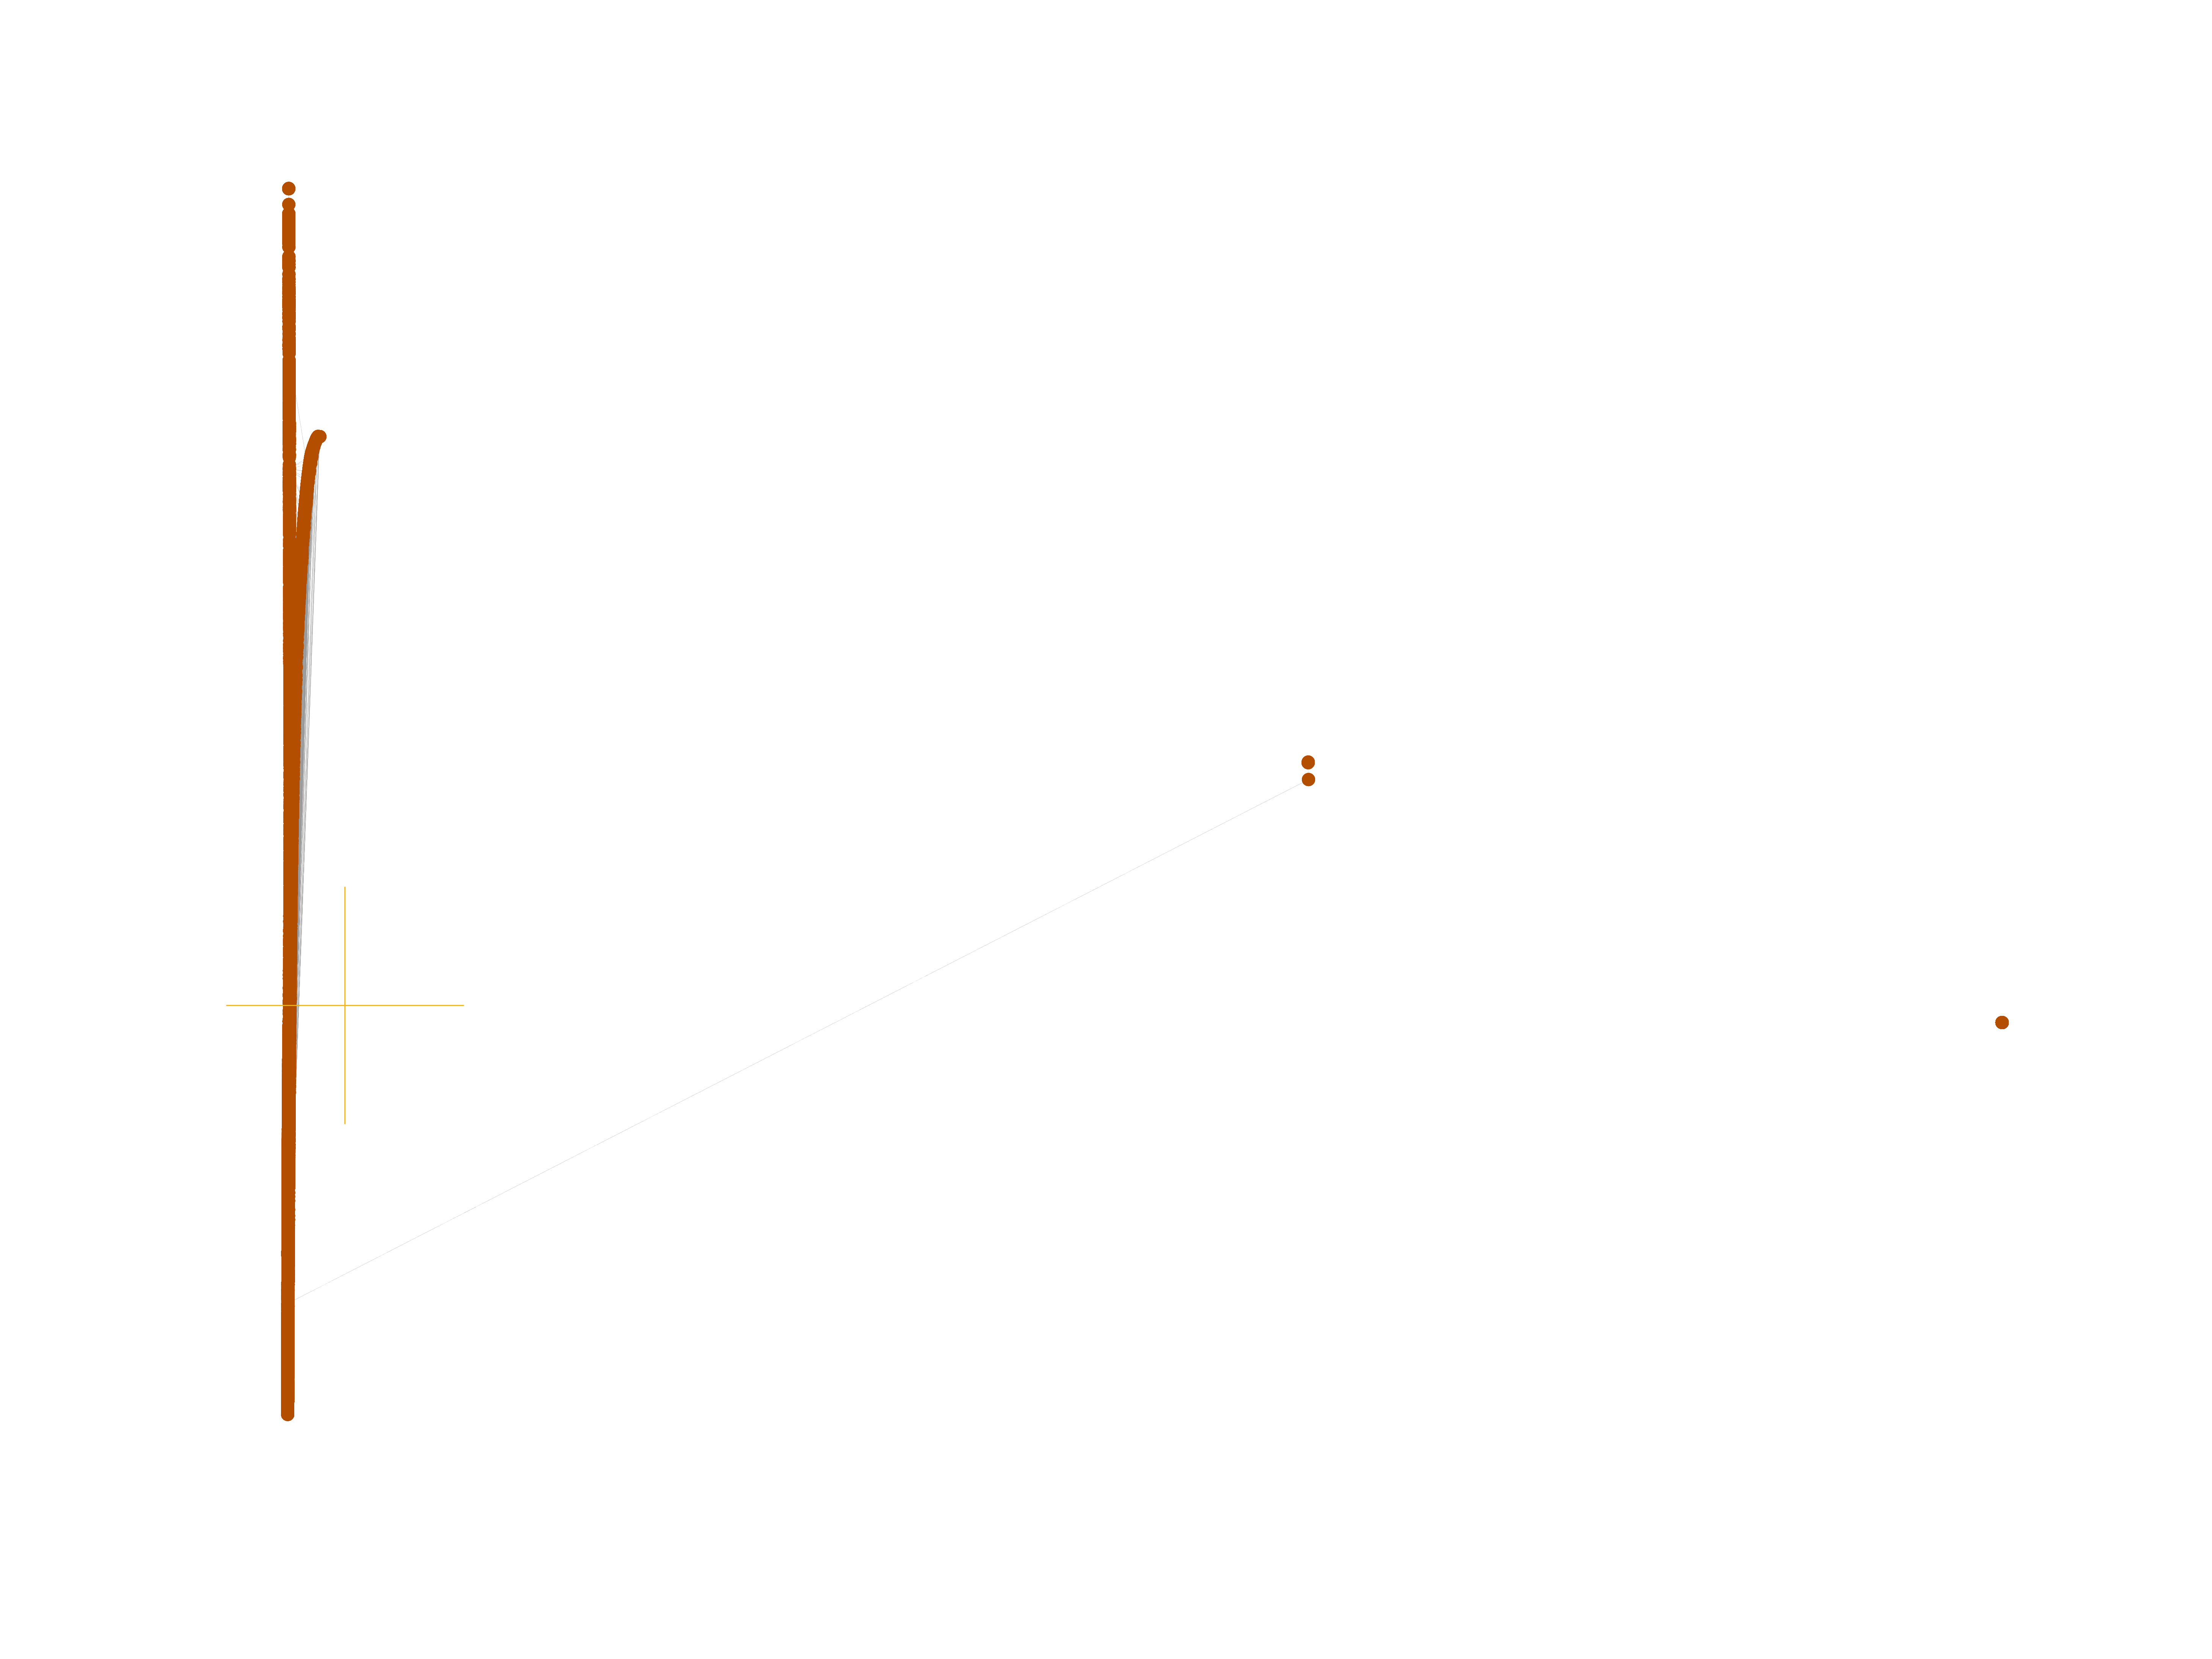
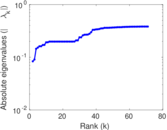
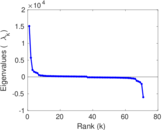
Matrix decompositions plots


Downloads
References
|
[1]
|
Jérôme Kunegis.
KONECT – The Koblenz Network Collection.
In Proc. Int. Conf. on World Wide Web Companion, pages
1343–1350, 2013.
[ http ]
|
|
[2]
|
Wikimedia Foundation.
Wikimedia downloads.
http://dumps.wikimedia.org/, January 2010.
|
 KONECT ‣ Networks ‣
Buy Me a Coffee
KONECT ‣ Networks ‣
Buy Me a Coffee