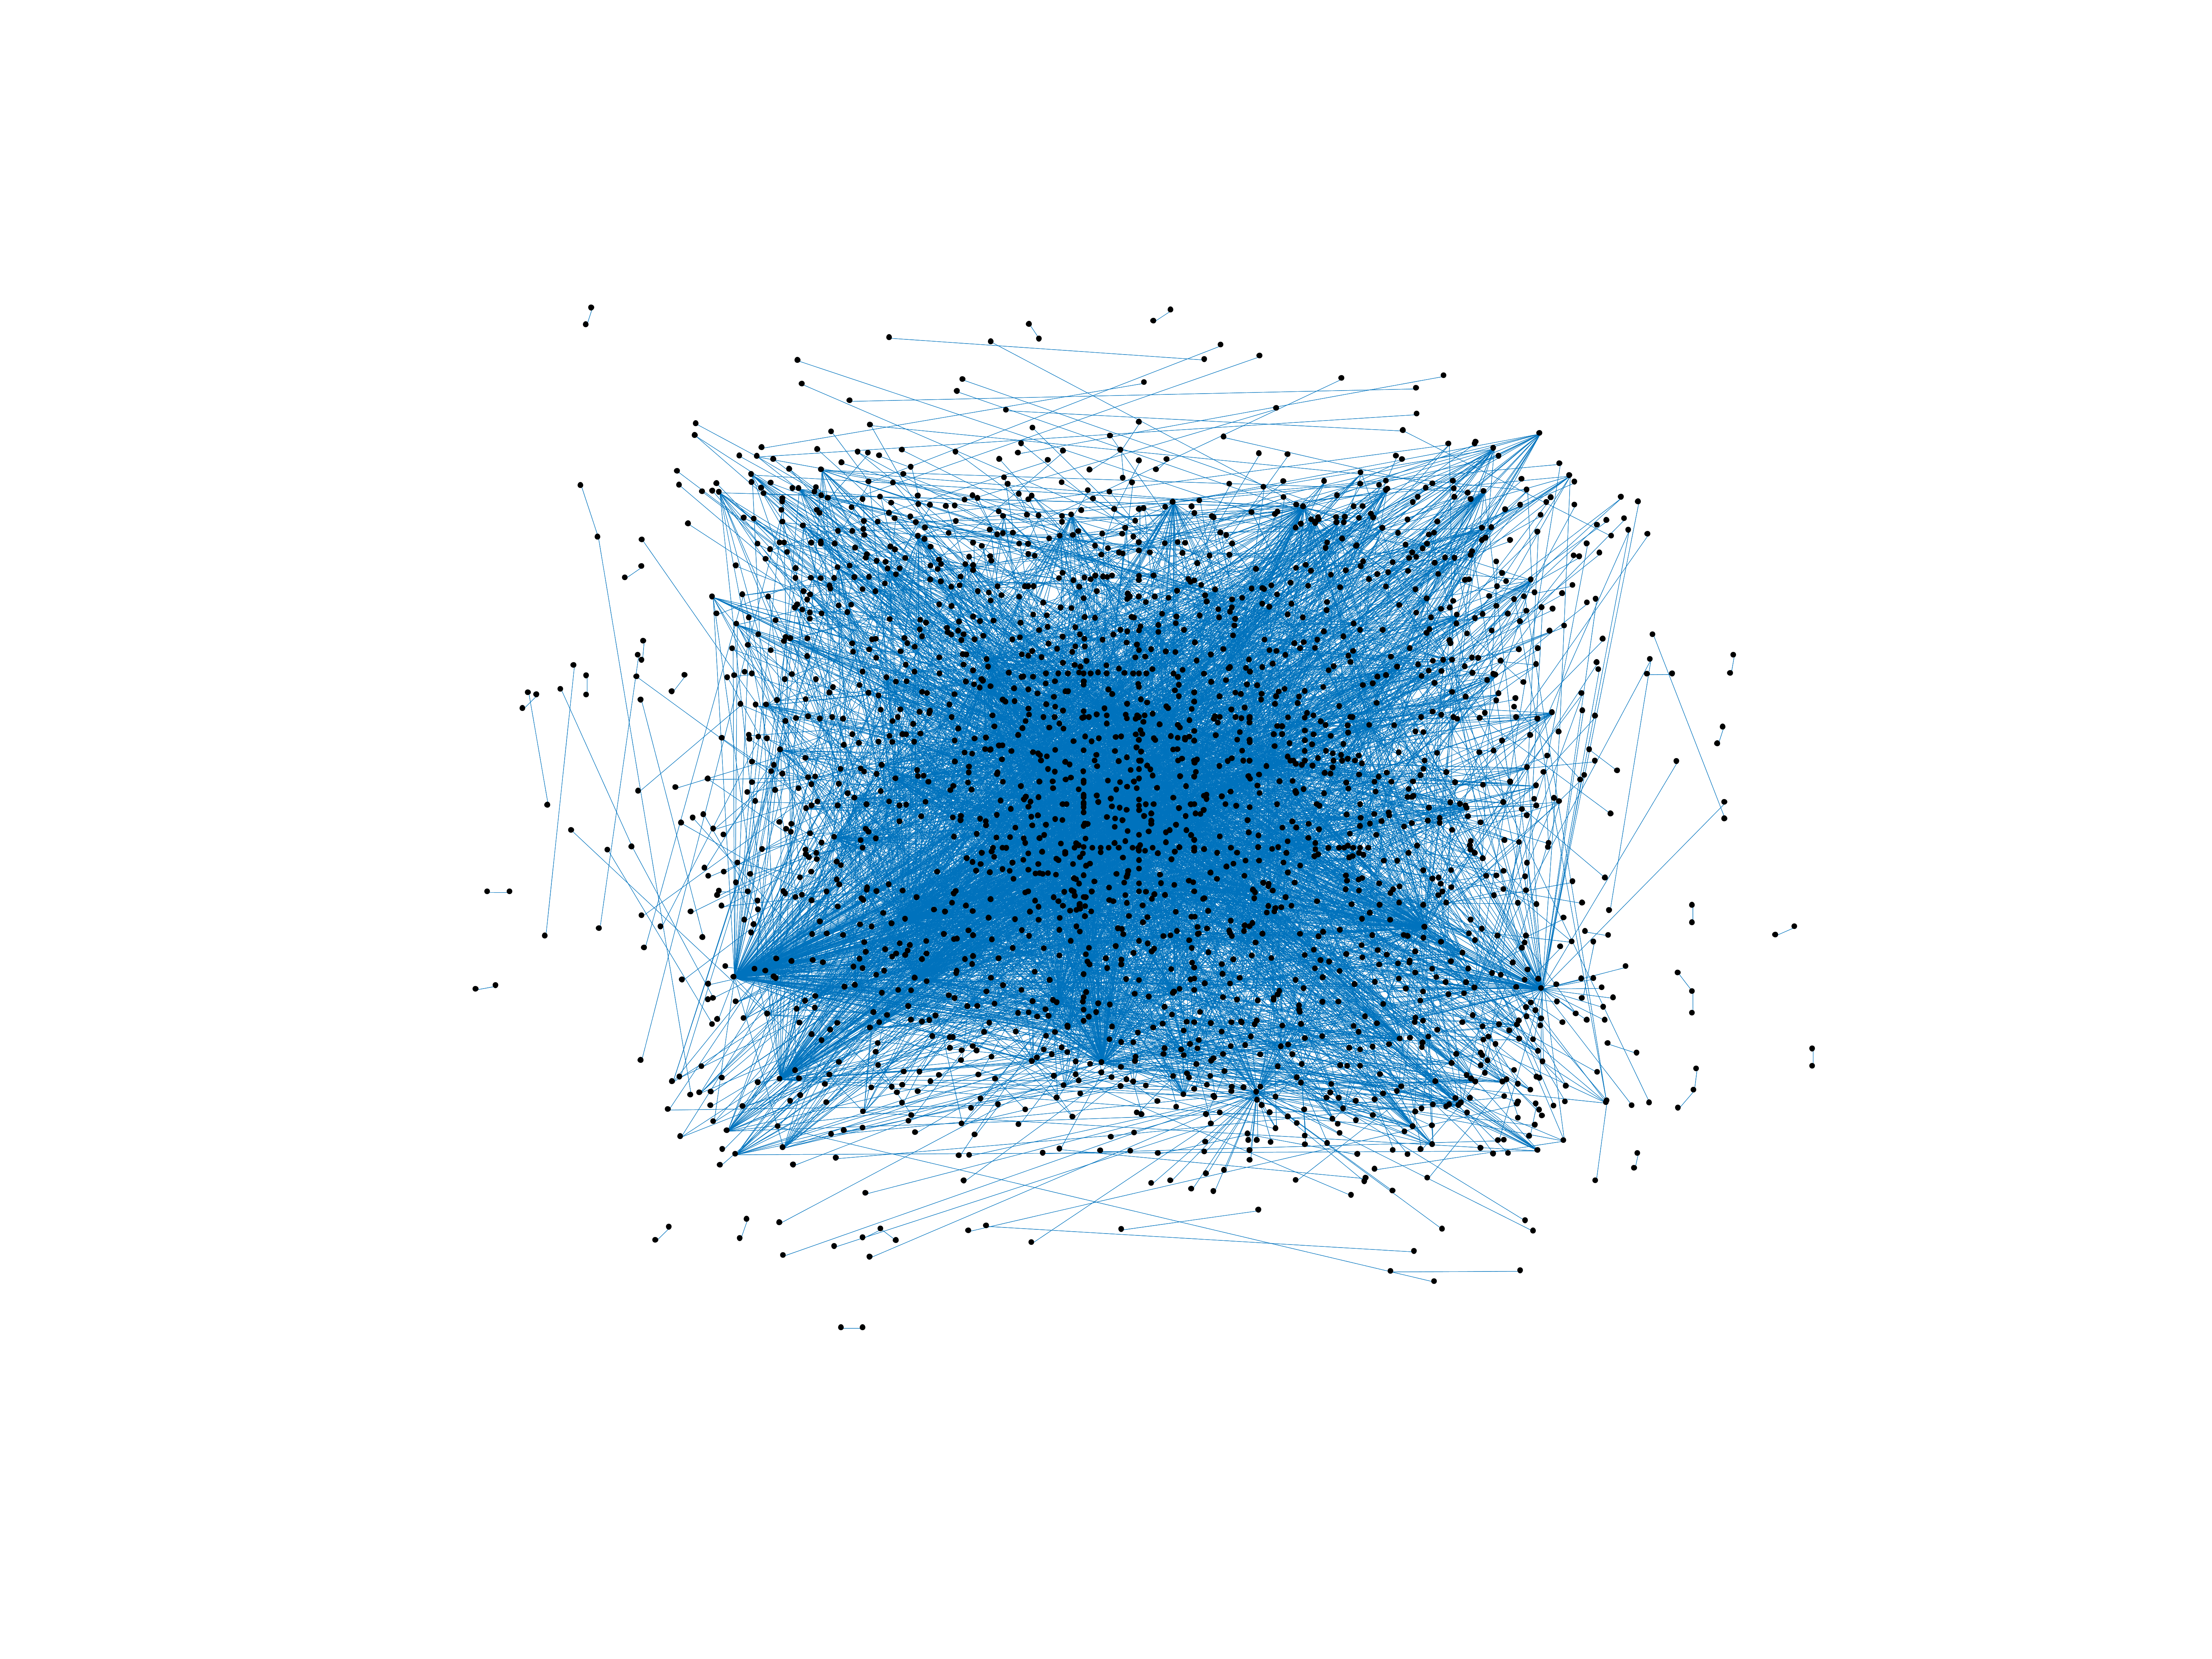
Wikipedia edits (ny)
This is the bipartite edit network of the Nyanja Wikipedia. It contains users
and pages from the Nyanja Wikipedia, connected by edit events. Each edge
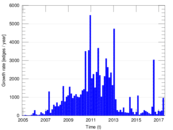
represents an edit. The dataset includes the timestamp of each edit.
Metadata
Statistics
| Size | n = | 2,338
|
| Left size | n1 = | 554
|
| Right size | n2 = | 1,784
|
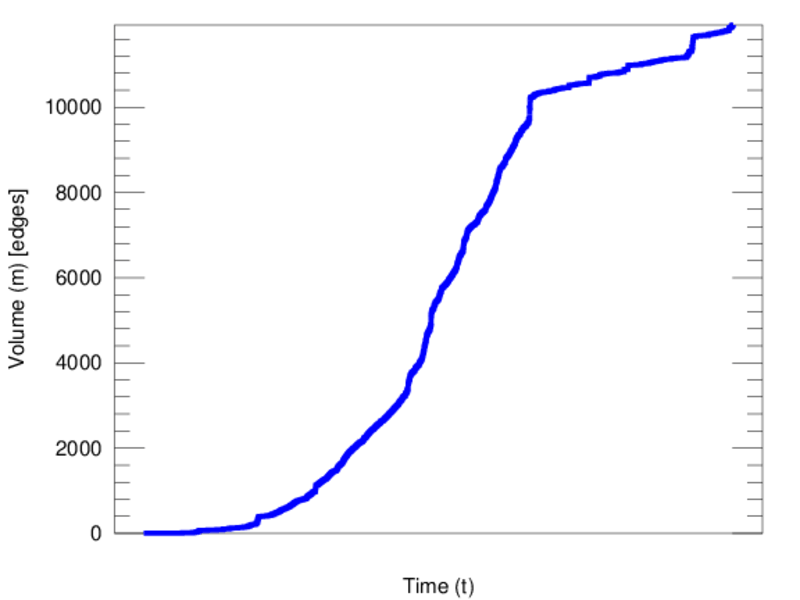
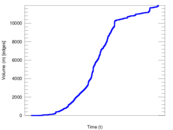
| Volume | m = | 11,930
|
| Unique edge count | m̿ = | 5,097
|
| Wedge count | s = | 246,794
|
| Claw count | z = | 11,076,944
|
| Cross count | x = | 479,617,248
|
| Square count | q = | 416,557
|
| 4-Tour count | T4 = | 4,331,102
|
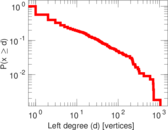
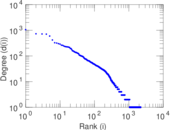
| Maximum degree | dmax = | 1,054
|
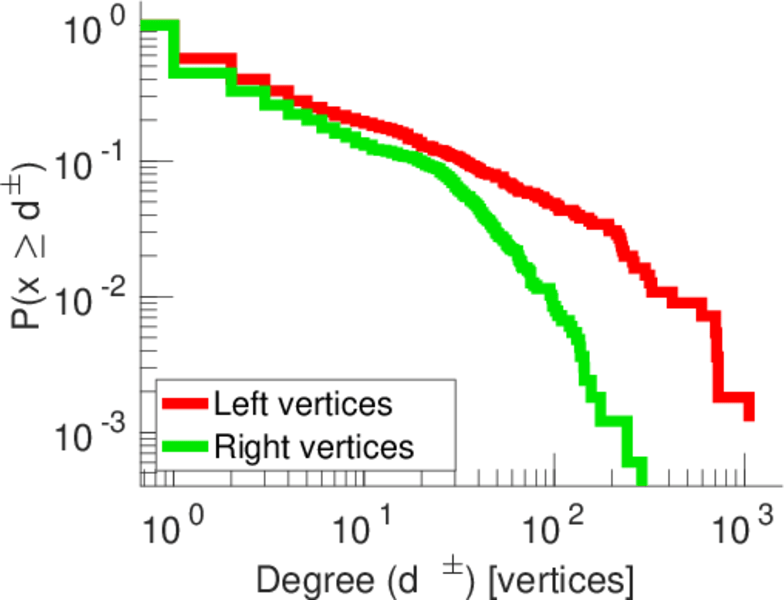
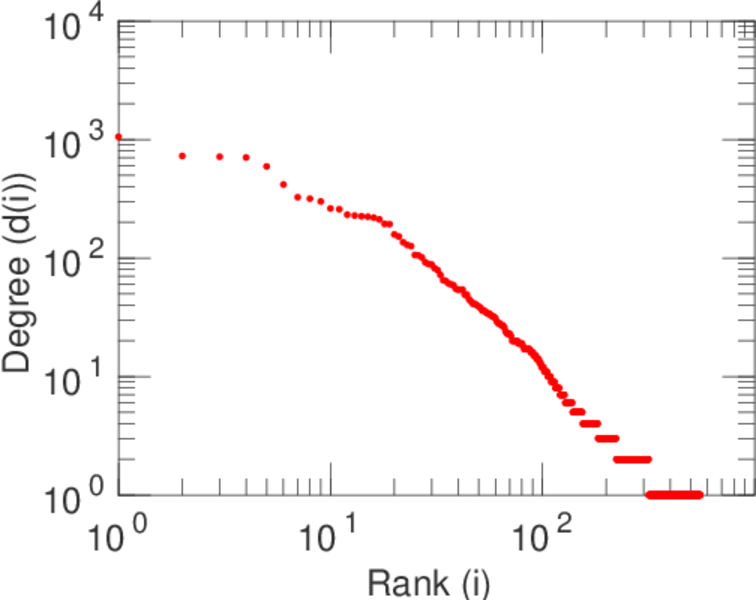
| Maximum left degree | d1max = | 1,054
|
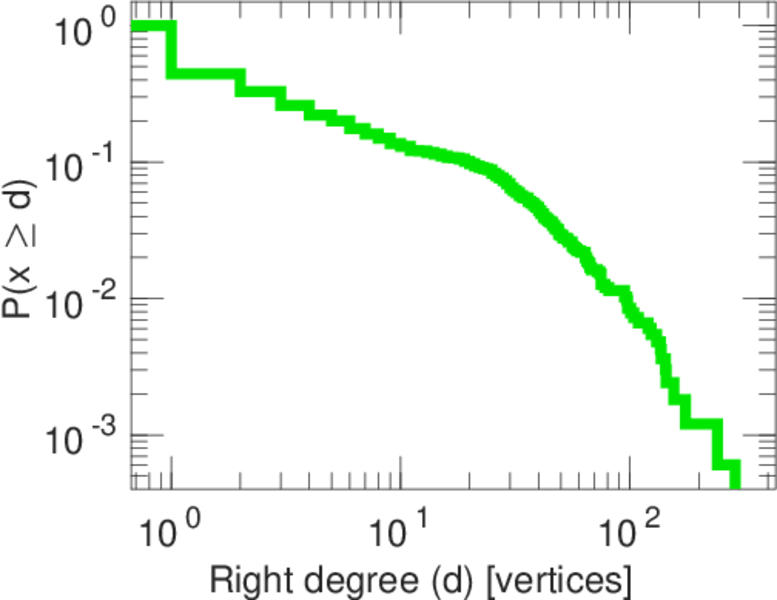
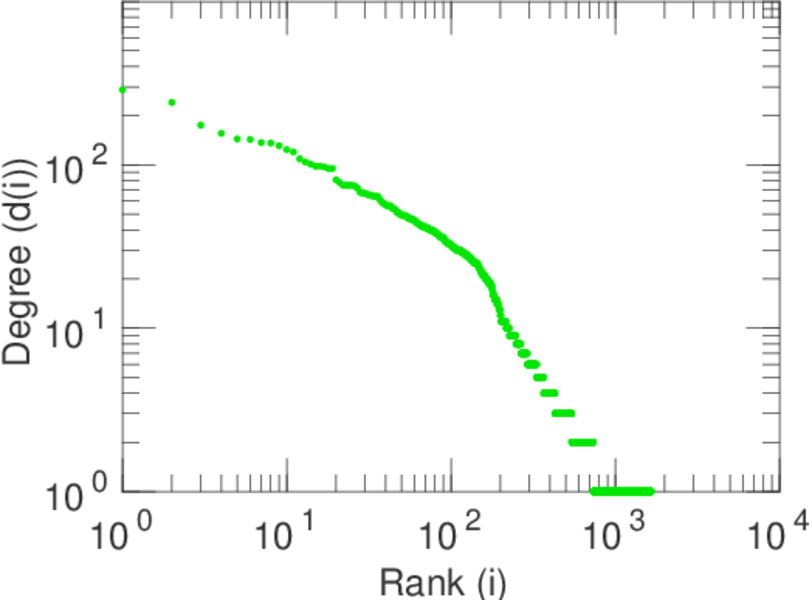
| Maximum right degree | d2max = | 288
|
| Average degree | d = | 10.205 3
|
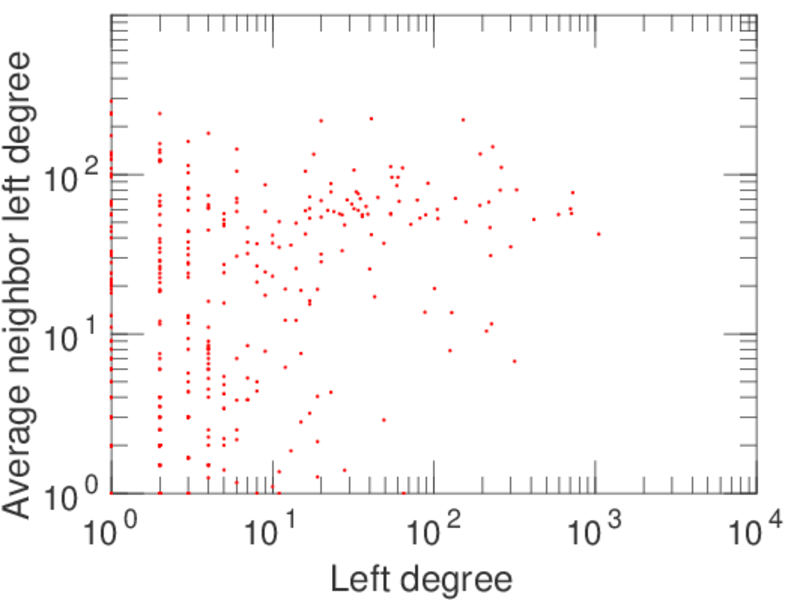
| Average left degree | d1 = | 21.534 3
|
| Average right degree | d2 = | 6.687 22
|
| Fill | p = | 0.005 157 15
|
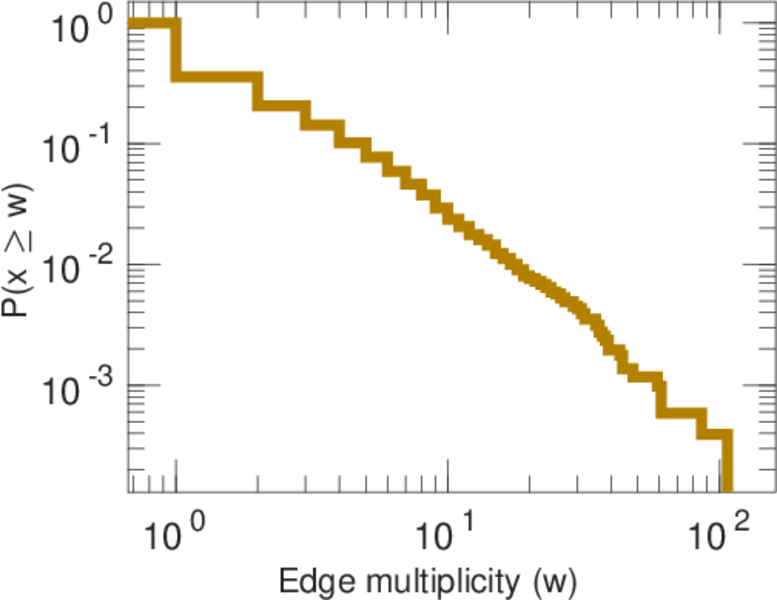
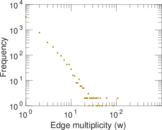
| Average edge multiplicity | m̃ = | 2.340 59
|
| Size of LCC | N = | 1,678
|
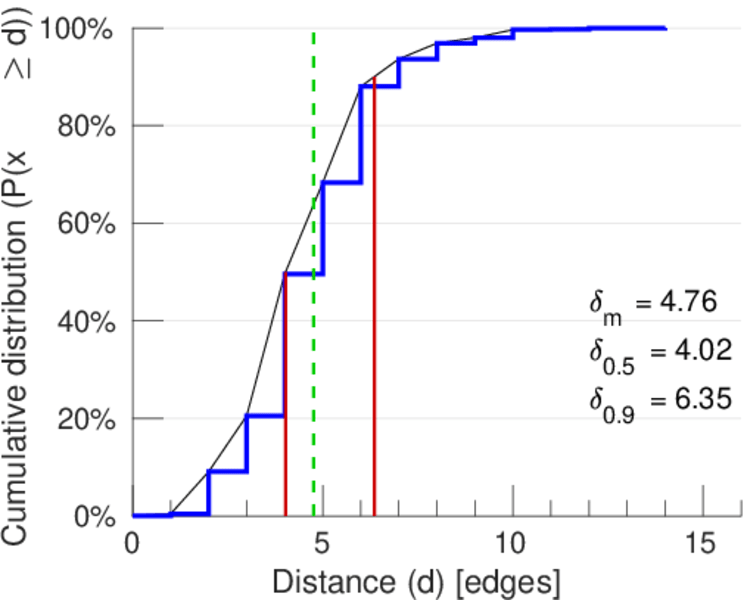
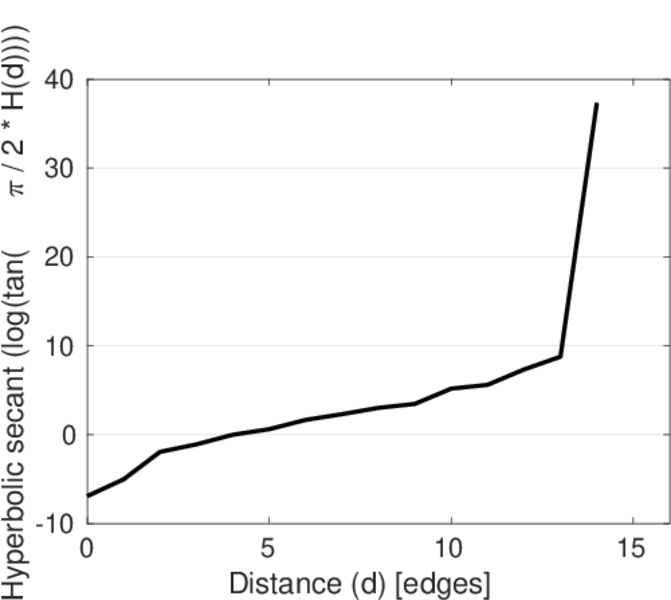
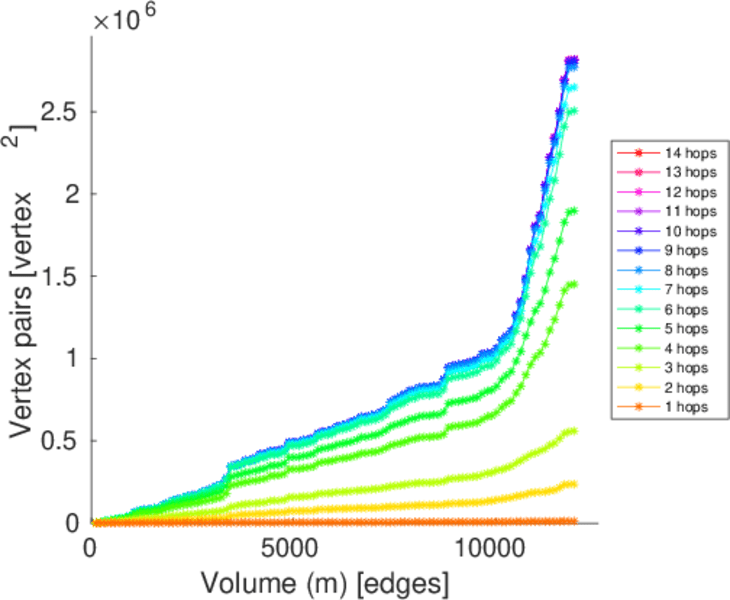
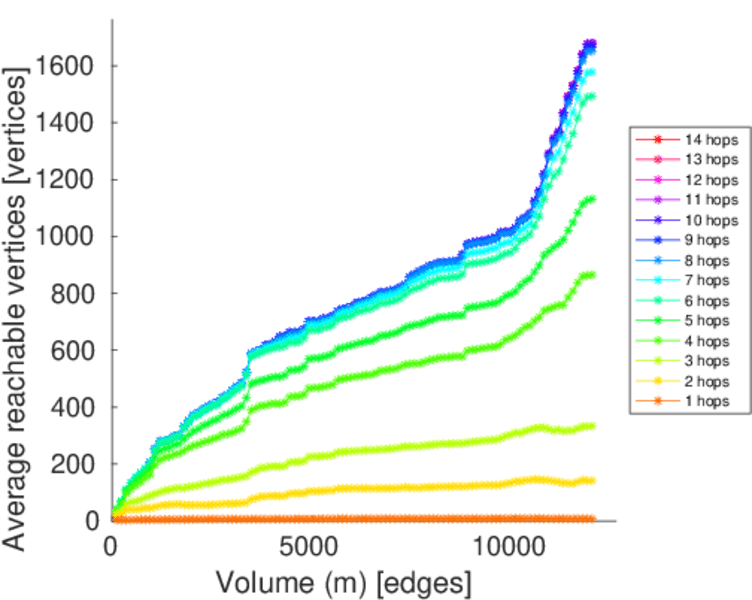
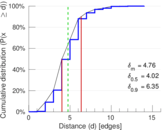
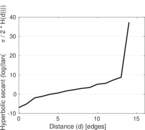
| Diameter | δ = | 14
|
| 50-Percentile effective diameter | δ0.5 = | 4.022 47
|
| 90-Percentile effective diameter | δ0.9 = | 6.353 56
|
| Median distance | δM = | 5
|
| Mean distance | δm = | 4.761 60
|
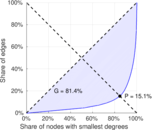
| Gini coefficient | G = | 0.811 388
|
| Balanced inequality ratio | P = | 0.157 083
|
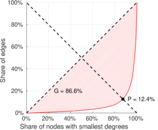
| Left balanced inequality ratio | P1 = | 0.124 308
|
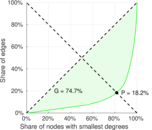
| Right balanced inequality ratio | P2 = | 0.181 894
|
| Relative edge distribution entropy | Her = | 0.833 413
|
| Power law exponent | γ = | 2.640 28
|
| Tail power law exponent | γt = | 1.961 00
|
| Tail power law exponent with p | γ3 = | 1.961 00
|
| p-value | p = | 0.000 00
|
| Left tail power law exponent with p | γ3,1 = | 1.731 00
|
| Left p-value | p1 = | 0.023 000 0
|
| Right tail power law exponent with p | γ3,2 = | 2.071 00
|
| Right p-value | p2 = | 0.000 00
|
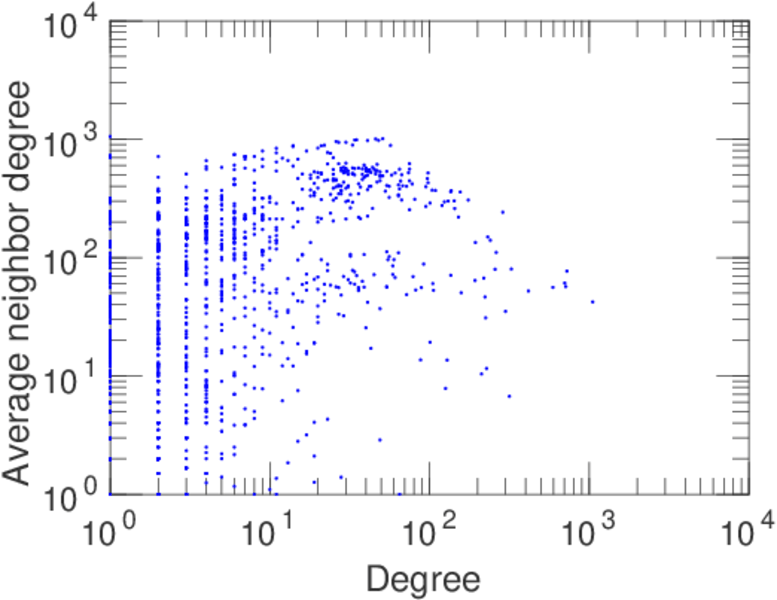
| Degree assortativity | ρ = | −0.098 886 1
|
| Degree assortativity p-value | pρ = | 1.489 99 × 10−12
|
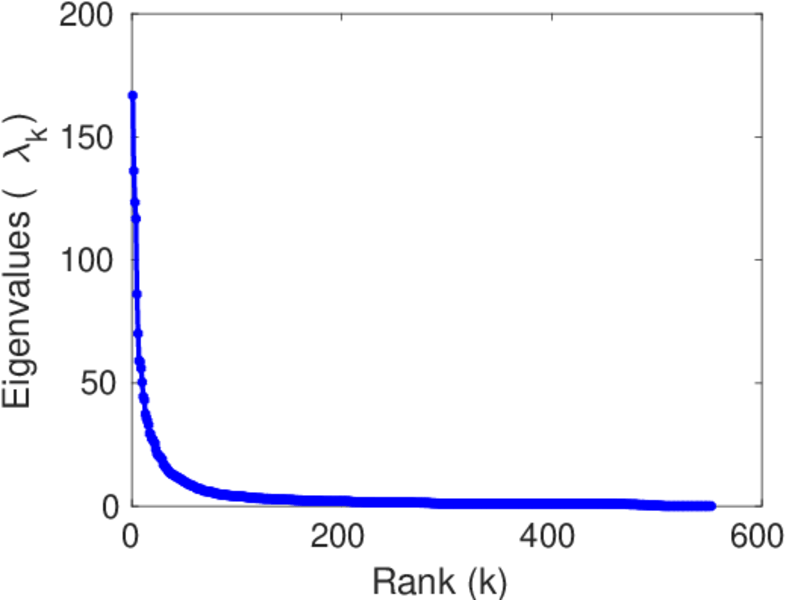
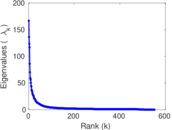
| Spectral norm | α = | 166.763
|
| Algebraic connectivity | a = | 0.014 783 6
|
| Spectral separation | |λ1[A] / λ2[A]| = | 1.225 14
|
| Controllability | C = | 1,197
|
| Relative controllability | Cr = | 0.541 874
|
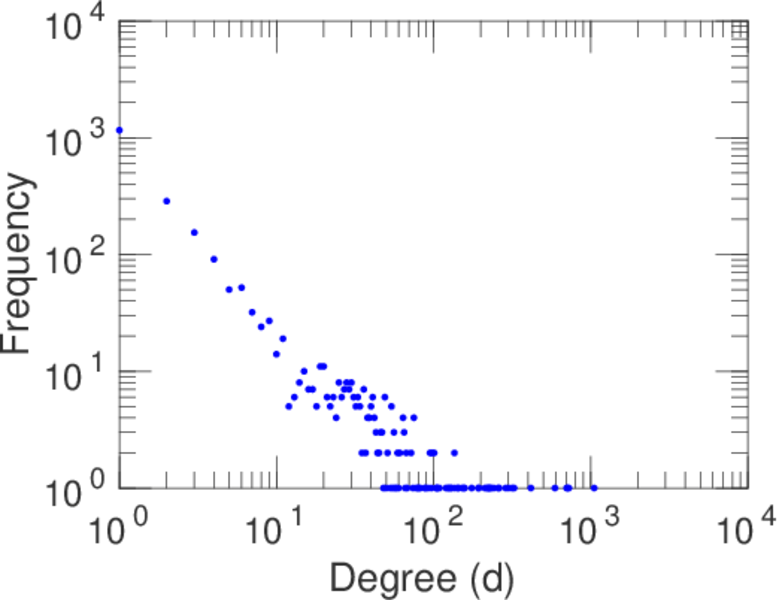
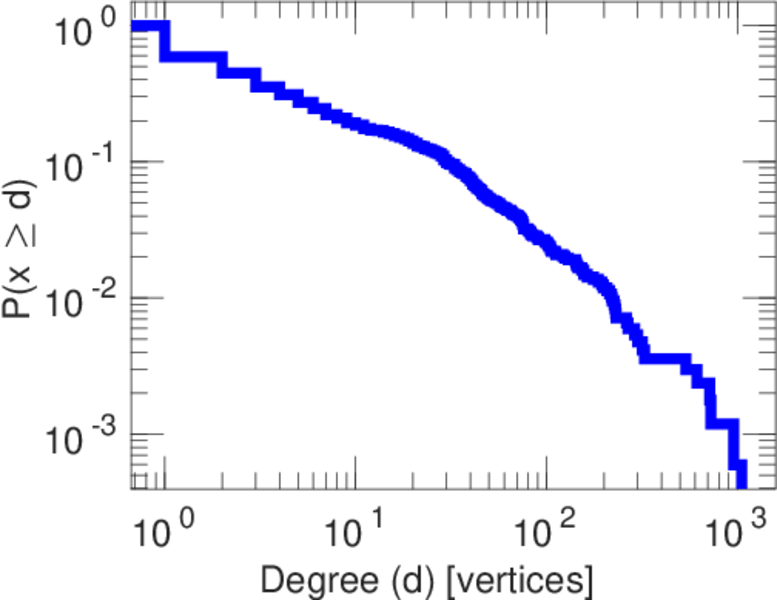
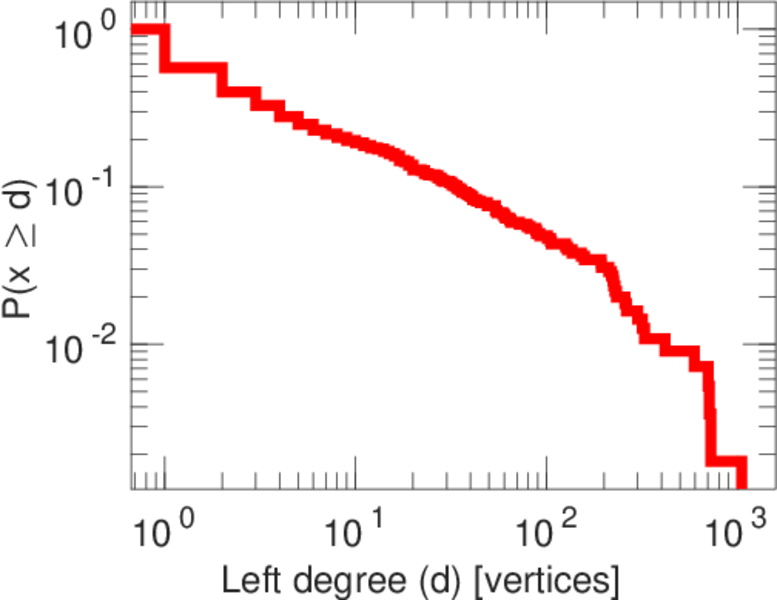
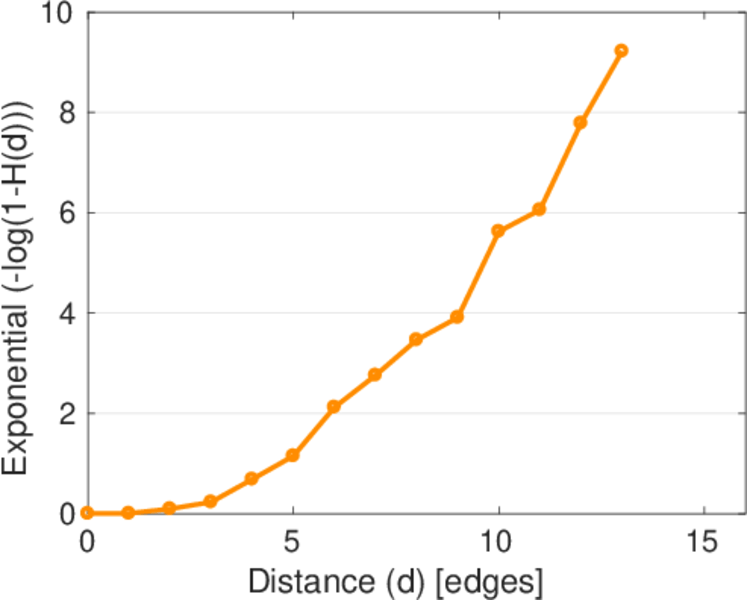
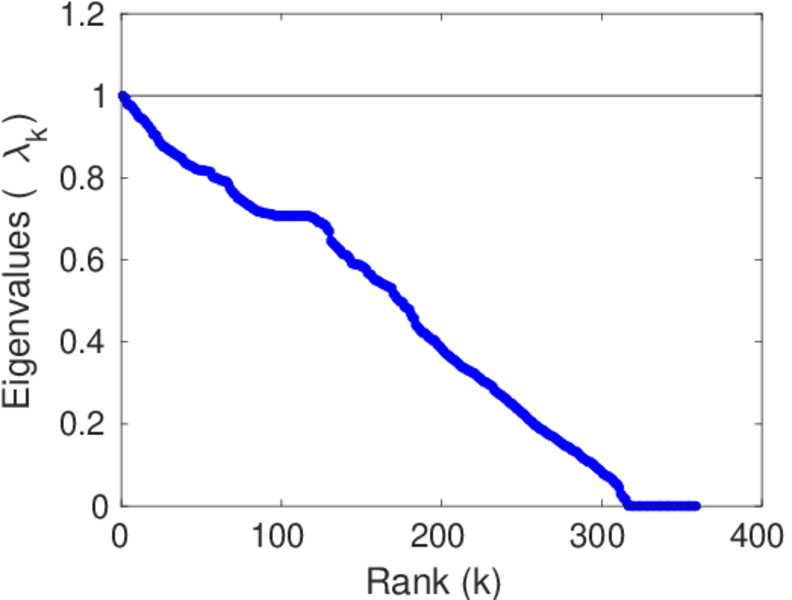
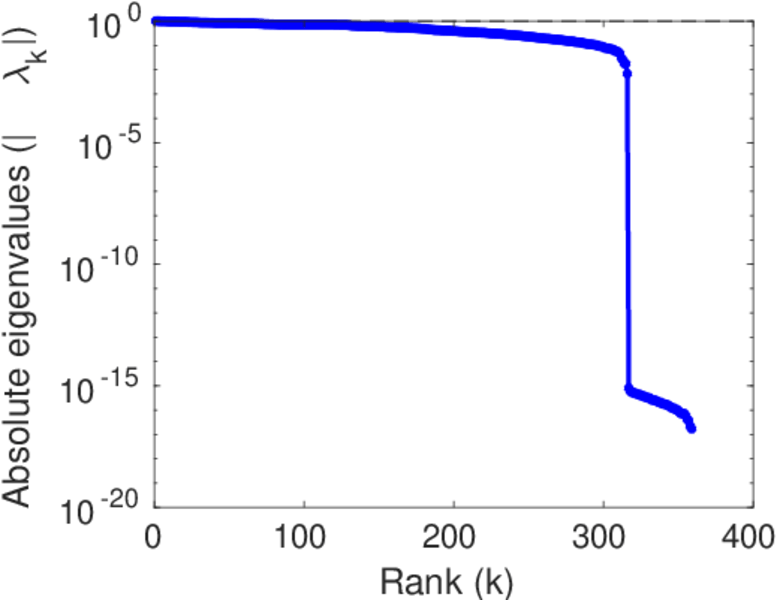
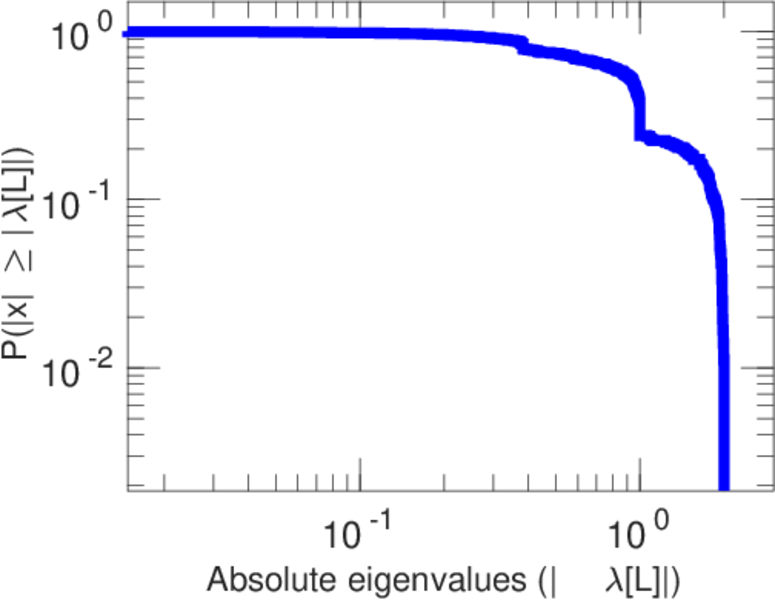
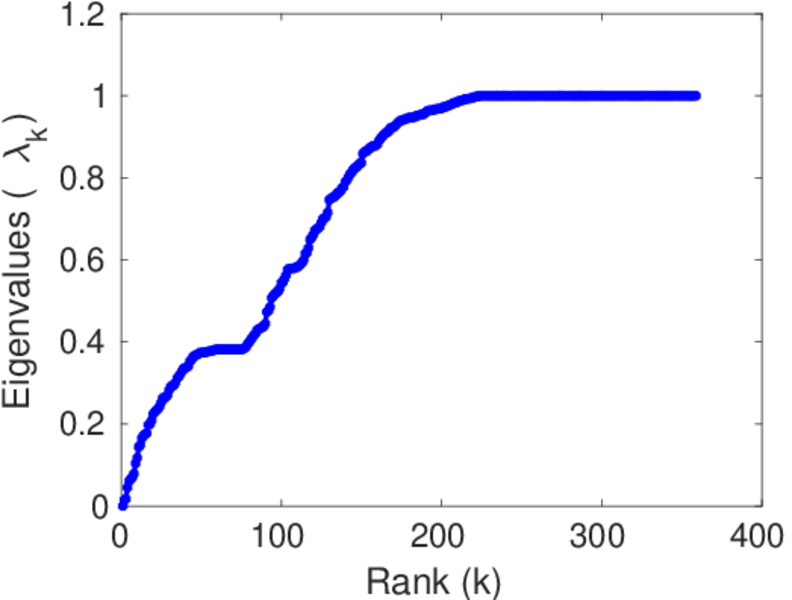
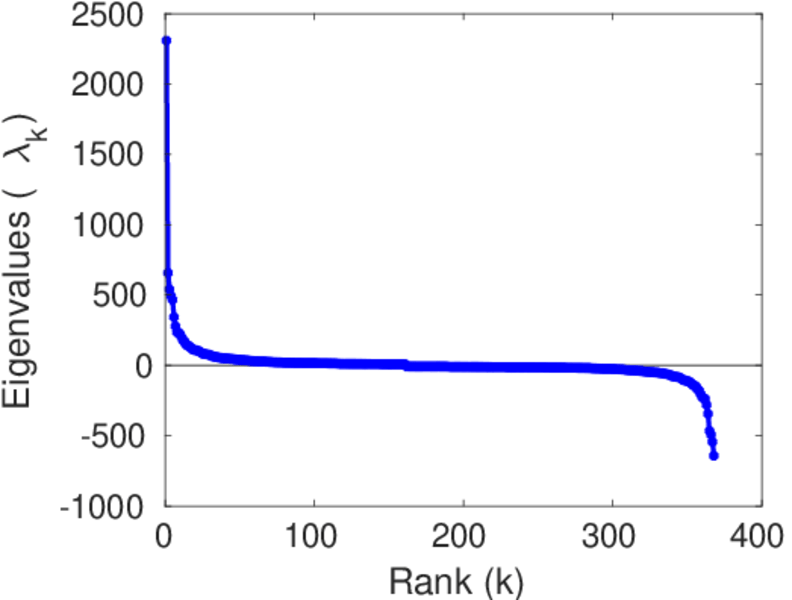
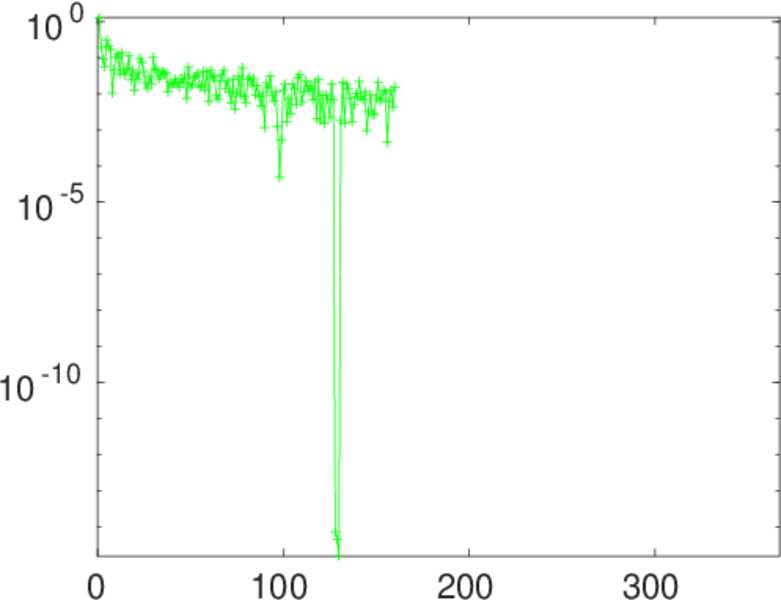
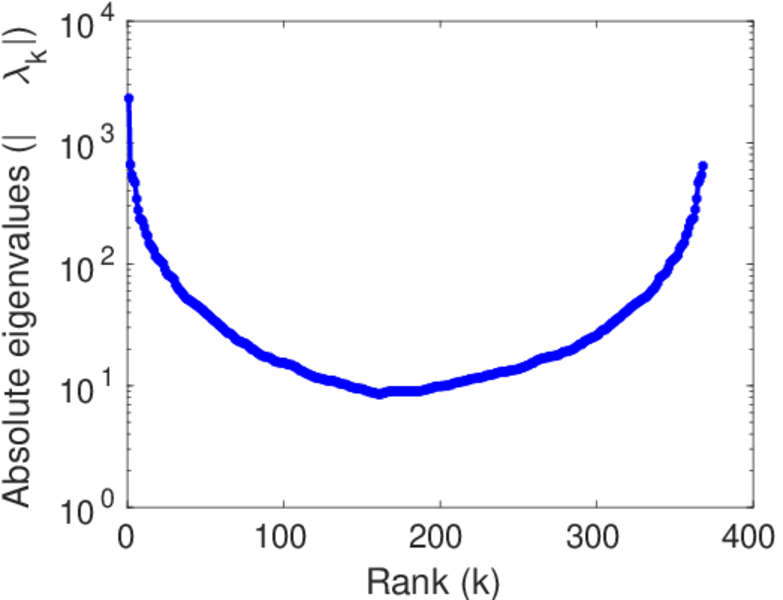
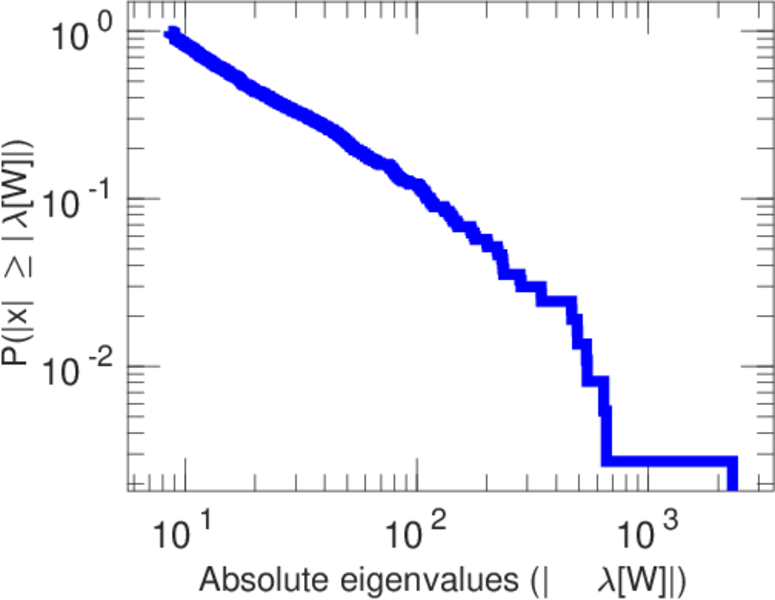
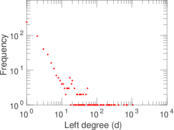
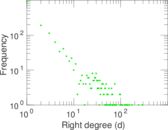
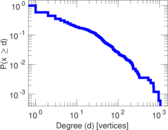
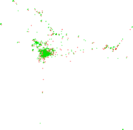
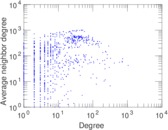
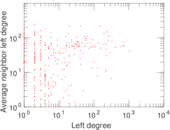
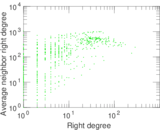
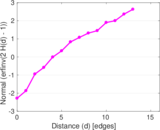
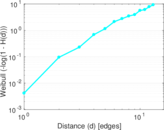
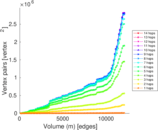
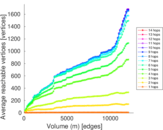
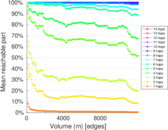
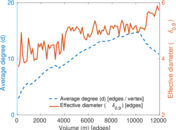
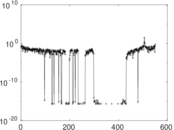
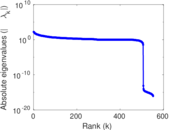
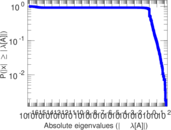
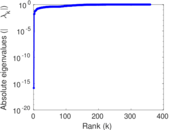
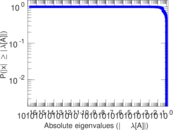
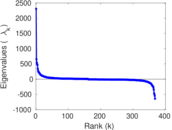
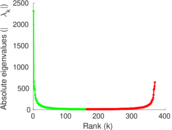
Plots


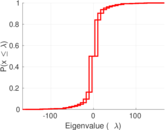
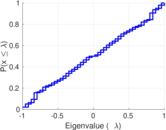
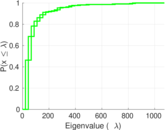
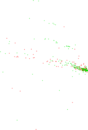


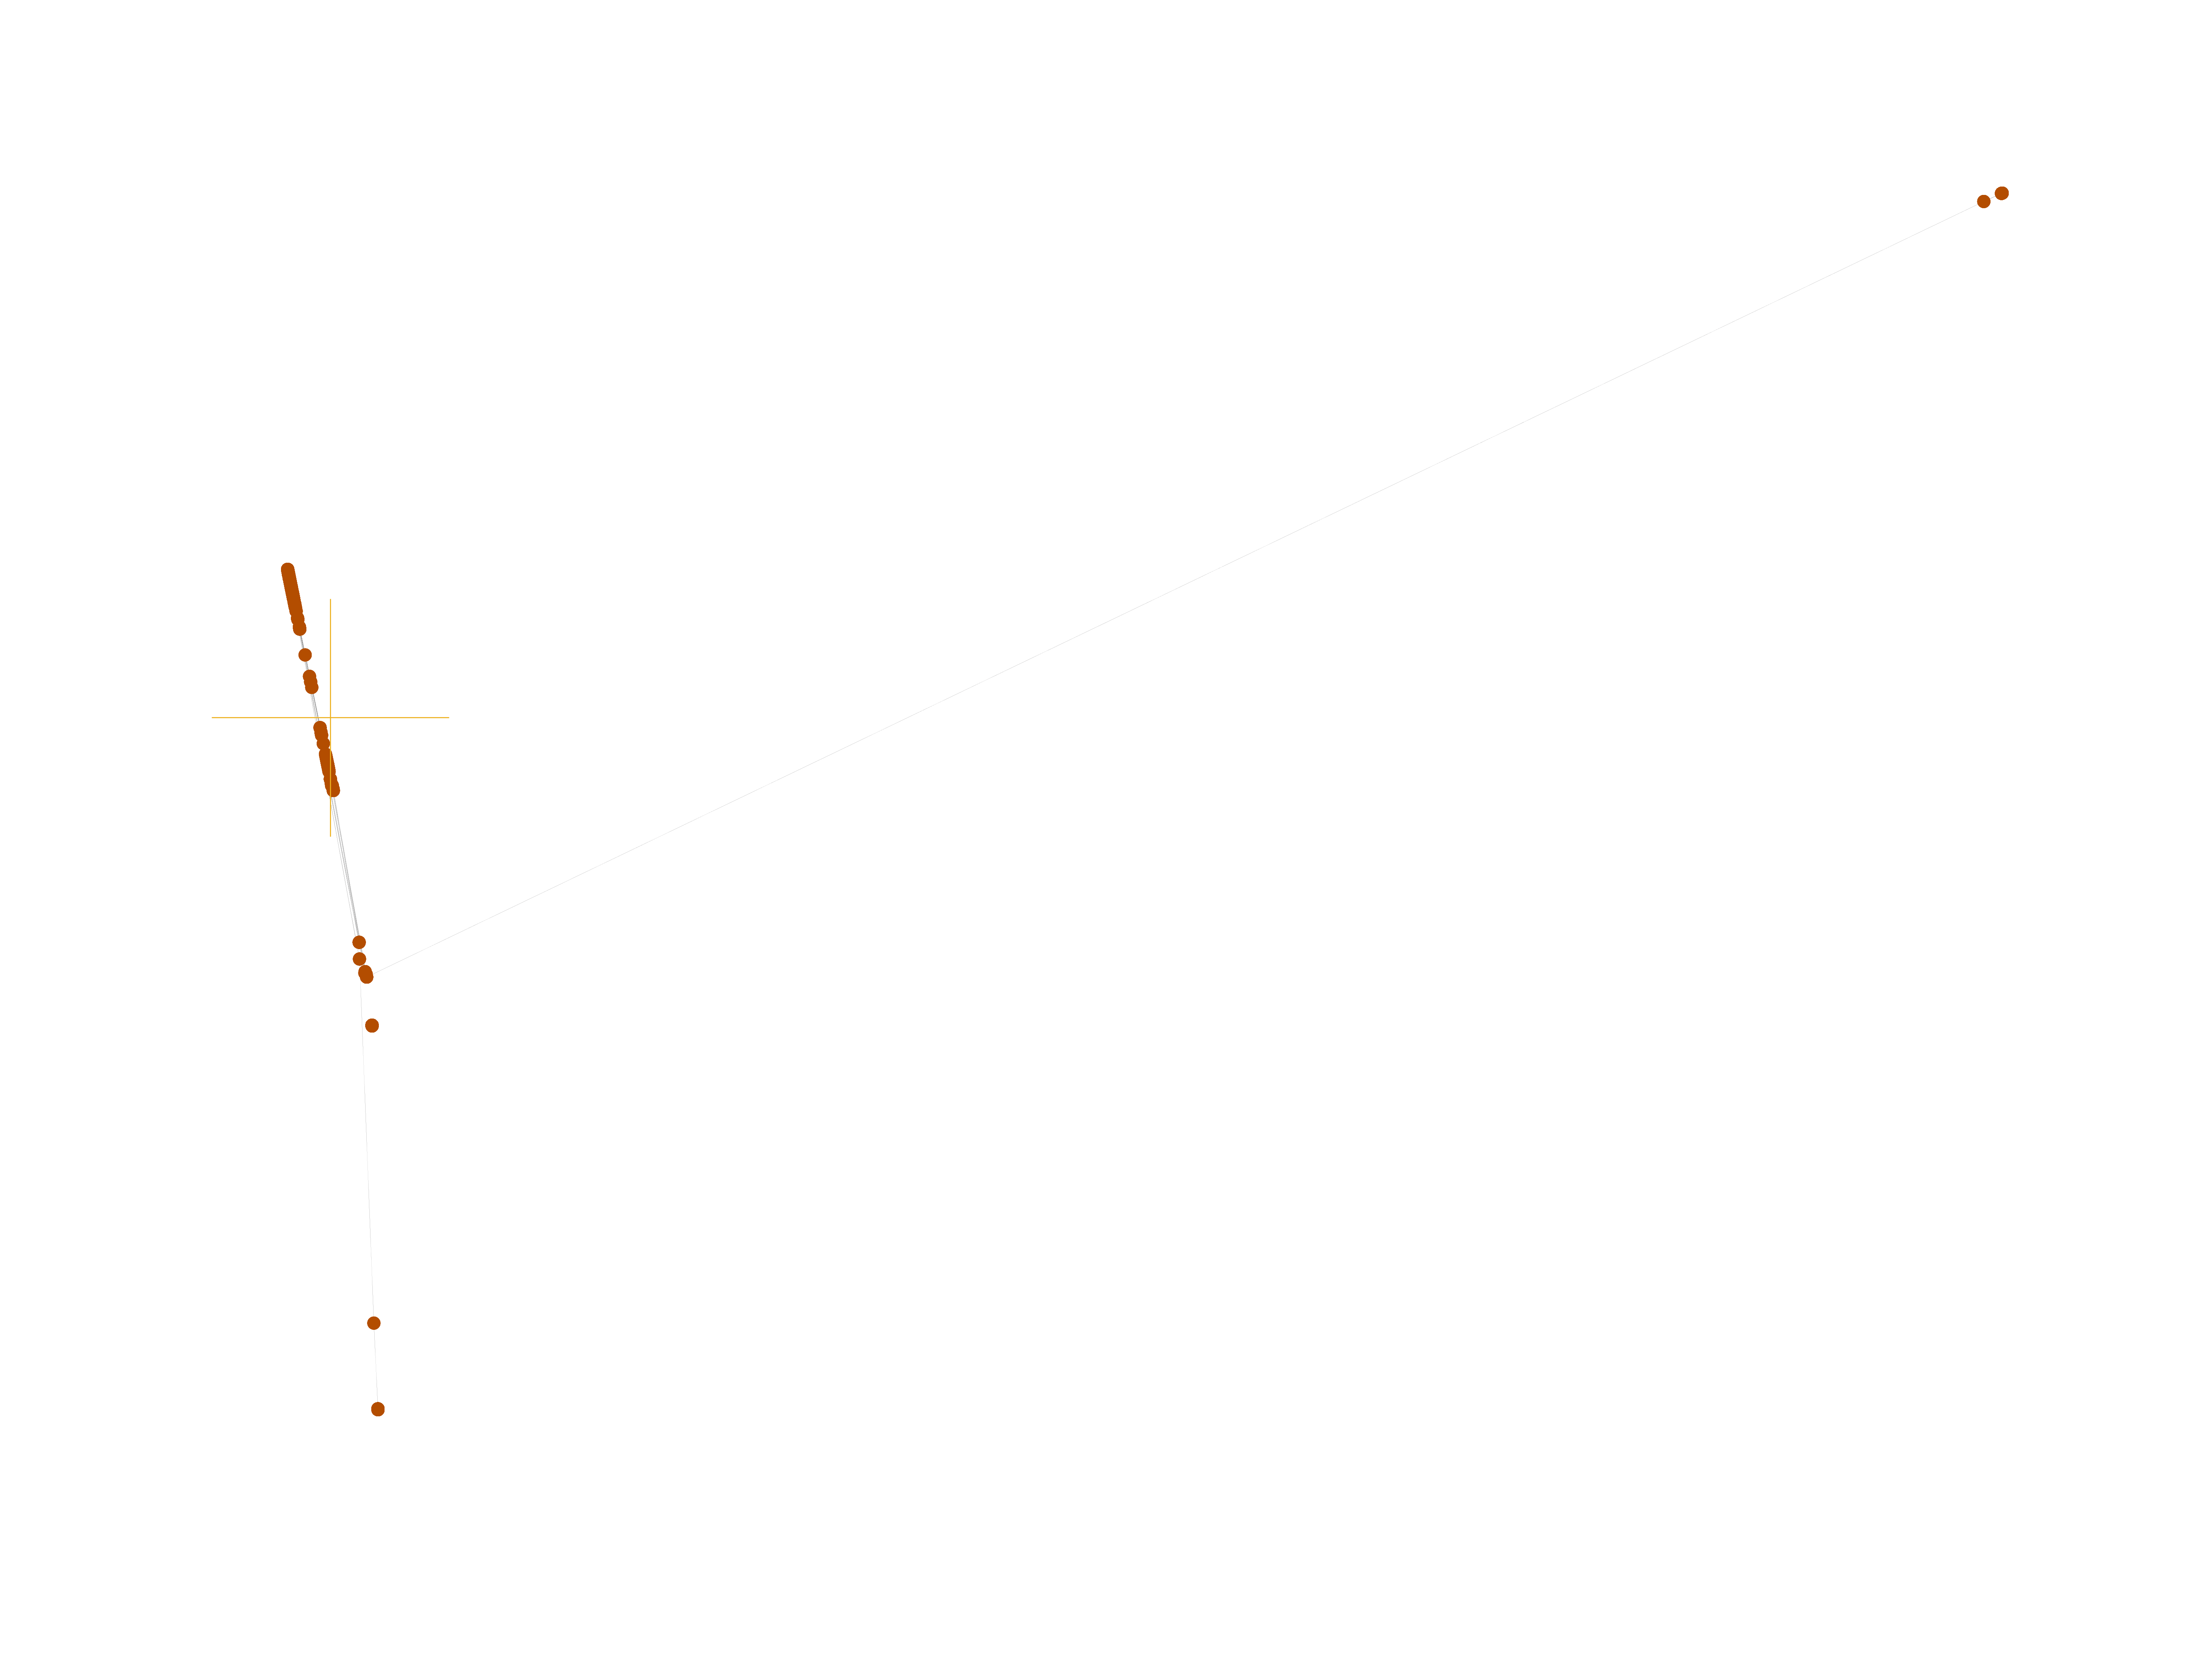
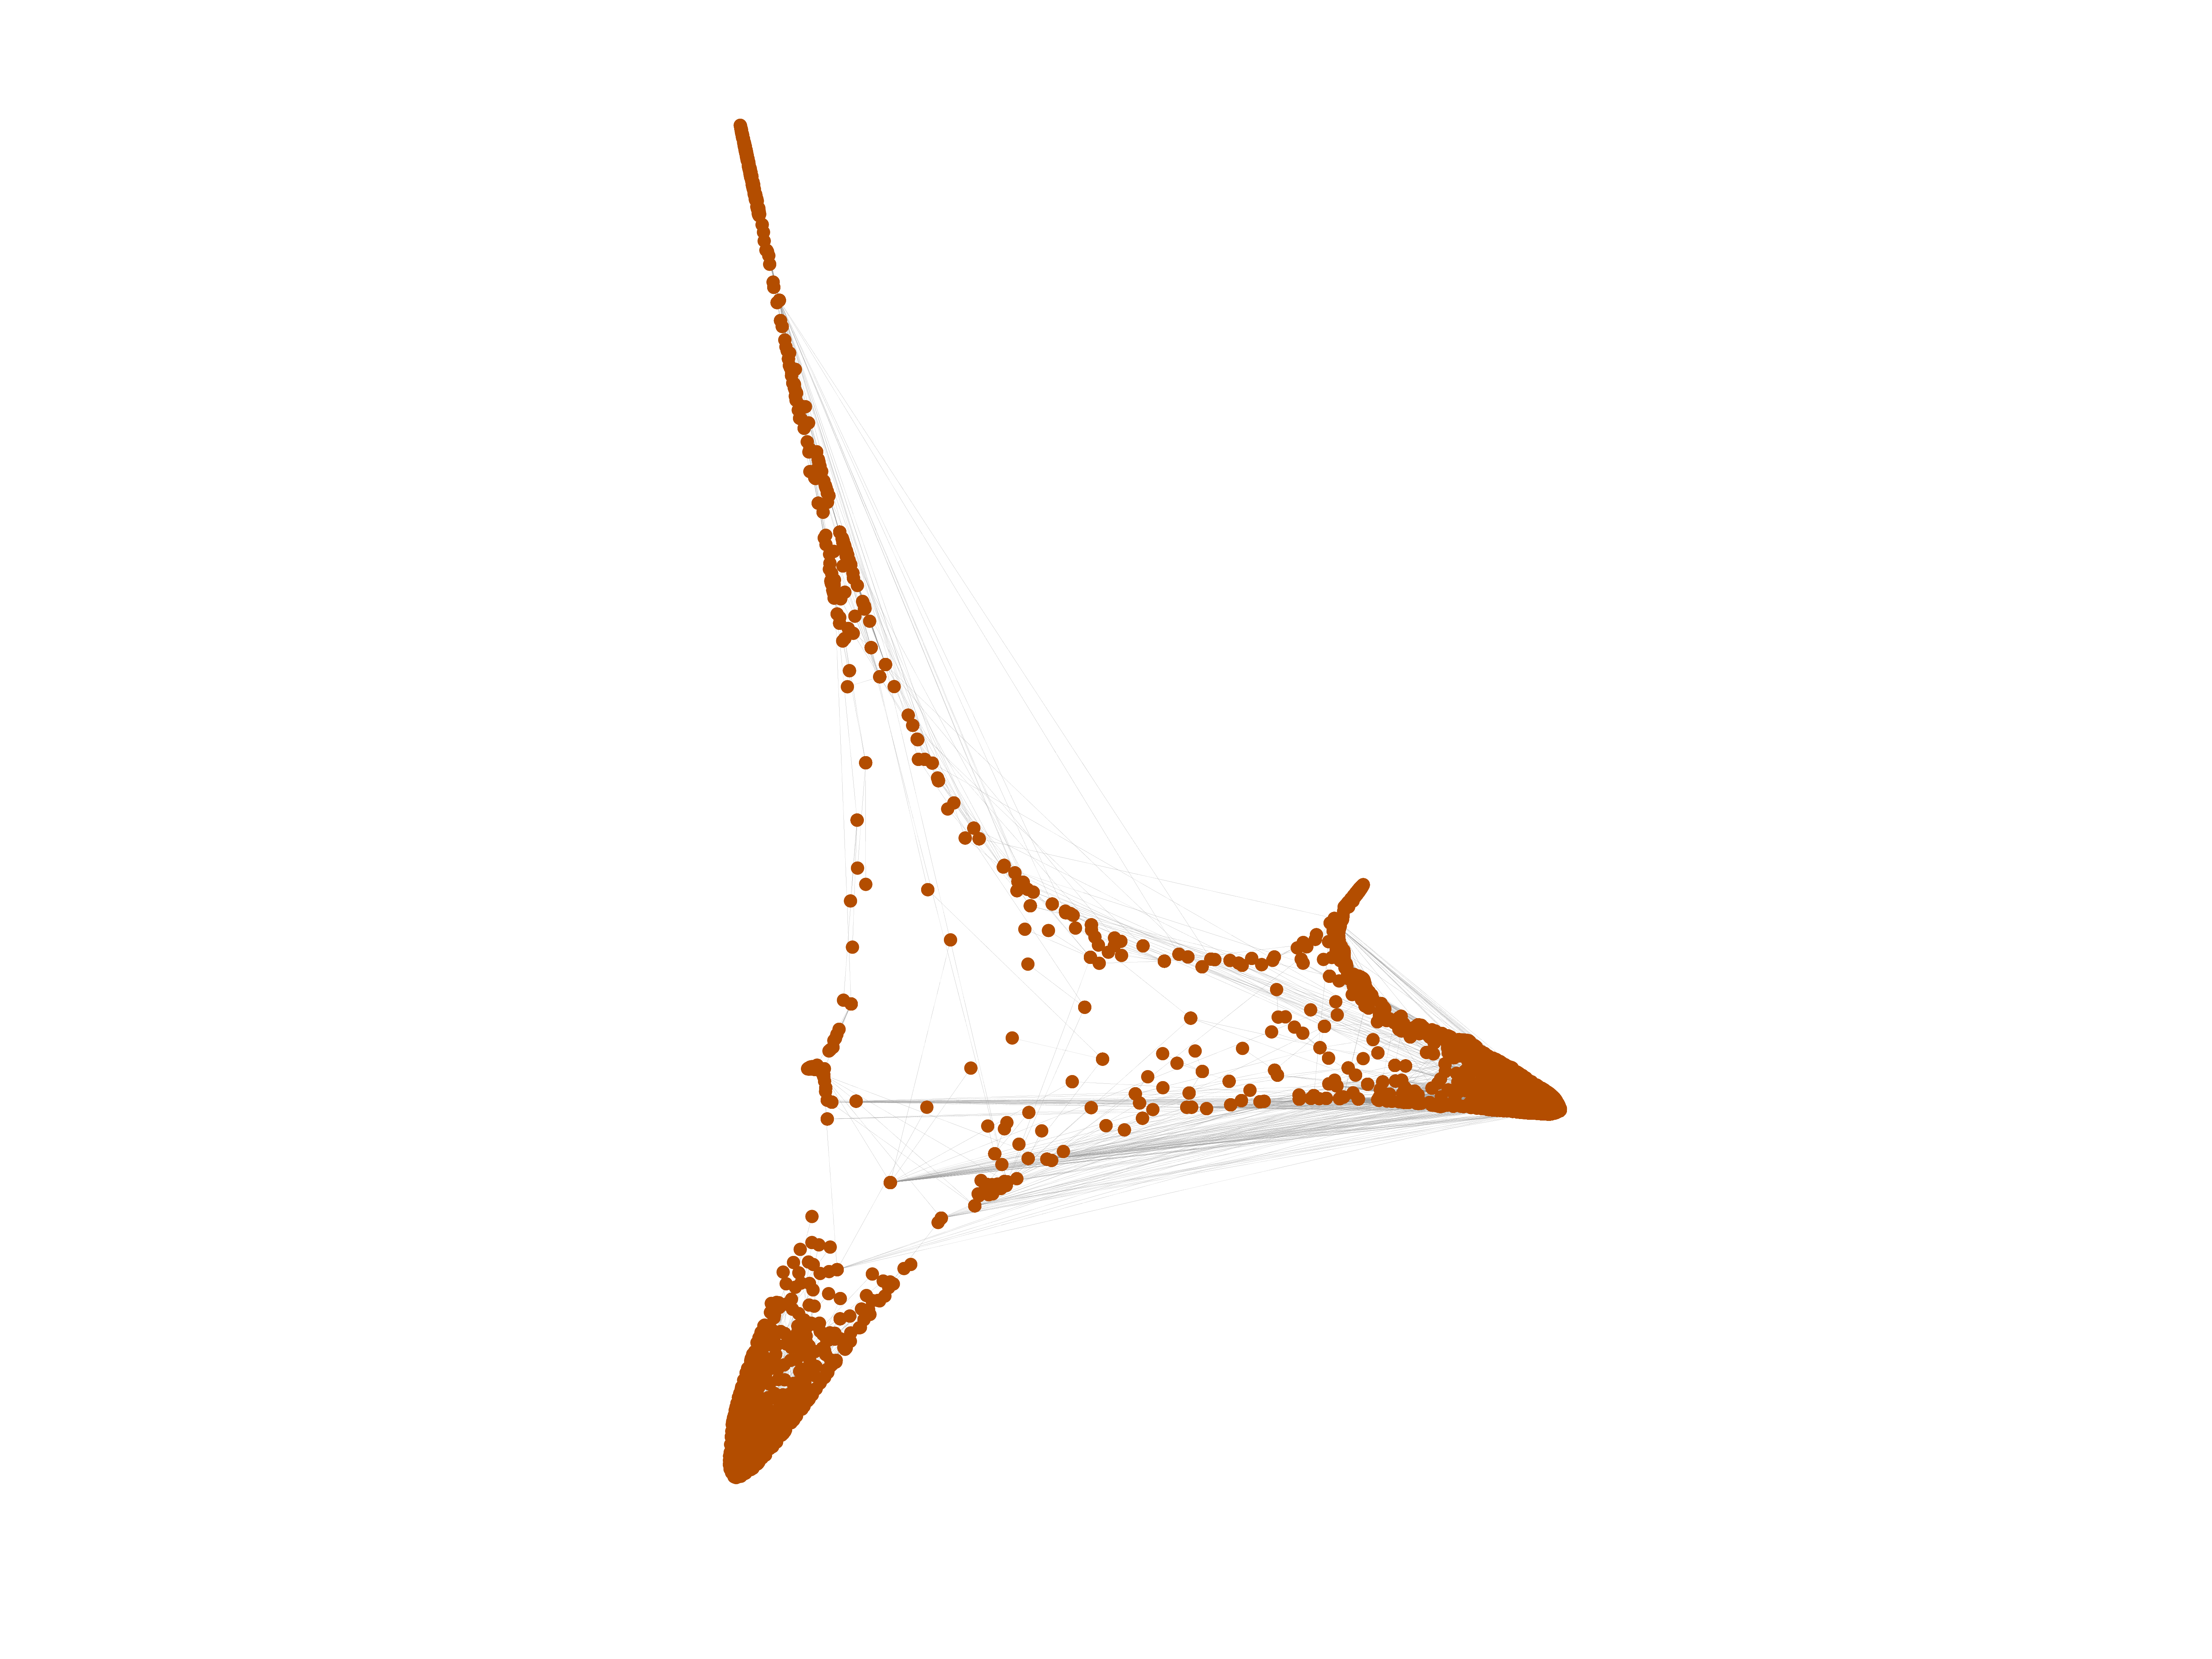
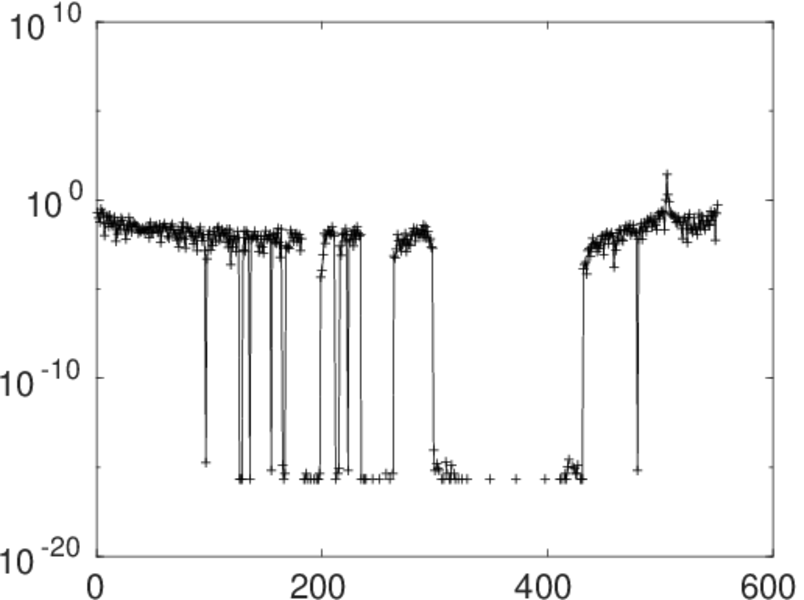
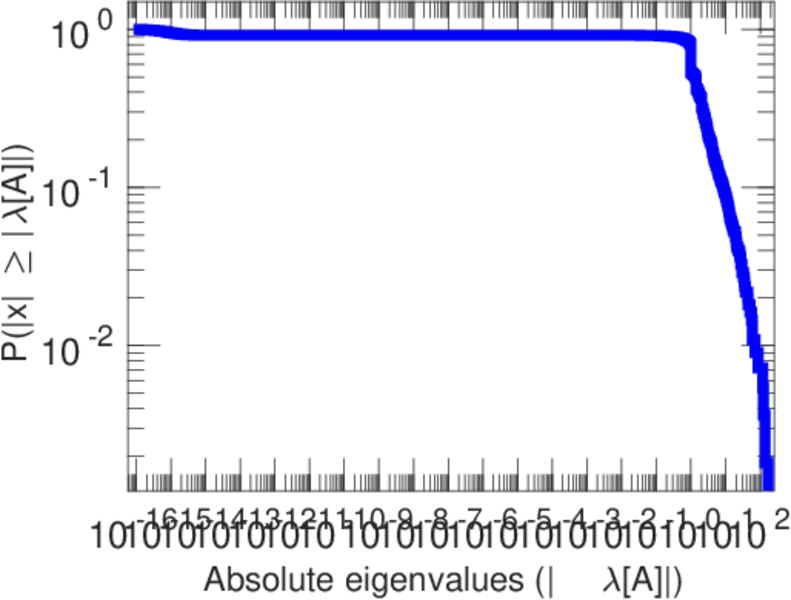
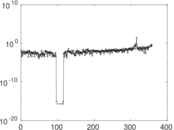
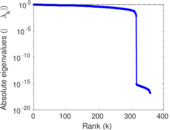
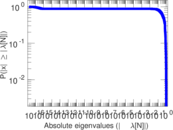
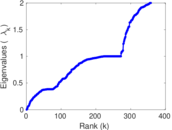
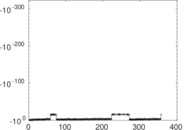
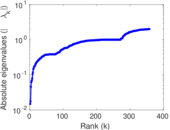
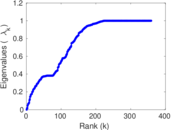
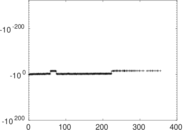
Matrix decompositions plots


Downloads
References
|
[1]
|
Jérôme Kunegis.
KONECT – The Koblenz Network Collection.
In Proc. Int. Conf. on World Wide Web Companion, pages
1343–1350, 2013.
[ http ]
|
|
[2]
|
Wikimedia Foundation.
Wikimedia downloads.
http://dumps.wikimedia.org/, January 2010.
|
 KONECT ‣ Networks ‣
Buy Me a Coffee
KONECT ‣ Networks ‣
Buy Me a Coffee