Wiktionary edits (oc)
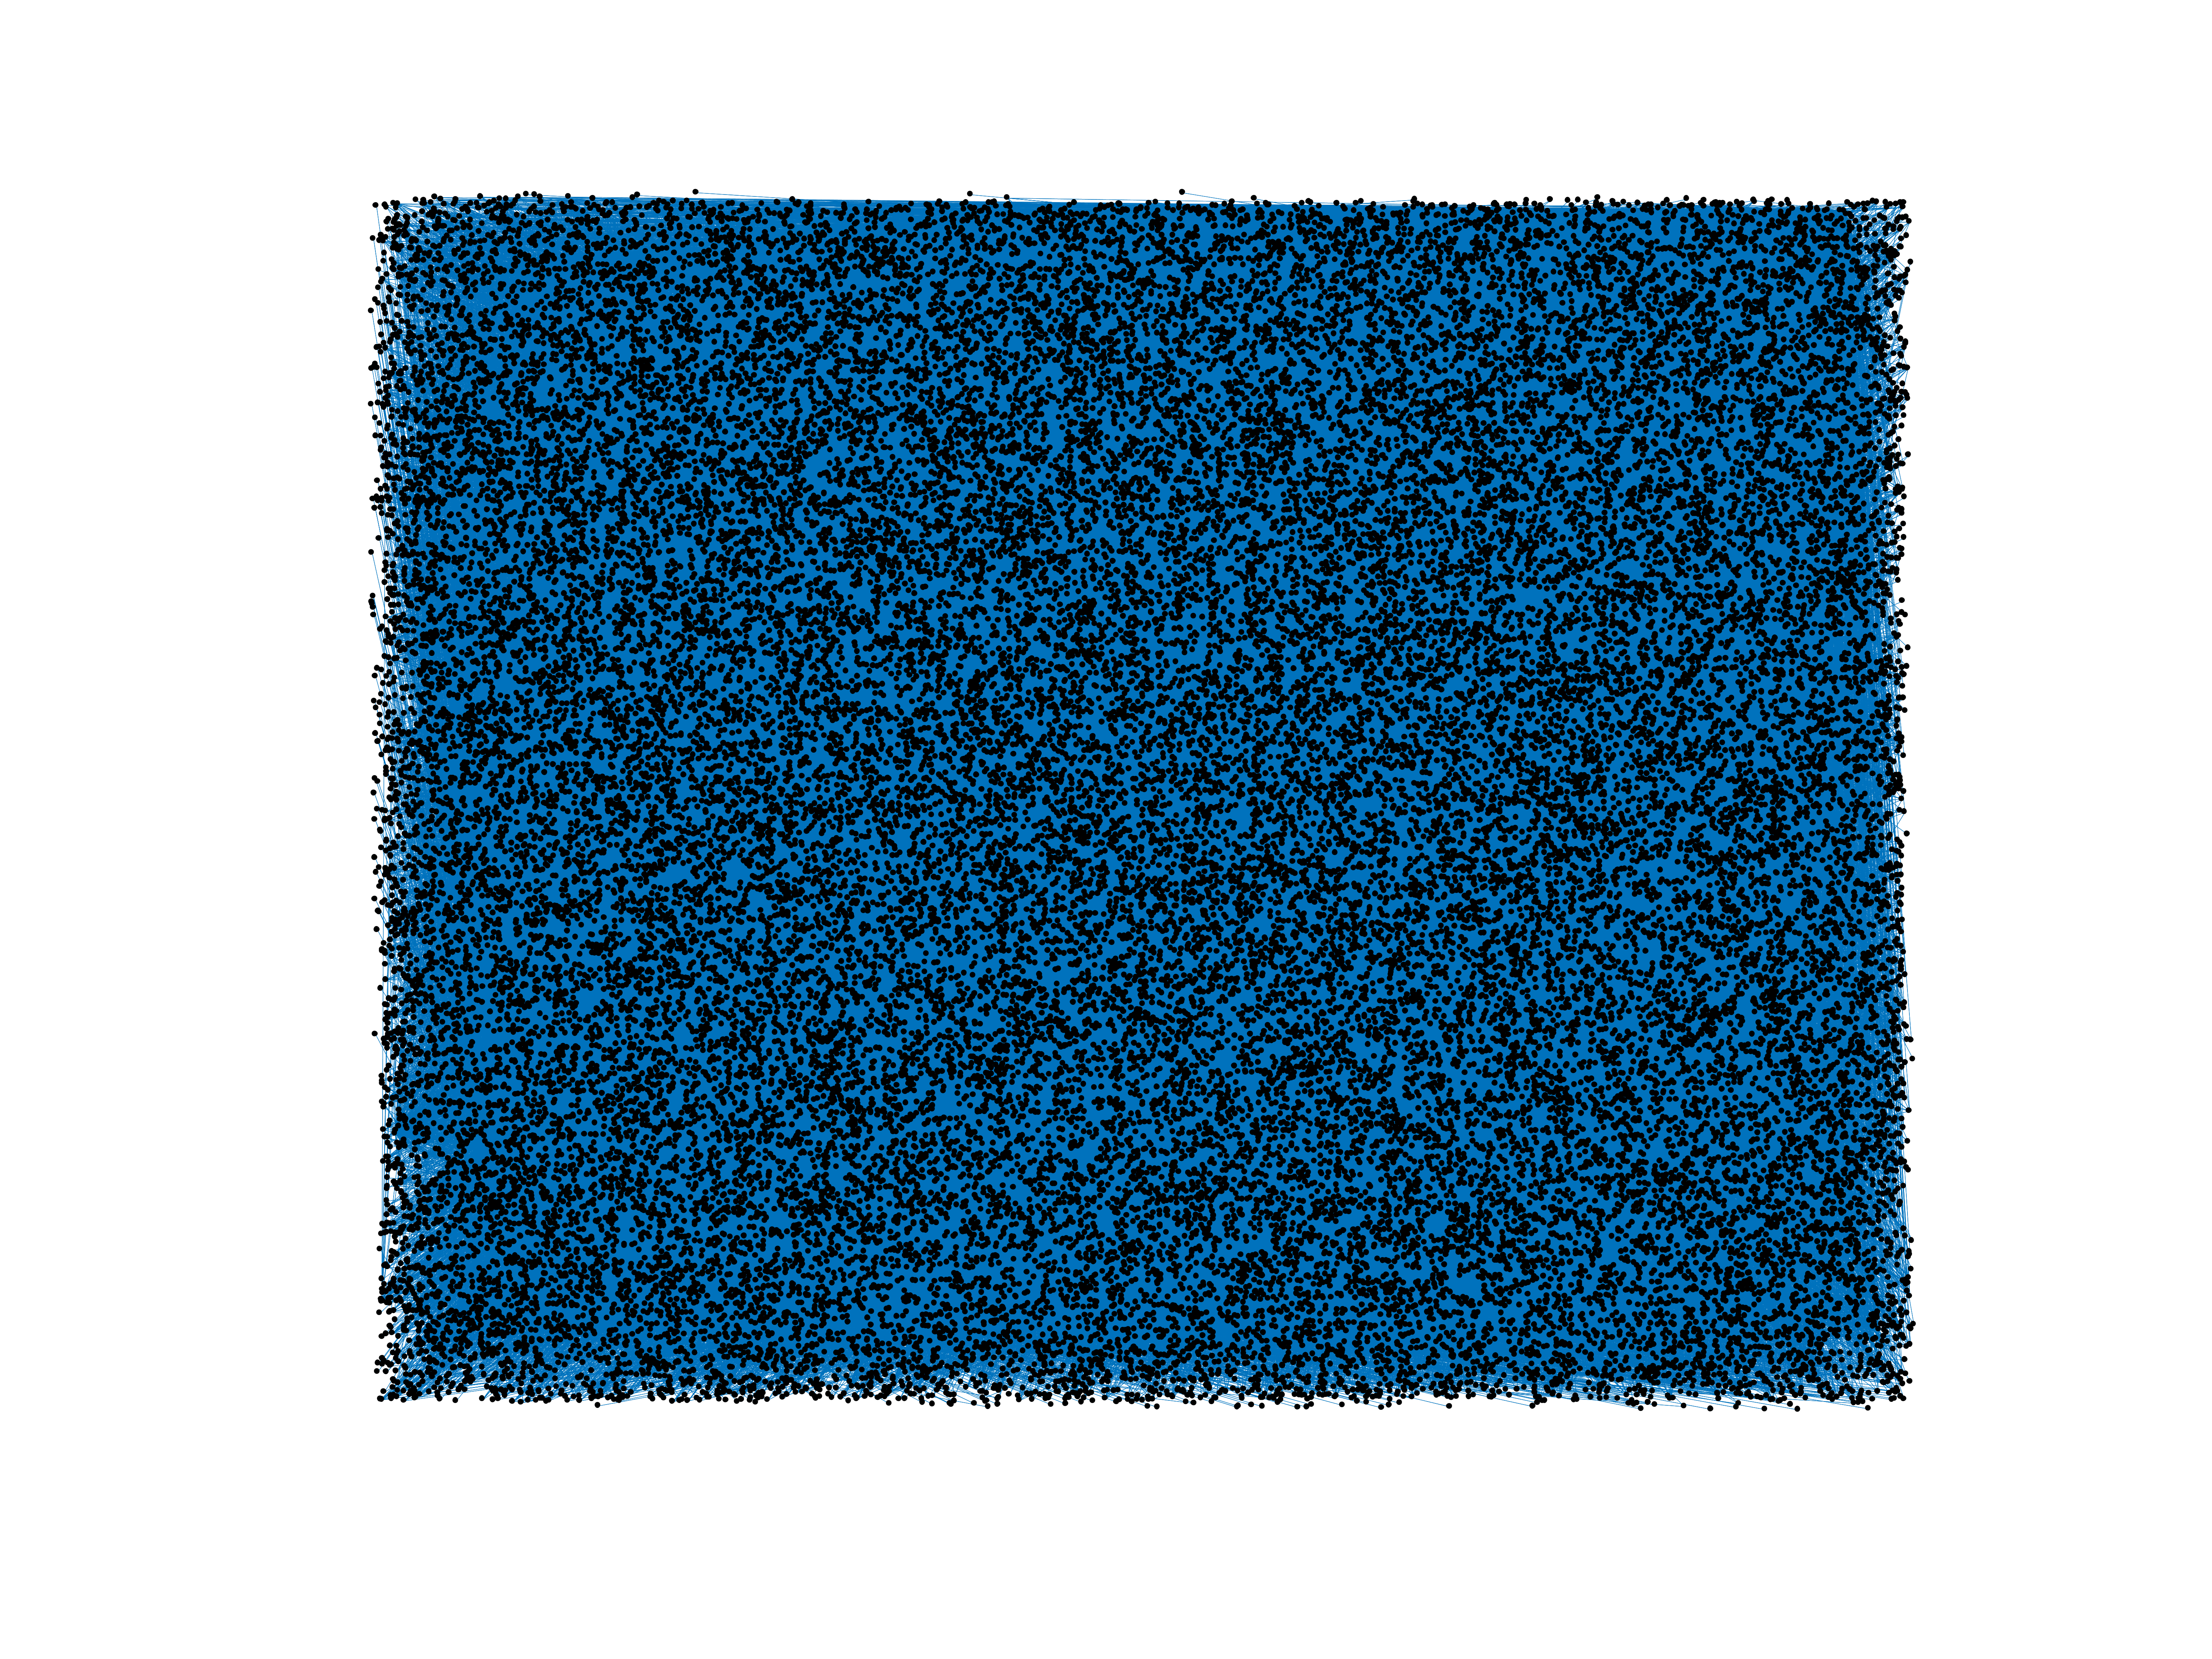
This is the bipartite edit network of the Occitan Wiktionary. It contains users
and pages from the Occitan Wiktionary, connected by edit events. Each edge
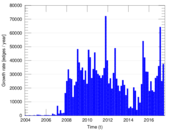
represents an edit. The dataset includes the timestamp of each edit.
Metadata
Statistics
| Size | n = | 45,224
|
| Left size | n1 = | 426
|
| Right size | n2 = | 44,798
|
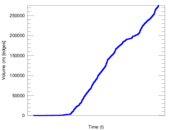
| Volume | m = | 275,469
|
| Unique edge count | m̿ = | 148,653
|
| Wedge count | s = | 797,546,209
|
| Claw count | z = | 3,828,180,204,354
|
| Cross count | x = | 15,436,567,238,503,784
|
| Square count | q = | 660,652,251
|
| 4-Tour count | T4 = | 8,475,705,582
|
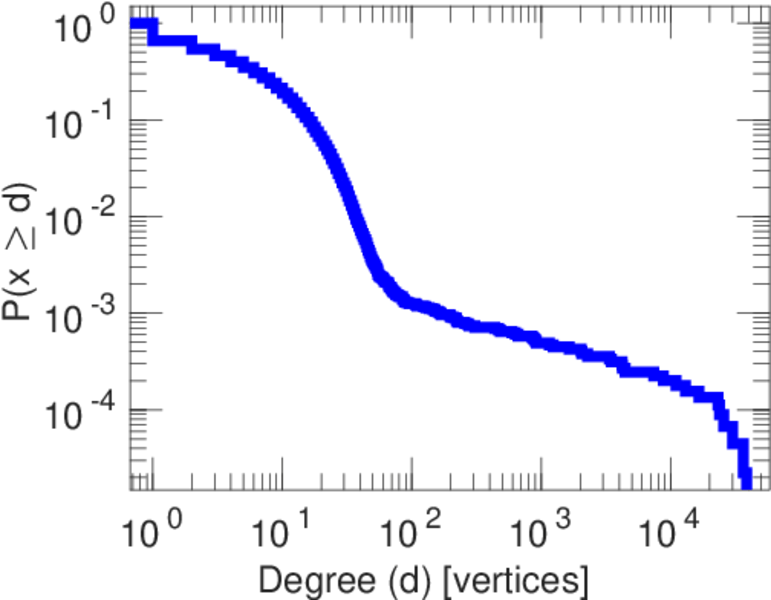
| Maximum degree | dmax = | 38,548
|
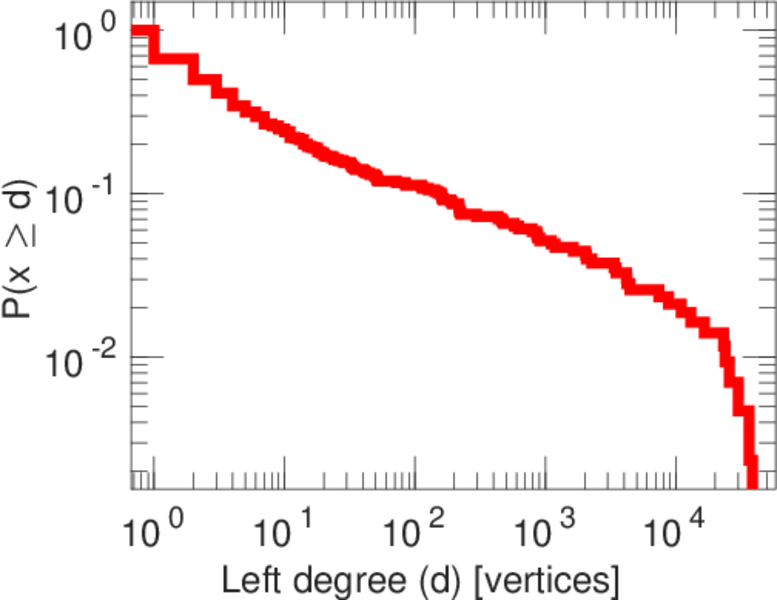
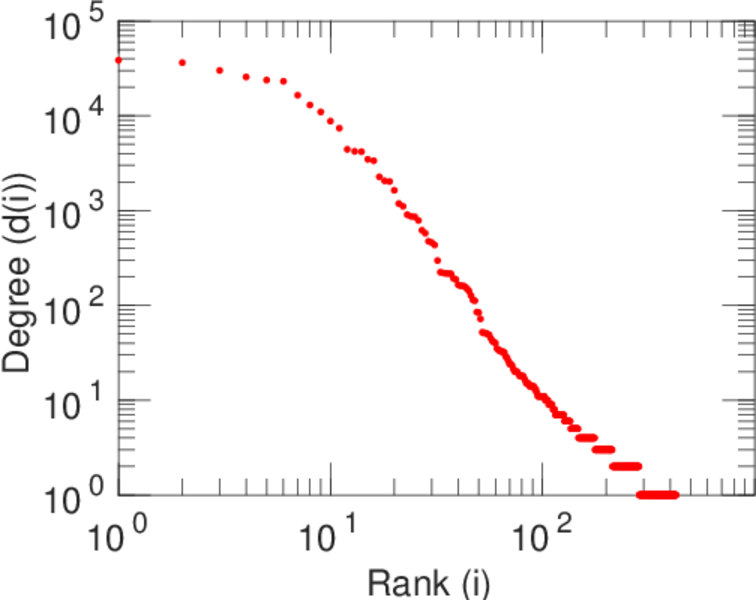
| Maximum left degree | d1max = | 38,548
|
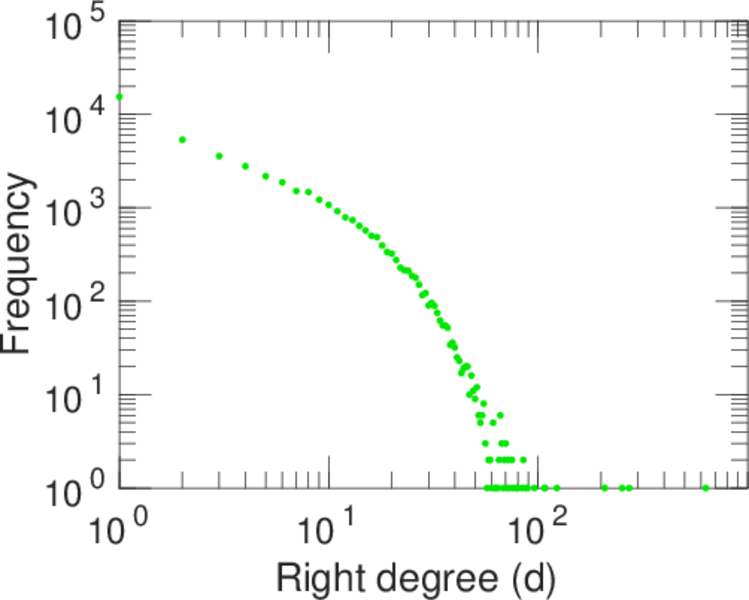
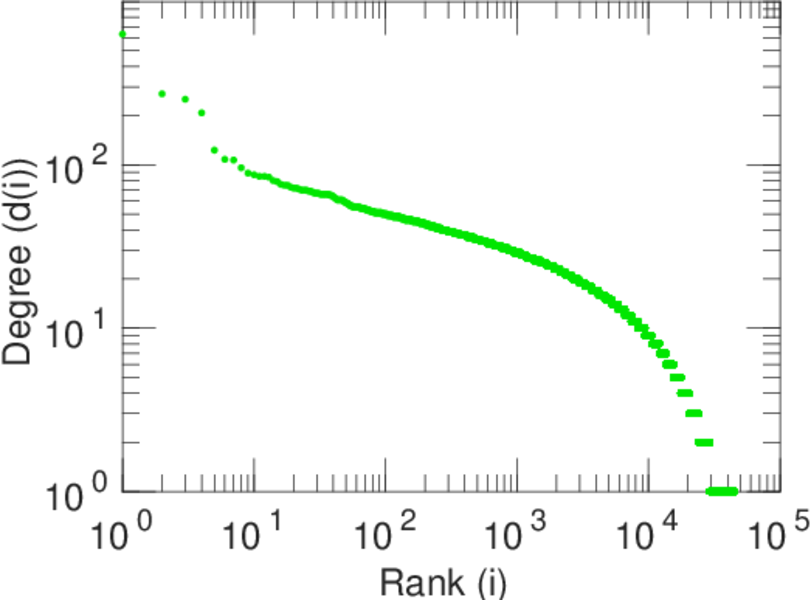
| Maximum right degree | d2max = | 632
|
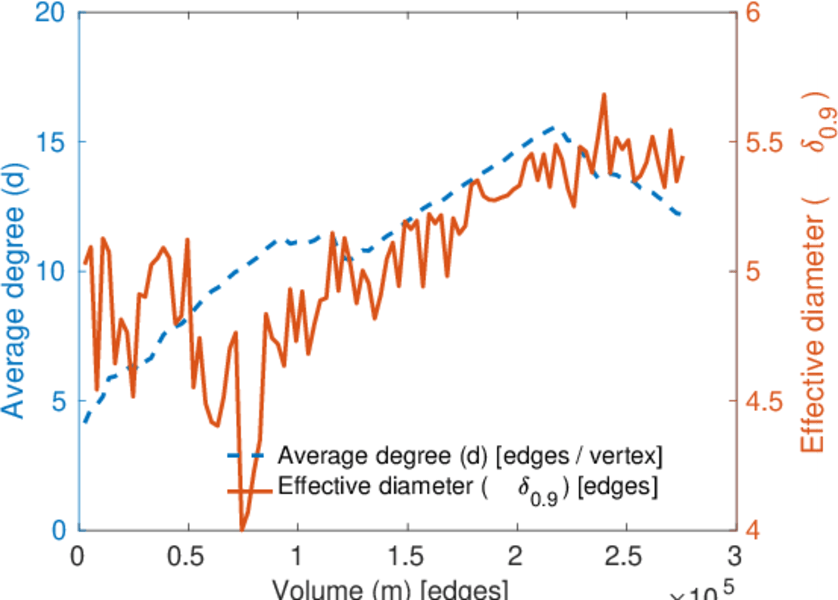
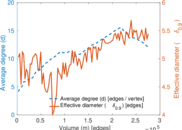
| Average degree | d = | 12.182 4
|
| Average left degree | d1 = | 646.641
|
| Average right degree | d2 = | 6.149 14
|
| Fill | p = | 0.007 789 43
|
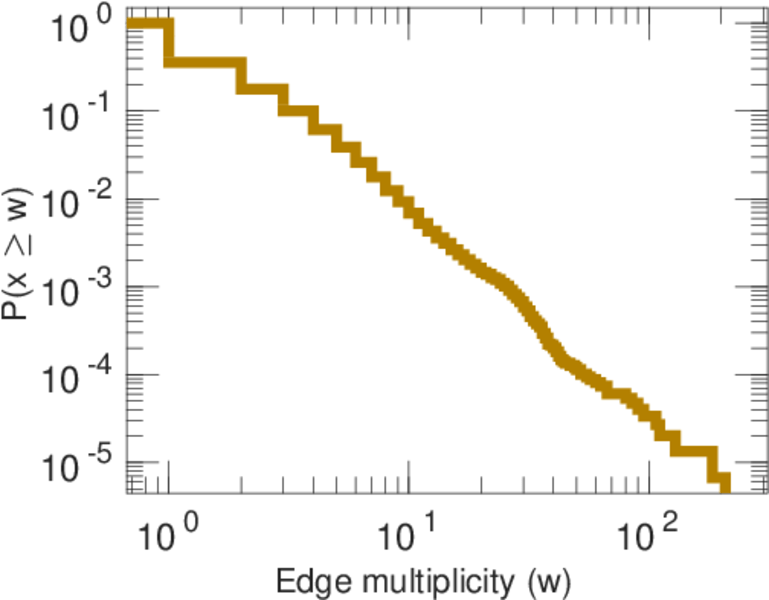
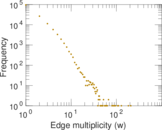
| Average edge multiplicity | m̃ = | 1.853 10
|
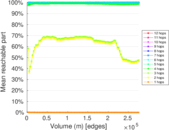
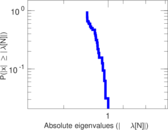
| Size of LCC | N = | 44,974
|
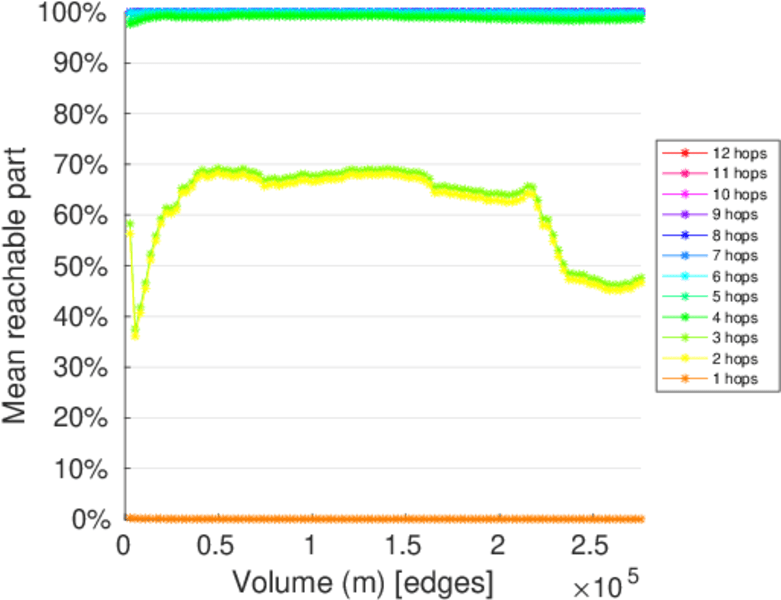
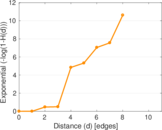
| Diameter | δ = | 12
|
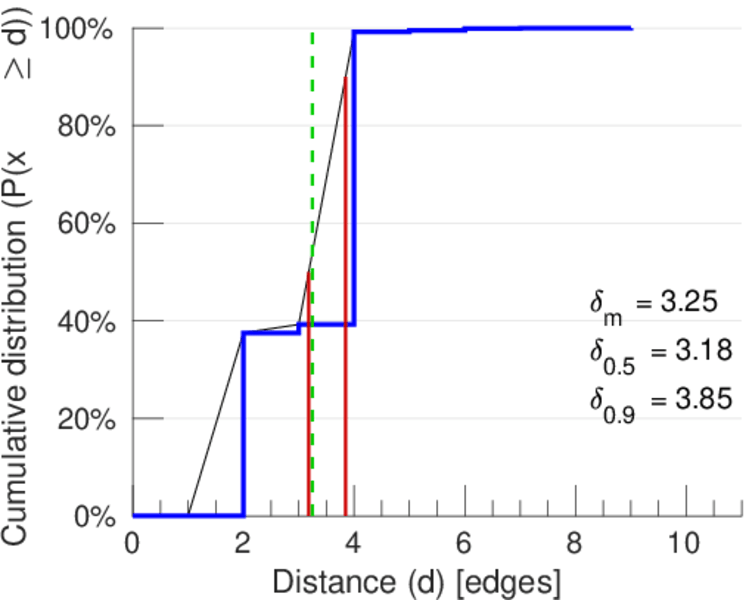
| 50-Percentile effective diameter | δ0.5 = | 3.179 47
|
| 90-Percentile effective diameter | δ0.9 = | 3.846 40
|
| Median distance | δM = | 4
|
| Mean distance | δm = | 3.246 32
|
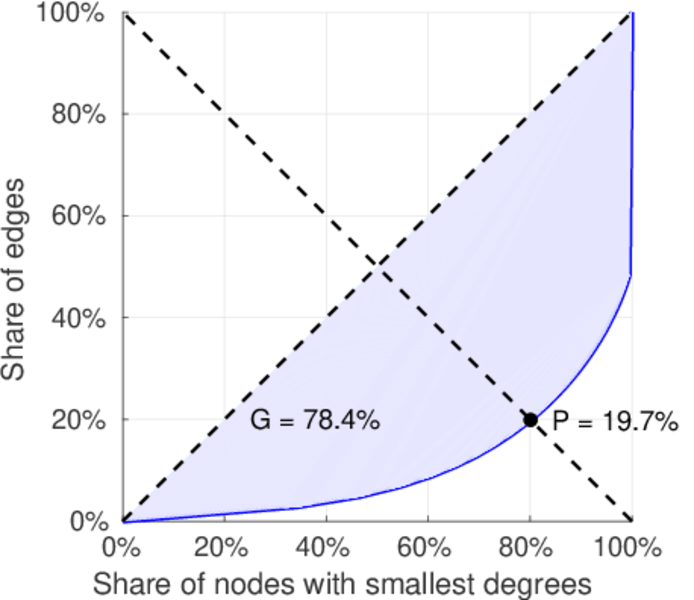
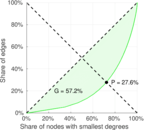
| Gini coefficient | G = | 0.784 124
|
| Balanced inequality ratio | P = | 0.197 354
|
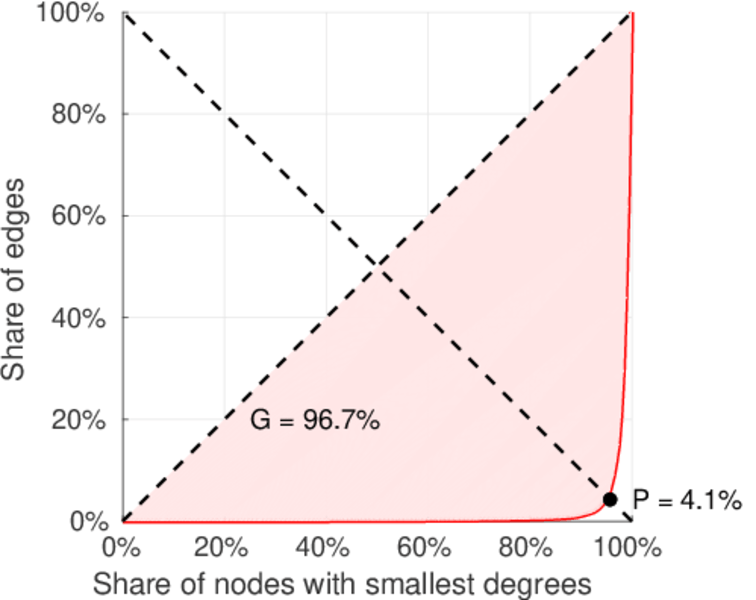
| Left balanced inequality ratio | P1 = | 0.041 122 6
|
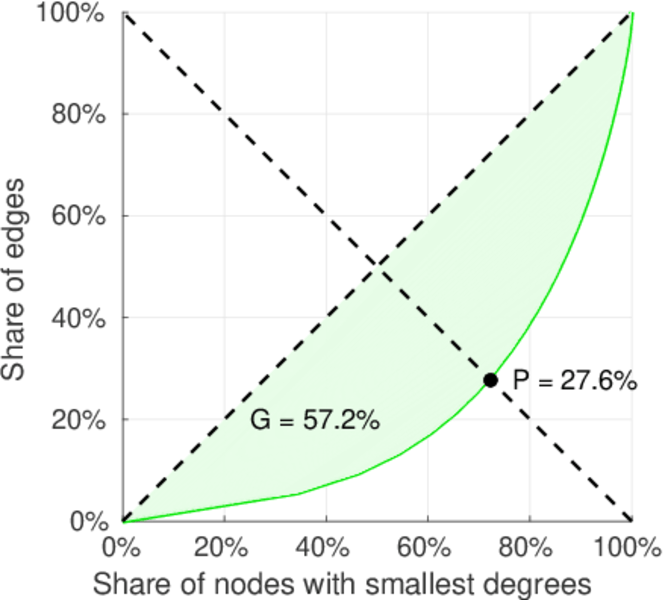
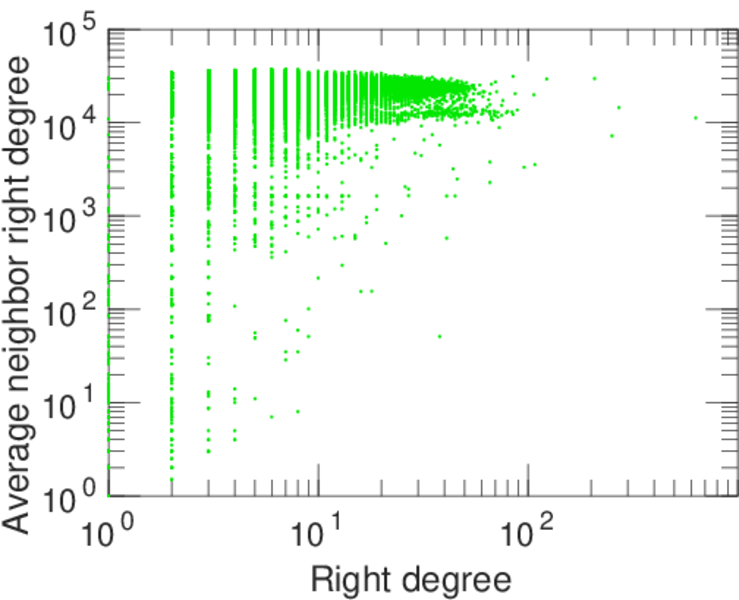
| Right balanced inequality ratio | P2 = | 0.275 585
|
| Relative edge distribution entropy | Her = | 0.688 187
|
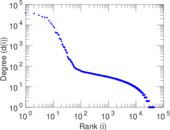
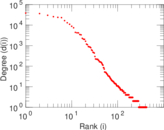
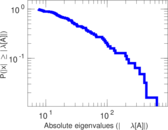
| Power law exponent | γ = | 2.182 58
|
| Tail power law exponent | γt = | 4.431 00
|
| Tail power law exponent with p | γ3 = | 4.431 00
|
| p-value | p = | 0.000 00
|
| Left tail power law exponent with p | γ3,1 = | 1.421 00
|
| Left p-value | p1 = | 0.104 000
|
| Right tail power law exponent with p | γ3,2 = | 8.601 00
|
| Right p-value | p2 = | 0.653 000
|
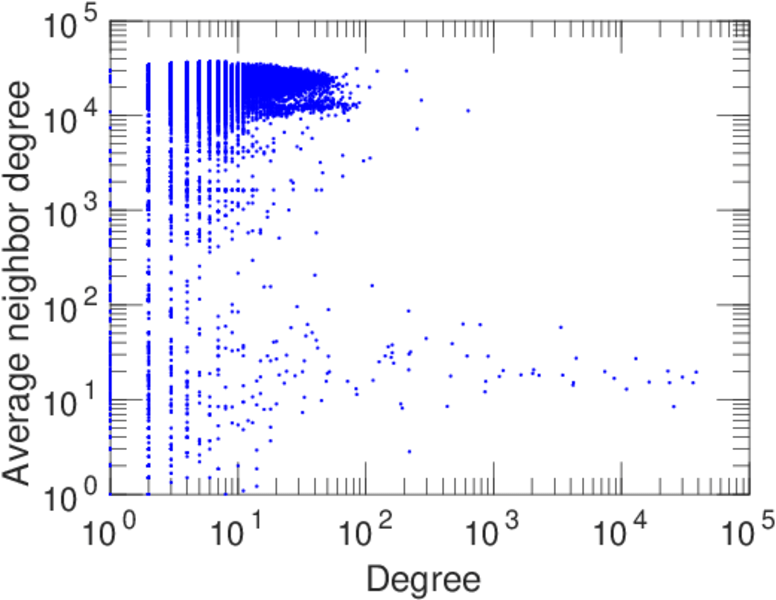
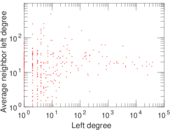
| Degree assortativity | ρ = | −0.351 011
|
| Degree assortativity p-value | pρ = | 0.000 00
|
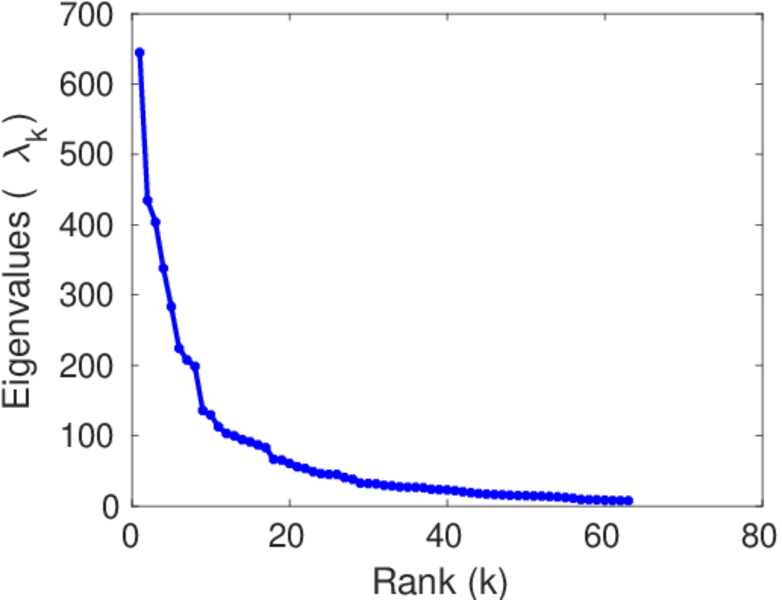
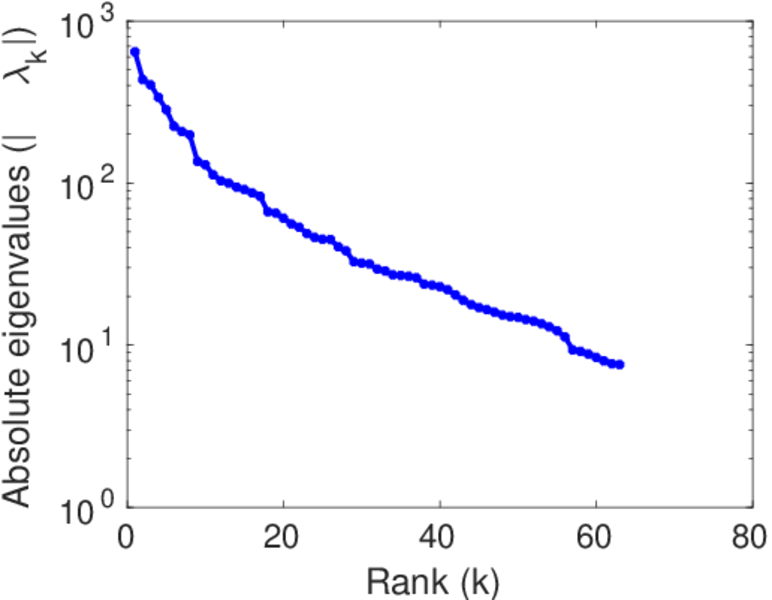
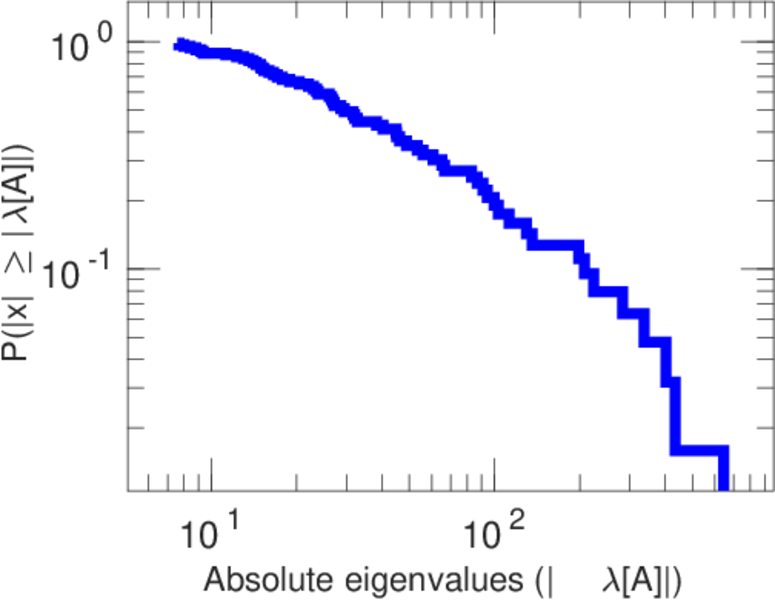
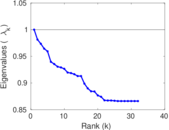
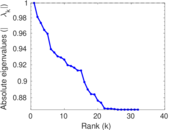
| Spectral norm | α = | 644.549
|
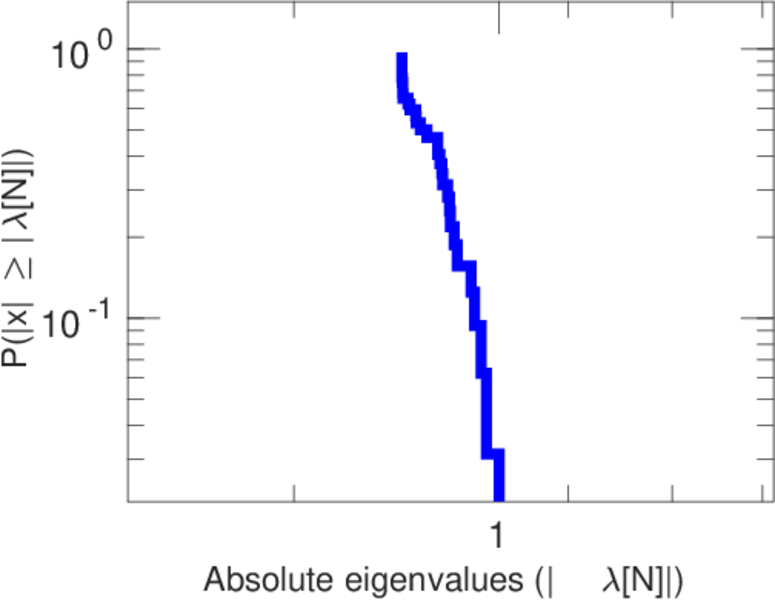
| Algebraic connectivity | a = | 0.038 573 4
|
| Spectral separation | |λ1[A] / λ2[A]| = | 1.483 78
|
| Controllability | C = | 44,340
|
| Relative controllability | Cr = | 0.981 603
|
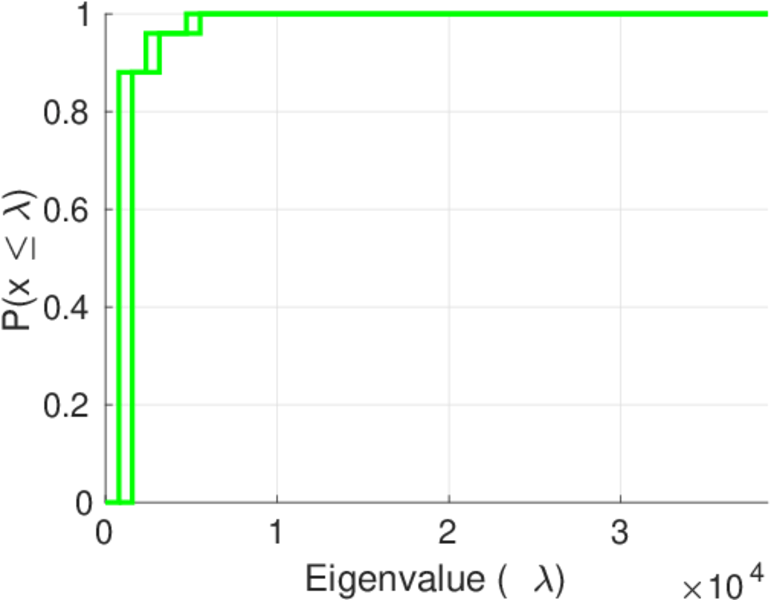
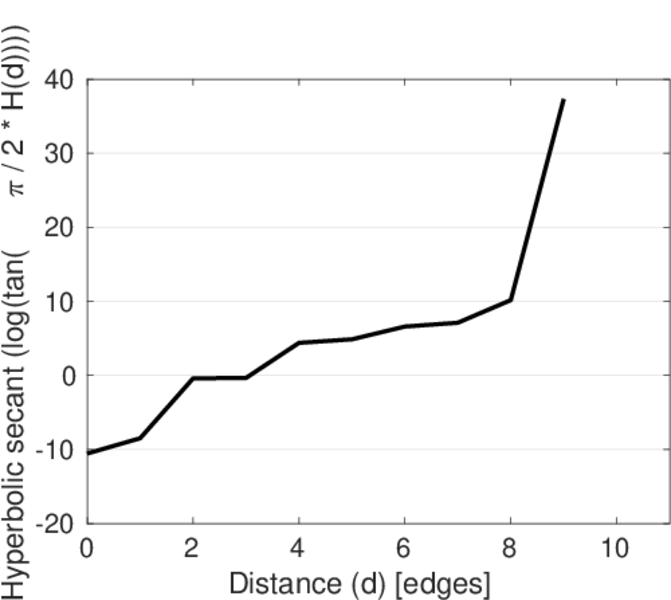
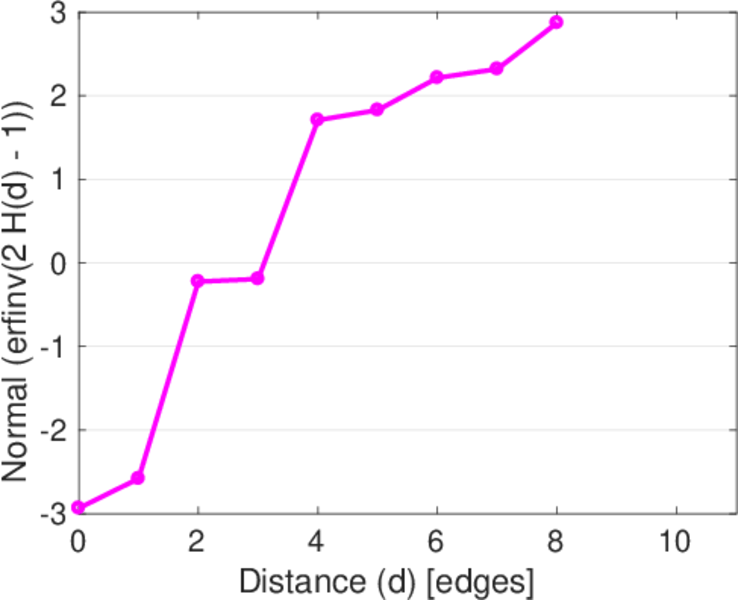
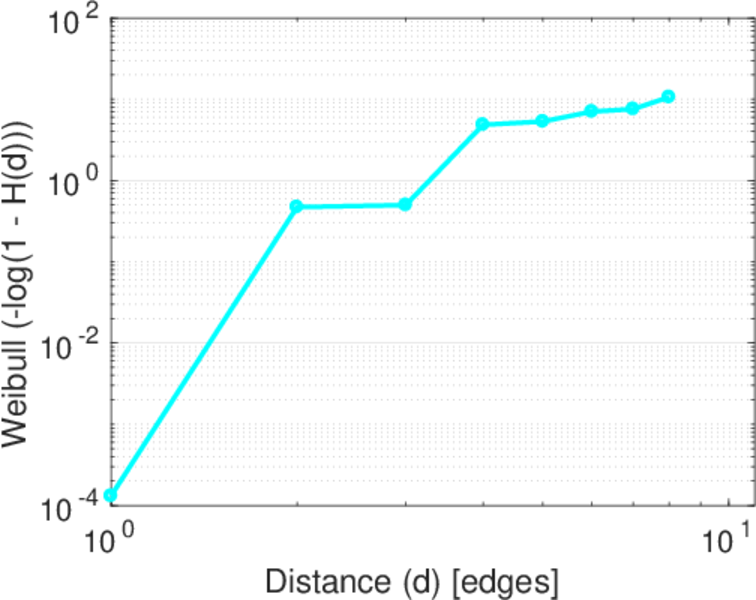
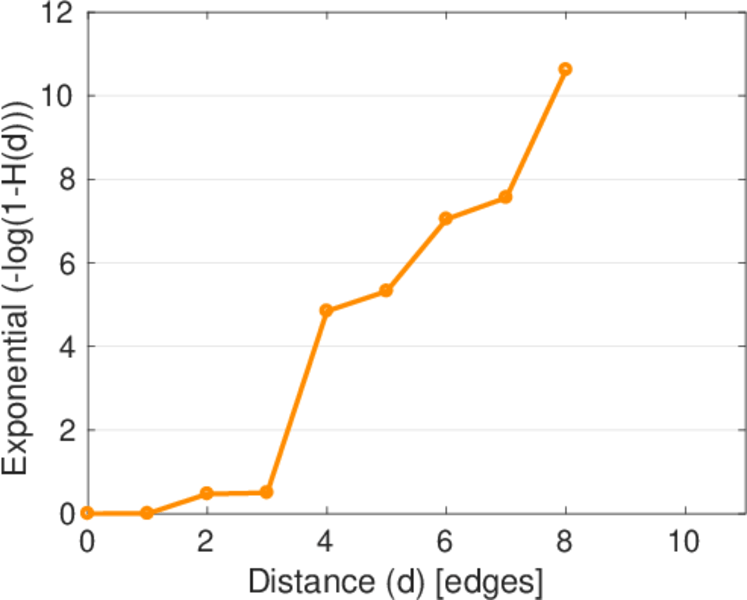
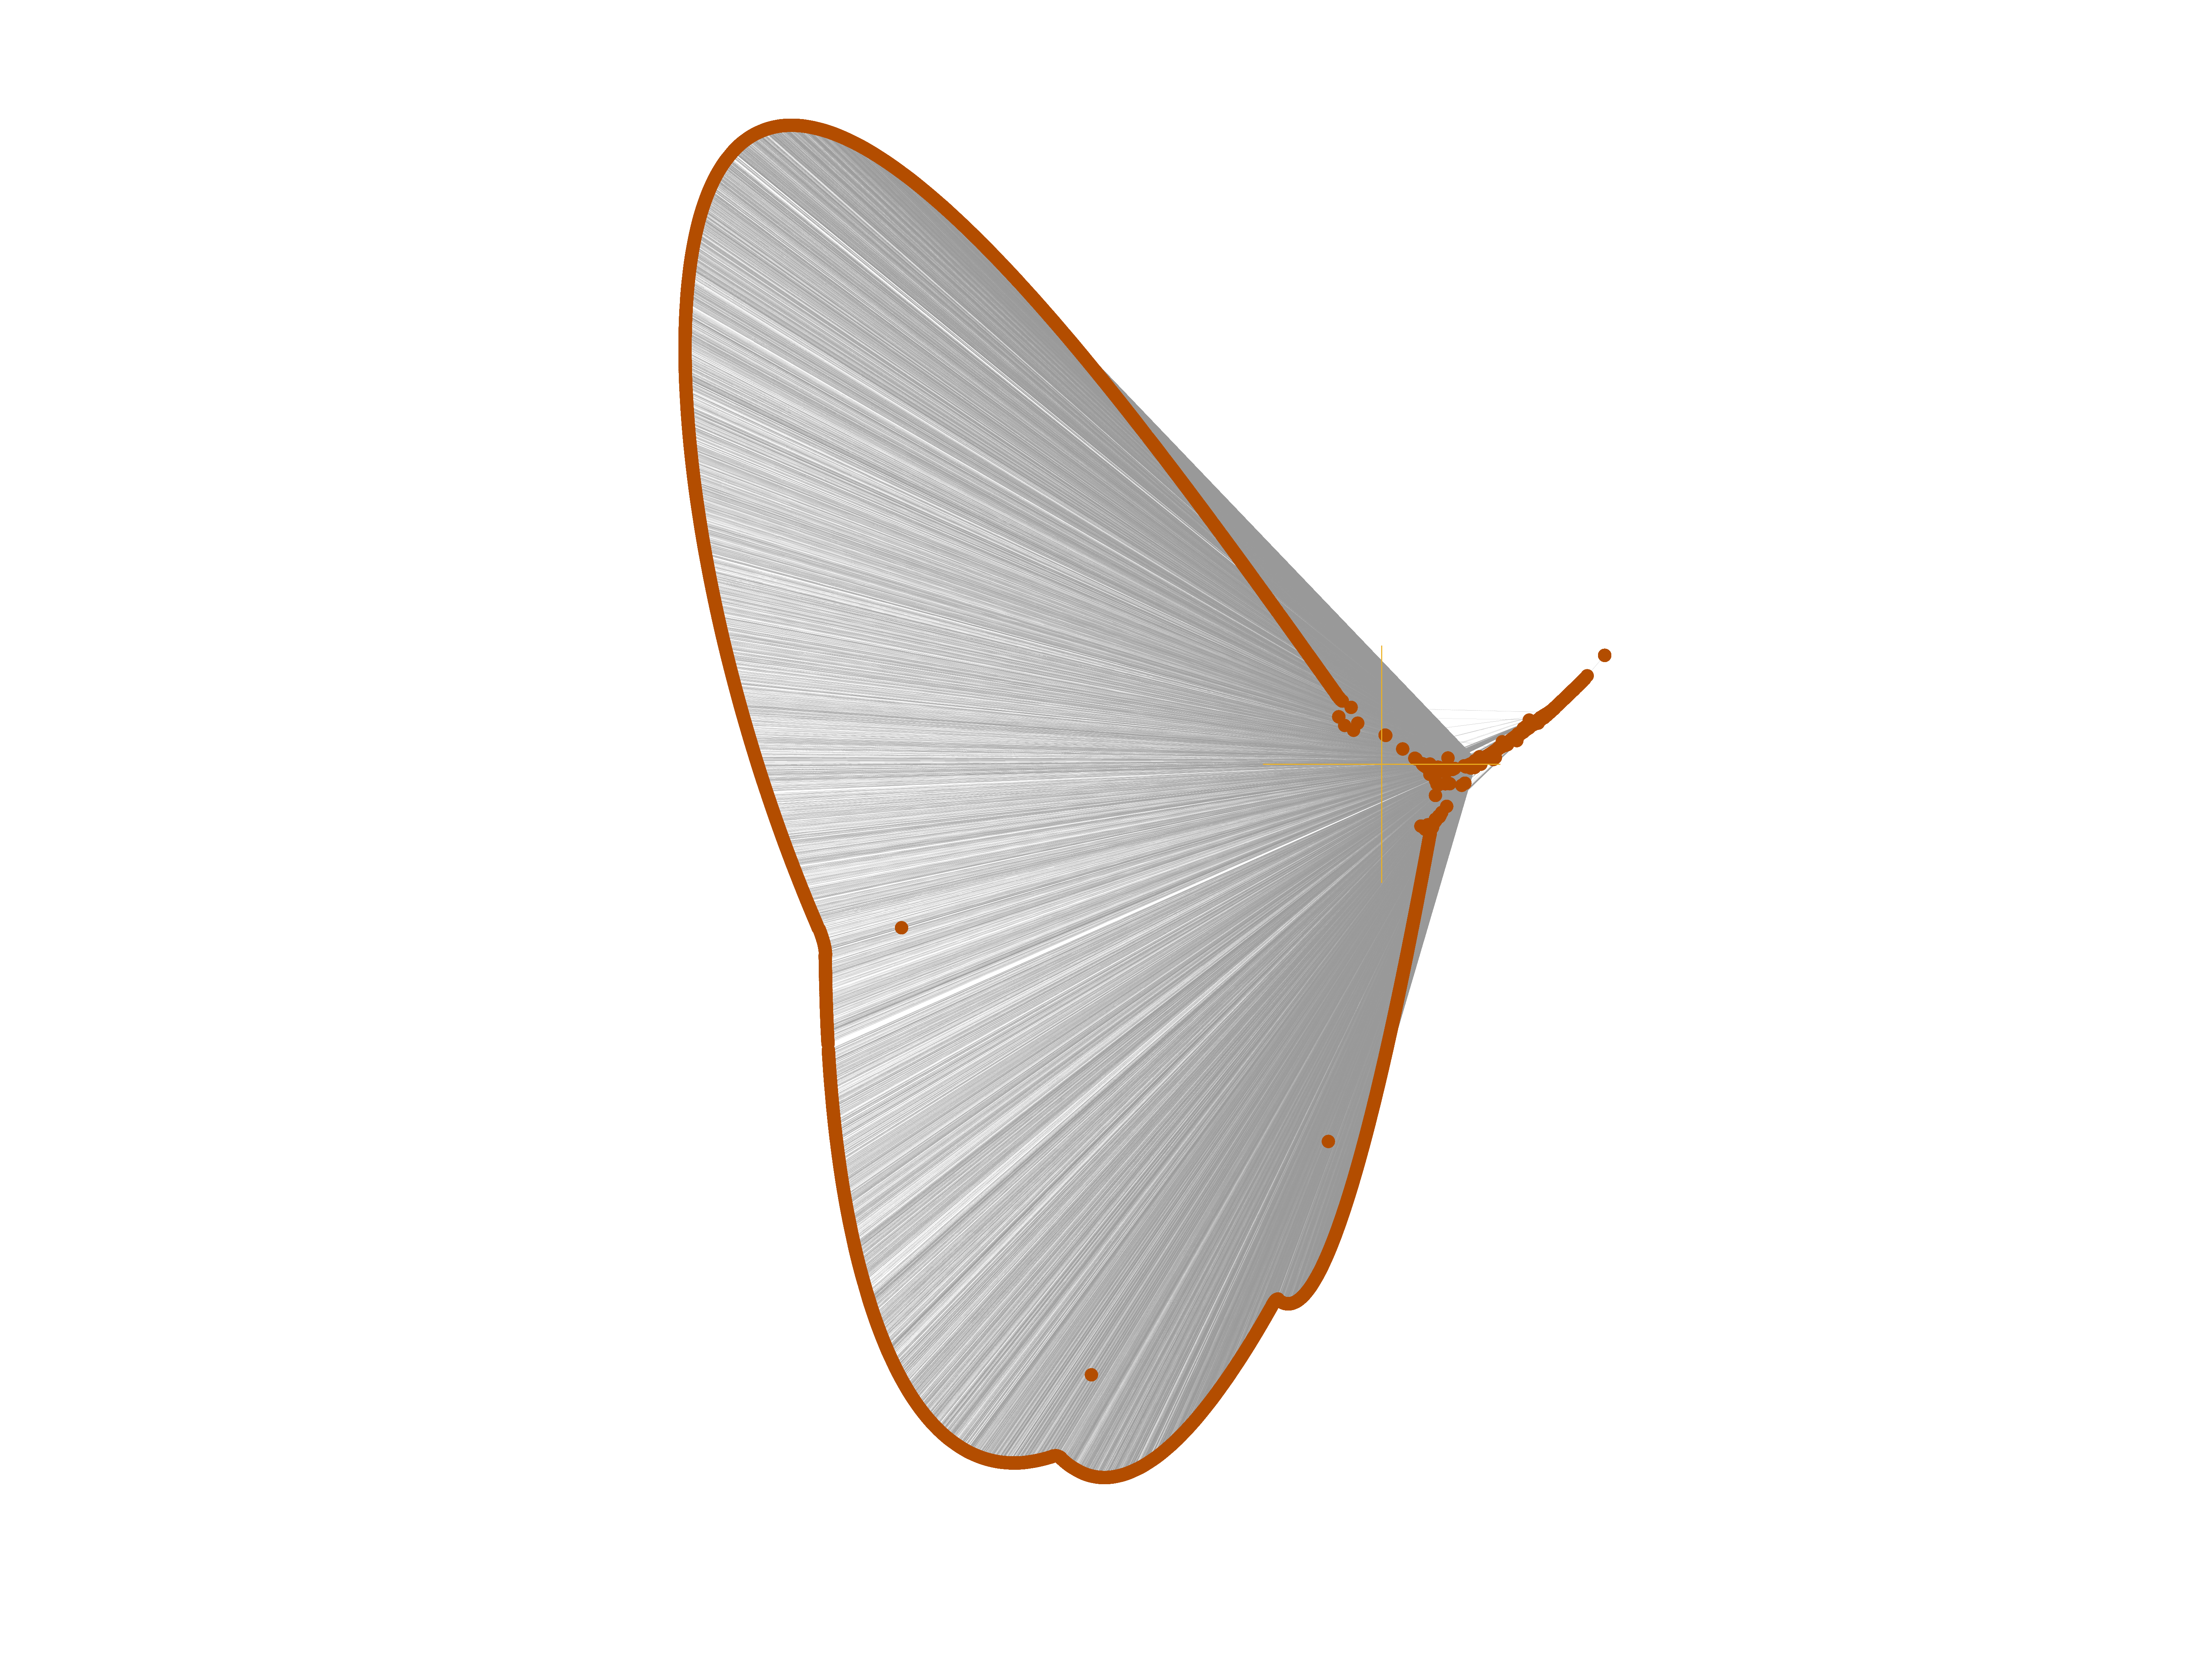
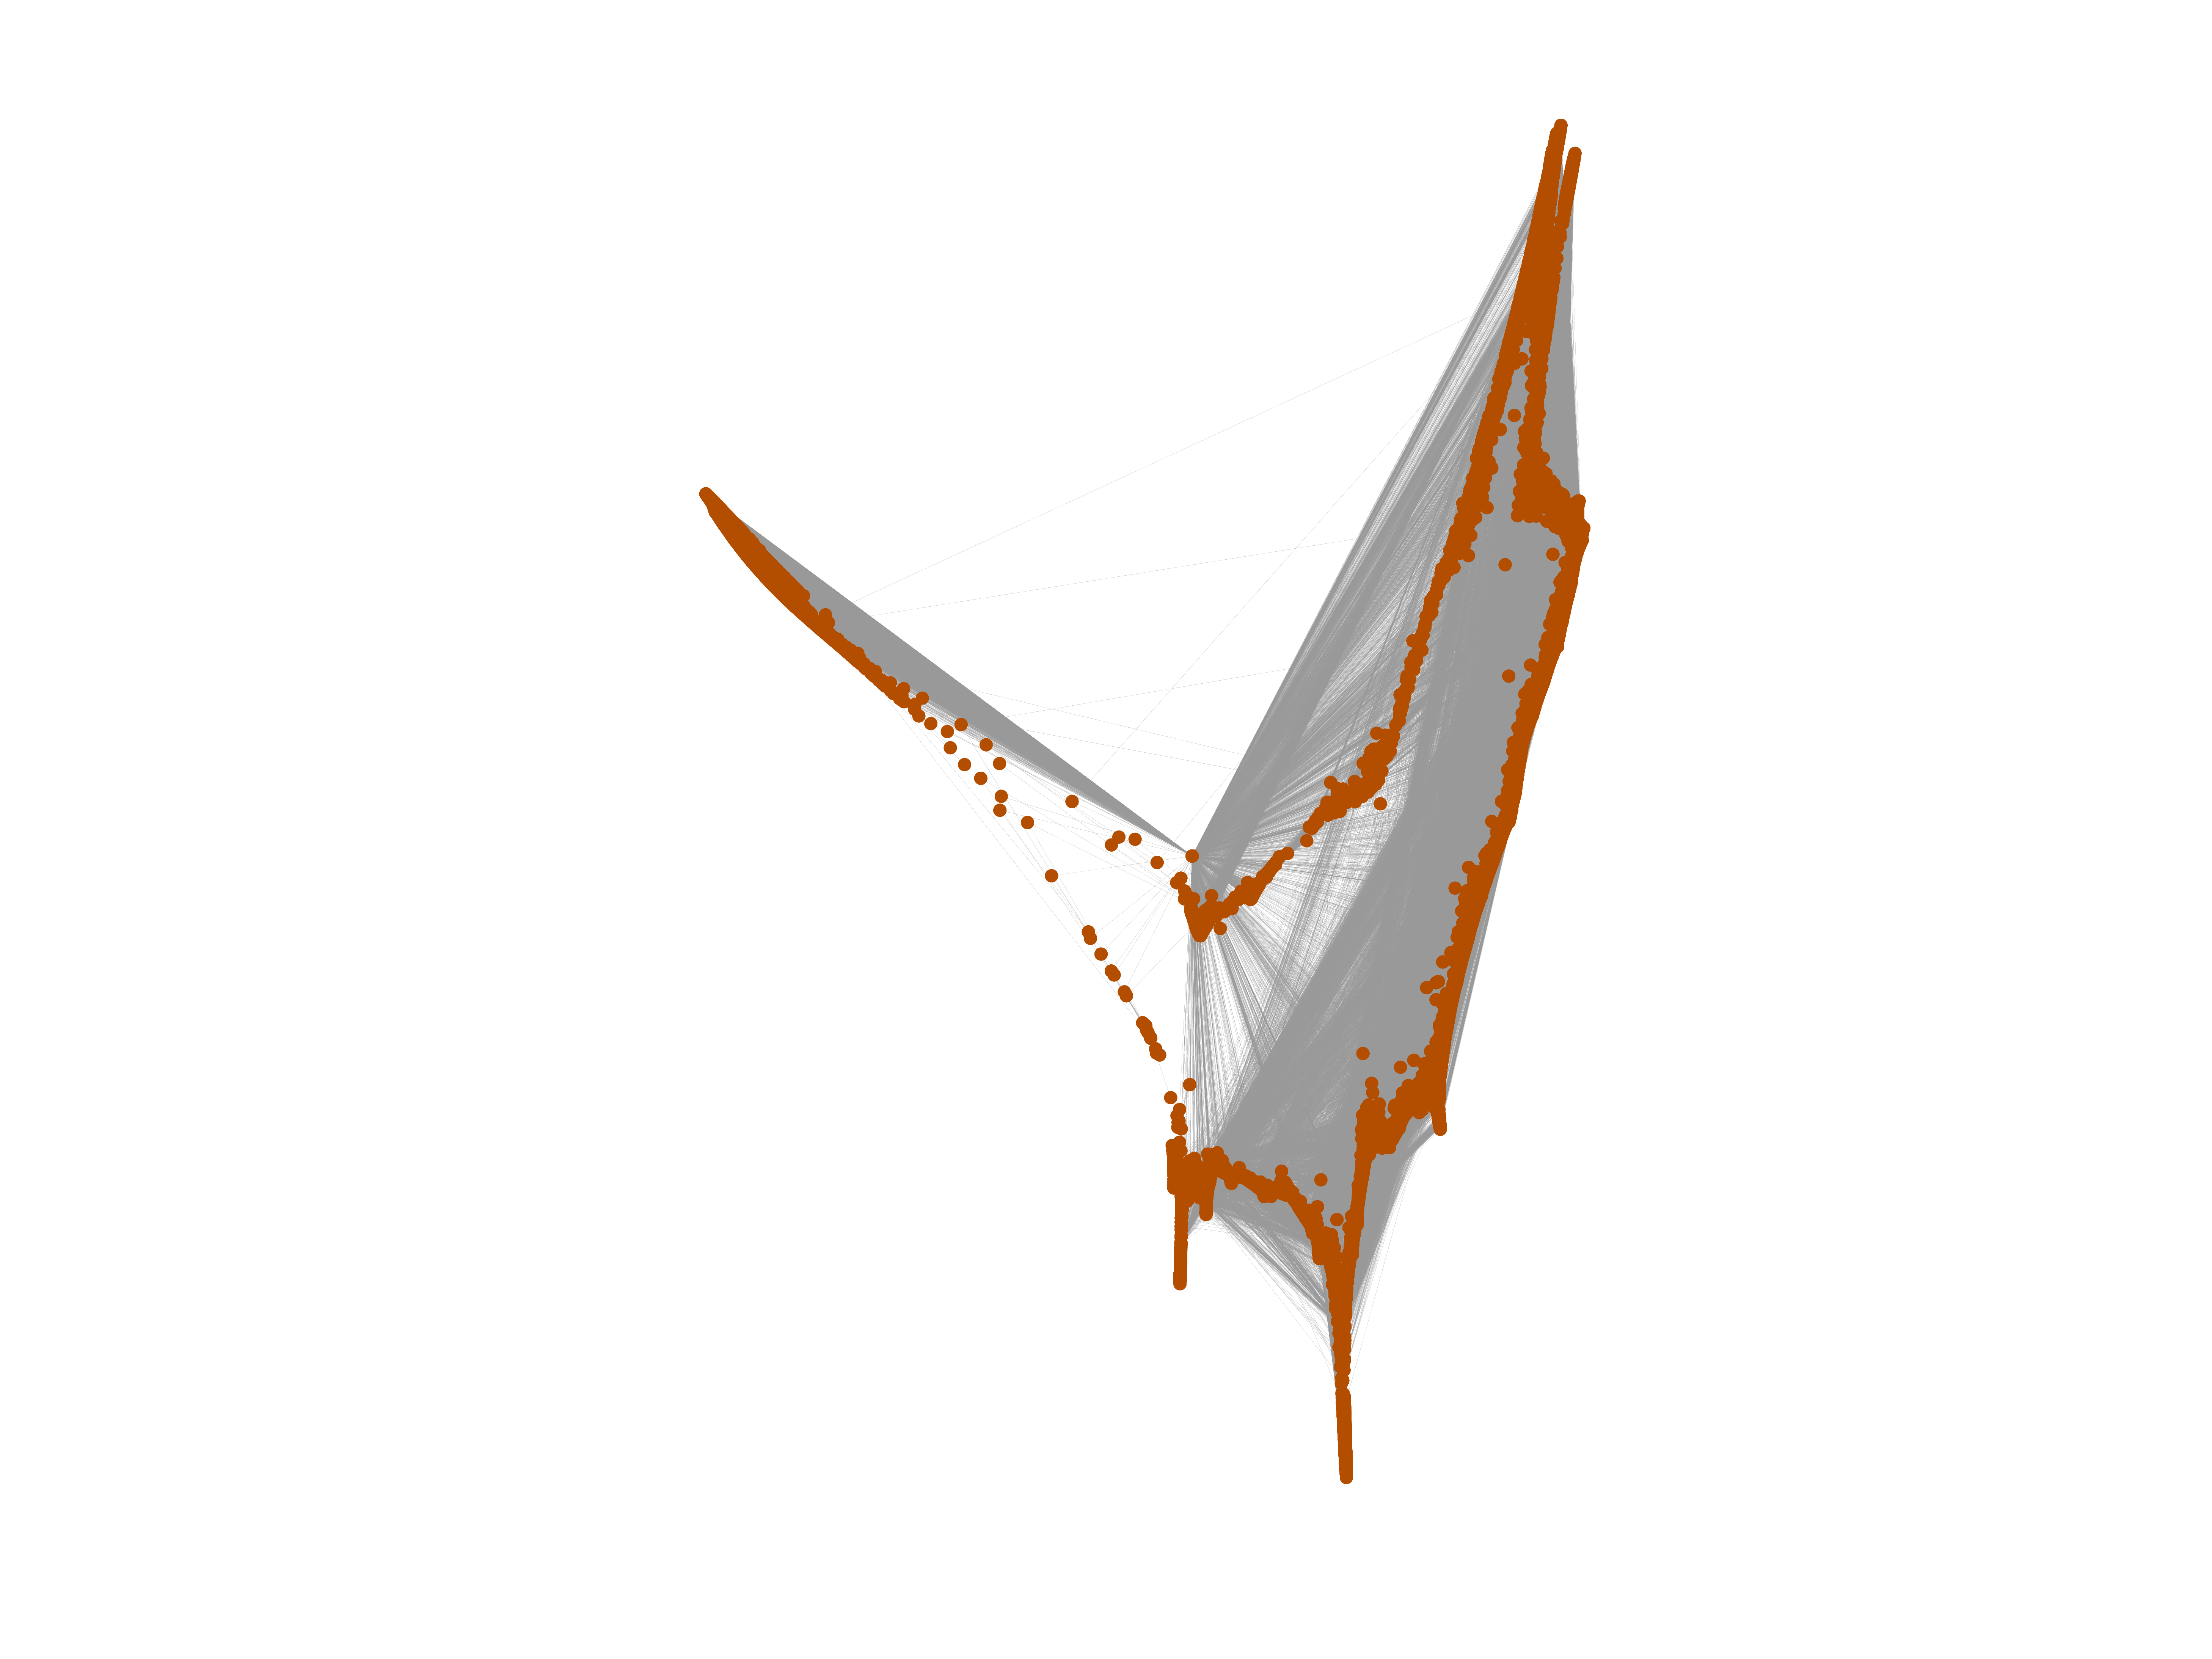
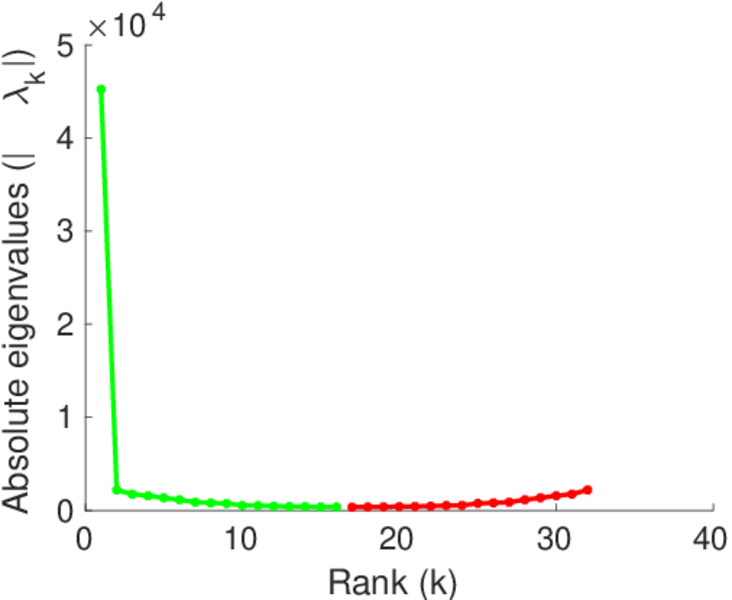
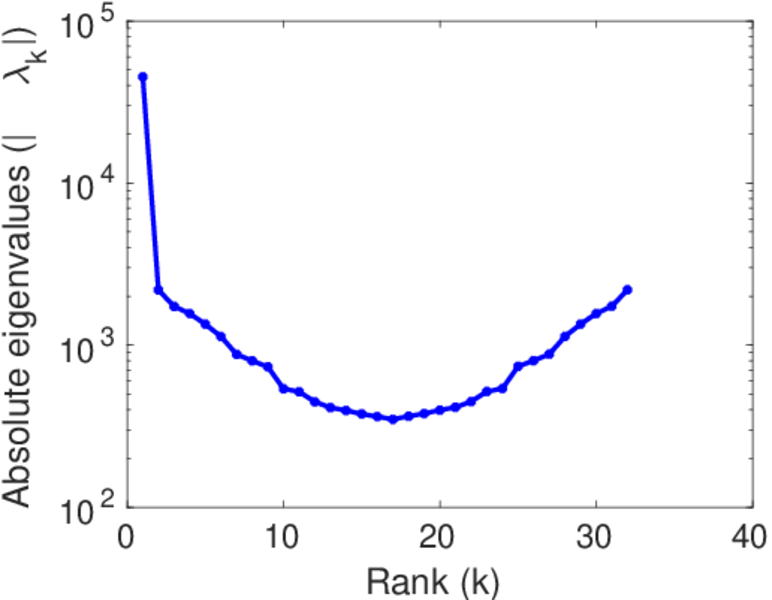
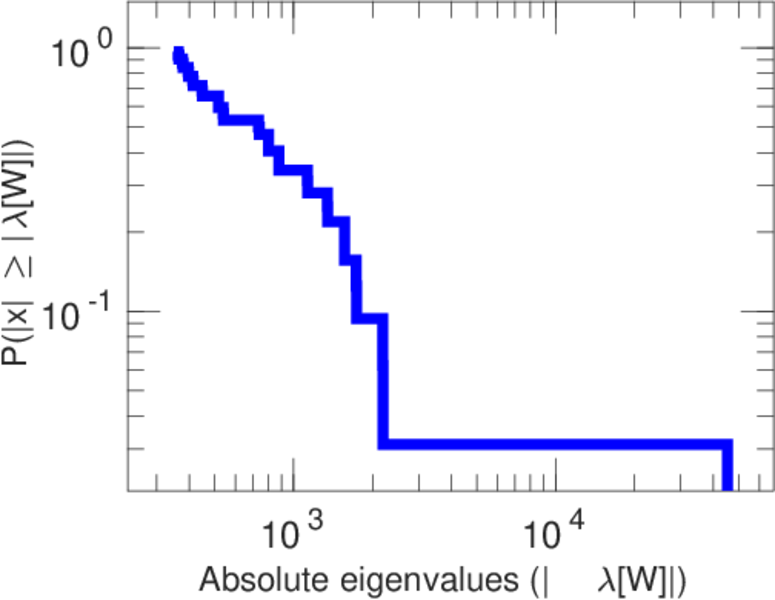
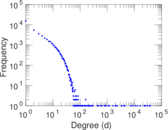
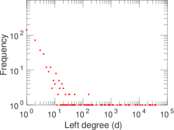
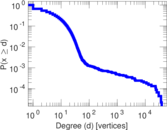
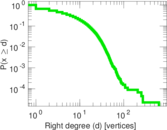
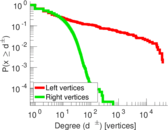
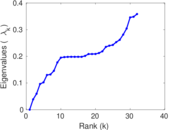
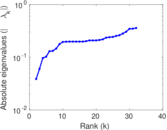
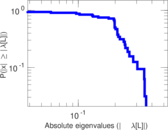
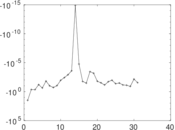
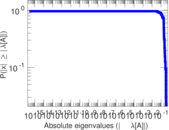
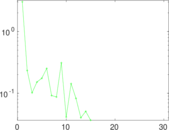
Plots


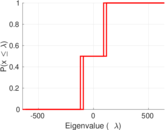
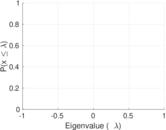

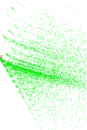


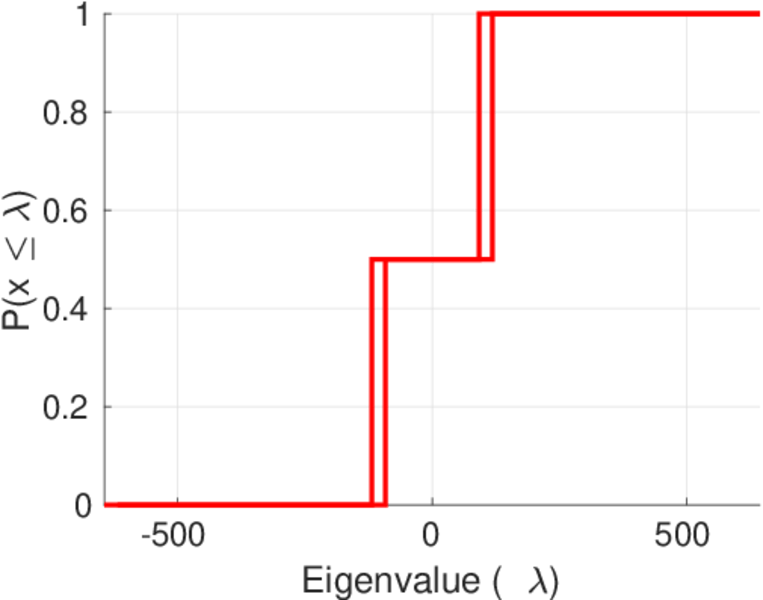
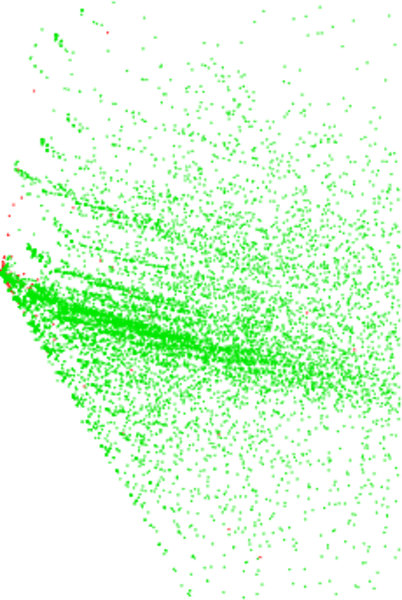
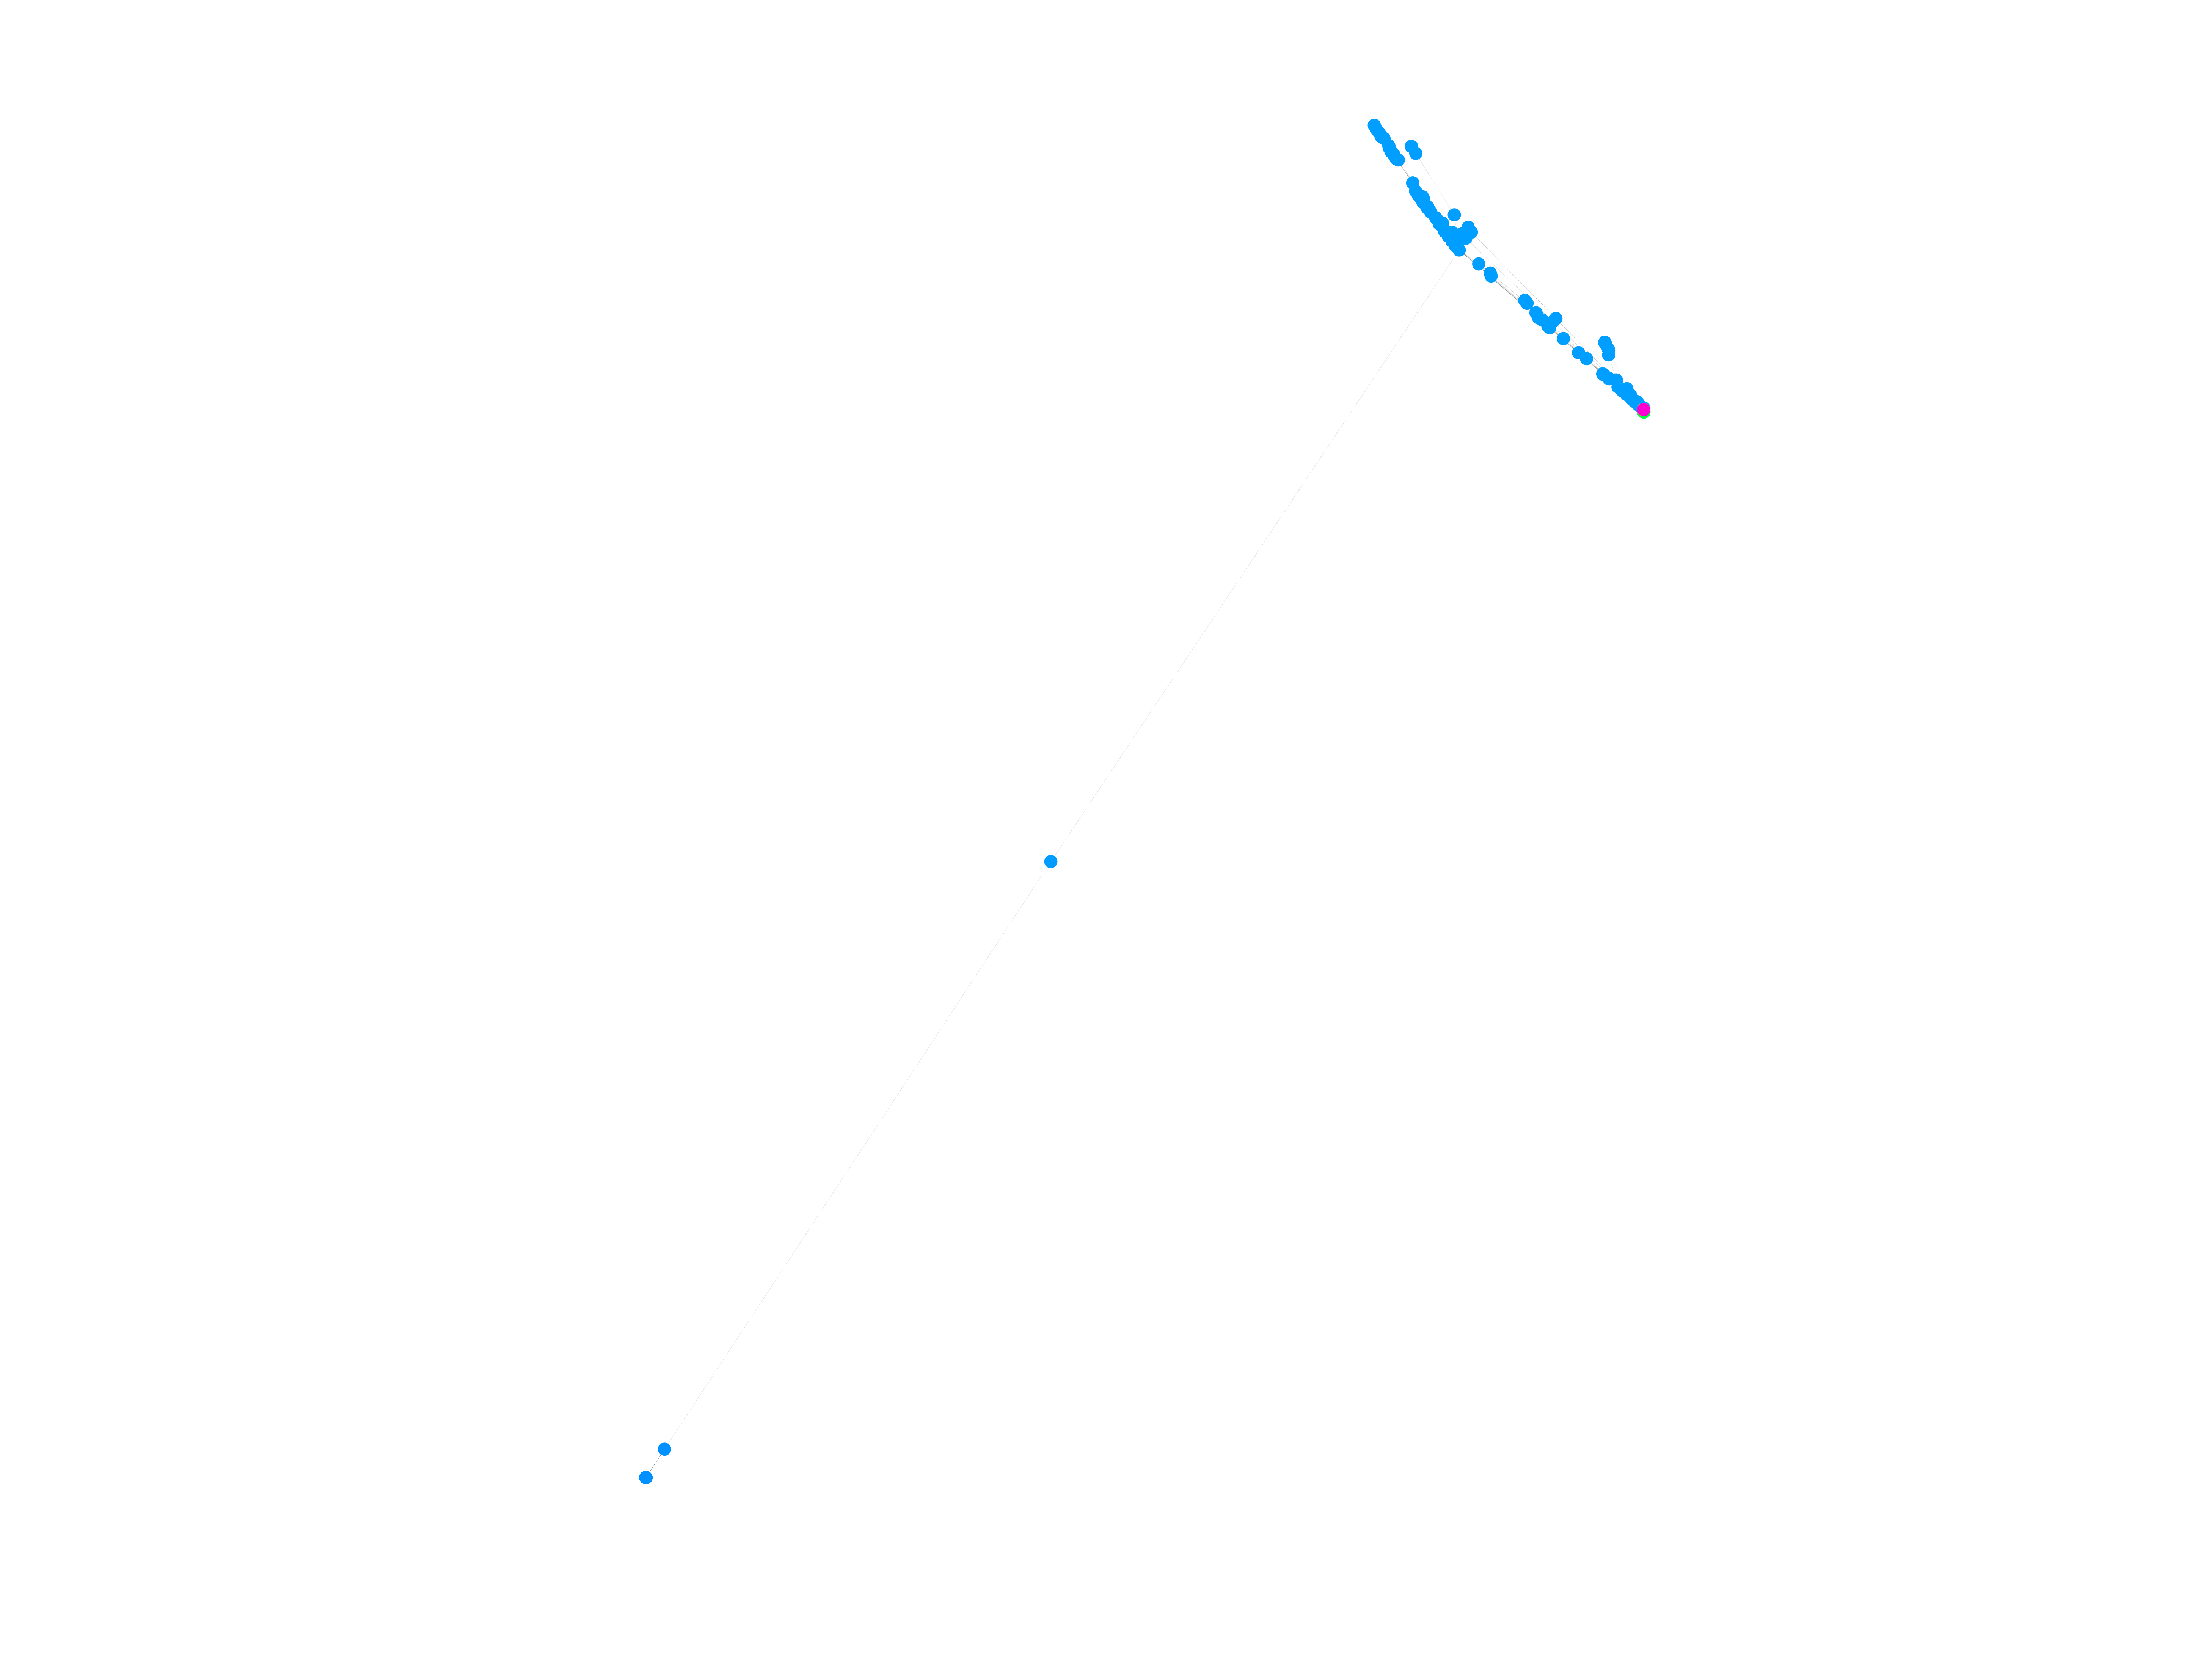
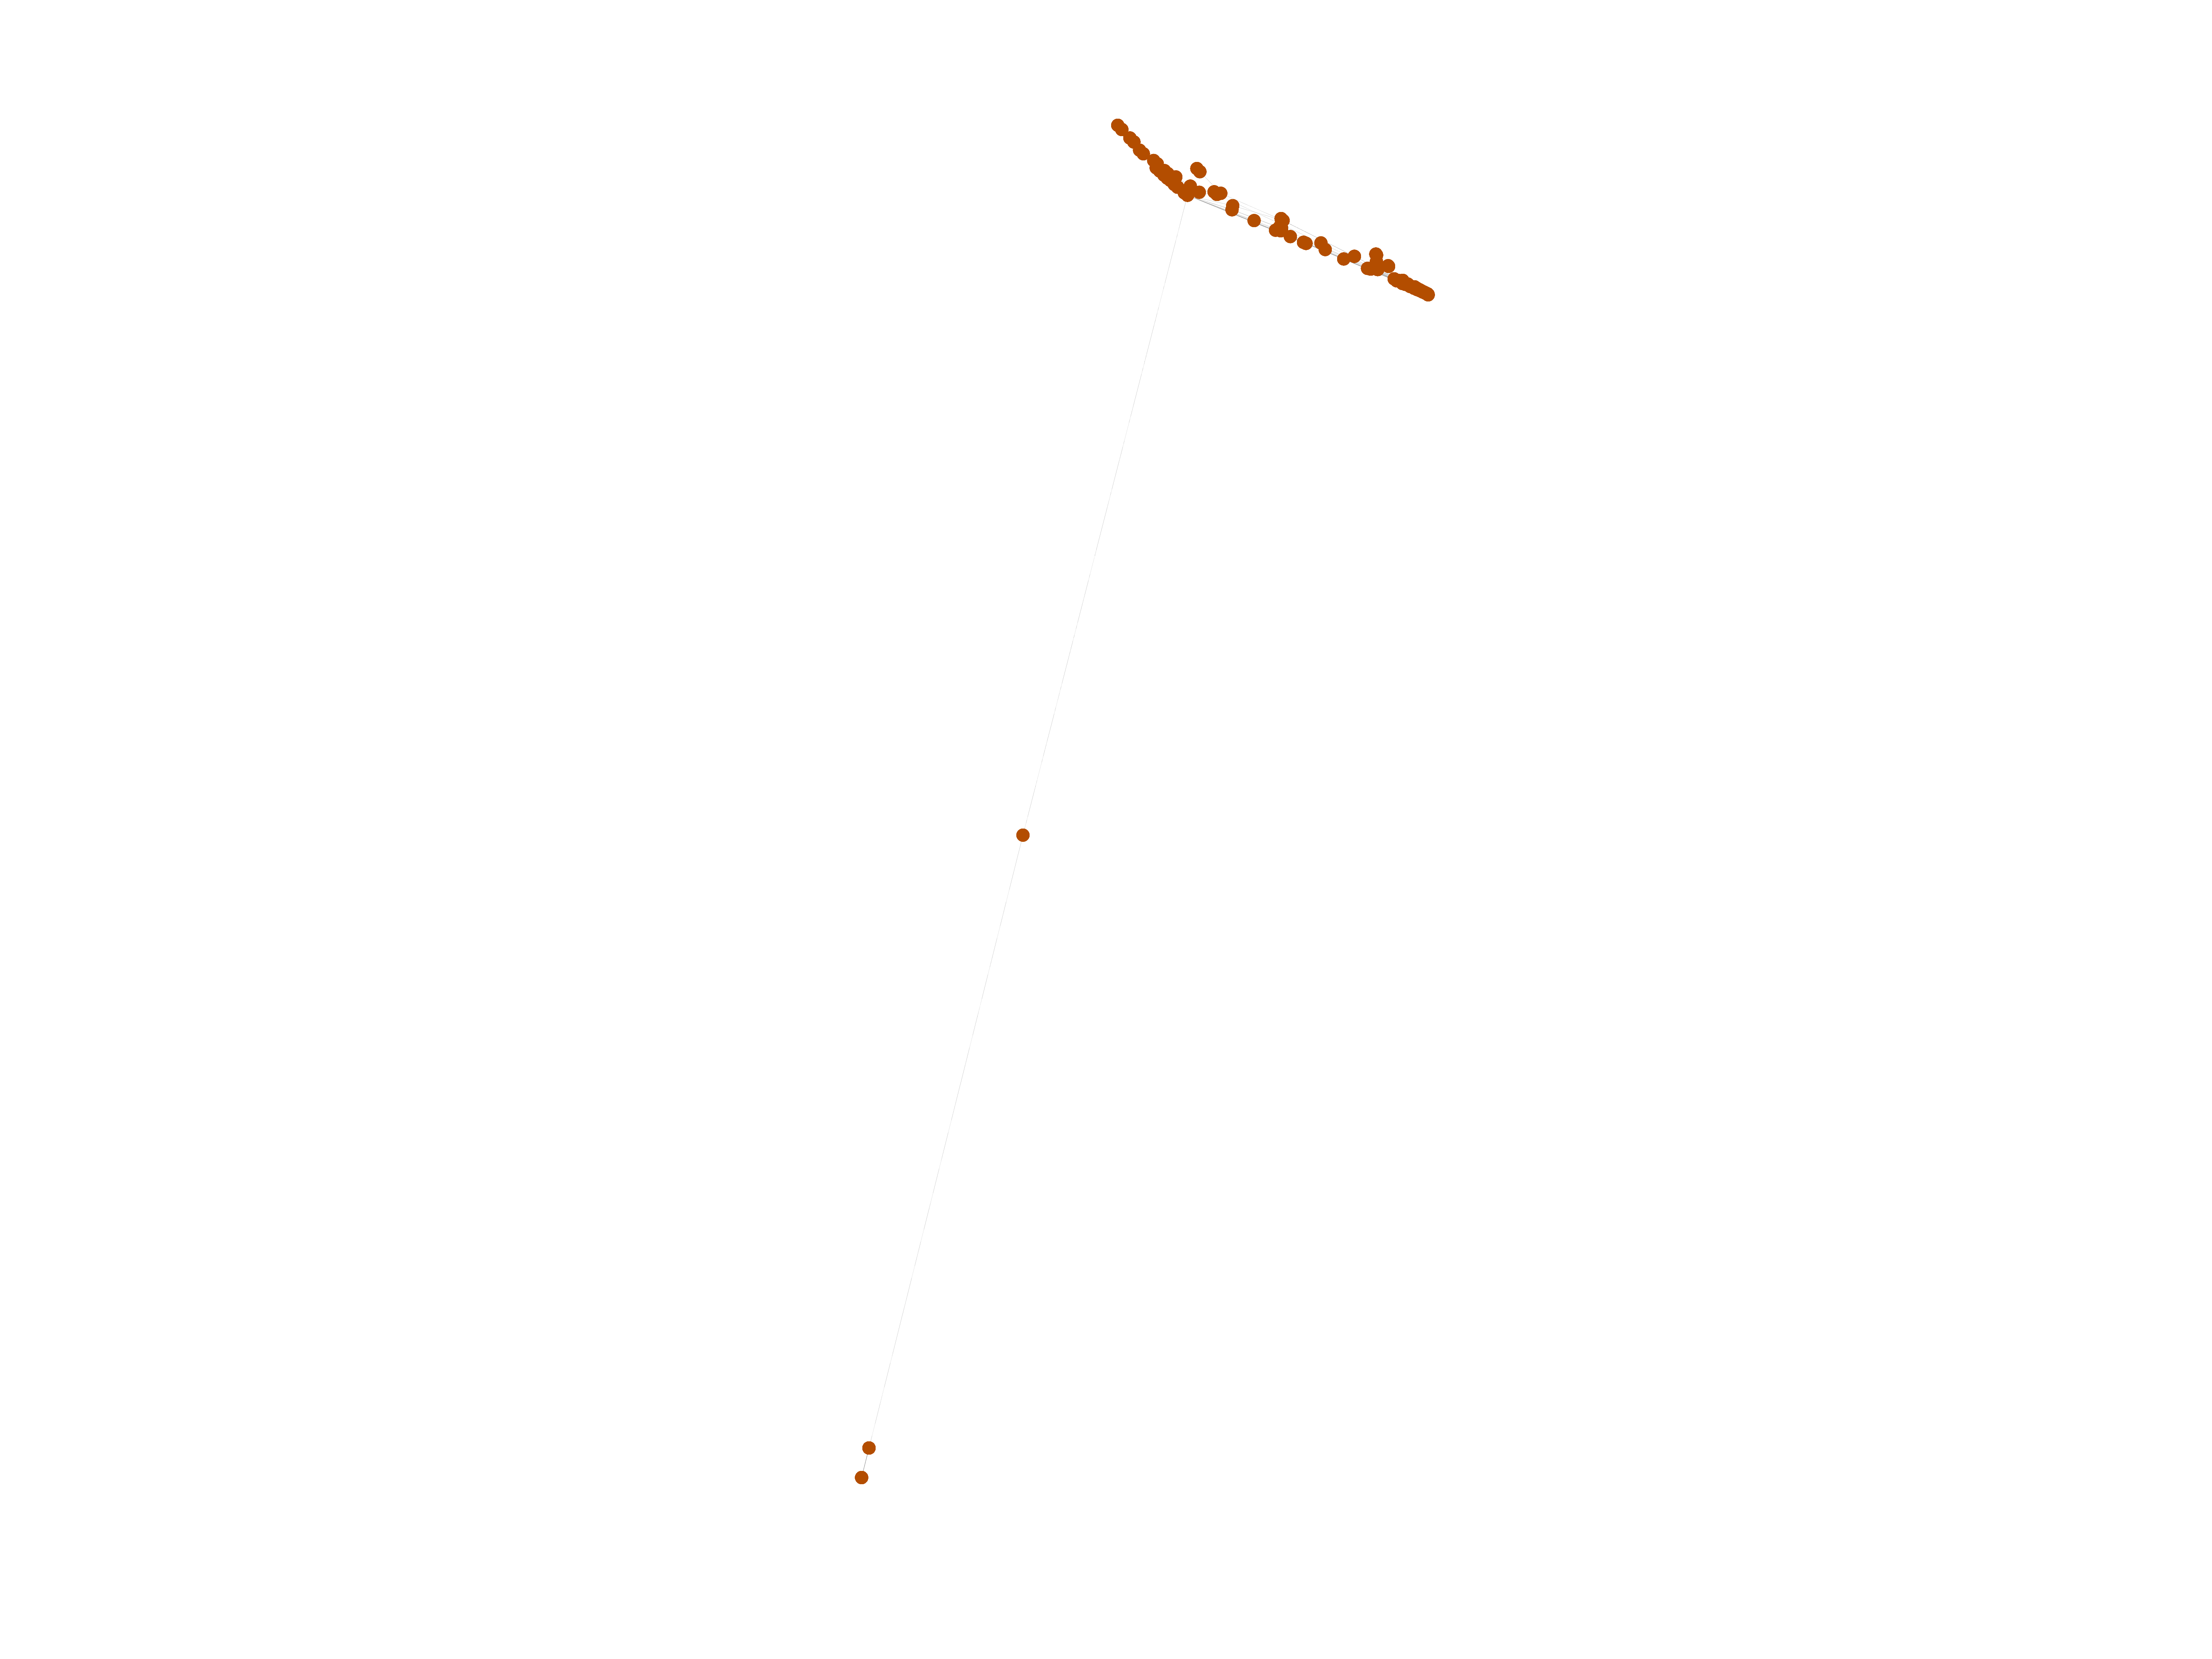
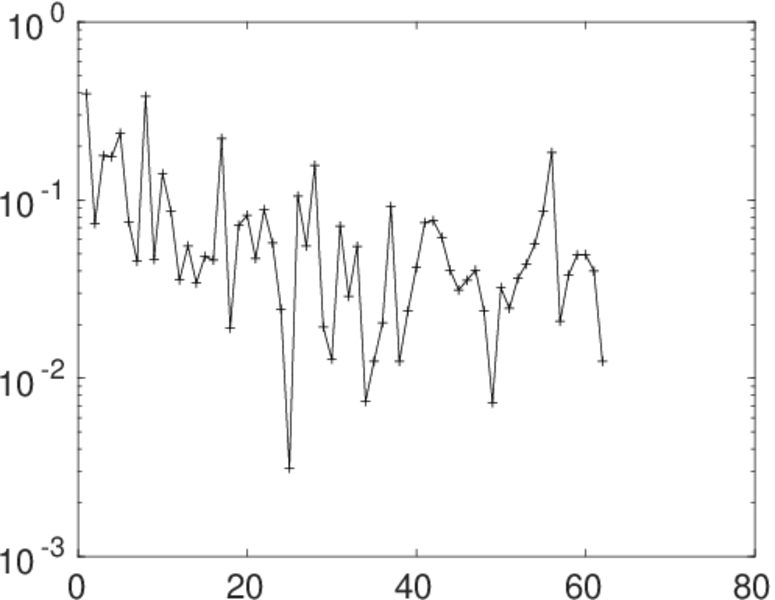
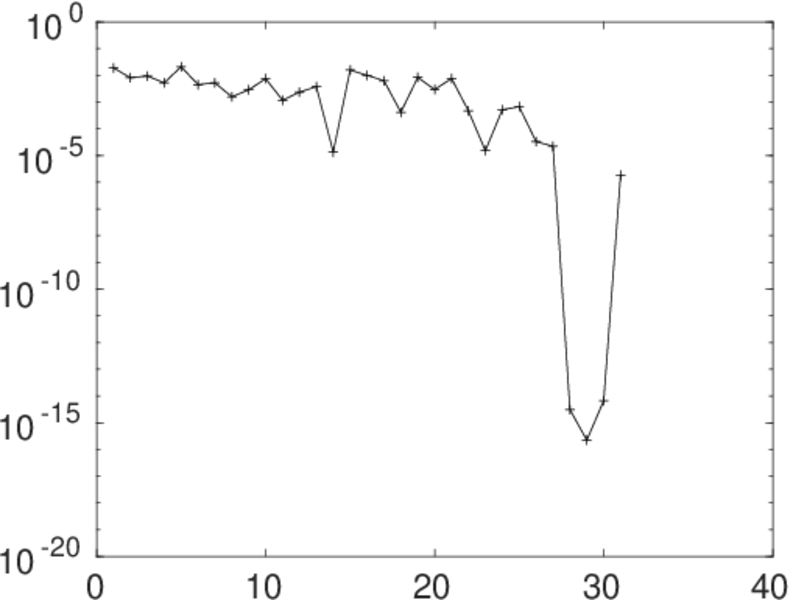
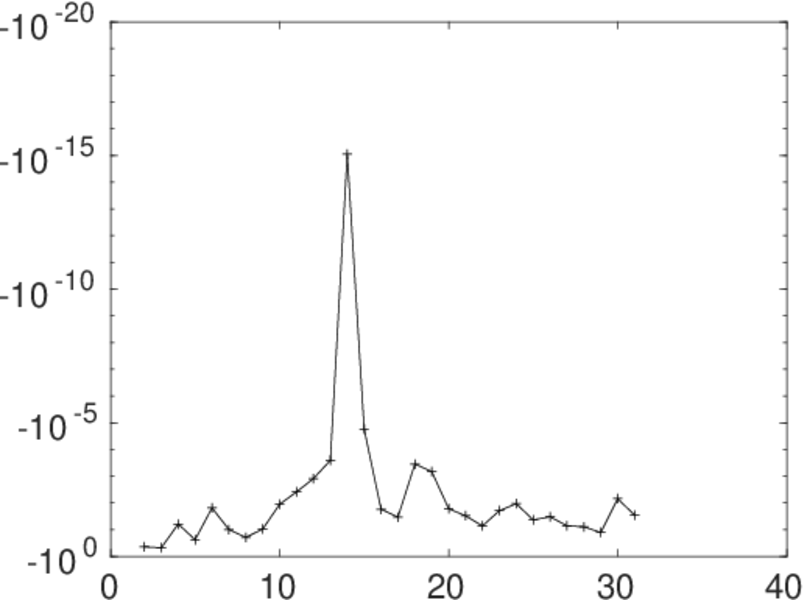
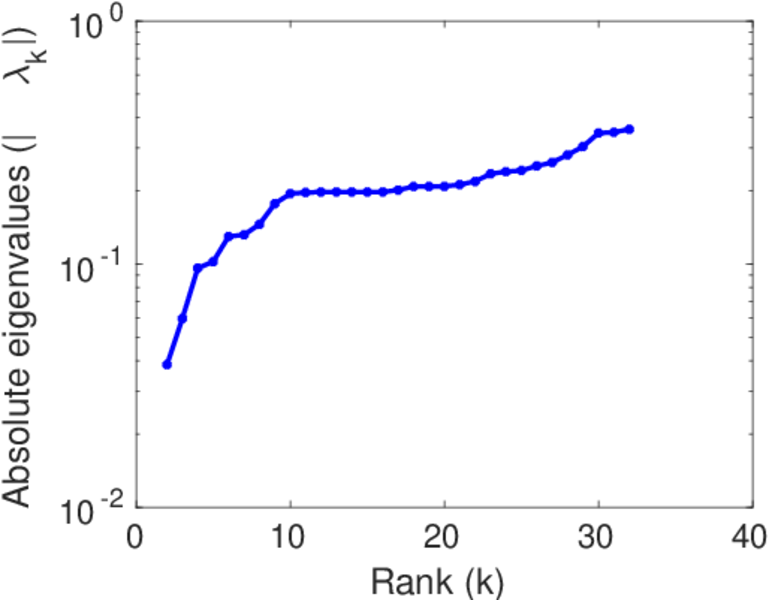
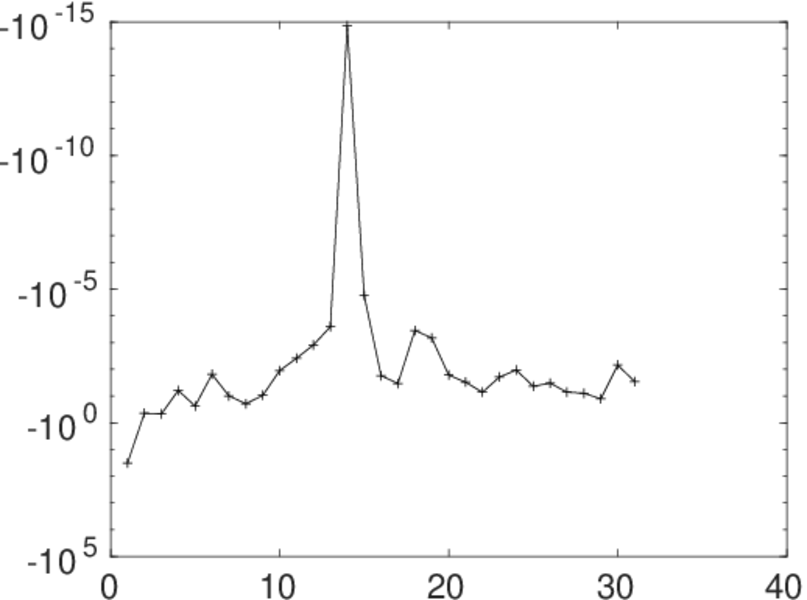
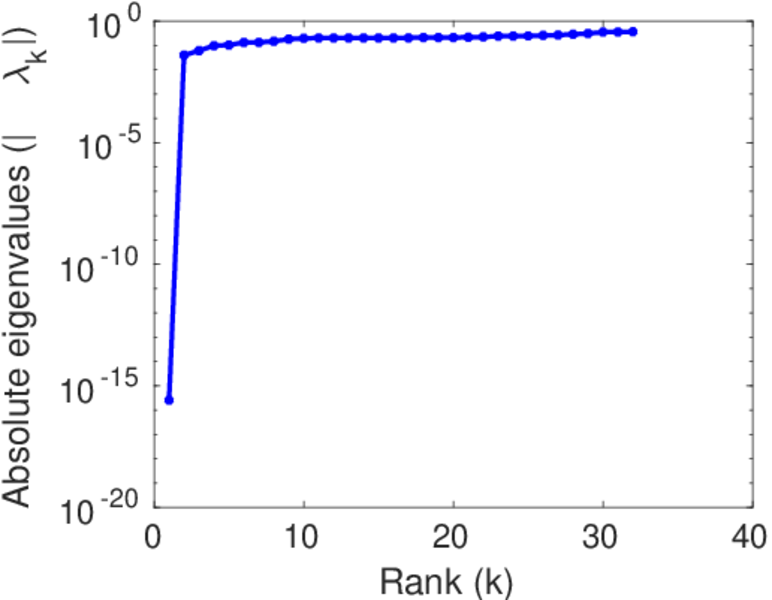
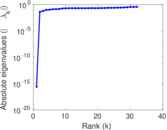
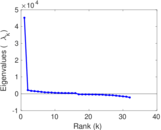
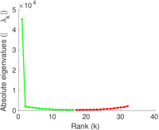
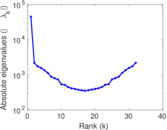
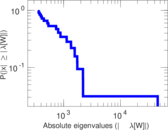
Matrix decompositions plots


Downloads
References
|
[1]
|
Jérôme Kunegis.
KONECT – The Koblenz Network Collection.
In Proc. Int. Conf. on World Wide Web Companion, pages
1343–1350, 2013.
[ http ]
|
|
[2]
|
Wikimedia Foundation.
Wikimedia downloads.
http://dumps.wikimedia.org/, January 2010.
|
 KONECT ‣ Networks ‣
Buy Me a Coffee
KONECT ‣ Networks ‣
Buy Me a Coffee