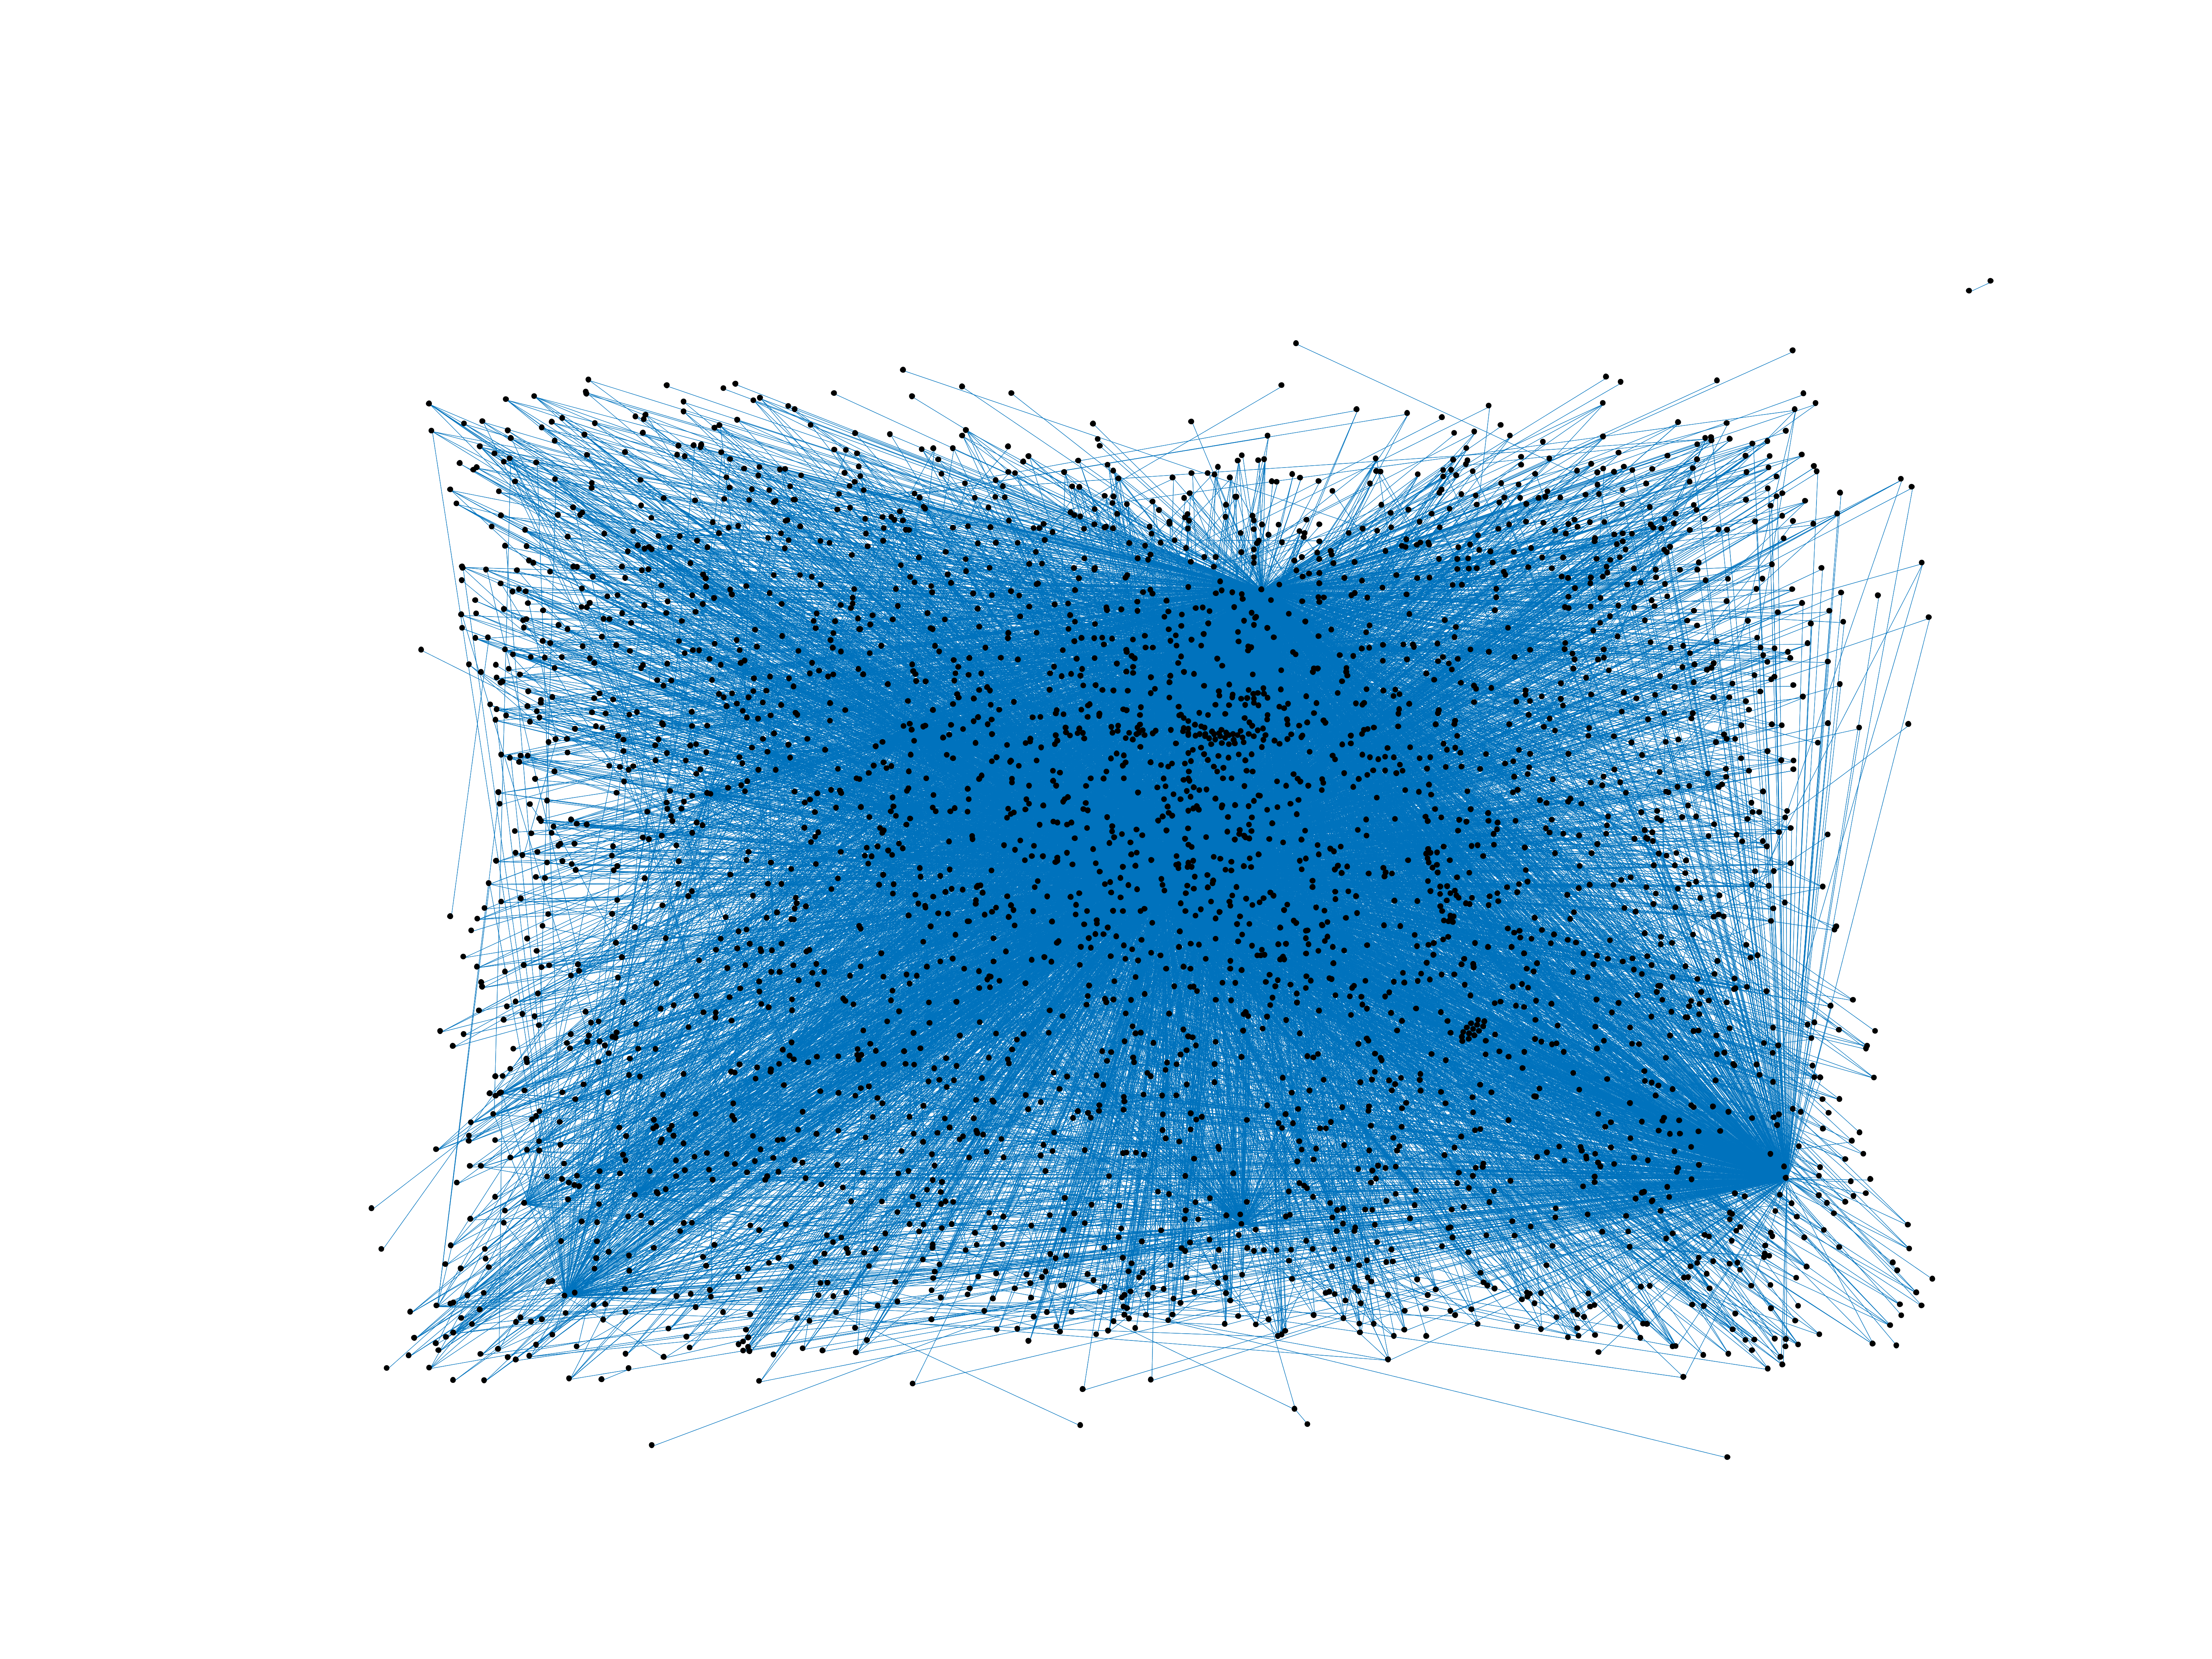
Wikipedia edits (olo)
This is the bipartite edit network of the Livvi-Karelian Wikipedia. It contains
users and pages from the Livvi-Karelian Wikipedia, connected by edit events.
Each edge represents an edit. The dataset includes the timestamp of each edit.
Metadata
Statistics
| Size | n = | 3,281
|
| Left size | n1 = | 140
|
| Right size | n2 = | 3,141
|
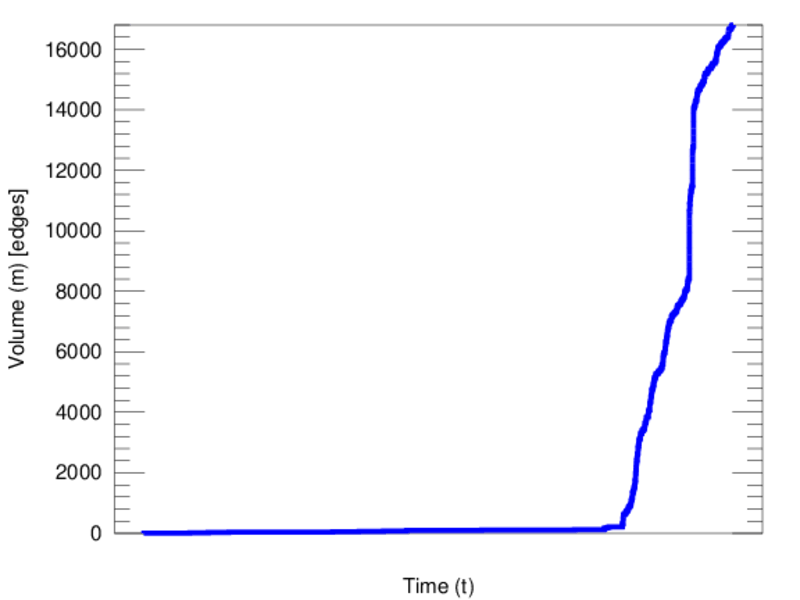
| Volume | m = | 16,801
|
| Unique edge count | m̿ = | 10,469
|
| Wedge count | s = | 6,258,310
|
| Claw count | z = | 3,411,695,053
|
| Cross count | x = | 1,532,829,171,033
|
| Square count | q = | 4,199,399
|
| 4-Tour count | T4 = | 58,649,490
|
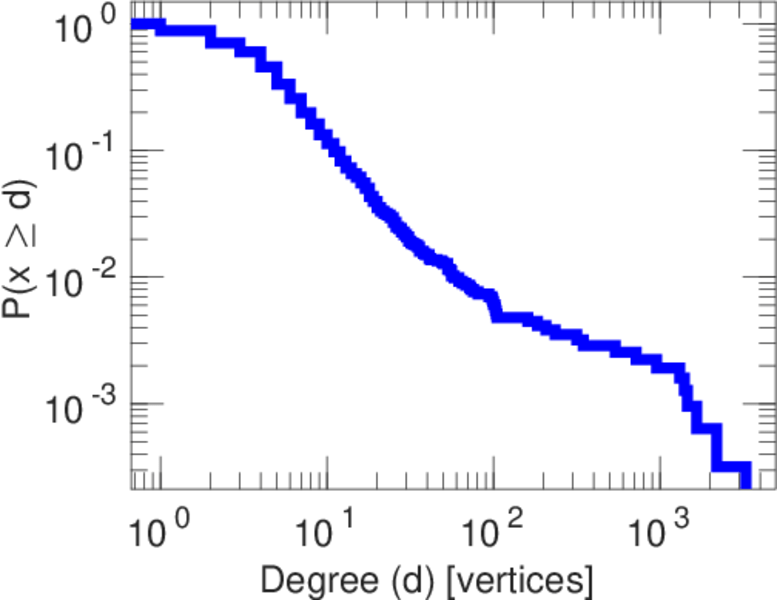
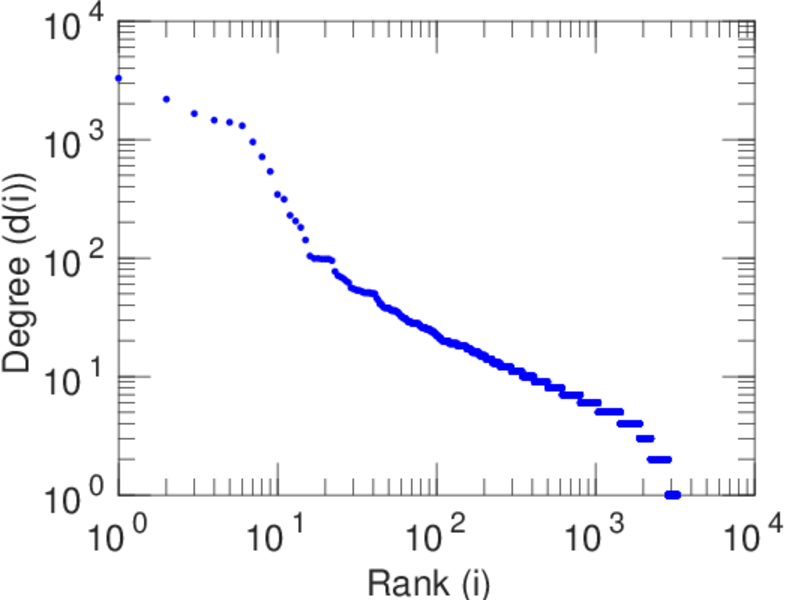
| Maximum degree | dmax = | 3,288
|
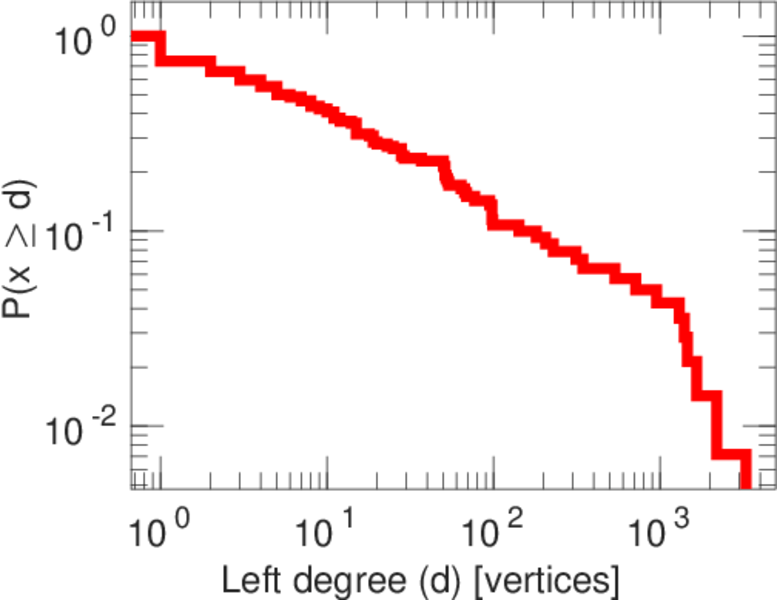
| Maximum left degree | d1max = | 3,288
|
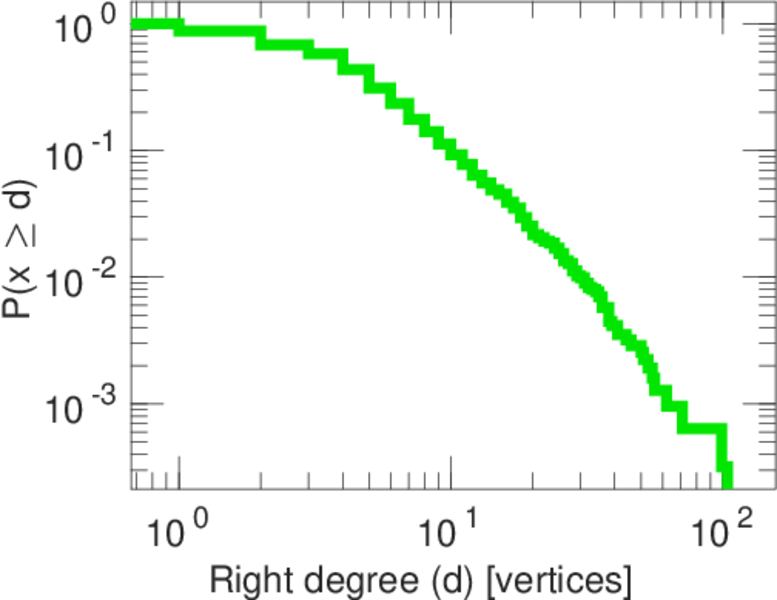
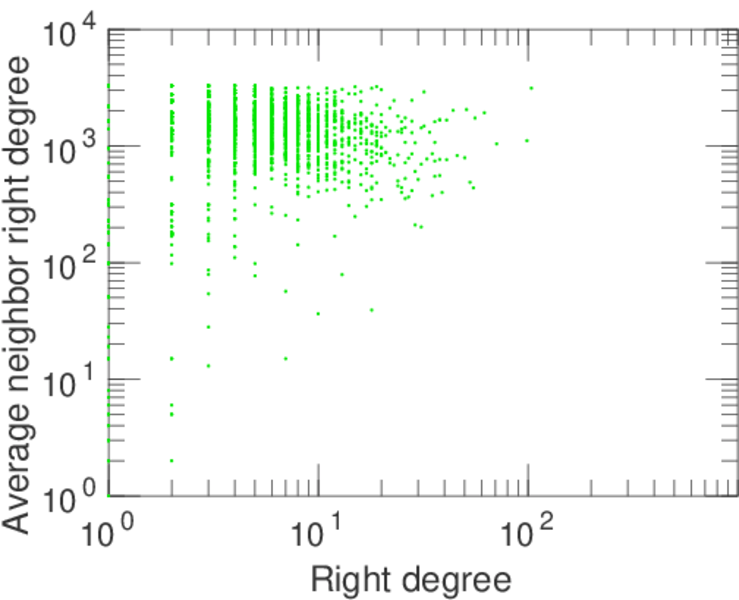
| Maximum right degree | d2max = | 104
|
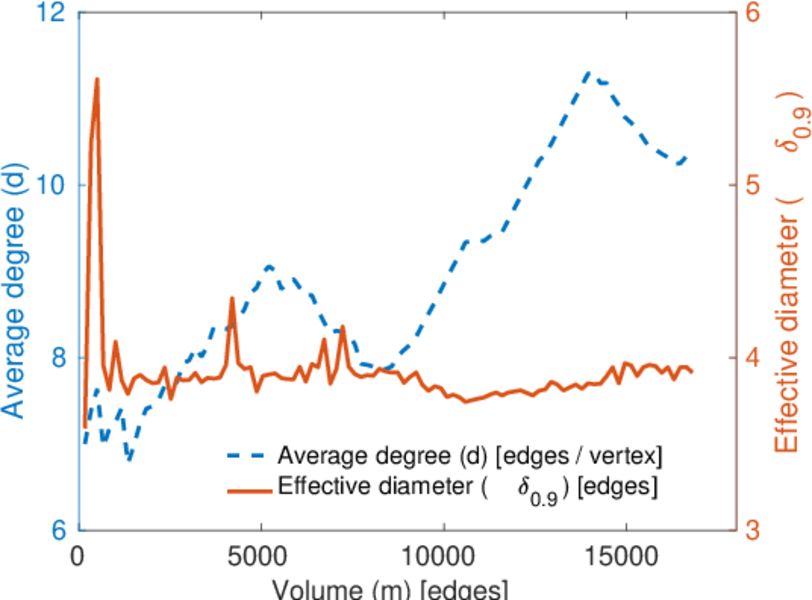
| Average degree | d = | 10.241 4
|
| Average left degree | d1 = | 120.007
|
| Average right degree | d2 = | 5.348 93
|
| Fill | p = | 0.023 807 2
|
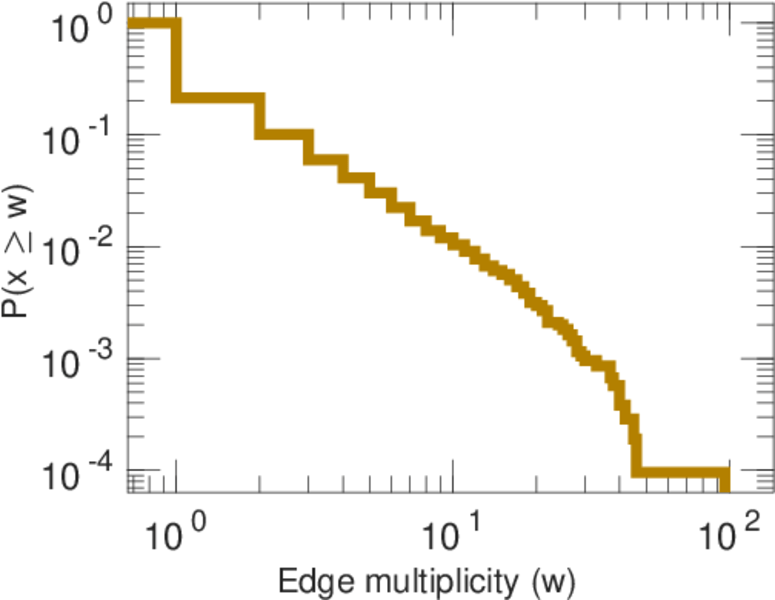
| Average edge multiplicity | m̃ = | 1.604 83
|
| Size of LCC | N = | 3,238
|
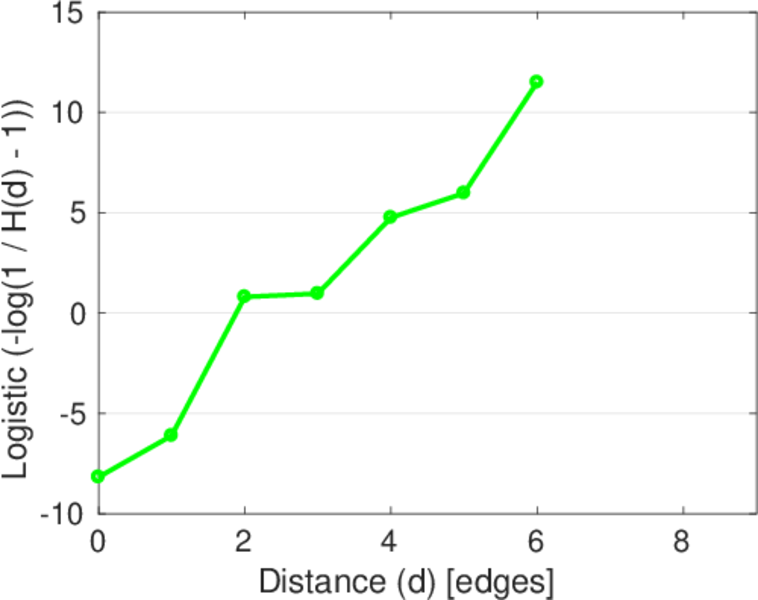
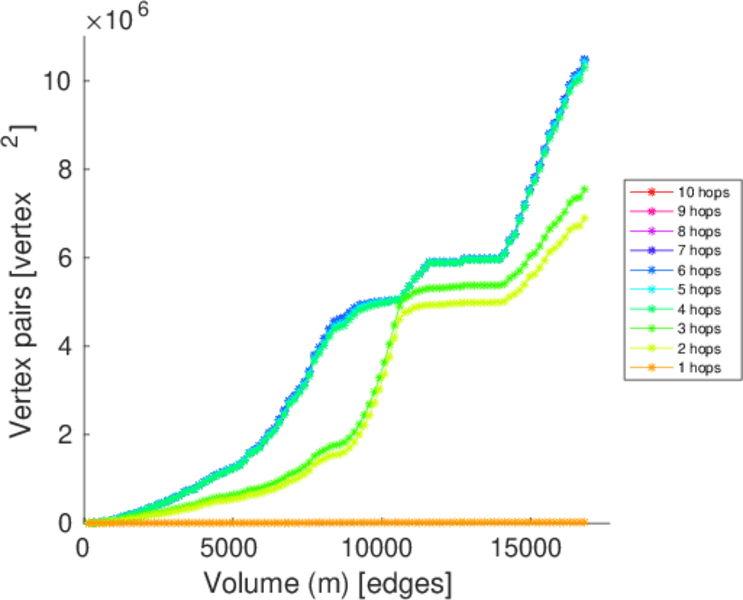
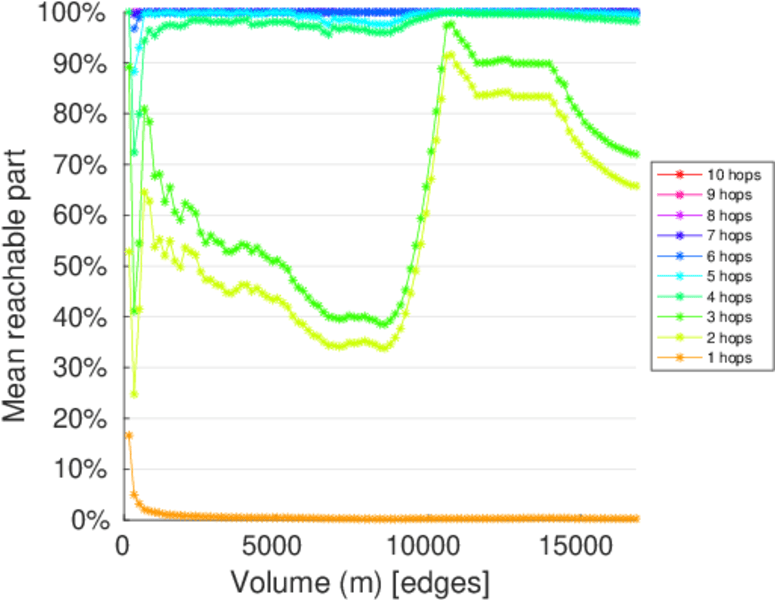
| Diameter | δ = | 8
|
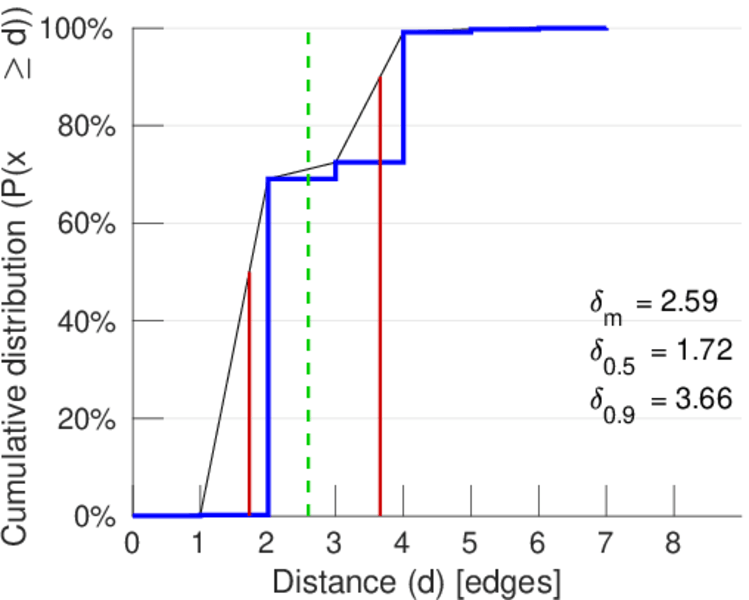
| 50-Percentile effective diameter | δ0.5 = | 1.723 12
|
| 90-Percentile effective diameter | δ0.9 = | 3.657 33
|
| Median distance | δM = | 2
|
| Mean distance | δm = | 2.593 44
|
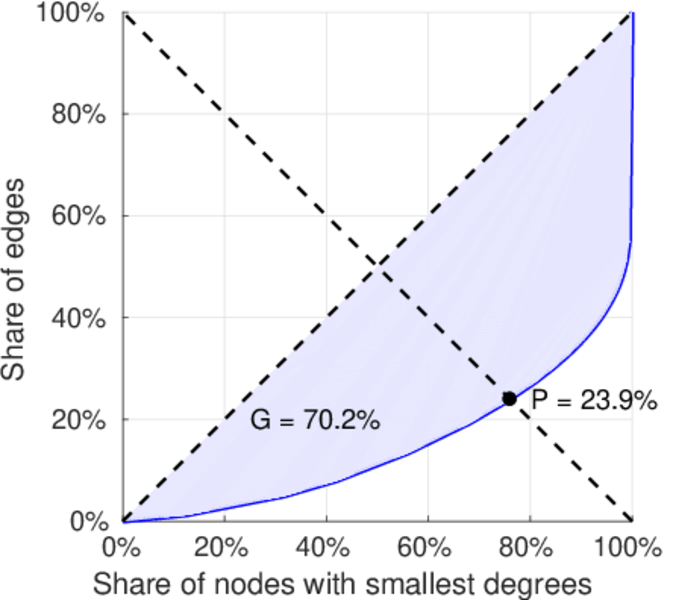
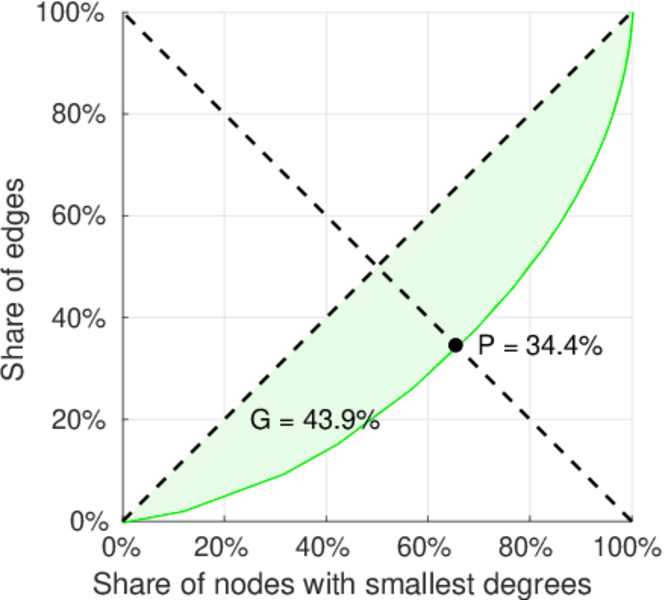
| Gini coefficient | G = | 0.703 310
|
| Balanced inequality ratio | P = | 0.237 873
|
| Left balanced inequality ratio | P1 = | 0.106 660
|
| Right balanced inequality ratio | P2 = | 0.344 325
|
| Relative edge distribution entropy | Her = | 0.739 091
|
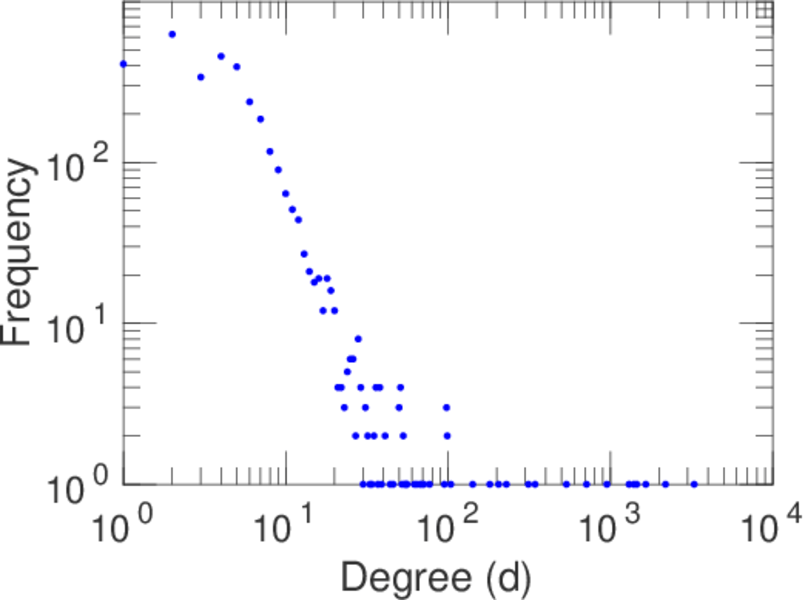
| Power law exponent | γ = | 1.936 40
|
| Tail power law exponent | γt = | 3.631 00
|
| Tail power law exponent with p | γ3 = | 3.631 00
|
| p-value | p = | 0.000 00
|
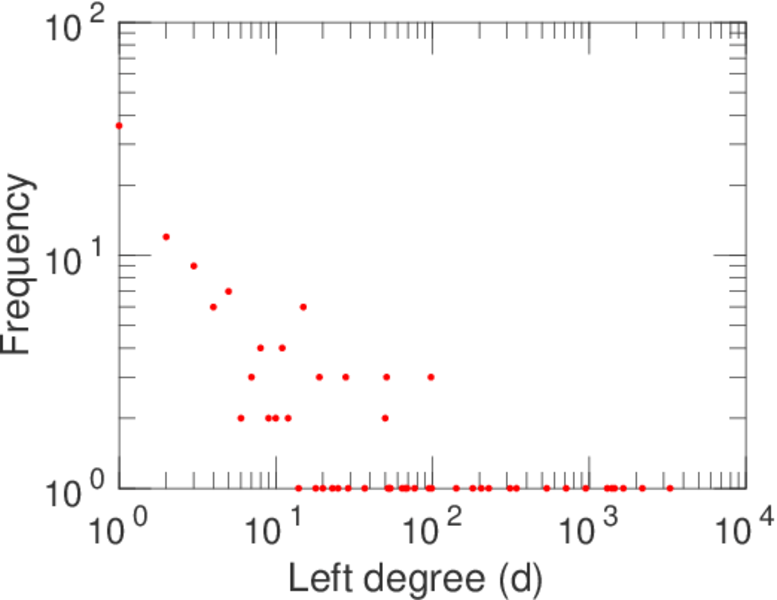
| Left tail power law exponent with p | γ3,1 = | 1.471 00
|
| Left p-value | p1 = | 0.874 000
|
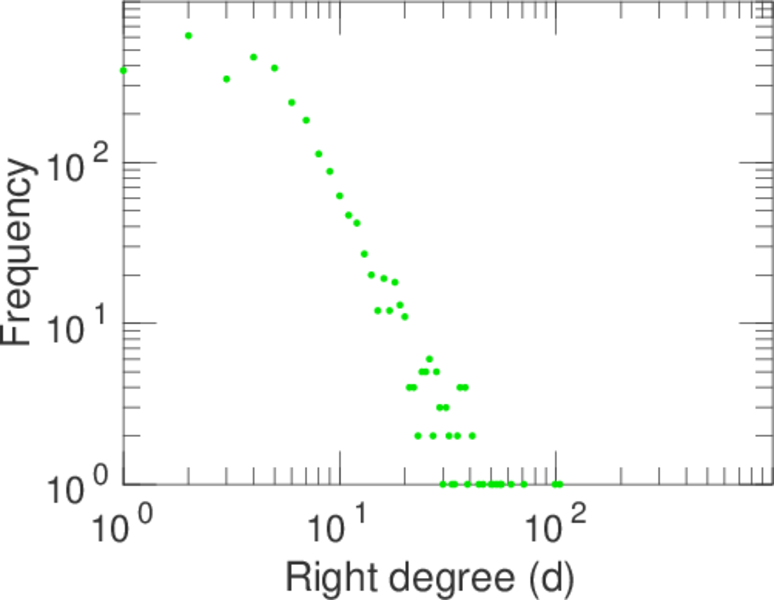
| Right tail power law exponent with p | γ3,2 = | 6.081 00
|
| Right p-value | p2 = | 0.465 000
|
| Degree assortativity | ρ = | −0.204 446
|
| Degree assortativity p-value | pρ = | 3.433 67 × 10−99
|
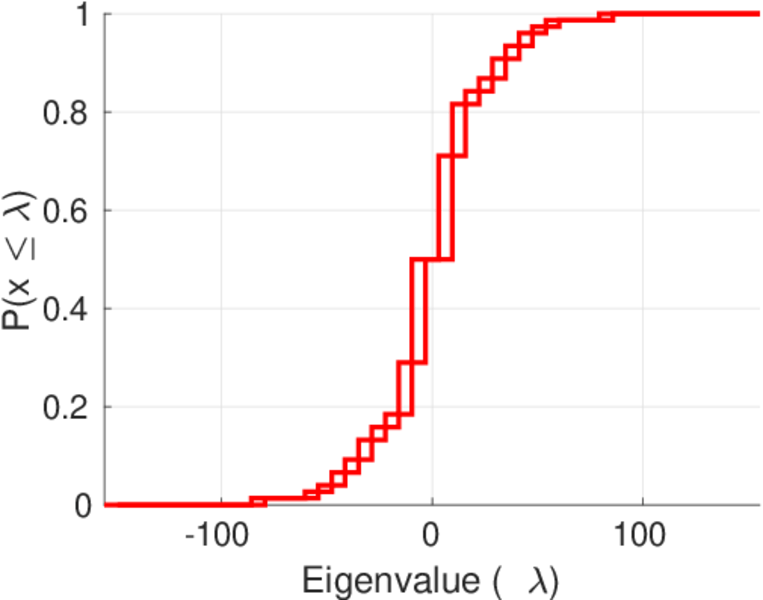
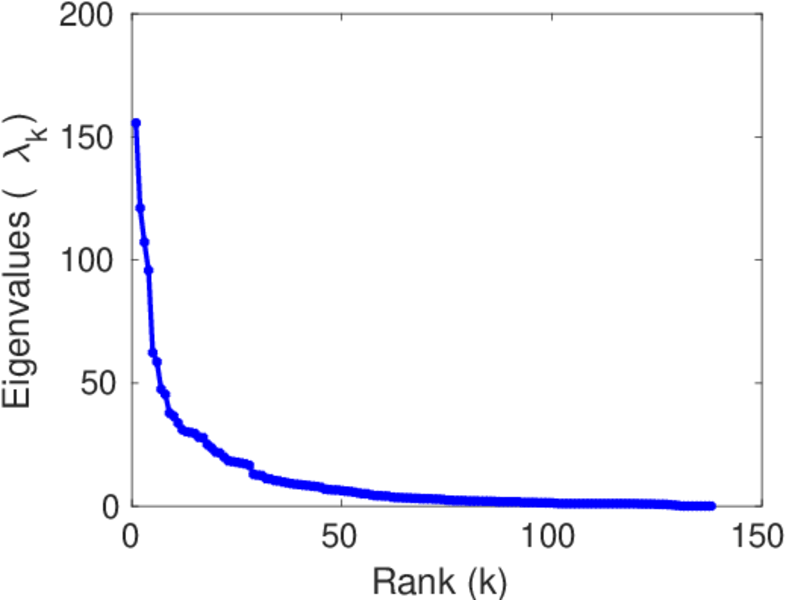
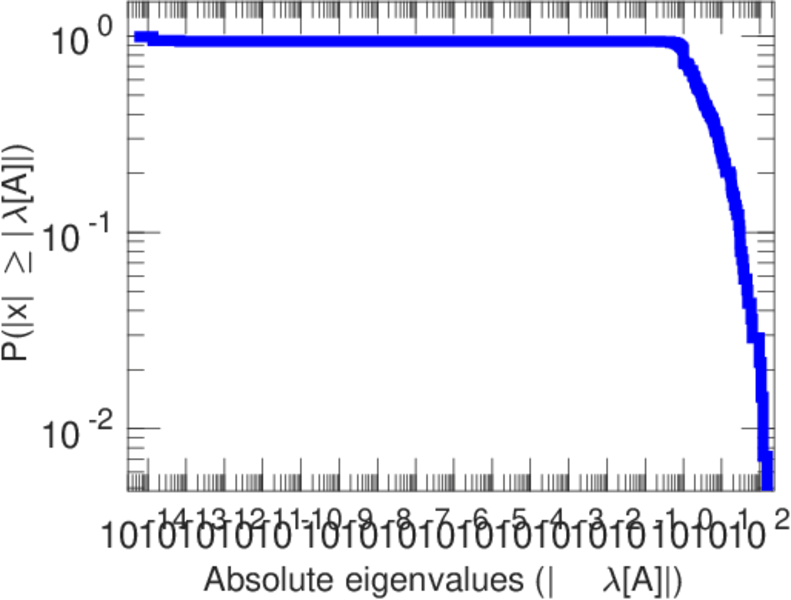
| Spectral norm | α = | 155.554
|
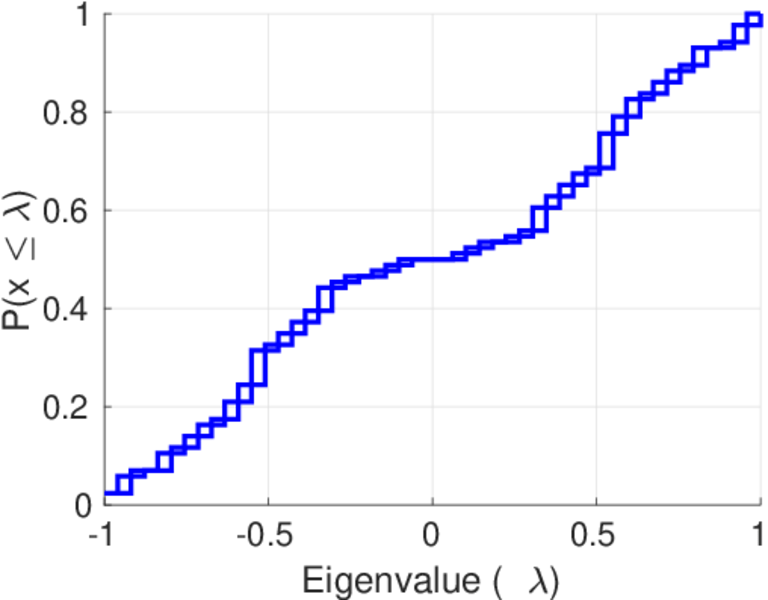
| Algebraic connectivity | a = | 0.241 425
|
| Spectral separation | |λ1[A] / λ2[A]| = | 1.284 80
|
| Controllability | C = | 3,005
|
| Relative controllability | Cr = | 0.920 368
|
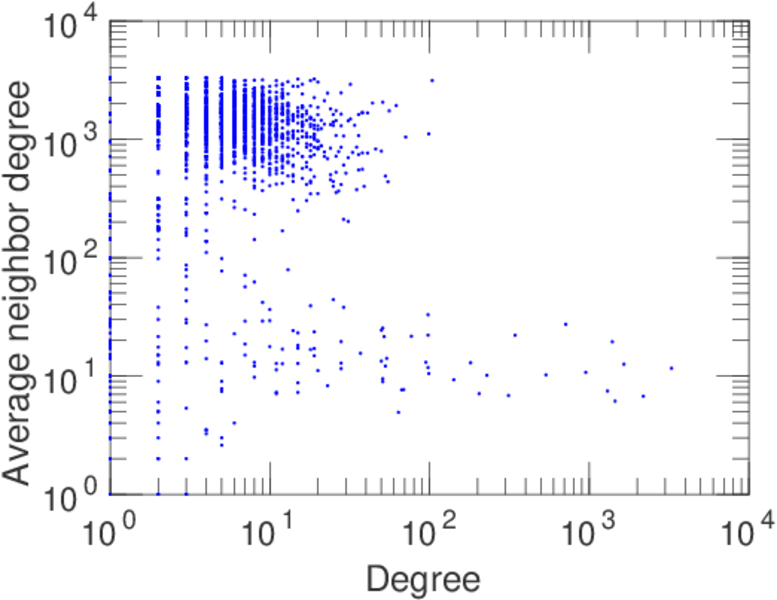
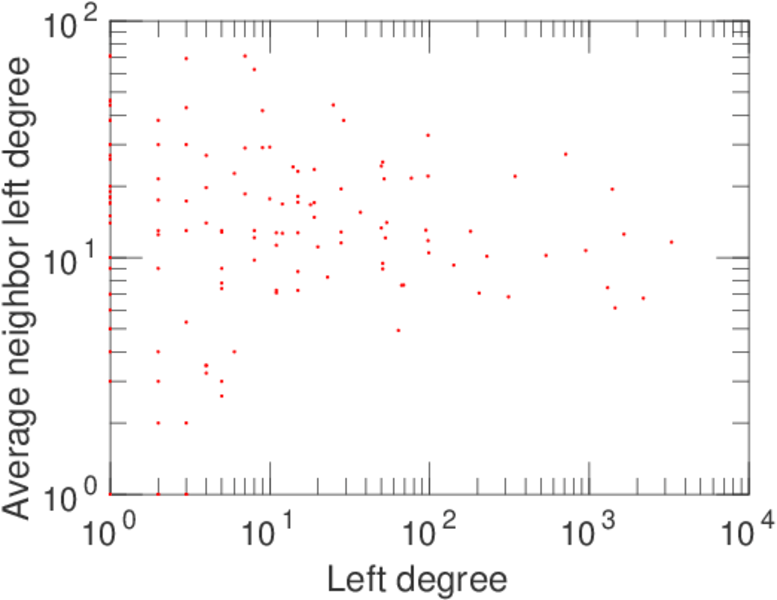
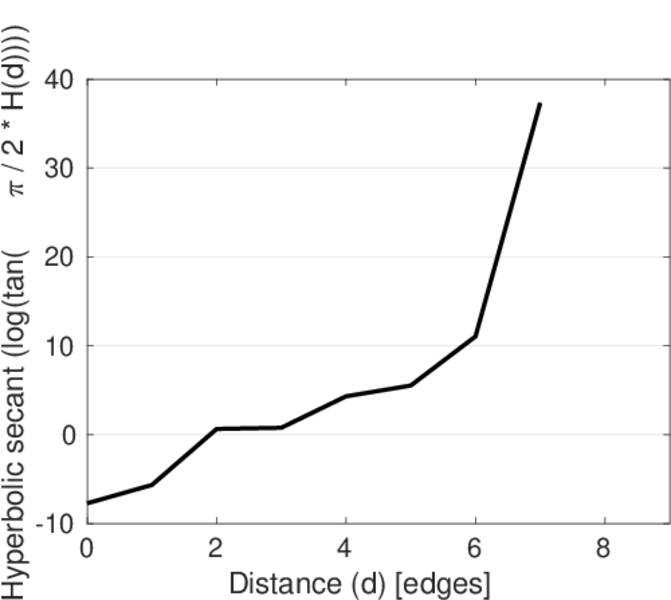
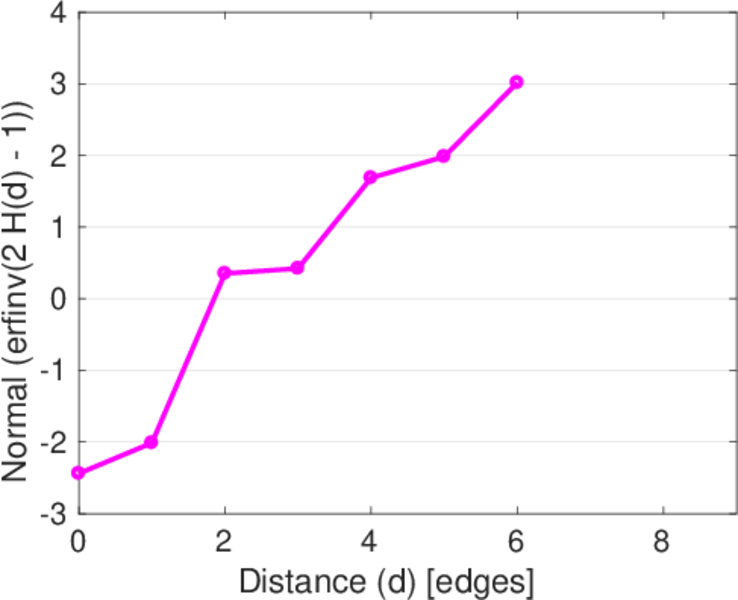
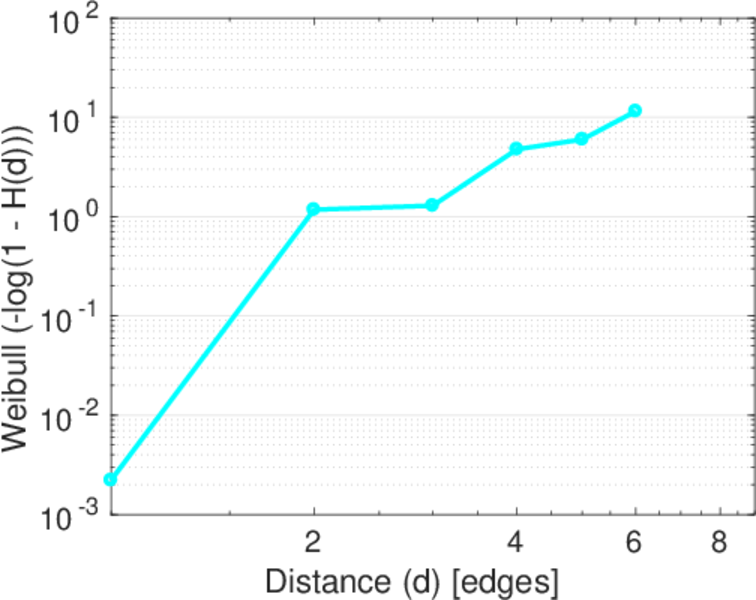
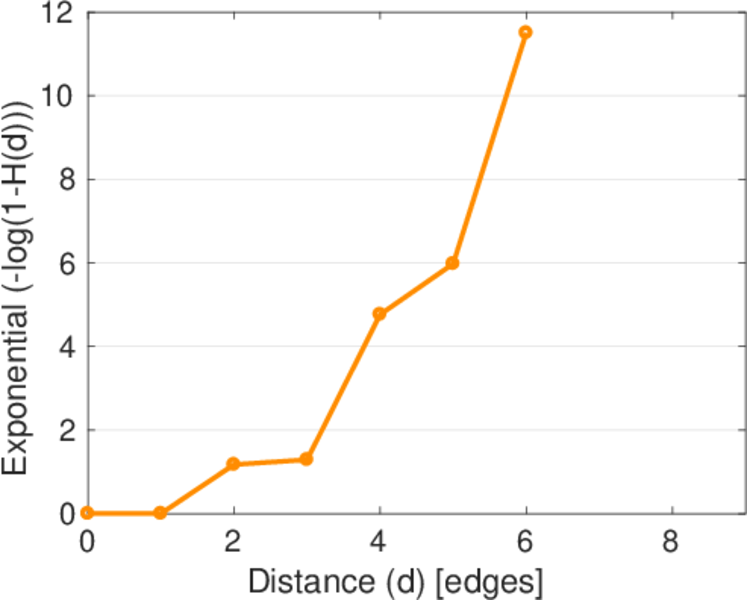
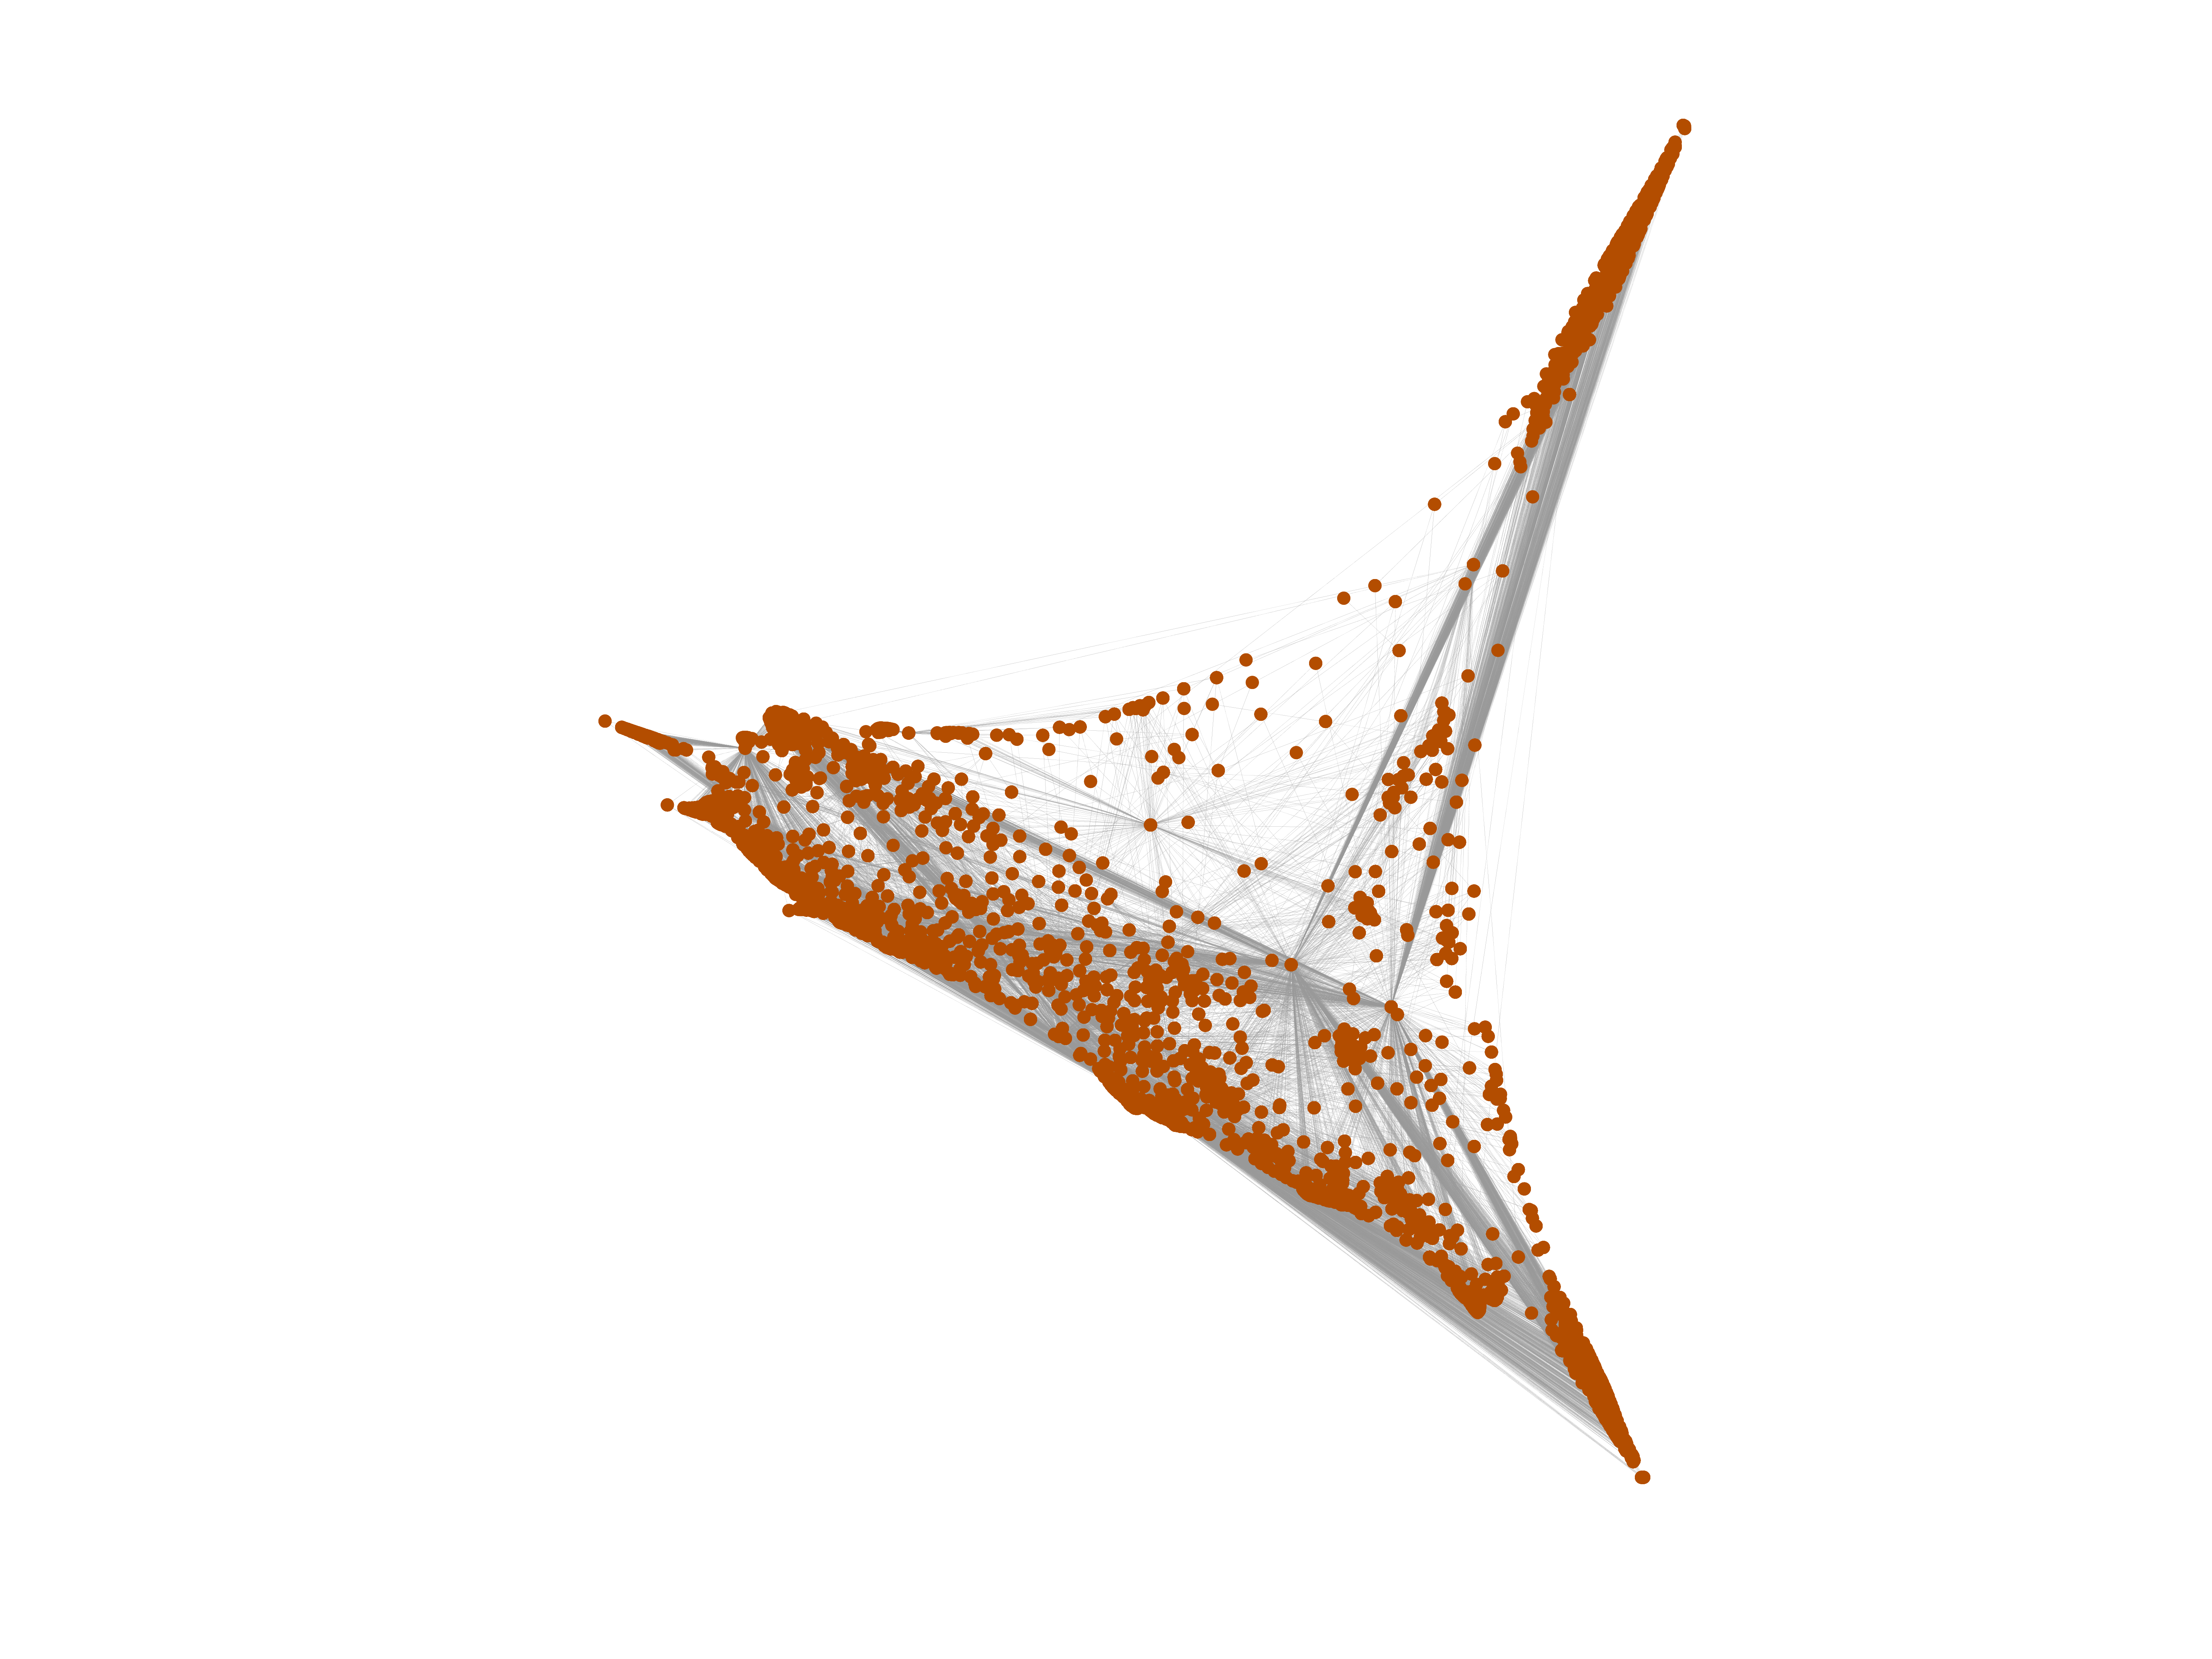
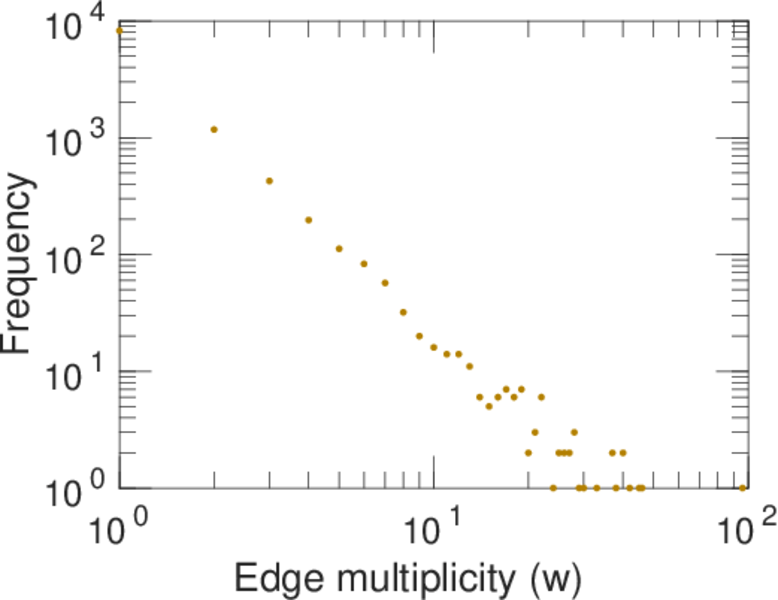
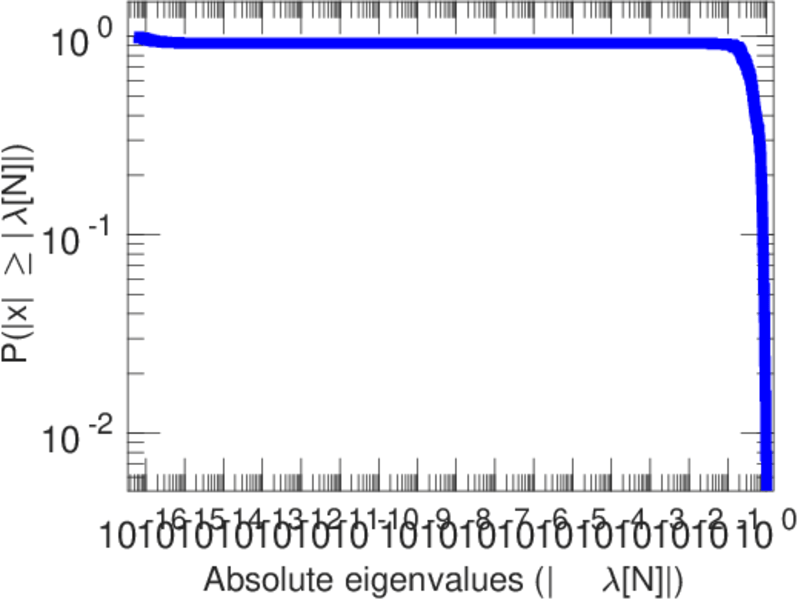
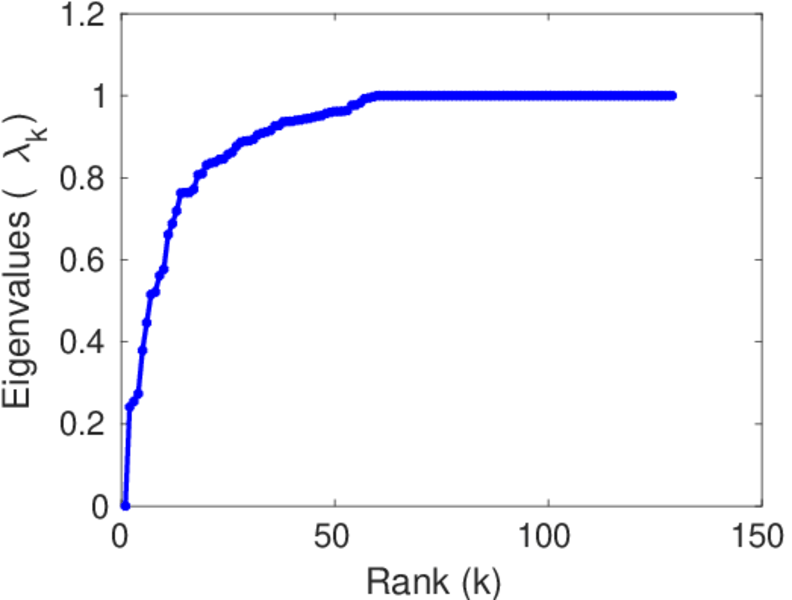
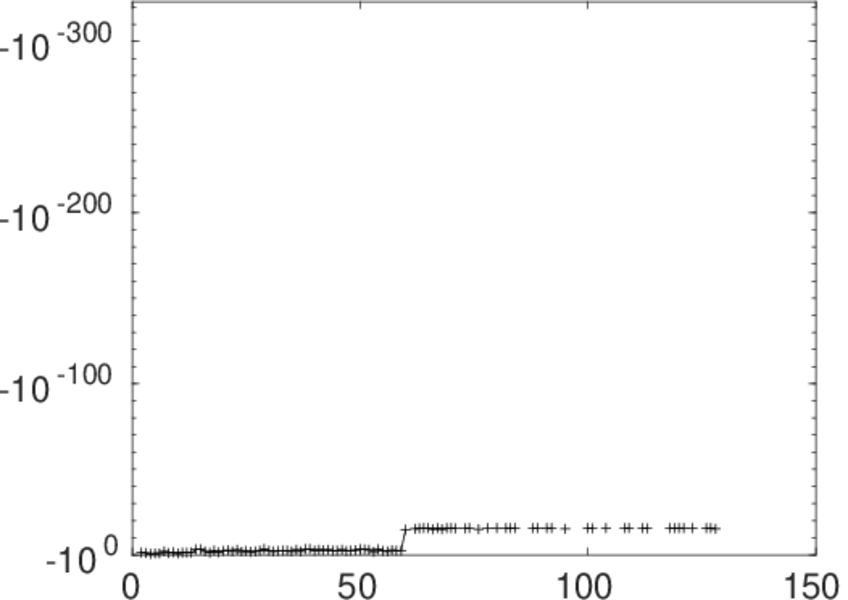
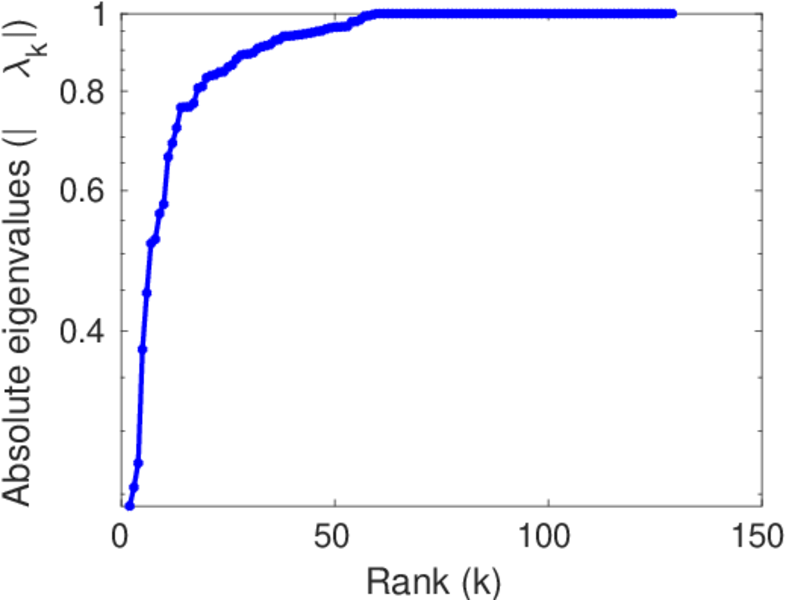
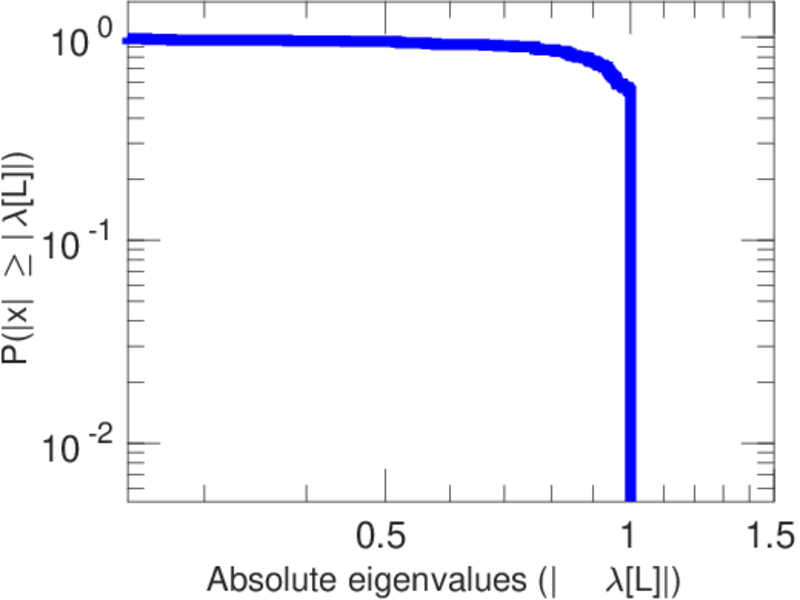
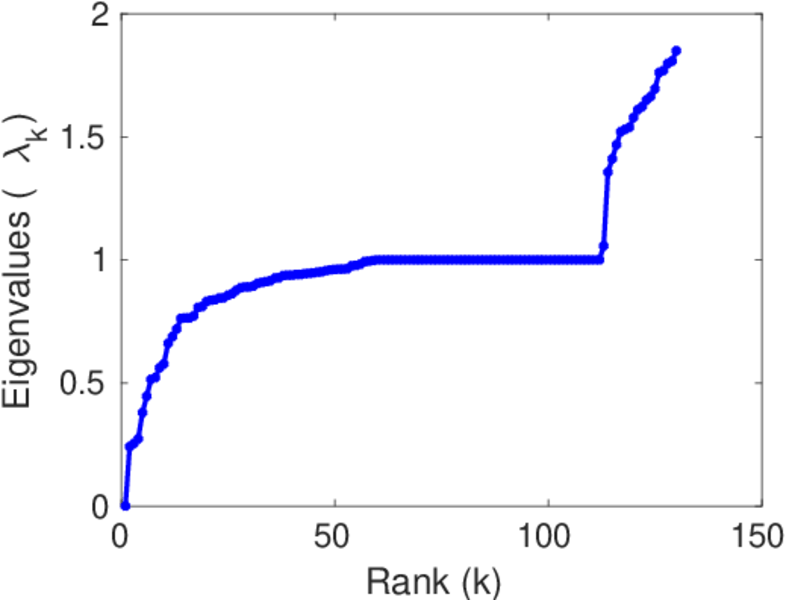
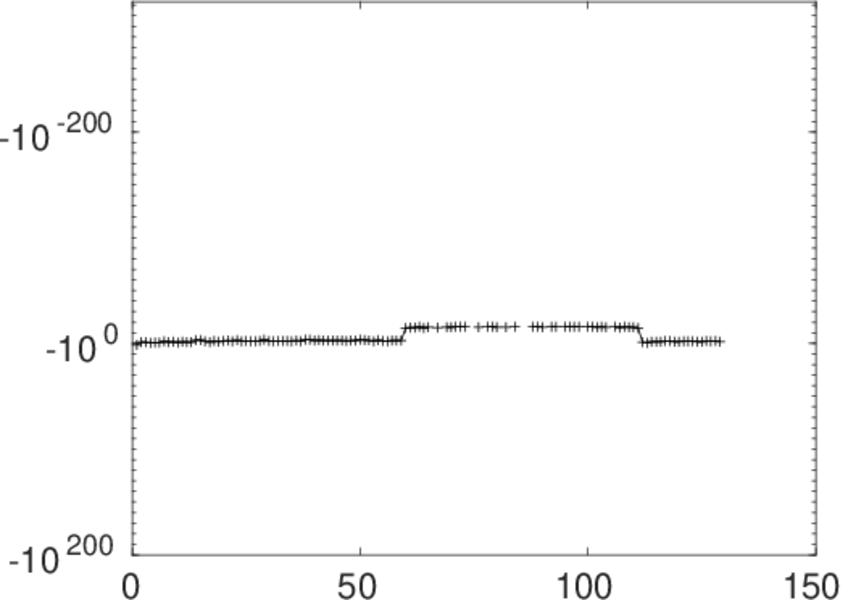
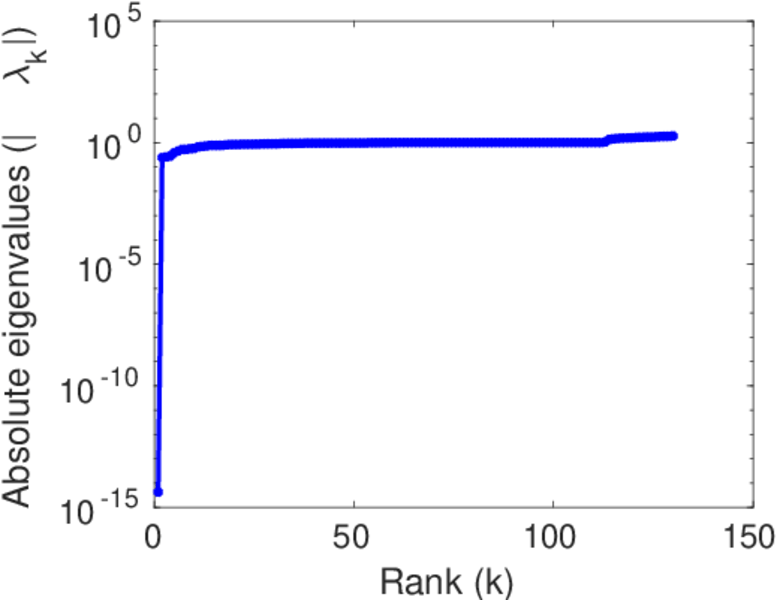
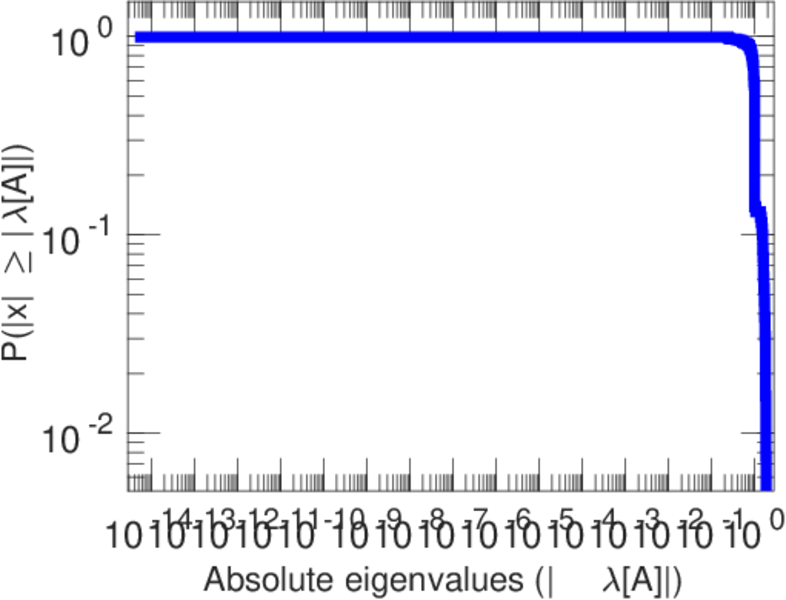
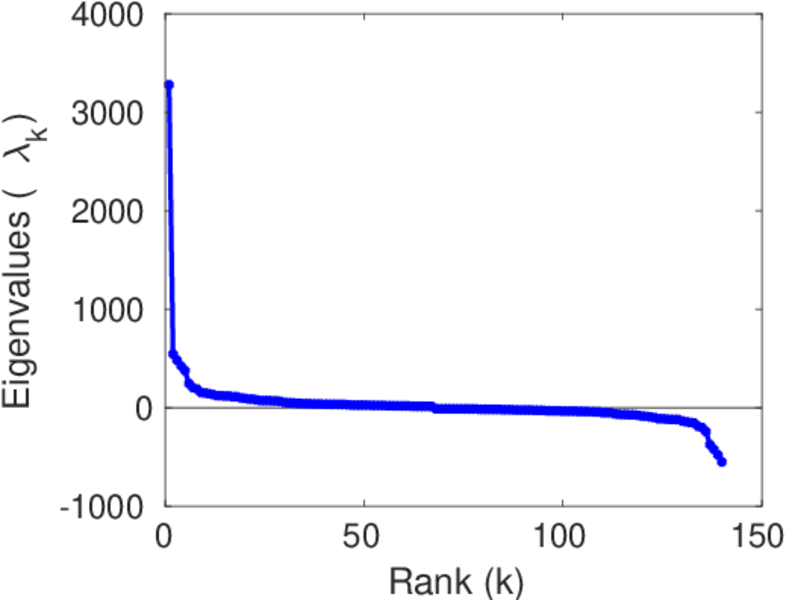
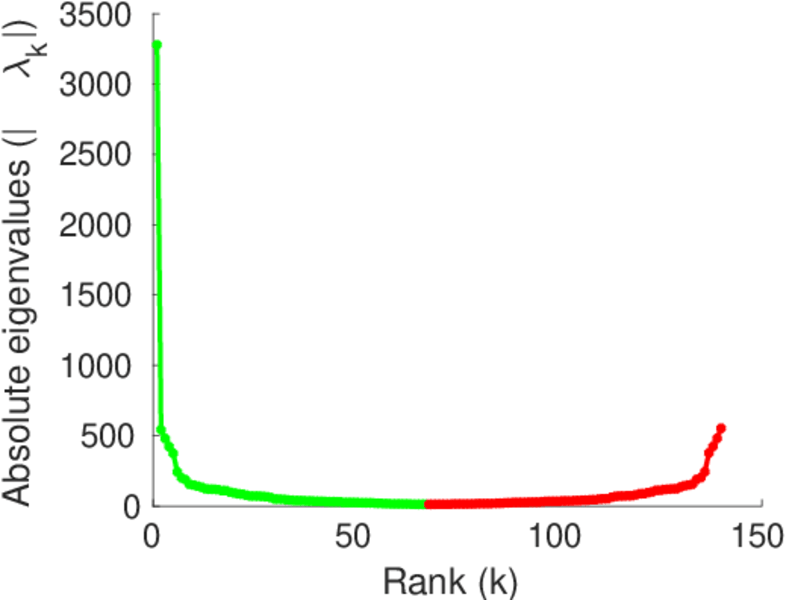
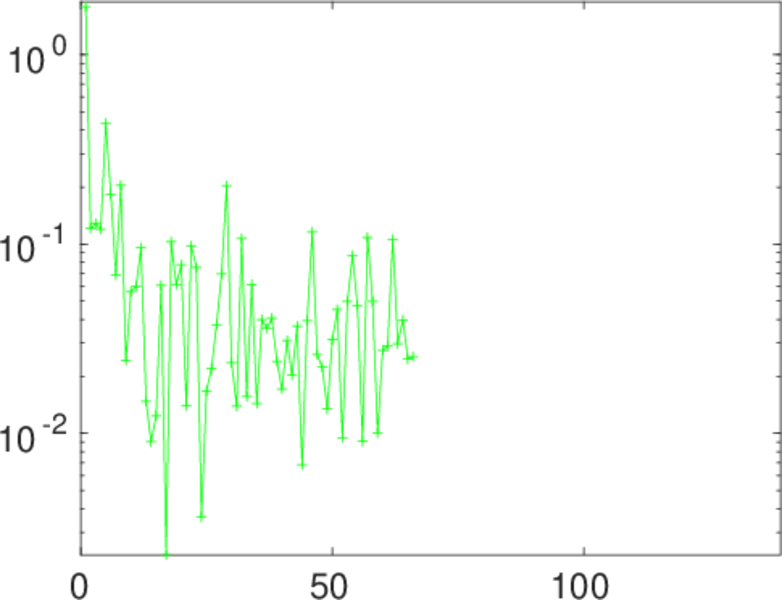
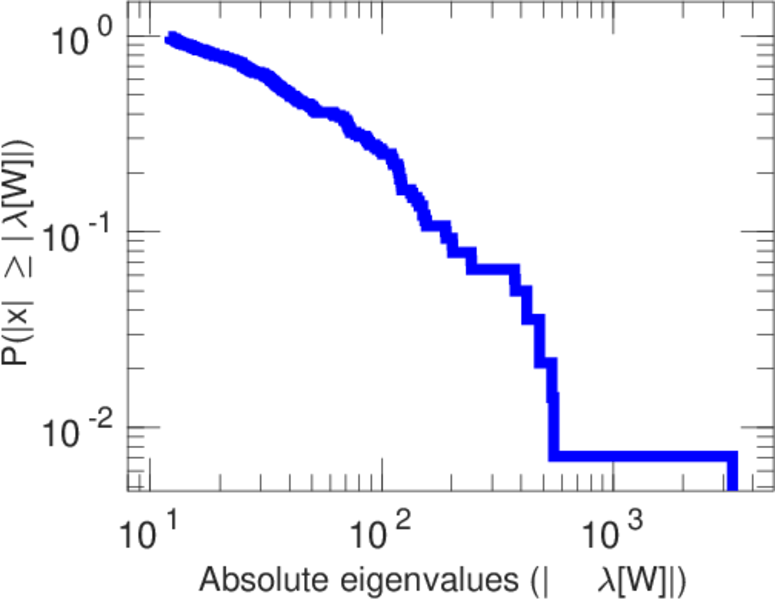
Plots


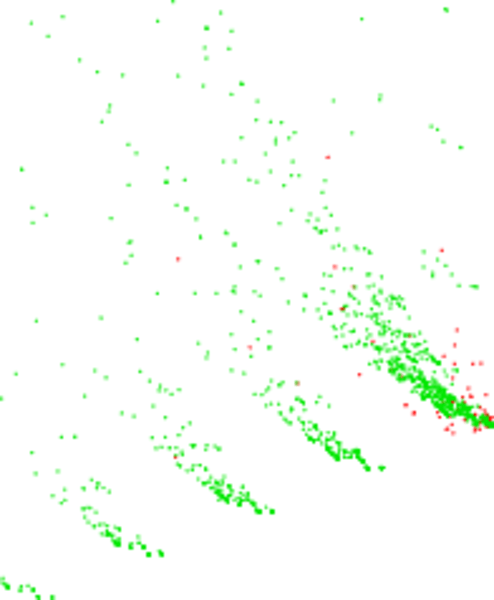
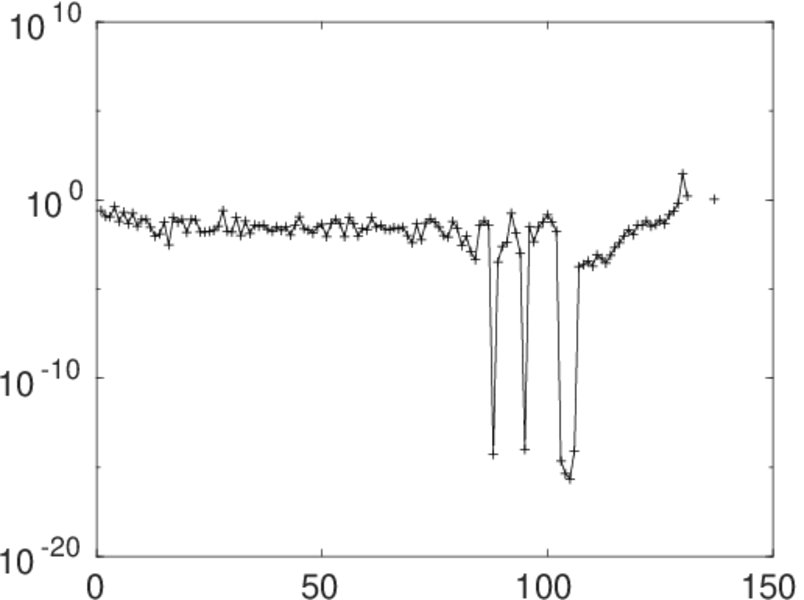
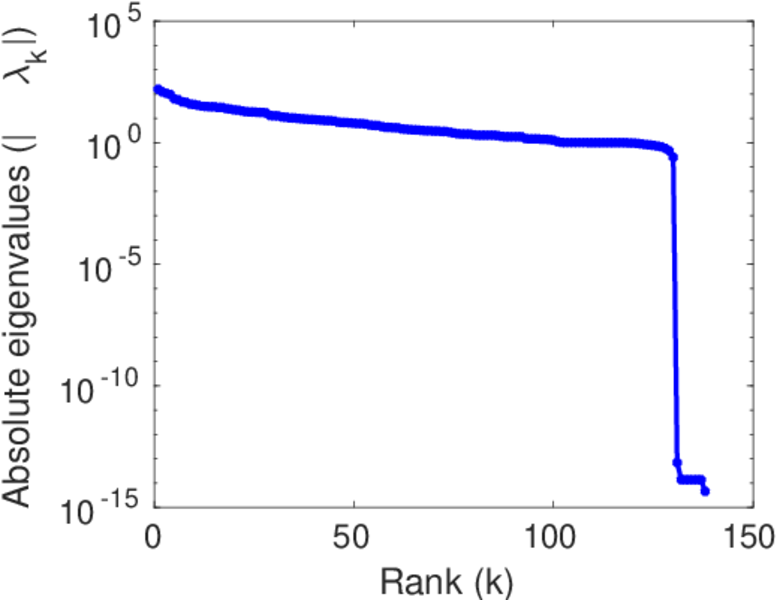
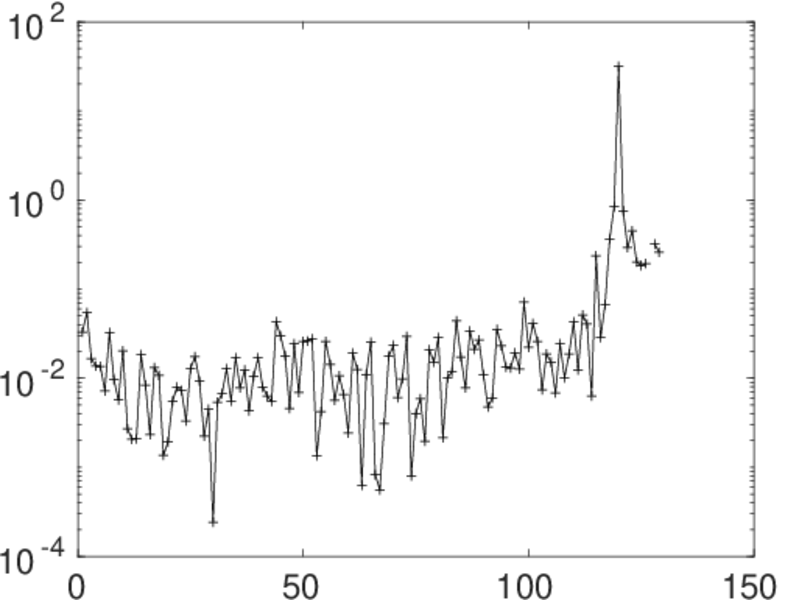
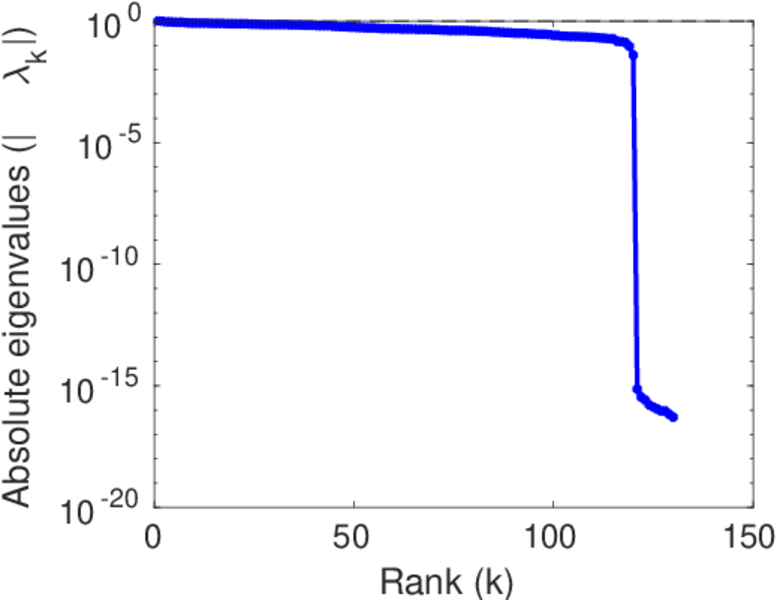
Matrix decompositions plots


Downloads
References
|
[1]
|
Jérôme Kunegis.
KONECT – The Koblenz Network Collection.
In Proc. Int. Conf. on World Wide Web Companion, pages
1343–1350, 2013.
[ http ]
|
|
[2]
|
Wikimedia Foundation.
Wikimedia downloads.
http://dumps.wikimedia.org/, January 2010.
|
 KONECT ‣ Networks ‣
Buy Me a Coffee
KONECT ‣ Networks ‣
Buy Me a Coffee