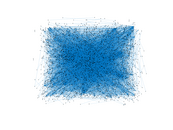
Wikipedia edits (om)
This is the bipartite edit network of the Oromo Wikipedia. It contains users
and pages from the Oromo Wikipedia, connected by edit events. Each edge
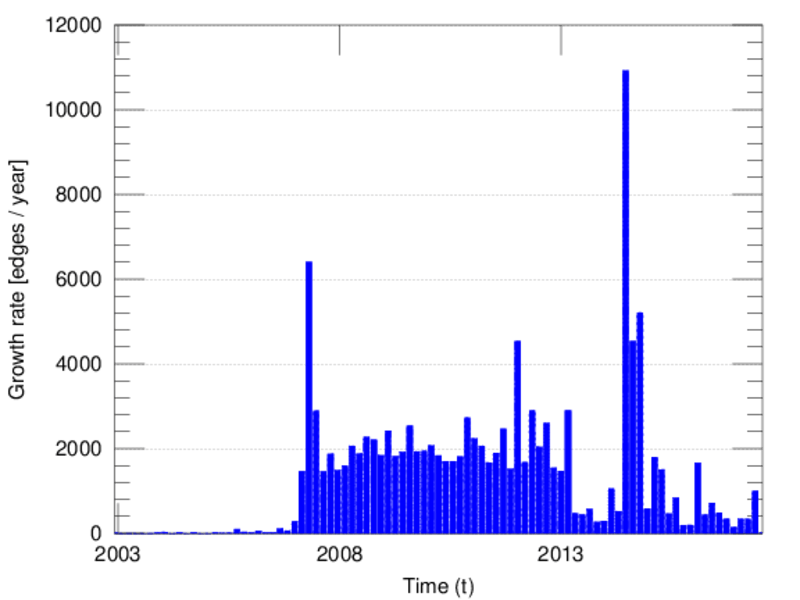
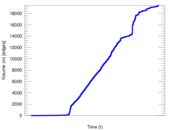
represents an edit. The dataset includes the timestamp of each edit.
Metadata
Statistics
| Size | n = | 3,582
|
| Left size | n1 = | 630
|
| Right size | n2 = | 2,952
|
| Volume | m = | 19,420
|
| Unique edge count | m̿ = | 7,835
|
| Wedge count | s = | 777,752
|
| Claw count | z = | 110,078,440
|
| Cross count | x = | 15,956,457,500
|
| Square count | q = | 928,008
|
| 4-Tour count | T4 = | 10,551,710
|
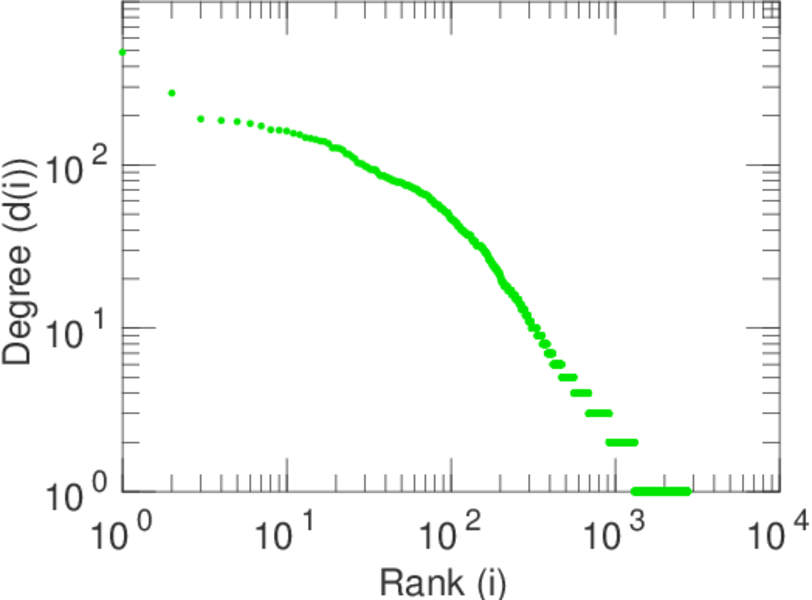
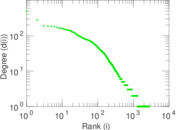
| Maximum degree | dmax = | 2,122
|
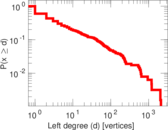
| Maximum left degree | d1max = | 2,122
|
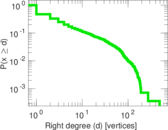
| Maximum right degree | d2max = | 489
|
| Average degree | d = | 10.843 1
|
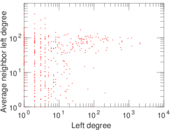
| Average left degree | d1 = | 30.825 4
|
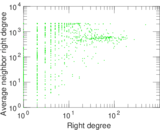
| Average right degree | d2 = | 6.578 59
|
| Fill | p = | 0.004 212 91
|
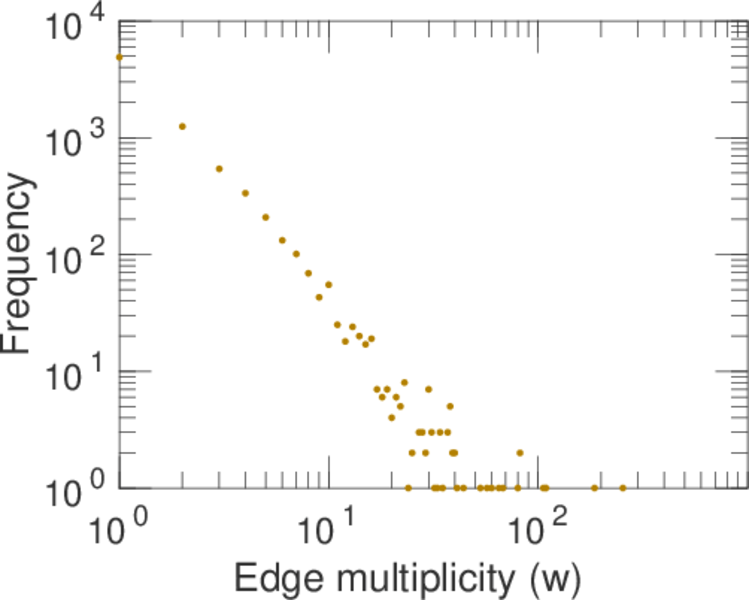
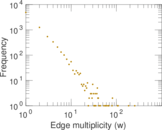
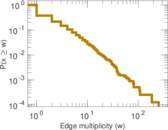
| Average edge multiplicity | m̃ = | 2.478 62
|
| Size of LCC | N = | 2,828
|
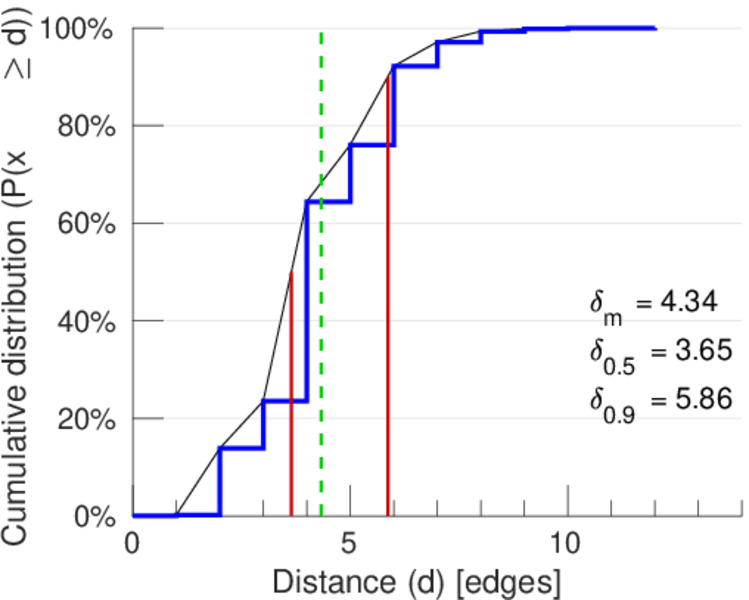
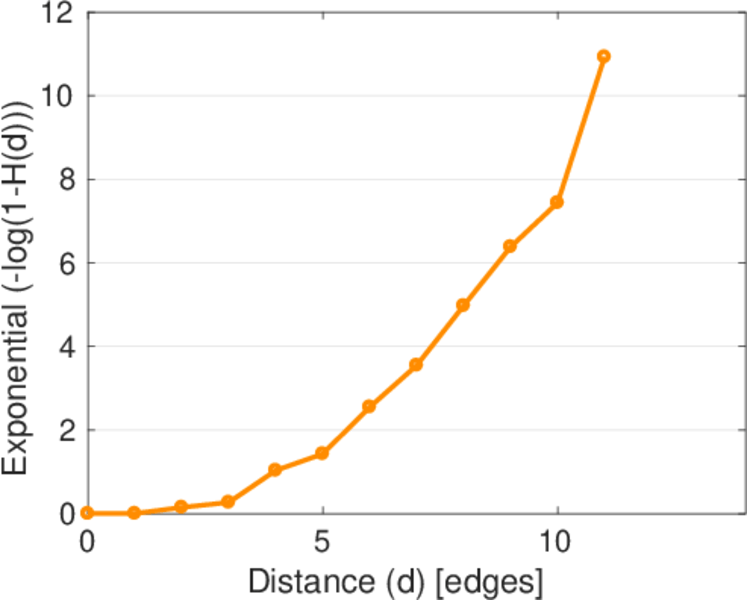
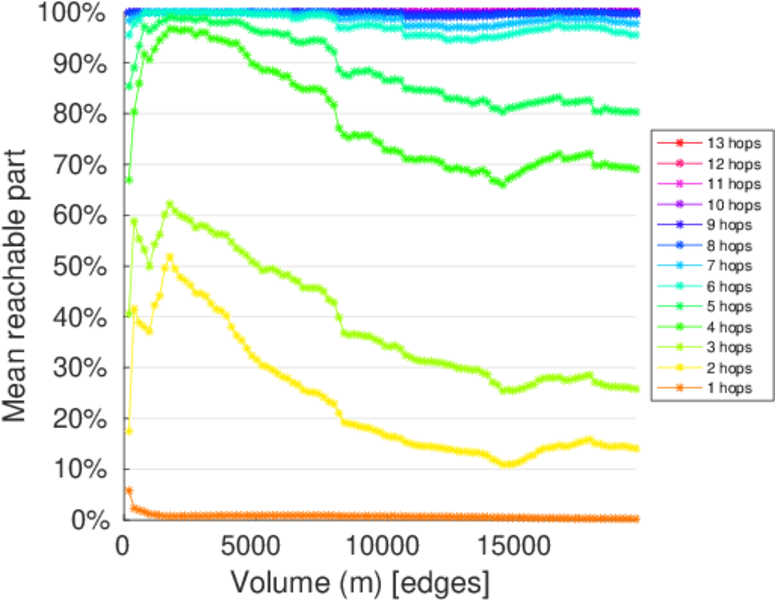
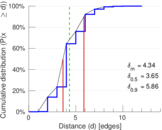
| Diameter | δ = | 13
|
| 50-Percentile effective diameter | δ0.5 = | 3.647 59
|
| 90-Percentile effective diameter | δ0.9 = | 5.864 74
|
| Median distance | δM = | 4
|
| Mean distance | δm = | 4.335 98
|
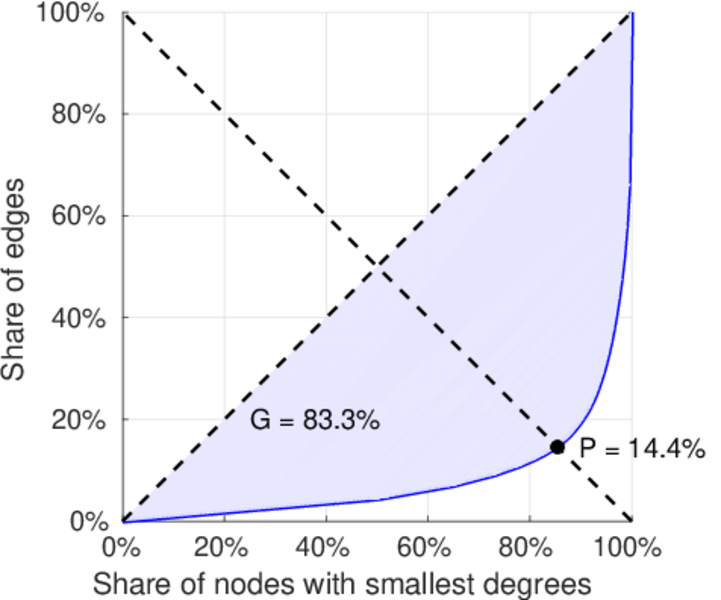
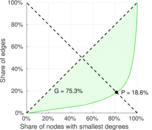
| Gini coefficient | G = | 0.835 647
|
| Balanced inequality ratio | P = | 0.142 636
|
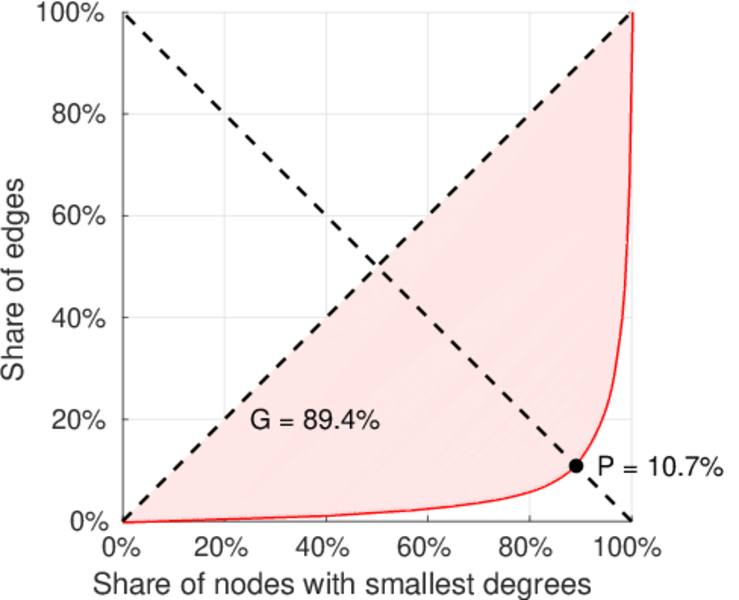
| Left balanced inequality ratio | P1 = | 0.107 158
|
| Right balanced inequality ratio | P2 = | 0.185 994
|
| Relative edge distribution entropy | Her = | 0.806 564
|
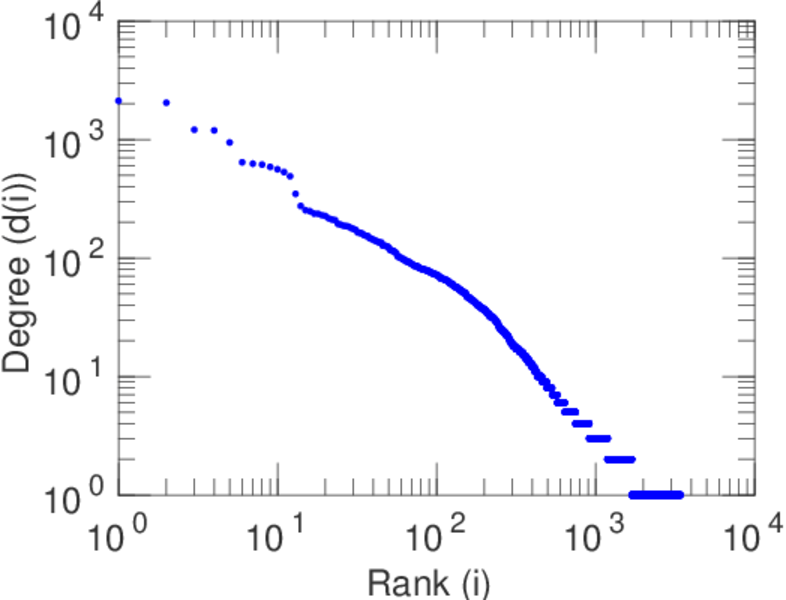
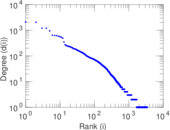
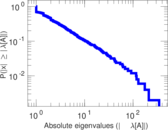
| Power law exponent | γ = | 2.913 57
|
| Tail power law exponent | γt = | 2.061 00
|
| Tail power law exponent with p | γ3 = | 2.061 00
|
| p-value | p = | 0.000 00
|
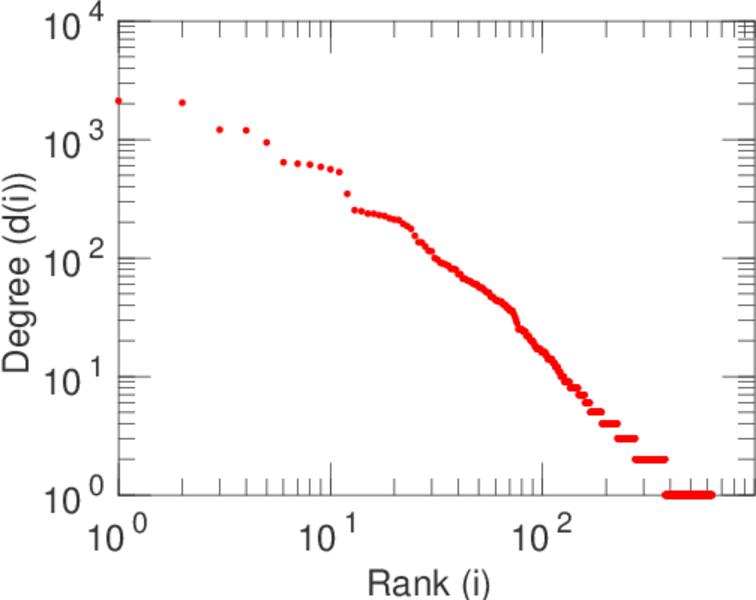
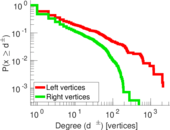
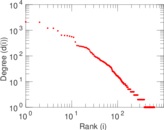
| Left tail power law exponent with p | γ3,1 = | 1.671 00
|
| Left p-value | p1 = | 0.061 000 0
|
| Right tail power law exponent with p | γ3,2 = | 2.221 00
|
| Right p-value | p2 = | 0.000 00
|
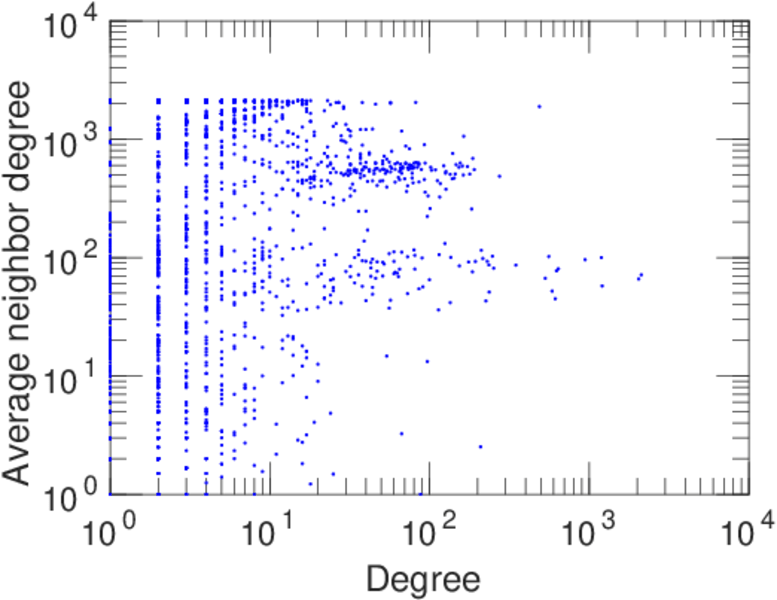
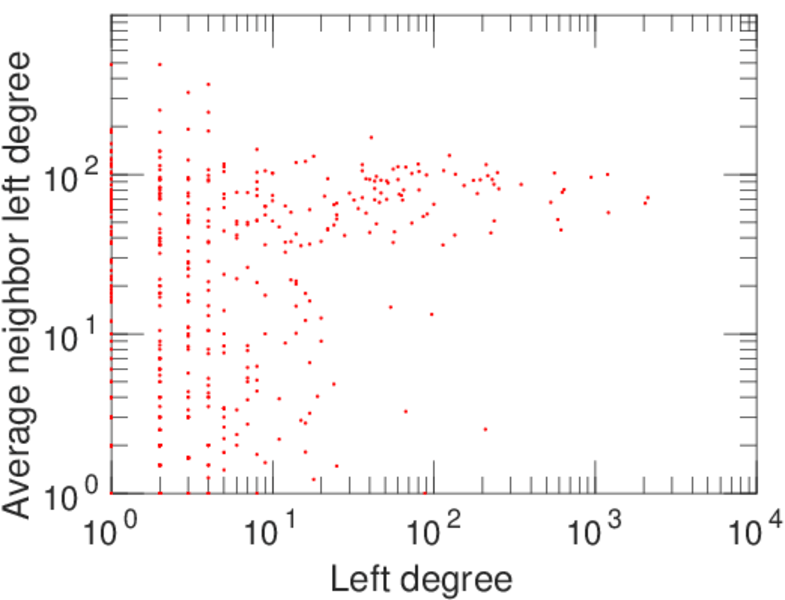
| Degree assortativity | ρ = | −0.338 432
|
| Degree assortativity p-value | pρ = | 3.307 87 × 10−209
|
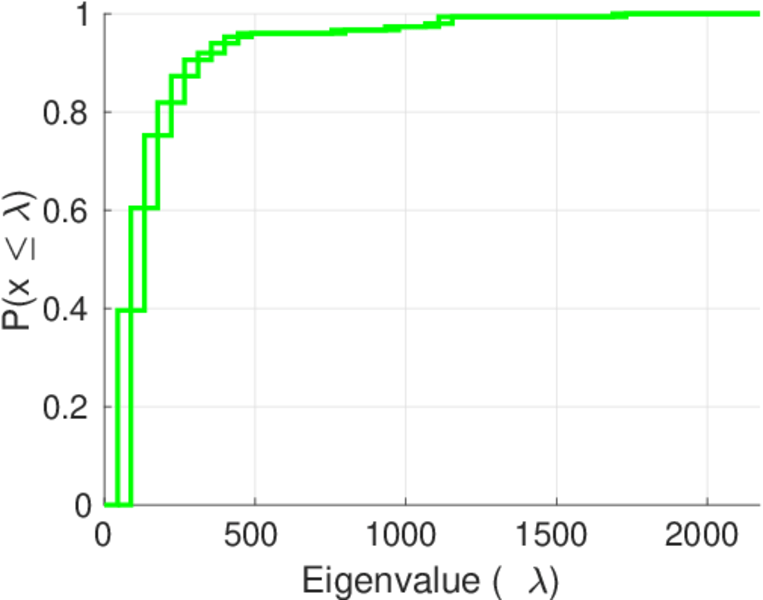
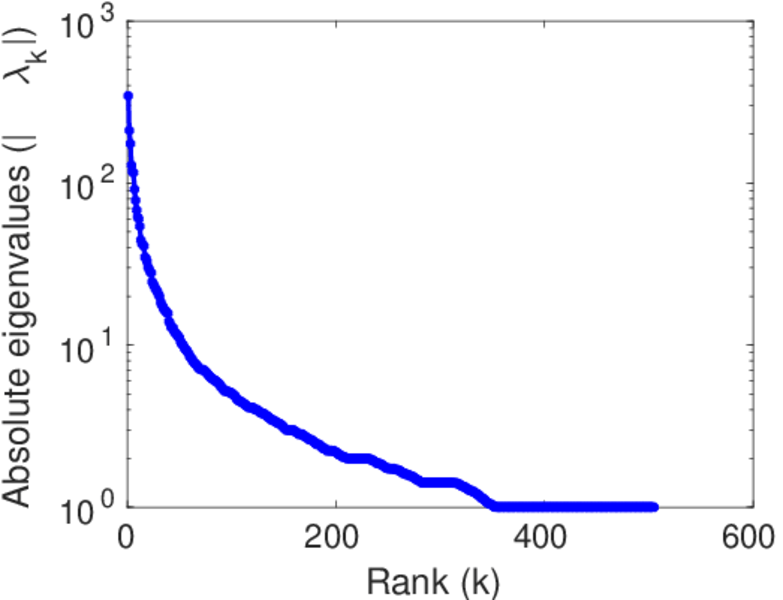
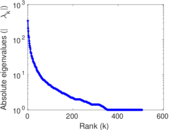
| Spectral norm | α = | 345.166
|
| Algebraic connectivity | a = | 0.026 094 6
|
| Spectral separation | |λ1[A] / λ2[A]| = | 1.634 26
|
| Controllability | C = | 2,203
|
| Relative controllability | Cr = | 0.647 751
|
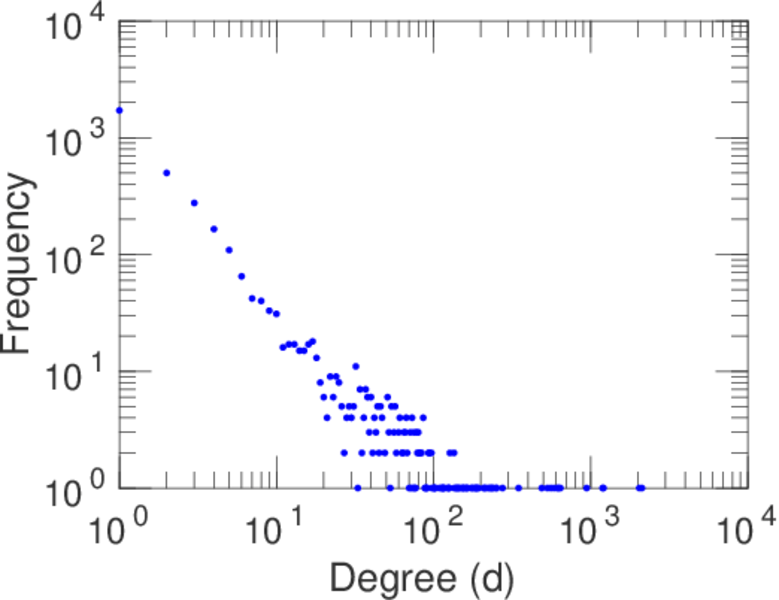
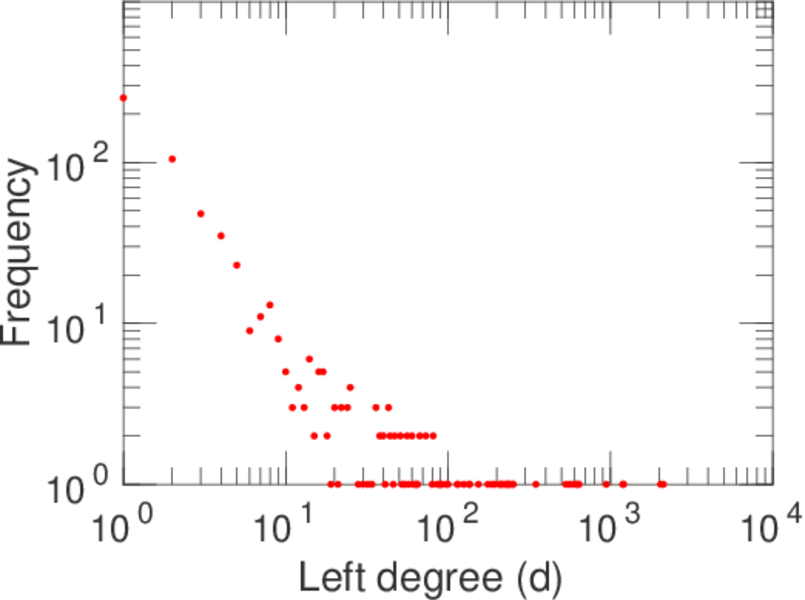
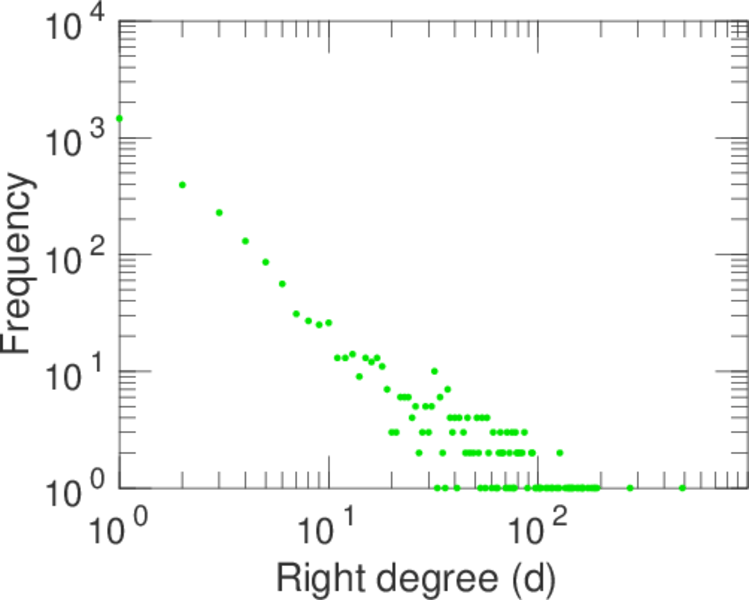
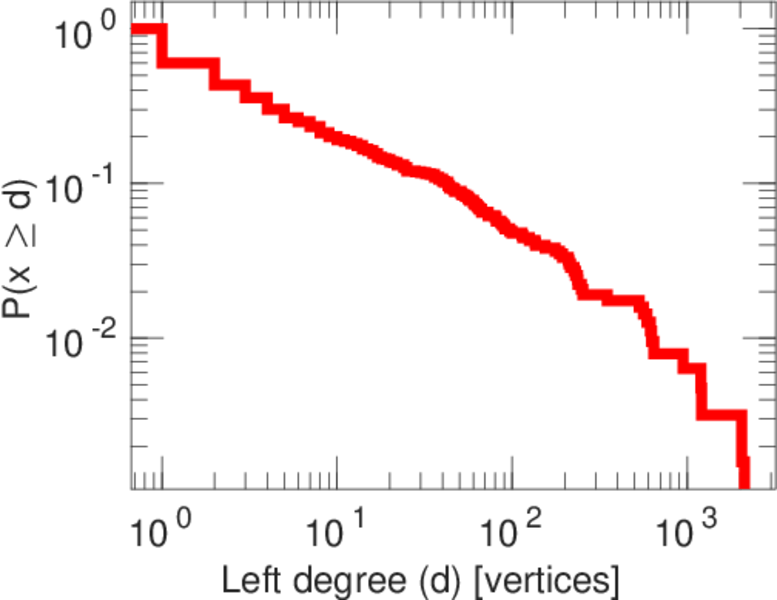
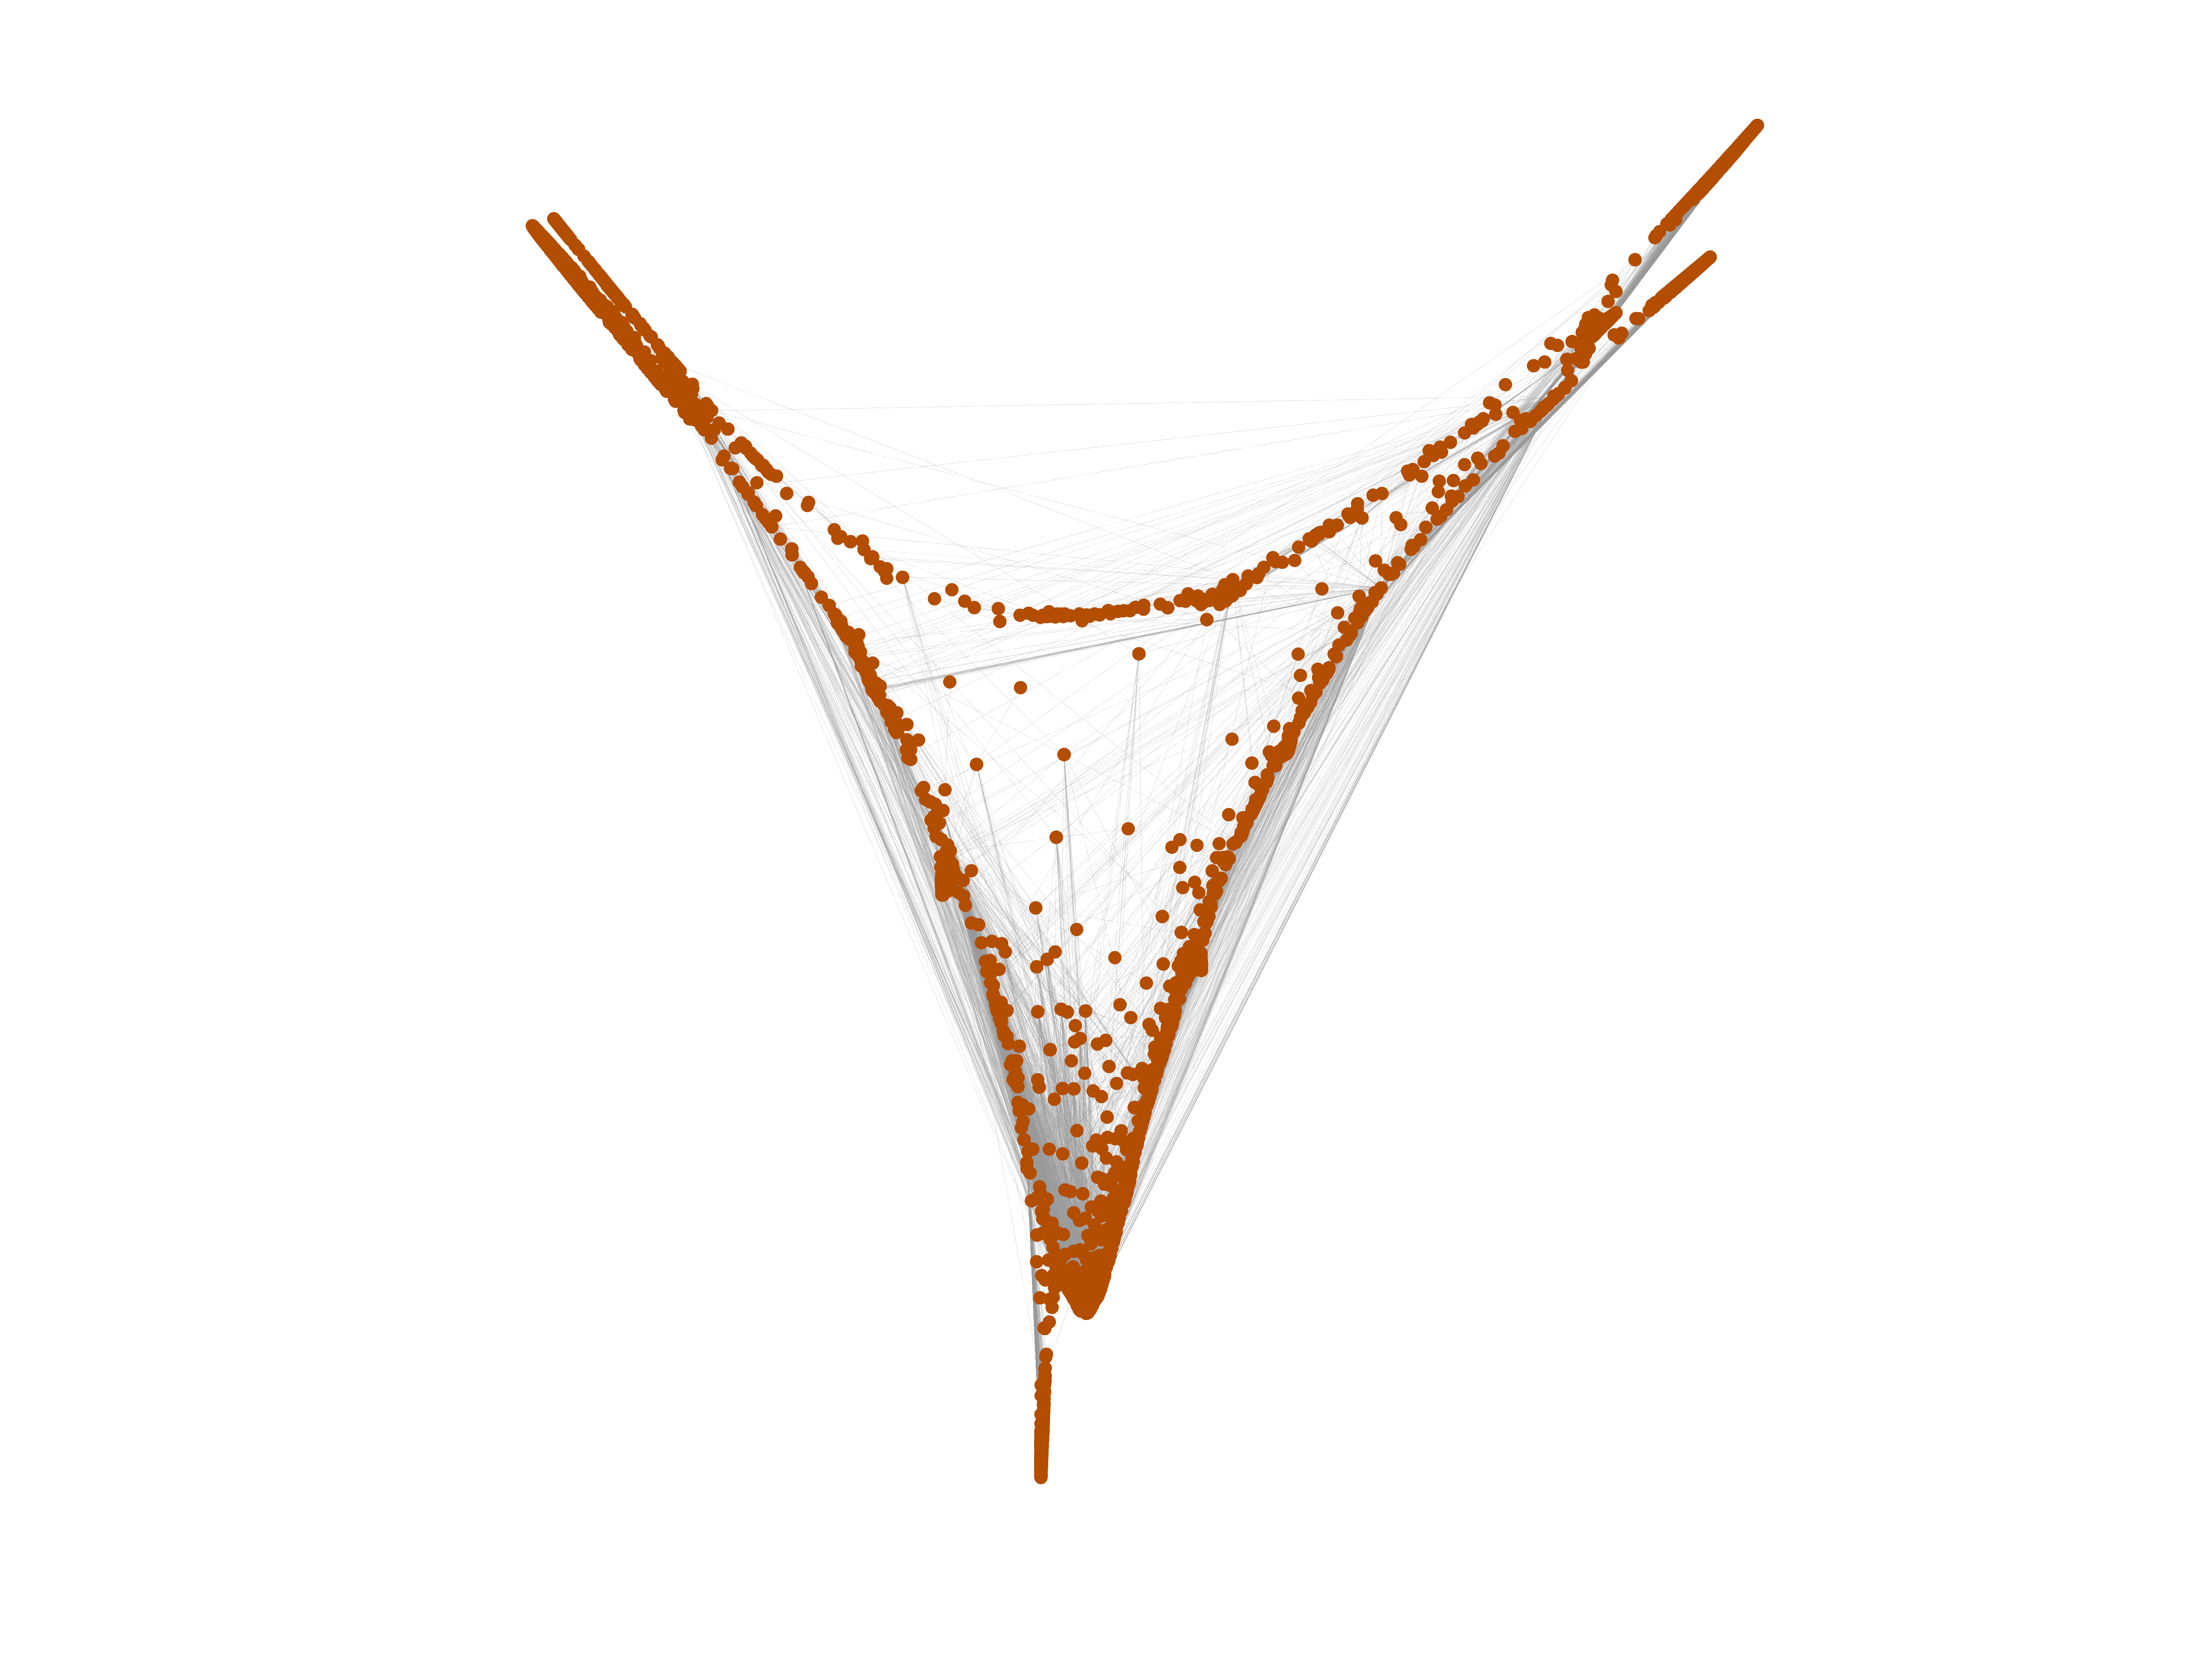
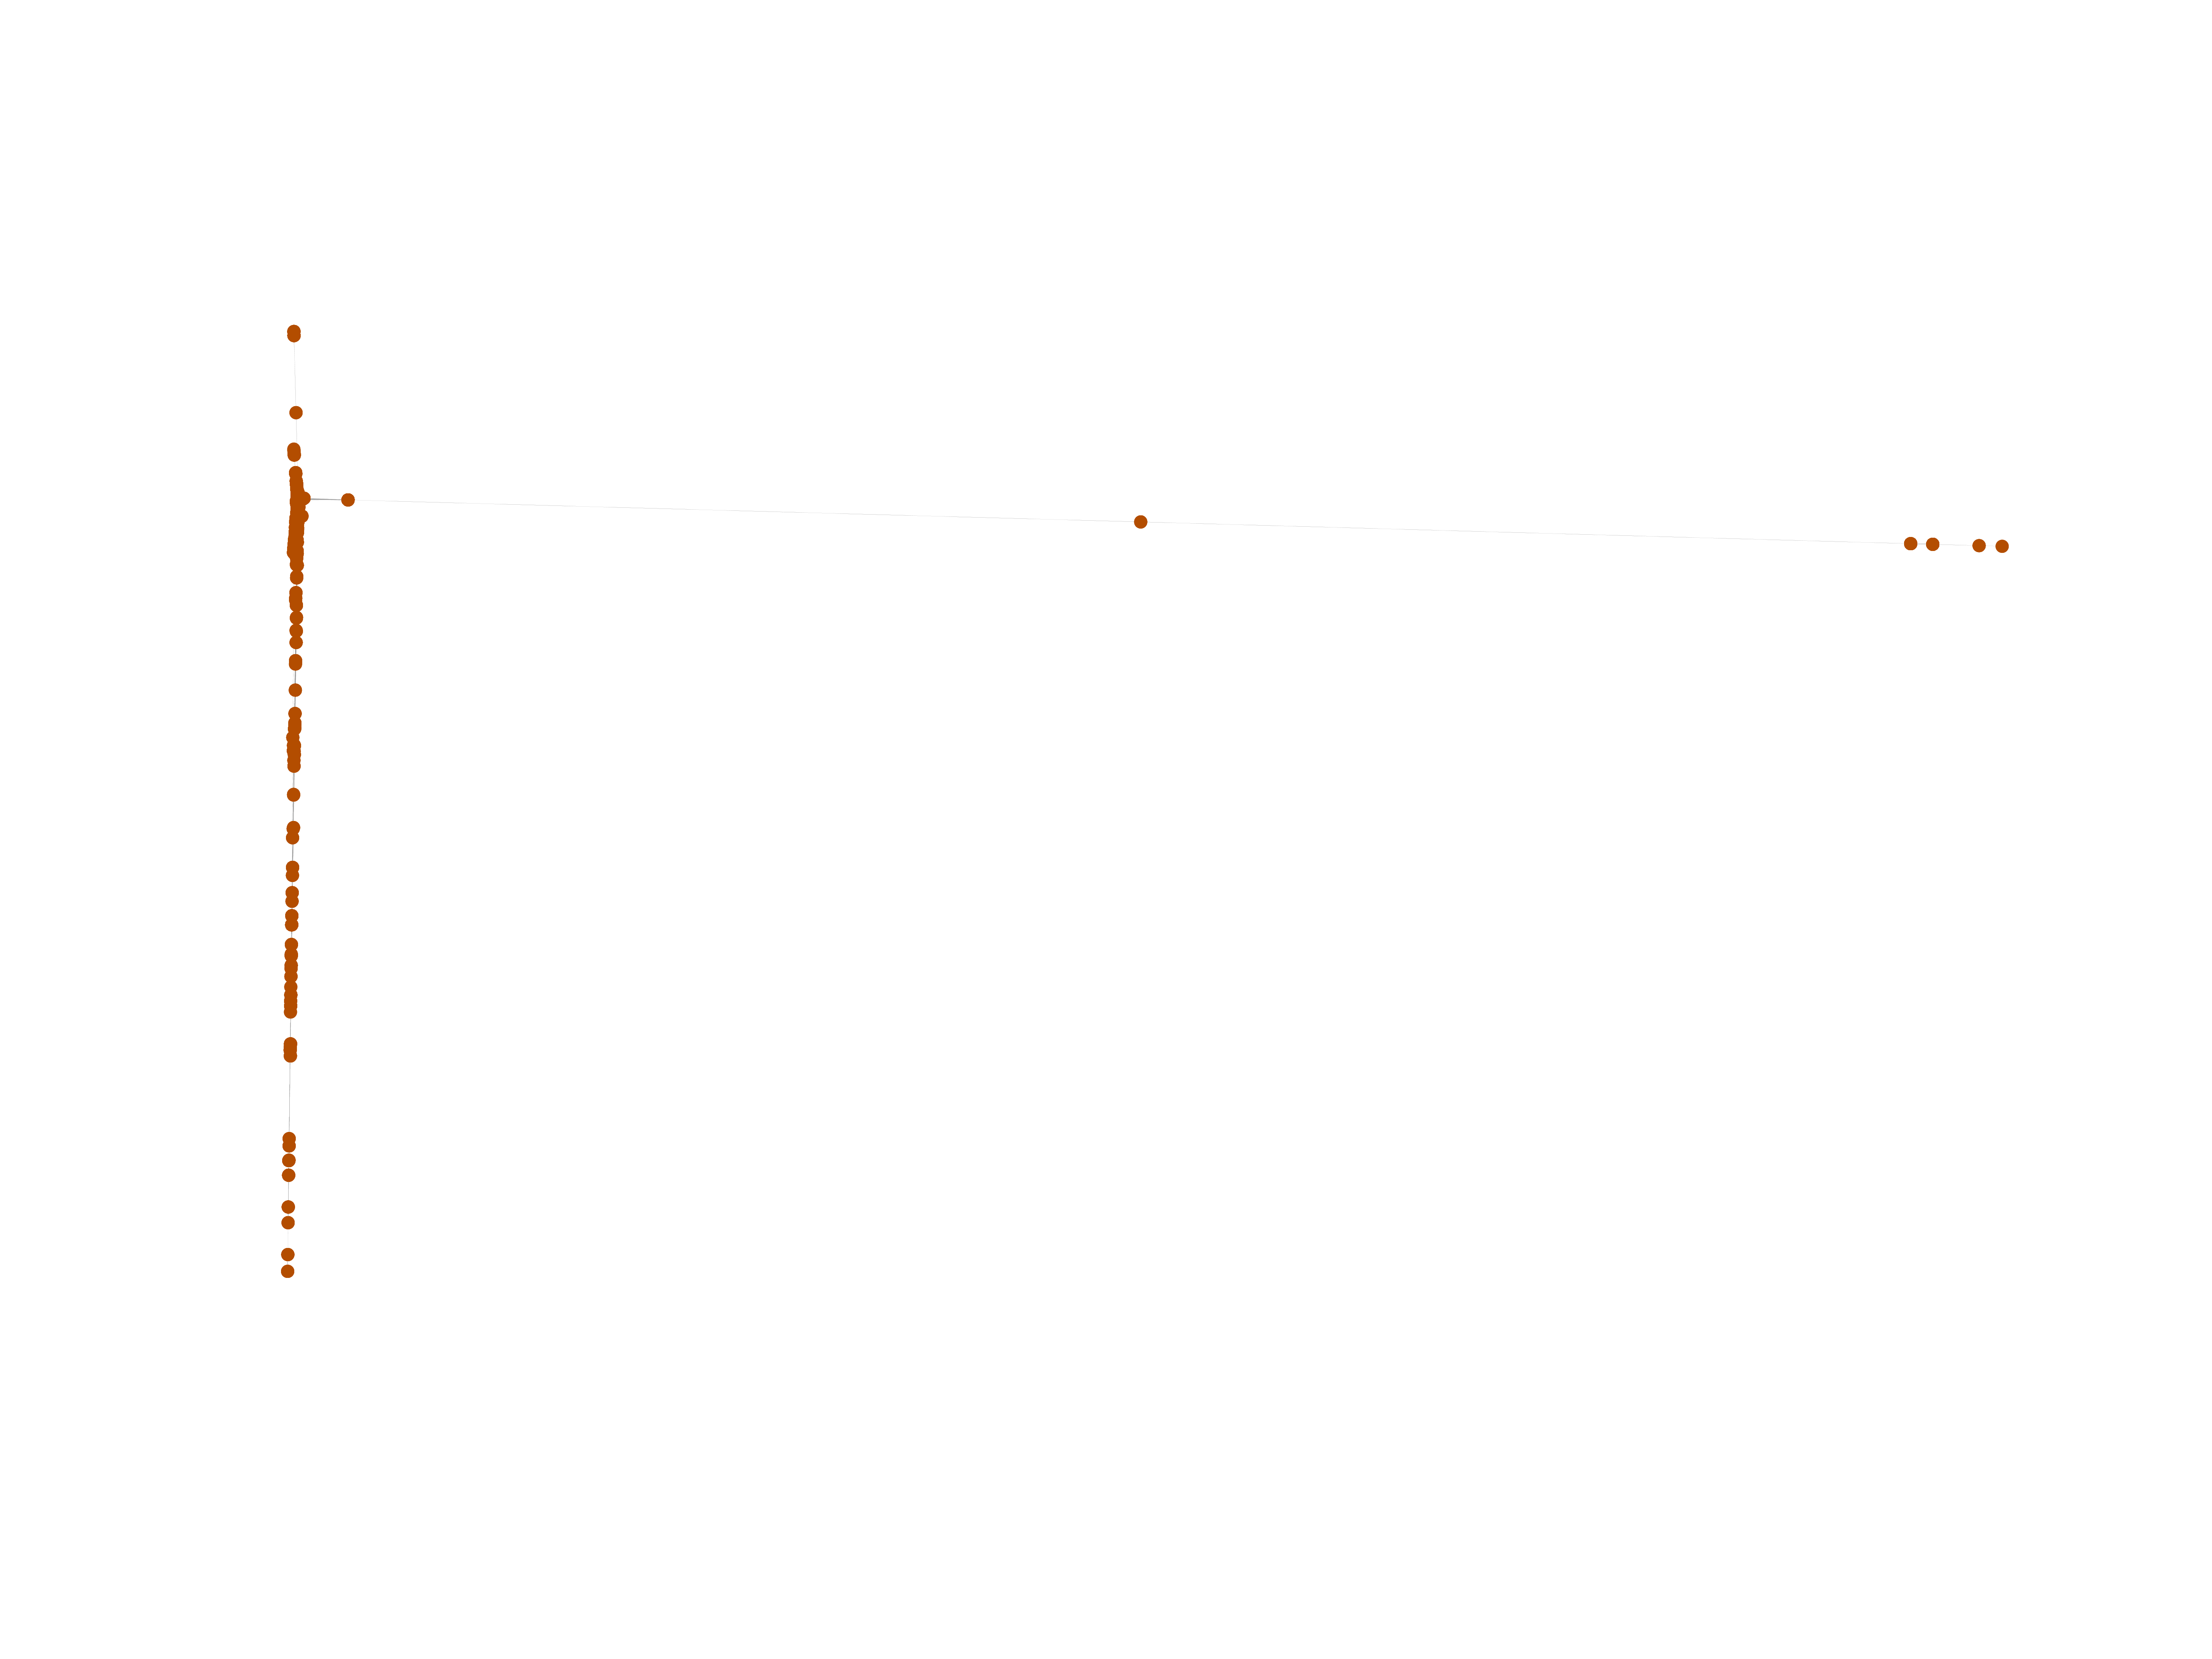
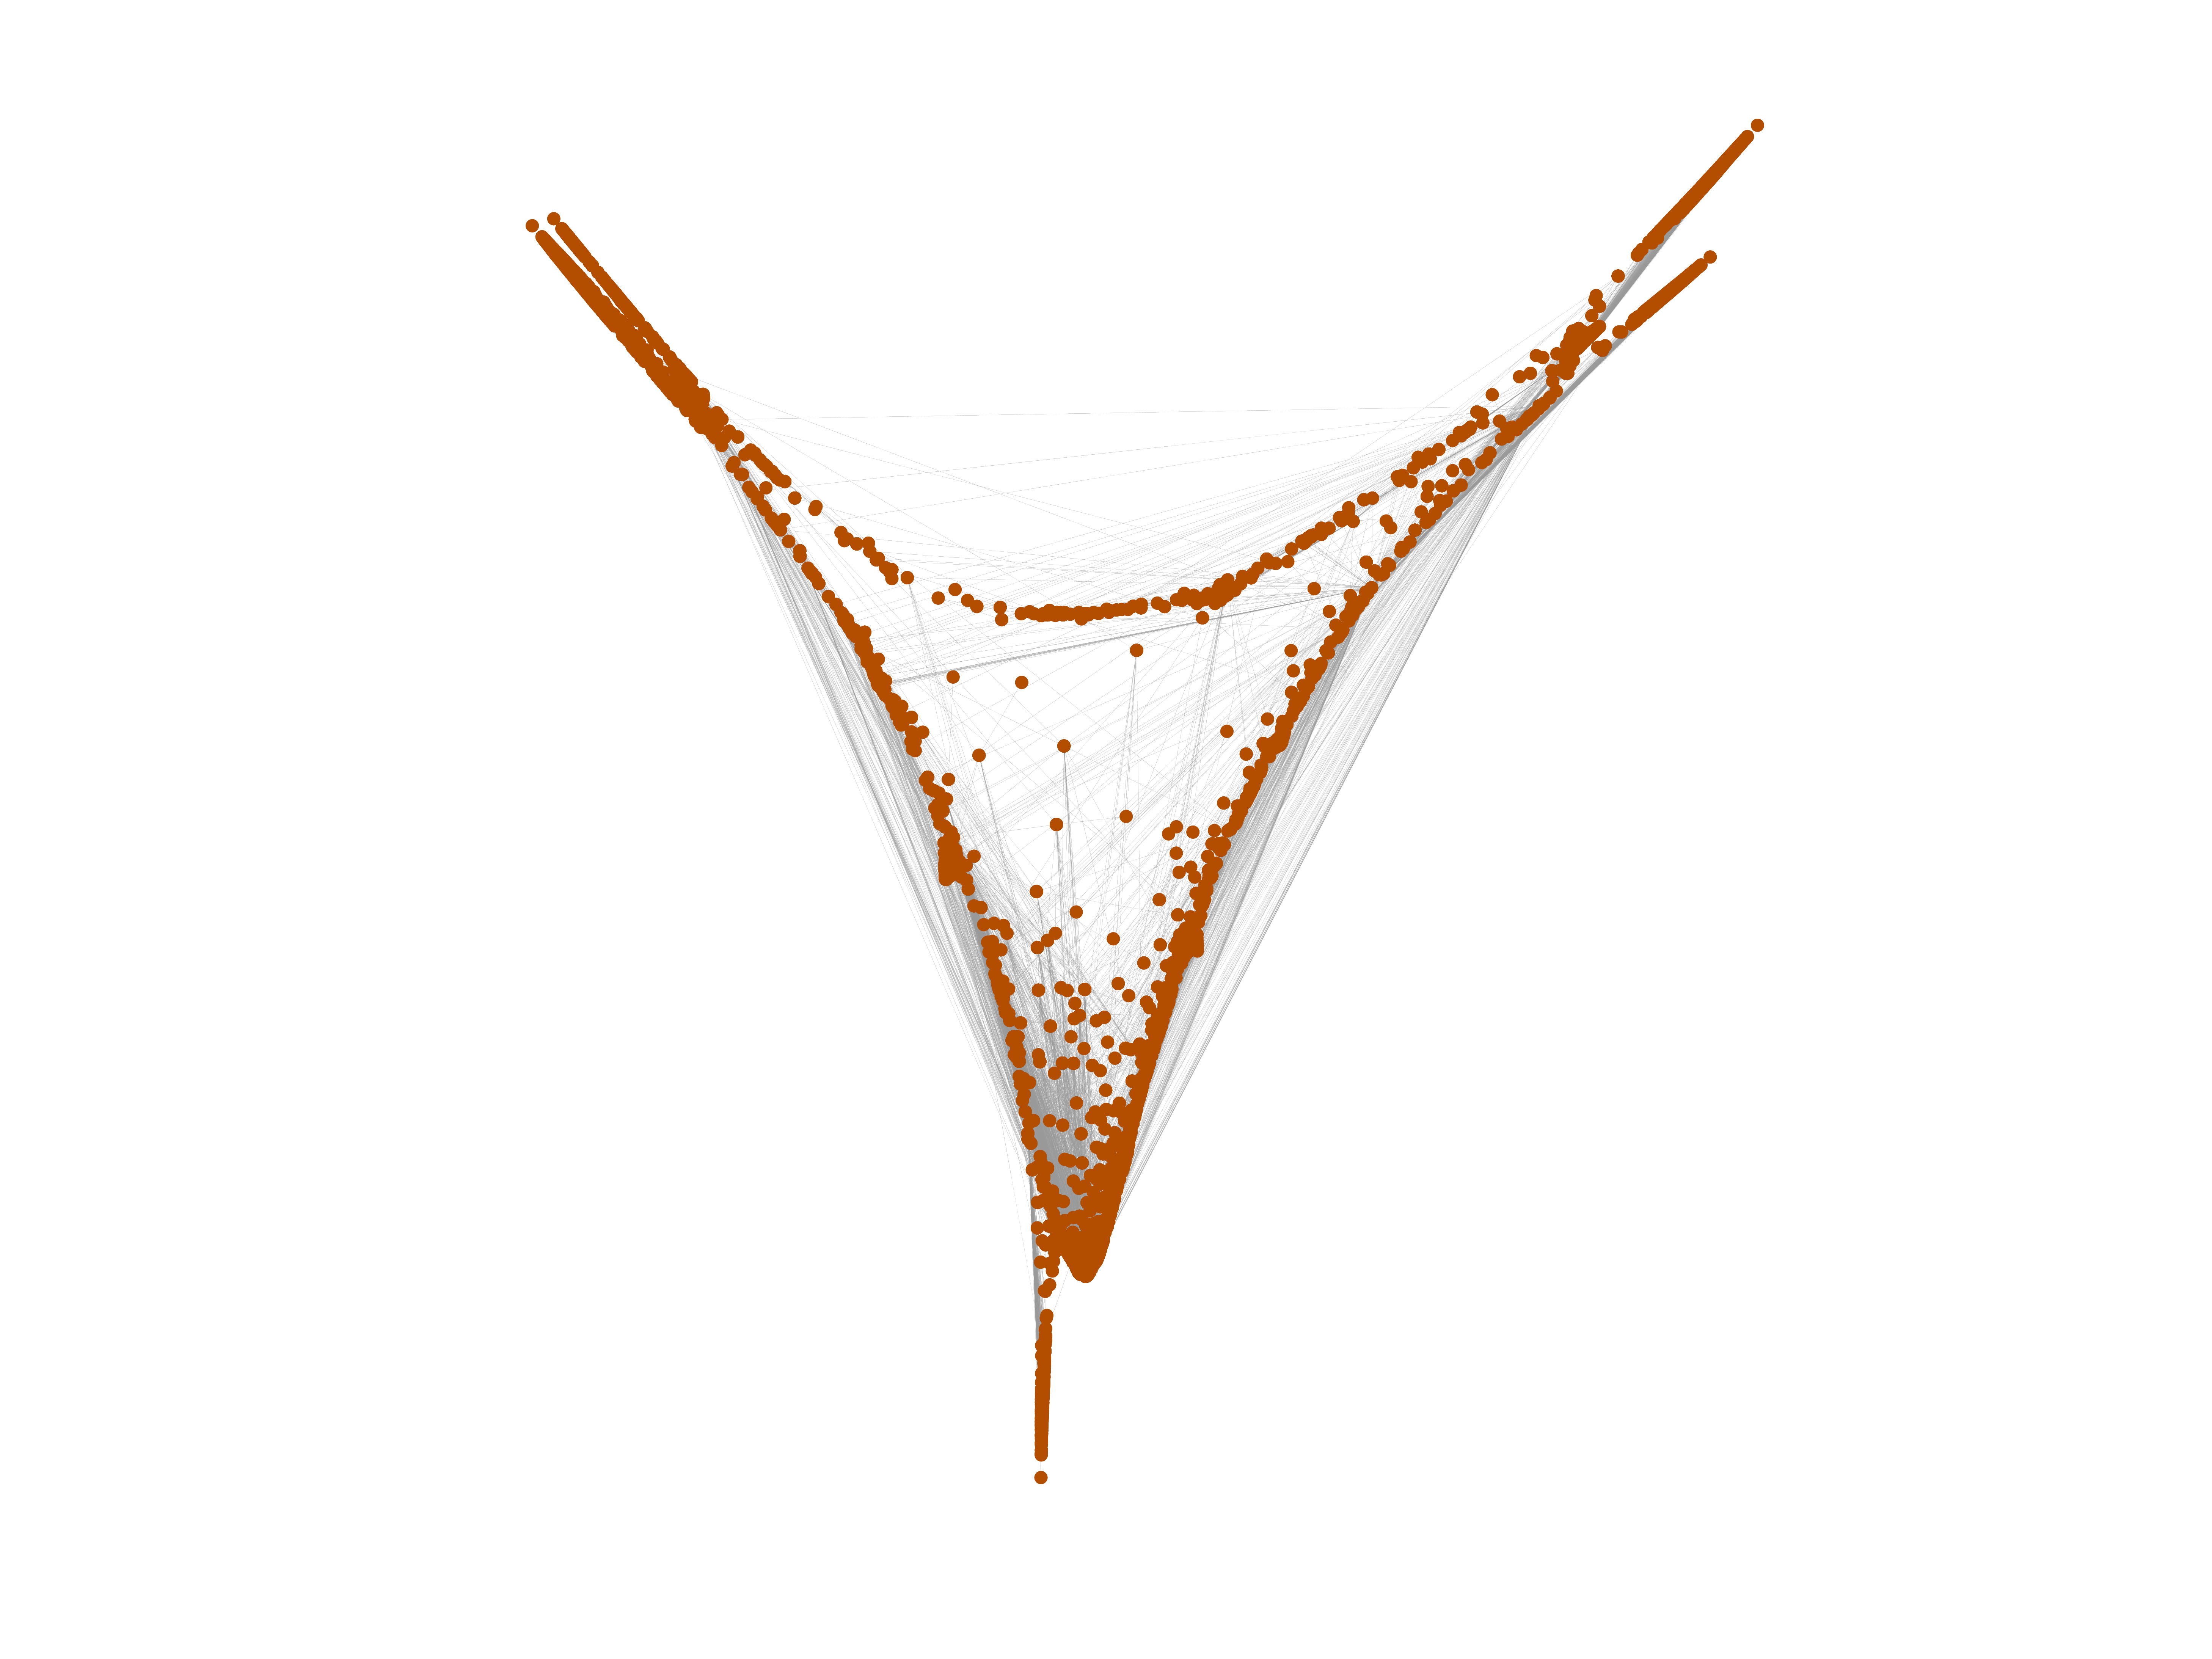
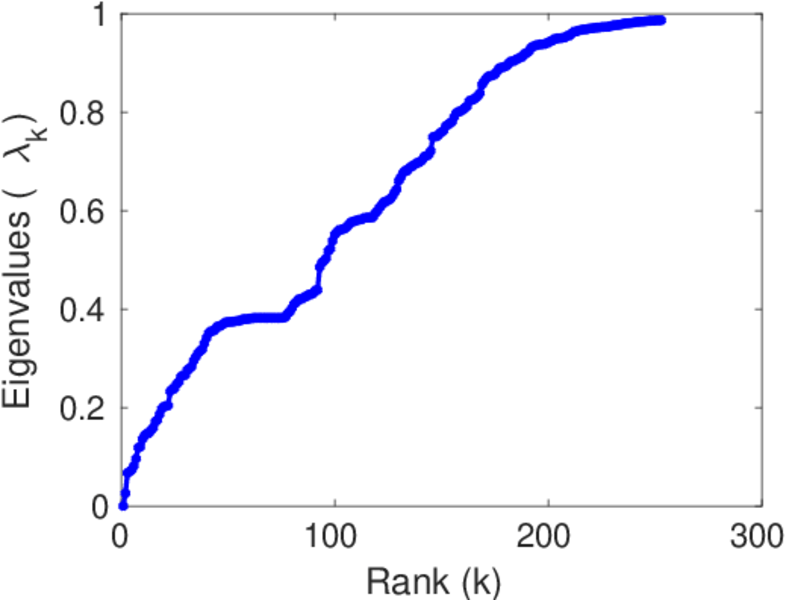
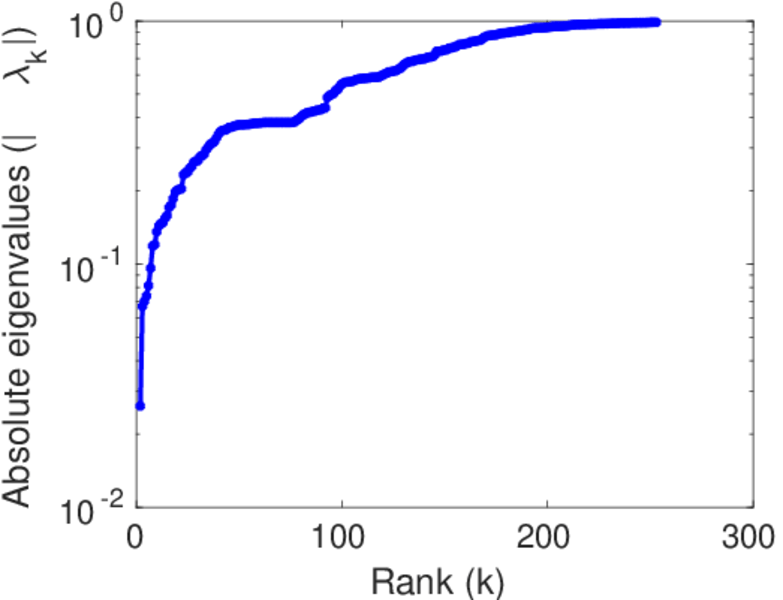
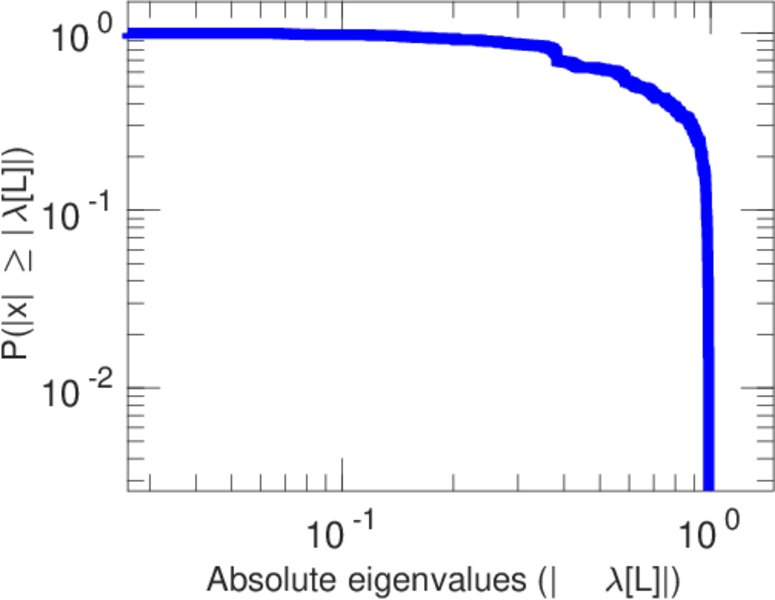
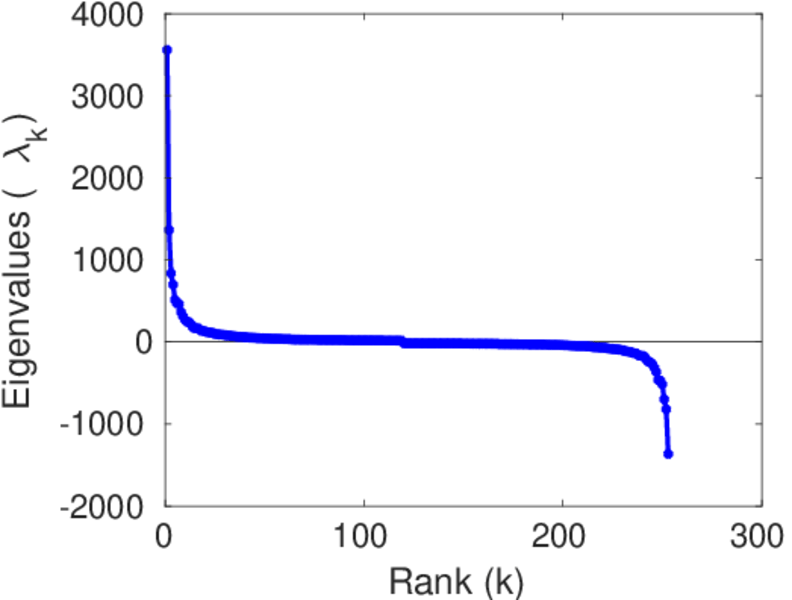
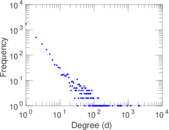
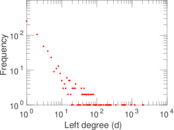
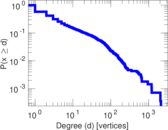
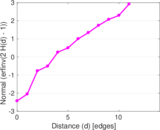
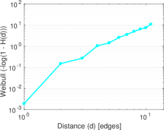
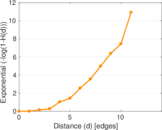
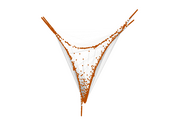
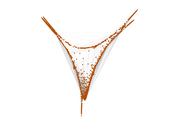
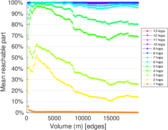
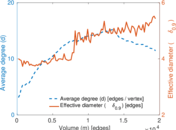
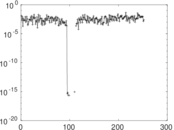
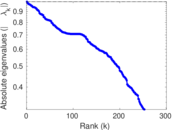
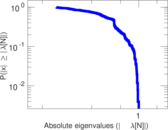
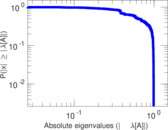
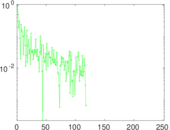
Plots


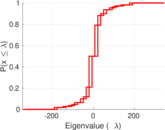
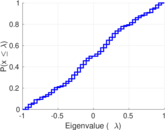


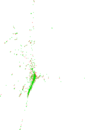


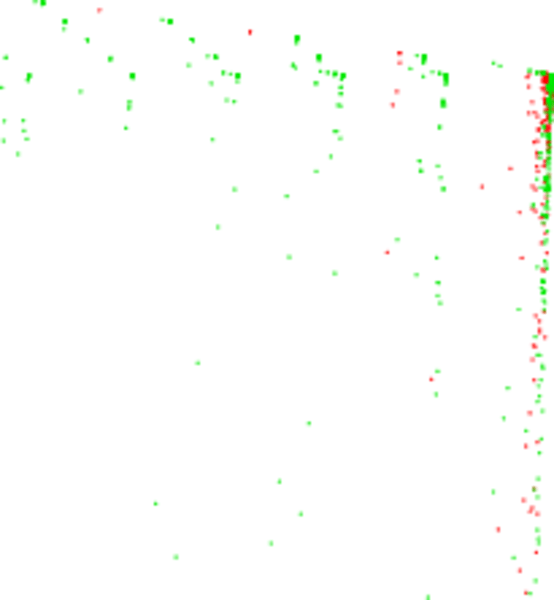
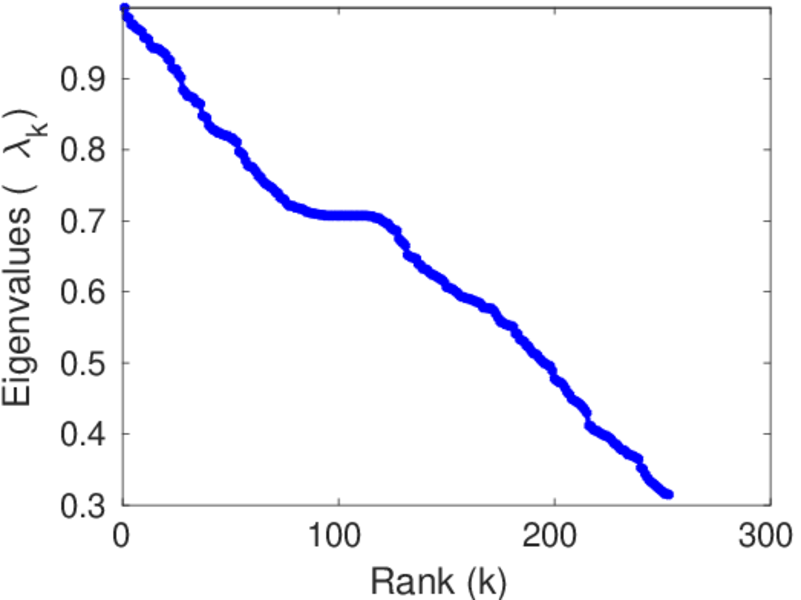
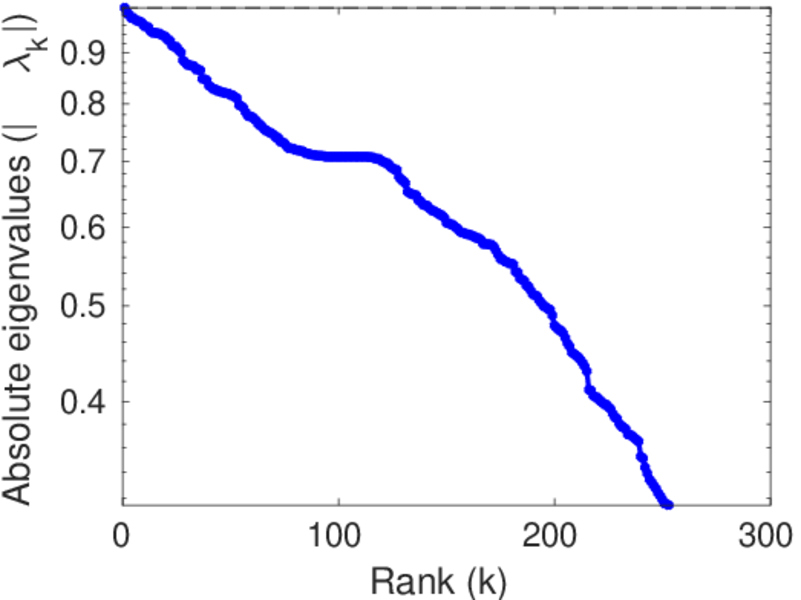
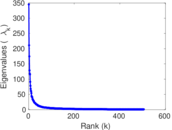
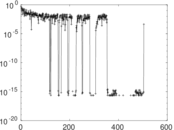
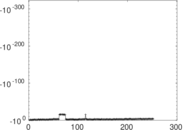
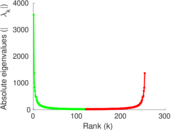
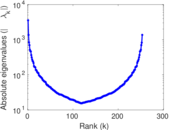
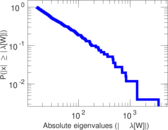
Matrix decompositions plots


Downloads
References
|
[1]
|
Jérôme Kunegis.
KONECT – The Koblenz Network Collection.
In Proc. Int. Conf. on World Wide Web Companion, pages
1343–1350, 2013.
[ http ]
|
|
[2]
|
Wikimedia Foundation.
Wikimedia downloads.
http://dumps.wikimedia.org/, January 2010.
|
 KONECT ‣ Networks ‣
Buy Me a Coffee
KONECT ‣ Networks ‣
Buy Me a Coffee